Veterinary Imaging Market By Product (Instrument, Reagent, Services, Veterinary PACS), By Animal Type (Small Companion Animals, Large Animals, Others), By Application (Orthopedics and Traumatology, Oncology, Cardiology, Neurology, Other), By End-use (Hospitals/Clinics, Reference Laboratories, Others), By Region And Companies - Industry Segment Outlook, Market Assessment, Competition Scenario, Trends, And Forecast 2023-2032
-
15854
-
May 2023
-
154
-


-
This report was compiled by Correspondence Linkedin | Detailed Market research Methodology Our methodology involves a mix of primary research, including interviews with leading mental health experts, and secondary research from reputable medical journals and databases. View Detailed Methodology Page
-
Quick Navigation
Report Overview
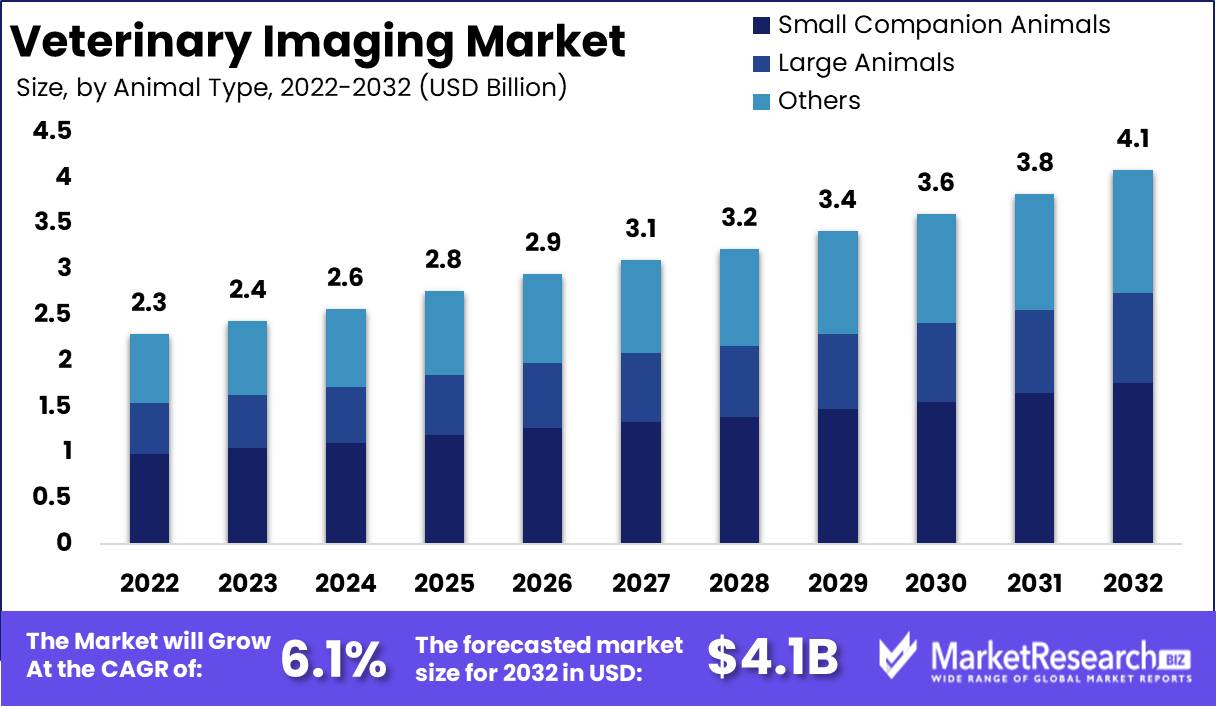
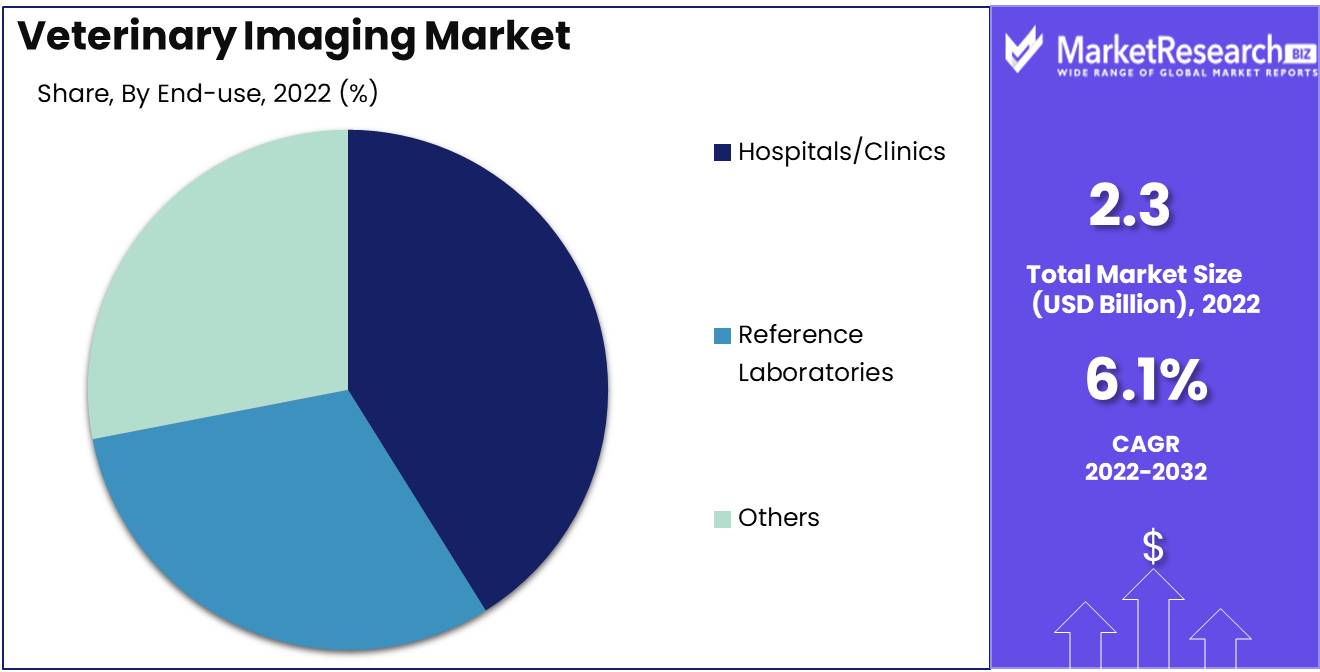
Veterinary Imaging Market size is expected to be worth around USD 4.1 Bn by 2032 from USD 2.3 Bn in 2022, growing at a CAGR of 6.1% during the forecast period from 2023 to 2032.
The veterinary imaging market has been fueled by a rising demand for innovative imaging services in the veterinary industry. The veterinary imaging market, delving deeply into its definition, objectives, significance, and benefits. In addition, we will investigate notable sector advancements, massive investments, and product and service integration. In addition, we will conduct an in-depth analysis of the market's expansion and applications, identify the industries that are investing in it, and deconstruct the key forces accelerating its growth. Ethical considerations and responsible use of veterinary imaging will also be discussed, with a strong emphasis on transparency, explicability, and accountability. In conclusion, we will discuss the diverse applications of veterinary imaging in the business world, thereby providing an exhaustive discussion of the topic.
The veterinary imaging market is a highly specialised discipline that focuses on the development and deployment of an extensive array of imaging technologies that cater to the medical requirements of animals. These cutting-edge technologies encompass a wide range of imaging modalities, including conventional X-rays, ultrasounds, CT scans, and MRI as well as highly sophisticated imaging techniques such as endoscopy and nuclear medicine. The primary objective of the veterinary imaging market is to provide definitive and accurate diagnoses of the various veterinary conditions that animals may experience, thereby facilitating effective and timely treatment.
The importance of veterinary imaging in diagnosing and treating animal health problems cannot be exaggerated. Without these imaging techniques, it is virtually impossible to diagnose and treat many animal conditions, resulting in unwarranted discomfort and suffering for animals. In addition, imaging technologies are indispensable in veterinary research and education, as the ability to visualise the internal structures of animals greatly improves scientists' knowledge of animal anatomy and physiology.
In recent years, the veterinary imaging industry has witnessed unprecedented levels of innovation, with enormous quantities invested in research and development. 3D imaging, which enables more precise and in-depth diagnoses of veterinary conditions, is one of the most ground-breaking and innovative techniques that have emerged. The use of artificial intelligence and machine learning algorithms to analyse and interpret imaging data, resulting in faster and more accurate diagnoses, is another remarkable innovation.
As with any medical procedure, the use of veterinary imaging involves ethical considerations. Utilising these technologies responsibly is crucial for ensuring the safety and comfort of animals undergoing these procedures. Transparency, explainability, and accountability are, therefore, of the utmost importance to ensure that animals are not subjected to superfluous imaging procedures and that the results of these procedures are utilised responsibly and judiciously.
Driving factors
Increasing Incidence of Chronic Illnesses in Companion Animals
The market for veterinary imaging is anticipated to experience substantial growth in the future years due to a number of positive factors. One of these factors is the escalating prevalence of chronic diseases in companion animals, which drives up demand for veterinary imaging systems. This field's technological advances have enabled the early detection of diseases, resulting in improved treatment outcomes and an overall improvement in animal health.
Increasing Pet Adoption and Expenditures for Their Healthcare
The increasing adoption of canines and rising expenditures on their healthcare also contribute significantly to the development of the veterinary imaging market. Pet owners are investing more in the health and well-being of their creatures, which is driving demand for sophisticated diagnostic and imaging equipment.
Technological Progresses
Innovations in veterinary imaging modalities also contribute to the expansion of the market. Computed tomography, magnetic resonance imaging, and ultrasound systems have revolutionised veterinary imaging, allowing for more precise diagnosis and treatment of animal diseases.
Increasing Demand for Food Products Derived from Animals
Increasing demand for food products derived from animals is also propelling the market for veterinary imaging. The increased demand for high-quality livestock, milk, and other animal products is causing animal farming and husbandry to employ advanced imaging techniques. This allows producers to identify and control diseases in their livestock, resulting in safer and higher quality food products.
Potential Effects of Regulation Amendments
On the regulatory front, regulatory alterations may have an impact on the veterinary imaging market. The implementation of stricter regulations regarding the use of ionising radiation in imaging instruments may have an effect on the market. With the development of non-ionizing radiation imaging instruments, however, the effect of such regulations is likely to be minimal.
Restraining Factors
Expensive veterinary imaging apparatus
The veterinary imaging equipment is an indispensable diagnostic and therapeutic instrument for animal healthcare professionals. However, the high cost of this apparatus makes it difficult for animal healthcare providers, particularly small or rural animal clinics, to invest in it. This is due to the fact that veterinary imaging equipment is technologically sophisticated and requires advanced engineering to produce, making it costly. To address this issue, companies are developing inexpensive imaging devices with high resolution.
Limited number of qualified personnel to operate imaging equipment
The veterinary imaging equipment is a complex device that requires the operation and interpretation of trained professionals. However, there is a shortage of qualified veterinary professionals, particularly in rural areas. This issue can result in incorrect image interpretations, leading to incorrect animal diagnoses and treatment plans. To address this problem, veterinary institutions must invest in education and training programmes to increase the industry's competent workforce.
Strict regulations for animal experimentation
Over the years, the regulatory framework governing animal research has become more stringent, particularly in developed nations. This issue has made it difficult to conduct animal testing studies, which are essential for the development of novel imaging technologies in veterinary medicine. Companies and research institutions are required to adhere to stringent regulations, which can be time-consuming and expensive, delaying the creation of novel imaging technologies for animals.
Radiation exposure risk during imaging procedures
When performing imaging procedures that involve the use of radiation, radiation exposure is a significant concern. The risk of radiation exposure extends to the personnel operating the apparatus, in addition to the animals. Cancer, skin burns, and tissue injury can be caused by prolonged exposure to radiation. Manufacturers of veterinary imaging equipment are developing equipment with low radiation doses to address this issue, assuring the safety of both animals and personnel.
By Product Analysis
The X-ray segment has dominated the veterinary imaging market for many years. The X-ray segment has been the most popular imaging modality due to its low cost, ease of operation, and pervasive use. Despite the availability of other imaging modalities such as MRI and CT scans, X-ray remains the most commonly used imaging modality in veterinary medicine.
The advantages of veterinary imaging, particularly X-ray imaging, are becoming increasingly apparent to consumers. They are more willing to spend money to assure the health and well-being of their pets and livestock. Additionally, they are more likely to pursue preventive care to ensure early disease detection and treatment.
The X-ray segment is anticipated to experience the highest growth rate in the coming years for a number of factors. First, the rising demand for animal healthcare services is anticipated to increase the use of X-ray imaging. X-ray imaging is becoming more efficient and accurate as a result of technological developments. The decreased cost of X-ray imaging should make it more accessible to a broader spectrum of customers.
By Animal Type Analysis
The market for veterinary imaging is dominated by the segment for Small companion animals. Greater demand exists for imaging services for Small companion animals, such as canines and cats, than for livestock. The expansion of the pet population has been the primary factor driving the expansion of the Small companion animals segment.
The rise of the middle class in emerging nations has contributed to the expansion of the Small companion animals market. As disposable incomes increase, consumers are increasingly inclined to spend money on their pets.
Consumers are increasingly considering their canines to be family members. They are more likely to pursue preventive care for their pets to ensure their health and wellbeing. In addition, they are more willing to invest in advanced veterinary services to ensure their pets receive the best care feasible.
The segment of Small companion animals is anticipated to experience the highest growth rate in the future years. The increasing pet population, the rise in consumer awareness of animal health and well-being, and the rise in consumer propensity to spend money on their pets are anticipated to drive the expansion of the Small companion animals segment.
By Application Analysis
The orthopaedics and traumatology segment is the market leader in veterinary imaging. Due to the high prevalence of orthopaedic and trauma-related injuries in animals, the segment is characterised by a high demand for imaging services.
Consumers' demand for orthopaedics and trauma-related imaging services for their animals is increasing. To ensure their animals receive the best possible care, they are more inclined to pay for advanced veterinary services. In addition, they are more likely to seek preventive care to assure early identification and treatment of orthopaedic and trauma-related injuries.
In the coming years, the orthopaedics and traumatology segment is anticipated to experience the highest growth rate due to the rising demand for advanced imaging services for orthopaedic and trauma-related injuries in animals. The expanding pet population and rising consumer awareness of animal healthcare are also anticipated to contribute to the segment's expansion.
By End User Analysis
The veterinary imaging market is dominated by the Hospitals/Clinics segment. Hospitals/Clinics offer the most extensive range of services and typically have the most advanced imaging technology. In addition, they are more likely to possess the skilled personnel required to operate the apparatus.
Consumers increasingly search out Hospitals/Clinics for animal healthcare services. To ensure their animals receive the best possible care, they are more inclined to pay for advanced veterinary services. In addition, they are more likely to seek preventive care to assure early disease detection and treatment.
In the future years, the sector of Hospitals/Clinics is anticipated to experience the highest growth rate. The expansion of the segment is anticipated to be fueled by the rising demand for animal healthcare services and the rising adoption of advanced imaging equipment.
Key Market Segments
By Product
- Instrument
- Radiography X-ray
-
-
- Direct (Capture) Radiography
- Computed Radiography
- Film-based Radiography
- Ultrasound Imaging
- 2D Ultrasound Imaging
- 3D/4D Ultrasound Imaging
- Doppler Imaging
- MRI
- CT Imaging
- Multi-slice CT
- Single-slice CT
- Video Endoscopy Imaging
- Others
-
- Reagent
- Ultrasound Contrast Regents
- MRI Contrast Regents
- X-Ray/CT Contrast Reagents
- Nuclear Imaging
- Services
- Interventional Radiology & Endoscopy
- Teleradiology
- Advanced Imaging Services
- Veterinary PACS
- RIS PACS
- CVIS PACS
By Animal Type
- Small Companion Animals
- Large Animals
- Others (Including Exotic Animals and Birds)
By Application
- Orthopedics and Traumatology
- Oncology
- Cardiology
- Neurology
- Other (dentistry & ophthalmology)
By End-use
- Hospitals/Clinics
- Reference Laboratories
- Others
Growth Opportunity
Demand for advanced imaging techniques in veterinary medicine is increasing.
Increasing demand for sophisticated imaging techniques, such as MRI and CT scans, is a significant growth driver for the veterinary imaging market. In veterinary medicine, these techniques enable more precise diagnoses and more effective treatment options. As demand for sophisticated imaging techniques continues to rise, the market for veterinary imaging is anticipated to experience substantial expansion.
Utilisation of Artificial Intelligence in Veterinary Imaging Growing
Increasing use of artificial intelligence in veterinary imaging enables veterinarians to make more precise diagnoses. As AI technology continues to advance, its use in veterinary imaging is likely to increase, driving the market for veterinary imaging to new heights.
Telemedicine's Emergence in Veterinary Practise
Telemedicine contributes to the expansion of the veterinary imaging market by enabling veterinarians to remotely consult with specialists and share images. This facilitates the delivery of specialised care to animals in need. As the prevalence of telemedicine continues to rise, the demand for veterinary imaging services is likely to rise as well.
Increasing Adoption of Imaging Devices at the Point-of-Care
The increasing adoption of point-of-care imaging devices also contributes to the expansion of the veterinary imaging market. These devices enable veterinarians to provide diagnostic imaging services in the field or in remote locations with greater speed and efficiency. As these devices become more accessible, the market for veterinary imaging is likely to experience substantial expansion.
Latest Trends
Digital Radiography Fuels Expansion.
Digital radiography is becoming increasingly prevalent in veterinary medicine due to its many advantages over traditional film radiography. These advantages include the creation of high-quality images with reduced radiation dosages, making it safer for both animals and technicians. Moreover, digital radiography provides images that can be readily enhanced or enlarged, facilitating the diagnosis and treatment of patients by veterinarians.
Combining Artificial Intelligence
Integration of artificial intelligence (AI) into veterinary imaging is an additional trend gathering momentum. AI can aid in the detection of subtle changes in images that the human eye might overlook, and it can also aid in the analysis of large datasets. It is possible to train AI algorithms to recognise specific features or anomalies in images, making diagnosis more rapid and accurate.
Transportable and Wireless Imaging Technology
In the veterinary profession, portable and wireless imaging equipment is gaining popularity, allowing imaging to be performed outside of the clinic. This is especially beneficial for veterinarians who treat large animals. Many portable devices have lower radiation doses and are easier to use than conventional imaging systems, making them an attractive alternative for many veterinary professionals.
Telemedicine and Its Consequences
Veterinarians can communicate with clients and other veterinarians remotely and transmit images for diagnosis and treatment thanks to telemedicine, which is rapidly acquiring popularity in veterinary practise. This technology has the potential to reduce costs and increase pet owners' access to veterinary care. This trend also affects the imaging market, as telemedicine permits remote imaging and specialist consultation.
Regional Analysis
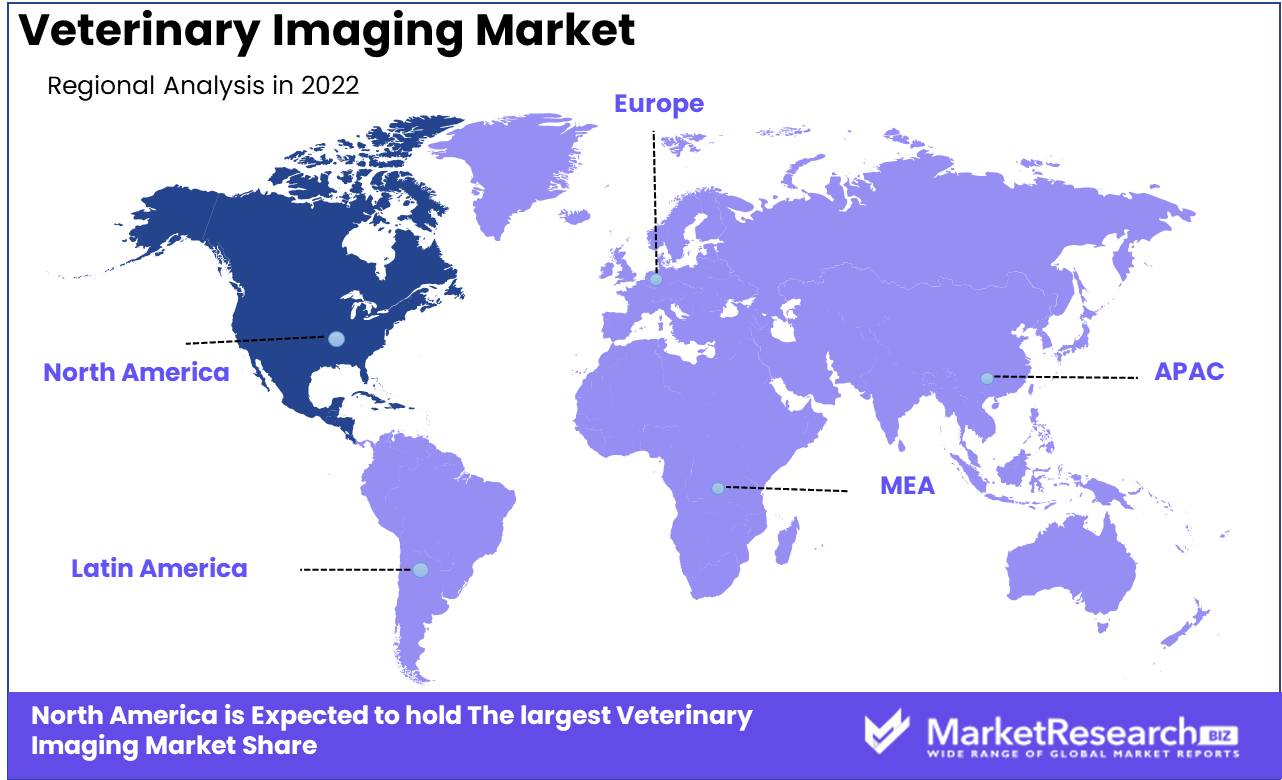
In North America, the veterinary industry is thriving as pet ownership rates continue to rise and more pet owners seek out high-quality treatment for their furry companions. Consequently, veterinary imaging technology has become an indispensable instrument for diagnosing and treating a variety of animal diseases and injuries. In fact, the North American veterinary imaging market is anticipated to be the largest in the world, owing to the presence of well-established veterinary hospitals and clinics, rising pet ownership, and rising awareness of pet healthcare.
Exploring the latest trends and developments in this industry in North America. We will examine the various varieties of veterinary imaging technology currently available, highlighting their distinctive characteristics and benefits. In addition, we will examine the leading participants in the North American veterinary imaging market, analysing their strengths, weaknesses, and growth strategies.
The market for veterinary imaging in North America is highly competitive, with a number of major competitors contending for market share. Here are some of the leading companies in this industry:
IDEXX Laboratories is a multinational corporation that provides veterinary practises with diagnostic and information technology solutions. The corporation provides a variety of diagnostic imaging systems, such as X-ray and ultrasound equipment.
GE Healthcare is a global leader in the provision of healthcare technology and solutions. The company's portfolio of veterinary imaging equipment includes ultrasound, X-ray, and CT machines.
Canon Medical Systems: Canon Medical Systems offers a variety of diagnostic imaging solutions, including ultrasound and CT equipment, for the veterinary market.
Carestream Health provides medical imaging technology and solutions to a variety of industries, including veterinary medicine. The company's product line for veterinary imaging includes X-ray and digital radiography apparatus.
Key Regions and Countries
North America
- US
- Canada
- Mexico
Western Europe
- Germany
- France
- The UK
- Spain
- Italy
- Portugal
- Ireland
- Austria
- Switzerland
- Benelux
- Nordic
- Rest of Western Europe
Eastern Europe
- Russia
- Poland
- The Czech Republic
- Greece
- Rest of Eastern Europe
APAC
- China
- Japan
- South Korea
- India
- Australia & New Zealand
- Indonesia
- Malaysia
- Philippines
- Singapore
- Thailand
- Vietnam
- Rest of APAC
Latin America
- Brazil
- Colombia
- Chile
- Argentina
- Costa Rica
- Rest of Latin America
Middle East & Africa
- Algeria
- Egypt
- Israel
- Kuwait
- Nigeria
- Saudi Arabia
- South Africa
- Turkey
- United Arab Emirates
- Rest of MEA
Key Players Analysis
The veterinary imaging market is a rapidly expanding market, fueled by rising pet ownership and technological advancements. Leading veterinary imaging equipment manufacturers, such as IDEXX Laboratories Inc, VCA Inc, Heska Corporation, and Fujifilm Holdings Corporation, dominate the market.
IDEXX Laboratories, Inc. is a global leader in veterinary diagnostics and imaging, offering digital radiography systems, ultrasound systems, and computed tomography (CT) imaging, among other imaging solutions. The company's flagship product, the IDEXX digital x-ray system, provides veterinarians with high-quality images in real-time, allowing them to diagnose and treat patients swiftly.
VCA Inc. is the foremost provider of veterinary care services, including imaging services. The company provides a variety of imaging modalities, such as ultrasonography, digital radiography, and CT imaging. The advanced imaging suite at VCA provides access to imaging services around-the-clock, enabling veterinarians to rapidly diagnose and treat patients.
Heska Corporation is a top provider of veterinary diagnostic equipment and services, specialising in in-clinic blood analyzers and imaging devices. The company provides various imaging modalities, such as digital radiography systems, ultrasound systems, and CT imaging.
Fujifilm Holdings Corporation is a global leader in the production of imaging and information technology products, including veterinary imaging instruments. The company provides an array of imaging solutions, such as digital radiography systems, ultrasound systems, and CT imaging. Fujifilm's sophisticated imaging solutions are tailored to the specific requirements of the veterinary industry, providing high-quality images and precise diagnostics.
Top Key Players in Veterinary Imaging Market
- DEXX Laboratories, Inc.
- GE Healthcare
- Carestream Health
- FUJIFILM Holdings America Corporation
- Esaote SpA
- VetZ Limited
- Hallmarq Veterinary Imaging Ltd
- SUNI Medical Imaging, Inc.
- Universal Medical Systems, Inc.
Recent Development
- 2023: GE Healthcare, a leading provider of medical imaging solutions, launched the Vetray 3D CT Scanner specifically tailored for use with animals. It provides high-resolution images designed to assist veterinarians with diagnosing and treating various ailments.
- 2022: IDEXX Laboratories, the global leader in veterinary testing, introduced its advanced imaging system, the Innovet ICR 5G. This revolutionary imaging solution provides veterinarians with high-resolution images and tools for diagnosing and treating an array of conditions.
- 2022: Antech Imaging, a leading veterinary imaging company, bought AKC Canine Health Foundation's (CHF) Canine Health Information Center (CHIC). This acquisition will allow Antech to expand its canine health diagnostic offerings.
- In 2021, Fujifilm Sonosite introduced the SonoSite PX, a POCUS veterinary ultrasound system designed for a wide range of veterinary applications.
Report Scope
Report Features Description Market Value (2022) USD 2.3 Bn Forecast Revenue (2032) USD 4.1 Bn CAGR (2023-2032) 6.1% Base Year for Estimation 2022 Historic Period 2016-2022 Forecast Period 2023-2032 Report Coverage Revenue Forecast, Market Dynamics, COVID-19 Impact, Competitive Landscape, Recent Developments Segments Covered By Product: Instrument, Reagent, Services, Veterinary PACS
By Animal Type: Small Companion Animals, Large Animals, Others (Including Exotic Animals and Birds)
By Application: Orthopedics and Traumatology, Oncology, Cardiology, Neurology, Other (dentistry & ophthalmology)
By End-use: Hospitals/Clinics, Reference Laboratories, OthersRegional Analysis North America – The US, Canada, & Mexico; Western Europe – Germany, France, The UK, Spain, Italy, Portugal, Ireland, Austria, Switzerland, Benelux, Nordic, & Rest of Western Europe; Eastern Europe – Russia, Poland, The Czech Republic, Greece, & Rest of Eastern Europe; APAC – China, Japan, South Korea, India, Australia & New Zealand, Indonesia, Malaysia, Philippines, Singapore, Thailand, Vietnam, & Rest of APAC; Latin America – Brazil, Colombia, Chile, Argentina, Costa Rica, & Rest of Latin America; Middle East & Africa – Algeria, Egypt, Israel, Kuwait, Nigeria, Saudi Arabia, South Africa, Turkey, United Arab Emirates, & Rest of MEA Competitive Landscape DEXX Laboratories, Inc., GE Healthcare, Carestream Health, FUJIFILM Holdings America Corporation, Esaote SpA, VetZ Limited, Hallmarq Veterinary Imaging Ltd, SUNI Medical Imaging, Inc., Universal Medical Systems, Inc. Customization Scope Customization for segments, region/country-level will be provided. Moreover, additional customization can be done based on the requirements. Purchase Options We have three licenses to opt for: Single User License, Multi-User License (Up to 5 Users), Corporate Use License (Unlimited User and Printable PDF) - Instrument
-
- 1. Executive Summary
- 1.1. Definition
- 1.2. Taxonomy
- 1.3. Research Scope
- 1.4. Key Analysis
- 1.5. Key Findings by Major Segments
- 1.6. Top strategies by Major Players
- 2. Global Veterinary Imaging Market Overview
- 2.1. Veterinary Imaging Market Dynamics
- 2.1.1. Drivers
- 2.1.2. Opportunities
- 2.1.3. Restraints
- 2.1.4. Challenges
- 2.2. Macro-economic Factors
- 2.3. Regulatory Framework
- 2.4. Market Investment Feasibility Index
- 2.5. PEST Analysis
- 2.6. PORTER’S Five Force Analysis
- 2.7. Drivers & Restraints Impact Analysis
- 2.8. Industry Chain Analysis
- 2.9. Cost Structure Analysis
- 2.10. Marketing Strategy
- 2.11. Russia-Ukraine War Impact Analysis
- 2.12. Opportunity Map Analysis
- 2.13. Market Competition Scenario Analysis
- 2.14. Product Life Cycle Analysis
- 2.15. Opportunity Orbits
- 2.16. Manufacturer Intensity Map
- 2.17. Major Companies sales by Value & Volume
- 2.1. Veterinary Imaging Market Dynamics
- 3. Global Veterinary Imaging Market Analysis, Opportunity and Forecast, 2016-2032
- 3.1. Global Veterinary Imaging Market Analysis, 2016-2021
- 3.2. Global Veterinary Imaging Market Opportunity and Forecast, 2023-2032
- 3.3. Global Veterinary Imaging Market Analysis, Opportunity and Forecast, By By Product, 2016-2032
- 3.3.1. Global Veterinary Imaging Market Analysis by By Product: Introduction
- 3.3.2. Market Size Absolute $ Opportunity Analysis and Forecast, By By Product, 2016-2032
- 3.3.3. Instrument
- 3.3.4. Reagent
- 3.3.5. Services
- 3.3.6. Veterinary PACS
- 3.4. Global Veterinary Imaging Market Analysis, Opportunity and Forecast, By By Animal Type, 2016-2032
- 3.4.1. Global Veterinary Imaging Market Analysis by By Animal Type: Introduction
- 3.4.2. Market Size Absolute $ Opportunity Analysis and Forecast, By By Animal Type, 2016-2032
- 3.4.3. Small Companion Animals
- 3.4.4. Large Animals
- 3.4.5. Others (Including Exotic Animals and Birds)
- 3.5. Global Veterinary Imaging Market Analysis, Opportunity and Forecast, By By Application, 2016-2032
- 3.5.1. Global Veterinary Imaging Market Analysis by By Application: Introduction
- 3.5.2. Market Size Absolute $ Opportunity Analysis and Forecast, By By Application, 2016-2032
- 3.5.3. Orthopedics and Traumatology
- 3.5.4. Oncology
- 3.5.5. Cardiology
- 3.5.6. Neurology
- 3.5.7. Other (dentistry & ophthalmology)
- 3.6. Global Veterinary Imaging Market Analysis, Opportunity and Forecast, By By End-use, 2016-2032
- 3.6.1. Global Veterinary Imaging Market Analysis by By End-use: Introduction
- 3.6.2. Market Size Absolute $ Opportunity Analysis and Forecast, By By End-use, 2016-2032
- 3.6.3. Hospitals/Clinics
- 3.6.4. Reference Laboratories
- 3.6.5. Others
- 4. North America Veterinary Imaging Market Analysis, Opportunity and Forecast, 2016-2032
- 4.1. North America Veterinary Imaging Market Analysis, 2016-2021
- 4.2. North America Veterinary Imaging Market Opportunity and Forecast, 2023-2032
- 4.3. North America Veterinary Imaging Market Analysis, Opportunity and Forecast, By By Product, 2016-2032
- 4.3.1. North America Veterinary Imaging Market Analysis by By Product: Introduction
- 4.3.2. Market Size Absolute $ Opportunity Analysis and Forecast, By By Product, 2016-2032
- 4.3.3. Instrument
- 4.3.4. Reagent
- 4.3.5. Services
- 4.3.6. Veterinary PACS
- 4.4. North America Veterinary Imaging Market Analysis, Opportunity and Forecast, By By Animal Type, 2016-2032
- 4.4.1. North America Veterinary Imaging Market Analysis by By Animal Type: Introduction
- 4.4.2. Market Size Absolute $ Opportunity Analysis and Forecast, By By Animal Type, 2016-2032
- 4.4.3. Small Companion Animals
- 4.4.4. Large Animals
- 4.4.5. Others (Including Exotic Animals and Birds)
- 4.5. North America Veterinary Imaging Market Analysis, Opportunity and Forecast, By By Application, 2016-2032
- 4.5.1. North America Veterinary Imaging Market Analysis by By Application: Introduction
- 4.5.2. Market Size Absolute $ Opportunity Analysis and Forecast, By By Application, 2016-2032
- 4.5.3. Orthopedics and Traumatology
- 4.5.4. Oncology
- 4.5.5. Cardiology
- 4.5.6. Neurology
- 4.5.7. Other (dentistry & ophthalmology)
- 4.6. North America Veterinary Imaging Market Analysis, Opportunity and Forecast, By By End-use, 2016-2032
- 4.6.1. North America Veterinary Imaging Market Analysis by By End-use: Introduction
- 4.6.2. Market Size Absolute $ Opportunity Analysis and Forecast, By By End-use, 2016-2032
- 4.6.3. Hospitals/Clinics
- 4.6.4. Reference Laboratories
- 4.6.5. Others
- 4.7. North America Veterinary Imaging Market Analysis, Opportunity and Forecast, By Country , 2016-2032
- 4.7.1. North America Veterinary Imaging Market Analysis by Country : Introduction
- 4.7.2. Market Size Absolute $ Opportunity Analysis and Forecast, Country , 2016-2032
- 4.7.2.1. The US
- 4.7.2.2. Canada
- 4.7.2.3. Mexico
- 5. Western Europe Veterinary Imaging Market Analysis, Opportunity and Forecast, 2016-2032
- 5.1. Western Europe Veterinary Imaging Market Analysis, 2016-2021
- 5.2. Western Europe Veterinary Imaging Market Opportunity and Forecast, 2023-2032
- 5.3. Western Europe Veterinary Imaging Market Analysis, Opportunity and Forecast, By By Product, 2016-2032
- 5.3.1. Western Europe Veterinary Imaging Market Analysis by By Product: Introduction
- 5.3.2. Market Size Absolute $ Opportunity Analysis and Forecast, By By Product, 2016-2032
- 5.3.3. Instrument
- 5.3.4. Reagent
- 5.3.5. Services
- 5.3.6. Veterinary PACS
- 5.4. Western Europe Veterinary Imaging Market Analysis, Opportunity and Forecast, By By Animal Type, 2016-2032
- 5.4.1. Western Europe Veterinary Imaging Market Analysis by By Animal Type: Introduction
- 5.4.2. Market Size Absolute $ Opportunity Analysis and Forecast, By By Animal Type, 2016-2032
- 5.4.3. Small Companion Animals
- 5.4.4. Large Animals
- 5.4.5. Others (Including Exotic Animals and Birds)
- 5.5. Western Europe Veterinary Imaging Market Analysis, Opportunity and Forecast, By By Application, 2016-2032
- 5.5.1. Western Europe Veterinary Imaging Market Analysis by By Application: Introduction
- 5.5.2. Market Size Absolute $ Opportunity Analysis and Forecast, By By Application, 2016-2032
- 5.5.3. Orthopedics and Traumatology
- 5.5.4. Oncology
- 5.5.5. Cardiology
- 5.5.6. Neurology
- 5.5.7. Other (dentistry & ophthalmology)
- 5.6. Western Europe Veterinary Imaging Market Analysis, Opportunity and Forecast, By By End-use, 2016-2032
- 5.6.1. Western Europe Veterinary Imaging Market Analysis by By End-use: Introduction
- 5.6.2. Market Size Absolute $ Opportunity Analysis and Forecast, By By End-use, 2016-2032
- 5.6.3. Hospitals/Clinics
- 5.6.4. Reference Laboratories
- 5.6.5. Others
- 5.7. Western Europe Veterinary Imaging Market Analysis, Opportunity and Forecast, By Country , 2016-2032
- 5.7.1. Western Europe Veterinary Imaging Market Analysis by Country : Introduction
- 5.7.2. Market Size Absolute $ Opportunity Analysis and Forecast, Country , 2016-2032
- 5.7.2.1. Germany
- 5.7.2.2. France
- 5.7.2.3. The UK
- 5.7.2.4. Spain
- 5.7.2.5. Italy
- 5.7.2.6. Portugal
- 5.7.2.7. Ireland
- 5.7.2.8. Austria
- 5.7.2.9. Switzerland
- 5.7.2.10. Benelux
- 5.7.2.11. Nordic
- 5.7.2.12. Rest of Western Europe
- 6. Eastern Europe Veterinary Imaging Market Analysis, Opportunity and Forecast, 2016-2032
- 6.1. Eastern Europe Veterinary Imaging Market Analysis, 2016-2021
- 6.2. Eastern Europe Veterinary Imaging Market Opportunity and Forecast, 2023-2032
- 6.3. Eastern Europe Veterinary Imaging Market Analysis, Opportunity and Forecast, By By Product, 2016-2032
- 6.3.1. Eastern Europe Veterinary Imaging Market Analysis by By Product: Introduction
- 6.3.2. Market Size Absolute $ Opportunity Analysis and Forecast, By By Product, 2016-2032
- 6.3.3. Instrument
- 6.3.4. Reagent
- 6.3.5. Services
- 6.3.6. Veterinary PACS
- 6.4. Eastern Europe Veterinary Imaging Market Analysis, Opportunity and Forecast, By By Animal Type, 2016-2032
- 6.4.1. Eastern Europe Veterinary Imaging Market Analysis by By Animal Type: Introduction
- 6.4.2. Market Size Absolute $ Opportunity Analysis and Forecast, By By Animal Type, 2016-2032
- 6.4.3. Small Companion Animals
- 6.4.4. Large Animals
- 6.4.5. Others (Including Exotic Animals and Birds)
- 6.5. Eastern Europe Veterinary Imaging Market Analysis, Opportunity and Forecast, By By Application, 2016-2032
- 6.5.1. Eastern Europe Veterinary Imaging Market Analysis by By Application: Introduction
- 6.5.2. Market Size Absolute $ Opportunity Analysis and Forecast, By By Application, 2016-2032
- 6.5.3. Orthopedics and Traumatology
- 6.5.4. Oncology
- 6.5.5. Cardiology
- 6.5.6. Neurology
- 6.5.7. Other (dentistry & ophthalmology)
- 6.6. Eastern Europe Veterinary Imaging Market Analysis, Opportunity and Forecast, By By End-use, 2016-2032
- 6.6.1. Eastern Europe Veterinary Imaging Market Analysis by By End-use: Introduction
- 6.6.2. Market Size Absolute $ Opportunity Analysis and Forecast, By By End-use, 2016-2032
- 6.6.3. Hospitals/Clinics
- 6.6.4. Reference Laboratories
- 6.6.5. Others
- 6.7. Eastern Europe Veterinary Imaging Market Analysis, Opportunity and Forecast, By Country , 2016-2032
- 6.7.1. Eastern Europe Veterinary Imaging Market Analysis by Country : Introduction
- 6.7.2. Market Size Absolute $ Opportunity Analysis and Forecast, Country , 2016-2032
- 6.7.2.1. Russia
- 6.7.2.2. Poland
- 6.7.2.3. The Czech Republic
- 6.7.2.4. Greece
- 6.7.2.5. Rest of Eastern Europe
- 7. APAC Veterinary Imaging Market Analysis, Opportunity and Forecast, 2016-2032
- 7.1. APAC Veterinary Imaging Market Analysis, 2016-2021
- 7.2. APAC Veterinary Imaging Market Opportunity and Forecast, 2023-2032
- 7.3. APAC Veterinary Imaging Market Analysis, Opportunity and Forecast, By By Product, 2016-2032
- 7.3.1. APAC Veterinary Imaging Market Analysis by By Product: Introduction
- 7.3.2. Market Size Absolute $ Opportunity Analysis and Forecast, By By Product, 2016-2032
- 7.3.3. Instrument
- 7.3.4. Reagent
- 7.3.5. Services
- 7.3.6. Veterinary PACS
- 7.4. APAC Veterinary Imaging Market Analysis, Opportunity and Forecast, By By Animal Type, 2016-2032
- 7.4.1. APAC Veterinary Imaging Market Analysis by By Animal Type: Introduction
- 7.4.2. Market Size Absolute $ Opportunity Analysis and Forecast, By By Animal Type, 2016-2032
- 7.4.3. Small Companion Animals
- 7.4.4. Large Animals
- 7.4.5. Others (Including Exotic Animals and Birds)
- 7.5. APAC Veterinary Imaging Market Analysis, Opportunity and Forecast, By By Application, 2016-2032
- 7.5.1. APAC Veterinary Imaging Market Analysis by By Application: Introduction
- 7.5.2. Market Size Absolute $ Opportunity Analysis and Forecast, By By Application, 2016-2032
- 7.5.3. Orthopedics and Traumatology
- 7.5.4. Oncology
- 7.5.5. Cardiology
- 7.5.6. Neurology
- 7.5.7. Other (dentistry & ophthalmology)
- 7.6. APAC Veterinary Imaging Market Analysis, Opportunity and Forecast, By By End-use, 2016-2032
- 7.6.1. APAC Veterinary Imaging Market Analysis by By End-use: Introduction
- 7.6.2. Market Size Absolute $ Opportunity Analysis and Forecast, By By End-use, 2016-2032
- 7.6.3. Hospitals/Clinics
- 7.6.4. Reference Laboratories
- 7.6.5. Others
- 7.7. APAC Veterinary Imaging Market Analysis, Opportunity and Forecast, By Country , 2016-2032
- 7.7.1. APAC Veterinary Imaging Market Analysis by Country : Introduction
- 7.7.2. Market Size Absolute $ Opportunity Analysis and Forecast, Country , 2016-2032
- 7.7.2.1. China
- 7.7.2.2. Japan
- 7.7.2.3. South Korea
- 7.7.2.4. India
- 7.7.2.5. Australia & New Zeland
- 7.7.2.6. Indonesia
- 7.7.2.7. Malaysia
- 7.7.2.8. Philippines
- 7.7.2.9. Singapore
- 7.7.2.10. Thailand
- 7.7.2.11. Vietnam
- 7.7.2.12. Rest of APAC
- 8. Latin America Veterinary Imaging Market Analysis, Opportunity and Forecast, 2016-2032
- 8.1. Latin America Veterinary Imaging Market Analysis, 2016-2021
- 8.2. Latin America Veterinary Imaging Market Opportunity and Forecast, 2023-2032
- 8.3. Latin America Veterinary Imaging Market Analysis, Opportunity and Forecast, By By Product, 2016-2032
- 8.3.1. Latin America Veterinary Imaging Market Analysis by By Product: Introduction
- 8.3.2. Market Size Absolute $ Opportunity Analysis and Forecast, By By Product, 2016-2032
- 8.3.3. Instrument
- 8.3.4. Reagent
- 8.3.5. Services
- 8.3.6. Veterinary PACS
- 8.4. Latin America Veterinary Imaging Market Analysis, Opportunity and Forecast, By By Animal Type, 2016-2032
- 8.4.1. Latin America Veterinary Imaging Market Analysis by By Animal Type: Introduction
- 8.4.2. Market Size Absolute $ Opportunity Analysis and Forecast, By By Animal Type, 2016-2032
- 8.4.3. Small Companion Animals
- 8.4.4. Large Animals
- 8.4.5. Others (Including Exotic Animals and Birds)
- 8.5. Latin America Veterinary Imaging Market Analysis, Opportunity and Forecast, By By Application, 2016-2032
- 8.5.1. Latin America Veterinary Imaging Market Analysis by By Application: Introduction
- 8.5.2. Market Size Absolute $ Opportunity Analysis and Forecast, By By Application, 2016-2032
- 8.5.3. Orthopedics and Traumatology
- 8.5.4. Oncology
- 8.5.5. Cardiology
- 8.5.6. Neurology
- 8.5.7. Other (dentistry & ophthalmology)
- 8.6. Latin America Veterinary Imaging Market Analysis, Opportunity and Forecast, By By End-use, 2016-2032
- 8.6.1. Latin America Veterinary Imaging Market Analysis by By End-use: Introduction
- 8.6.2. Market Size Absolute $ Opportunity Analysis and Forecast, By By End-use, 2016-2032
- 8.6.3. Hospitals/Clinics
- 8.6.4. Reference Laboratories
- 8.6.5. Others
- 8.7. Latin America Veterinary Imaging Market Analysis, Opportunity and Forecast, By Country , 2016-2032
- 8.7.1. Latin America Veterinary Imaging Market Analysis by Country : Introduction
- 8.7.2. Market Size Absolute $ Opportunity Analysis and Forecast, Country , 2016-2032
- 8.7.2.1. Brazil
- 8.7.2.2. Colombia
- 8.7.2.3. Chile
- 8.7.2.4. Argentina
- 8.7.2.5. Costa Rica
- 8.7.2.6. Rest of Latin America
- 9. Middle East & Africa Veterinary Imaging Market Analysis, Opportunity and Forecast, 2016-2032
- 9.1. Middle East & Africa Veterinary Imaging Market Analysis, 2016-2021
- 9.2. Middle East & Africa Veterinary Imaging Market Opportunity and Forecast, 2023-2032
- 9.3. Middle East & Africa Veterinary Imaging Market Analysis, Opportunity and Forecast, By By Product, 2016-2032
- 9.3.1. Middle East & Africa Veterinary Imaging Market Analysis by By Product: Introduction
- 9.3.2. Market Size Absolute $ Opportunity Analysis and Forecast, By By Product, 2016-2032
- 9.3.3. Instrument
- 9.3.4. Reagent
- 9.3.5. Services
- 9.3.6. Veterinary PACS
- 9.4. Middle East & Africa Veterinary Imaging Market Analysis, Opportunity and Forecast, By By Animal Type, 2016-2032
- 9.4.1. Middle East & Africa Veterinary Imaging Market Analysis by By Animal Type: Introduction
- 9.4.2. Market Size Absolute $ Opportunity Analysis and Forecast, By By Animal Type, 2016-2032
- 9.4.3. Small Companion Animals
- 9.4.4. Large Animals
- 9.4.5. Others (Including Exotic Animals and Birds)
- 9.5. Middle East & Africa Veterinary Imaging Market Analysis, Opportunity and Forecast, By By Application, 2016-2032
- 9.5.1. Middle East & Africa Veterinary Imaging Market Analysis by By Application: Introduction
- 9.5.2. Market Size Absolute $ Opportunity Analysis and Forecast, By By Application, 2016-2032
- 9.5.3. Orthopedics and Traumatology
- 9.5.4. Oncology
- 9.5.5. Cardiology
- 9.5.6. Neurology
- 9.5.7. Other (dentistry & ophthalmology)
- 9.6. Middle East & Africa Veterinary Imaging Market Analysis, Opportunity and Forecast, By By End-use, 2016-2032
- 9.6.1. Middle East & Africa Veterinary Imaging Market Analysis by By End-use: Introduction
- 9.6.2. Market Size Absolute $ Opportunity Analysis and Forecast, By By End-use, 2016-2032
- 9.6.3. Hospitals/Clinics
- 9.6.4. Reference Laboratories
- 9.6.5. Others
- 9.7. Middle East & Africa Veterinary Imaging Market Analysis, Opportunity and Forecast, By Country , 2016-2032
- 9.7.1. Middle East & Africa Veterinary Imaging Market Analysis by Country : Introduction
- 9.7.2. Market Size Absolute $ Opportunity Analysis and Forecast, Country , 2016-2032
- 9.7.2.1. Algeria
- 9.7.2.2. Egypt
- 9.7.2.3. Israel
- 9.7.2.4. Kuwait
- 9.7.2.5. Nigeria
- 9.7.2.6. Saudi Arabia
- 9.7.2.7. South Africa
- 9.7.2.8. Turkey
- 9.7.2.9. The UAE
- 9.7.2.10. Rest of MEA
- 10. Global Veterinary Imaging Market Analysis, Opportunity and Forecast, By Region , 2016-2032
- 10.1. Global Veterinary Imaging Market Analysis by Region : Introduction
- 10.2. Market Size Absolute $ Opportunity Analysis and Forecast, By Region , 2016-2032
- 10.2.1. North America
- 10.2.2. Western Europe
- 10.2.3. Eastern Europe
- 10.2.4. APAC
- 10.2.5. Latin America
- 10.2.6. Middle East & Africa
- 11. Global Veterinary Imaging Market Competitive Landscape, Market Share Analysis, and Company Profiles
- 11.1. Market Share Analysis
- 11.2. Company Profiles
- 11.3. DEXX Laboratories, Inc.
- 11.3.1. Company Overview
- 11.3.2. Financial Highlights
- 11.3.3. Product Portfolio
- 11.3.4. SWOT Analysis
- 11.3.5. Key Strategies and Developments
- 11.4. GE Healthcare
- 11.4.1. Company Overview
- 11.4.2. Financial Highlights
- 11.4.3. Product Portfolio
- 11.4.4. SWOT Analysis
- 11.4.5. Key Strategies and Developments
- 11.5. Carestream Health
- 11.5.1. Company Overview
- 11.5.2. Financial Highlights
- 11.5.3. Product Portfolio
- 11.5.4. SWOT Analysis
- 11.5.5. Key Strategies and Developments
- 11.6. FUJIFILM Holdings America Corporation
- 11.6.1. Company Overview
- 11.6.2. Financial Highlights
- 11.6.3. Product Portfolio
- 11.6.4. SWOT Analysis
- 11.6.5. Key Strategies and Developments
- 11.7. Esaote SpA
- 11.7.1. Company Overview
- 11.7.2. Financial Highlights
- 11.7.3. Product Portfolio
- 11.7.4. SWOT Analysis
- 11.7.5. Key Strategies and Developments
- 11.8. VetZ Limited
- 11.8.1. Company Overview
- 11.8.2. Financial Highlights
- 11.8.3. Product Portfolio
- 11.8.4. SWOT Analysis
- 11.8.5. Key Strategies and Developments
- 11.9. Hallmarq Veterinary Imaging Ltd
- 11.9.1. Company Overview
- 11.9.2. Financial Highlights
- 11.9.3. Product Portfolio
- 11.9.4. SWOT Analysis
- 11.9.5. Key Strategies and Developments
- 11.10. SUNI Medical Imaging, Inc.
- 11.10.1. Company Overview
- 11.10.2. Financial Highlights
- 11.10.3. Product Portfolio
- 11.10.4. SWOT Analysis
- 11.10.5. Key Strategies and Developments
- 11.11. Universal Medical Systems, Inc.
- 11.11.1. Company Overview
- 11.11.2. Financial Highlights
- 11.11.3. Product Portfolio
- 11.11.4. SWOT Analysis
- 11.11.5. Key Strategies and Developments
- 12. Assumptions and Acronyms
- 13. Research Methodology
- 14. Contact
- List of Figures
- Figure 1: Global Veterinary Imaging Market Revenue (US$ Mn) Market Share by By Product in 2022
- Figure 2: Global Veterinary Imaging Market Attractiveness Analysis by By Product, 2016-2032
- Figure 3: Global Veterinary Imaging Market Revenue (US$ Mn) Market Share by By Animal Typein 2022
- Figure 4: Global Veterinary Imaging Market Attractiveness Analysis by By Animal Type, 2016-2032
- Figure 5: Global Veterinary Imaging Market Revenue (US$ Mn) Market Share by By Applicationin 2022
- Figure 6: Global Veterinary Imaging Market Attractiveness Analysis by By Application, 2016-2032
- Figure 7: Global Veterinary Imaging Market Revenue (US$ Mn) Market Share by By End-usein 2022
- Figure 8: Global Veterinary Imaging Market Attractiveness Analysis by By End-use, 2016-2032
- Figure 9: Global Veterinary Imaging Market Revenue (US$ Mn) Market Share by Region in 2022
- Figure 10: Global Veterinary Imaging Market Attractiveness Analysis by Region, 2016-2032
- Figure 11: Global Veterinary Imaging Market Revenue (US$ Mn) (2016-2032)
- Figure 12: Global Veterinary Imaging Market Revenue (US$ Mn) Comparison by Region (2016-2032)
- Figure 13: Global Veterinary Imaging Market Revenue (US$ Mn) Comparison by By Product (2016-2032)
- Figure 14: Global Veterinary Imaging Market Revenue (US$ Mn) Comparison by By Animal Type (2016-2032)
- Figure 15: Global Veterinary Imaging Market Revenue (US$ Mn) Comparison by By Application (2016-2032)
- Figure 16: Global Veterinary Imaging Market Revenue (US$ Mn) Comparison by By End-use (2016-2032)
- Figure 17: Global Veterinary Imaging Market Y-o-Y Growth Rate Comparison by Region (2016-2032)
- Figure 18: Global Veterinary Imaging Market Y-o-Y Growth Rate Comparison by By Product (2016-2032)
- Figure 19: Global Veterinary Imaging Market Y-o-Y Growth Rate Comparison by By Animal Type (2016-2032)
- Figure 20: Global Veterinary Imaging Market Y-o-Y Growth Rate Comparison by By Application (2016-2032)
- Figure 21: Global Veterinary Imaging Market Y-o-Y Growth Rate Comparison by By End-use (2016-2032)
- Figure 22: Global Veterinary Imaging Market Share Comparison by Region (2016-2032)
- Figure 23: Global Veterinary Imaging Market Share Comparison by By Product (2016-2032)
- Figure 24: Global Veterinary Imaging Market Share Comparison by By Animal Type (2016-2032)
- Figure 25: Global Veterinary Imaging Market Share Comparison by By Application (2016-2032)
- Figure 26: Global Veterinary Imaging Market Share Comparison by By End-use (2016-2032)
- Figure 27: North America Veterinary Imaging Market Revenue (US$ Mn) Market Share by By Productin 2022
- Figure 28: North America Veterinary Imaging Market Attractiveness Analysis by By Product, 2016-2032
- Figure 29: North America Veterinary Imaging Market Revenue (US$ Mn) Market Share by By Animal Typein 2022
- Figure 30: North America Veterinary Imaging Market Attractiveness Analysis by By Animal Type, 2016-2032
- Figure 31: North America Veterinary Imaging Market Revenue (US$ Mn) Market Share by By Applicationin 2022
- Figure 32: North America Veterinary Imaging Market Attractiveness Analysis by By Application, 2016-2032
- Figure 33: North America Veterinary Imaging Market Revenue (US$ Mn) Market Share by By End-usein 2022
- Figure 34: North America Veterinary Imaging Market Attractiveness Analysis by By End-use, 2016-2032
- Figure 35: North America Veterinary Imaging Market Revenue (US$ Mn) Market Share by Country in 2022
- Figure 36: North America Veterinary Imaging Market Attractiveness Analysis by Country, 2016-2032
- Figure 37: North America Veterinary Imaging Market Revenue (US$ Mn) (2016-2032)
- Figure 38: North America Veterinary Imaging Market Revenue (US$ Mn) Comparison by Country (2016-2032)
- Figure 39: North America Veterinary Imaging Market Revenue (US$ Mn) Comparison by By Product (2016-2032)
- Figure 40: North America Veterinary Imaging Market Revenue (US$ Mn) Comparison by By Animal Type (2016-2032)
- Figure 41: North America Veterinary Imaging Market Revenue (US$ Mn) Comparison by By Application (2016-2032)
- Figure 42: North America Veterinary Imaging Market Revenue (US$ Mn) Comparison by By End-use (2016-2032)
- Figure 43: North America Veterinary Imaging Market Y-o-Y Growth Rate Comparison by Country (2016-2032)
- Figure 44: North America Veterinary Imaging Market Y-o-Y Growth Rate Comparison by By Product (2016-2032)
- Figure 45: North America Veterinary Imaging Market Y-o-Y Growth Rate Comparison by By Animal Type (2016-2032)
- Figure 46: North America Veterinary Imaging Market Y-o-Y Growth Rate Comparison by By Application (2016-2032)
- Figure 47: North America Veterinary Imaging Market Y-o-Y Growth Rate Comparison by By End-use (2016-2032)
- Figure 48: North America Veterinary Imaging Market Share Comparison by Country (2016-2032)
- Figure 49: North America Veterinary Imaging Market Share Comparison by By Product (2016-2032)
- Figure 50: North America Veterinary Imaging Market Share Comparison by By Animal Type (2016-2032)
- Figure 51: North America Veterinary Imaging Market Share Comparison by By Application (2016-2032)
- Figure 52: North America Veterinary Imaging Market Share Comparison by By End-use (2016-2032)
- Figure 53: Western Europe Veterinary Imaging Market Revenue (US$ Mn) Market Share by By Productin 2022
- Figure 54: Western Europe Veterinary Imaging Market Attractiveness Analysis by By Product, 2016-2032
- Figure 55: Western Europe Veterinary Imaging Market Revenue (US$ Mn) Market Share by By Animal Typein 2022
- Figure 56: Western Europe Veterinary Imaging Market Attractiveness Analysis by By Animal Type, 2016-2032
- Figure 57: Western Europe Veterinary Imaging Market Revenue (US$ Mn) Market Share by By Applicationin 2022
- Figure 58: Western Europe Veterinary Imaging Market Attractiveness Analysis by By Application, 2016-2032
- Figure 59: Western Europe Veterinary Imaging Market Revenue (US$ Mn) Market Share by By End-usein 2022
- Figure 60: Western Europe Veterinary Imaging Market Attractiveness Analysis by By End-use, 2016-2032
- Figure 61: Western Europe Veterinary Imaging Market Revenue (US$ Mn) Market Share by Country in 2022
- Figure 62: Western Europe Veterinary Imaging Market Attractiveness Analysis by Country, 2016-2032
- Figure 63: Western Europe Veterinary Imaging Market Revenue (US$ Mn) (2016-2032)
- Figure 64: Western Europe Veterinary Imaging Market Revenue (US$ Mn) Comparison by Country (2016-2032)
- Figure 65: Western Europe Veterinary Imaging Market Revenue (US$ Mn) Comparison by By Product (2016-2032)
- Figure 66: Western Europe Veterinary Imaging Market Revenue (US$ Mn) Comparison by By Animal Type (2016-2032)
- Figure 67: Western Europe Veterinary Imaging Market Revenue (US$ Mn) Comparison by By Application (2016-2032)
- Figure 68: Western Europe Veterinary Imaging Market Revenue (US$ Mn) Comparison by By End-use (2016-2032)
- Figure 69: Western Europe Veterinary Imaging Market Y-o-Y Growth Rate Comparison by Country (2016-2032)
- Figure 70: Western Europe Veterinary Imaging Market Y-o-Y Growth Rate Comparison by By Product (2016-2032)
- Figure 71: Western Europe Veterinary Imaging Market Y-o-Y Growth Rate Comparison by By Animal Type (2016-2032)
- Figure 72: Western Europe Veterinary Imaging Market Y-o-Y Growth Rate Comparison by By Application (2016-2032)
- Figure 73: Western Europe Veterinary Imaging Market Y-o-Y Growth Rate Comparison by By End-use (2016-2032)
- Figure 74: Western Europe Veterinary Imaging Market Share Comparison by Country (2016-2032)
- Figure 75: Western Europe Veterinary Imaging Market Share Comparison by By Product (2016-2032)
- Figure 76: Western Europe Veterinary Imaging Market Share Comparison by By Animal Type (2016-2032)
- Figure 77: Western Europe Veterinary Imaging Market Share Comparison by By Application (2016-2032)
- Figure 78: Western Europe Veterinary Imaging Market Share Comparison by By End-use (2016-2032)
- Figure 79: Eastern Europe Veterinary Imaging Market Revenue (US$ Mn) Market Share by By Productin 2022
- Figure 80: Eastern Europe Veterinary Imaging Market Attractiveness Analysis by By Product, 2016-2032
- Figure 81: Eastern Europe Veterinary Imaging Market Revenue (US$ Mn) Market Share by By Animal Typein 2022
- Figure 82: Eastern Europe Veterinary Imaging Market Attractiveness Analysis by By Animal Type, 2016-2032
- Figure 83: Eastern Europe Veterinary Imaging Market Revenue (US$ Mn) Market Share by By Applicationin 2022
- Figure 84: Eastern Europe Veterinary Imaging Market Attractiveness Analysis by By Application, 2016-2032
- Figure 85: Eastern Europe Veterinary Imaging Market Revenue (US$ Mn) Market Share by By End-usein 2022
- Figure 86: Eastern Europe Veterinary Imaging Market Attractiveness Analysis by By End-use, 2016-2032
- Figure 87: Eastern Europe Veterinary Imaging Market Revenue (US$ Mn) Market Share by Country in 2022
- Figure 88: Eastern Europe Veterinary Imaging Market Attractiveness Analysis by Country, 2016-2032
- Figure 89: Eastern Europe Veterinary Imaging Market Revenue (US$ Mn) (2016-2032)
- Figure 90: Eastern Europe Veterinary Imaging Market Revenue (US$ Mn) Comparison by Country (2016-2032)
- Figure 91: Eastern Europe Veterinary Imaging Market Revenue (US$ Mn) Comparison by By Product (2016-2032)
- Figure 92: Eastern Europe Veterinary Imaging Market Revenue (US$ Mn) Comparison by By Animal Type (2016-2032)
- Figure 93: Eastern Europe Veterinary Imaging Market Revenue (US$ Mn) Comparison by By Application (2016-2032)
- Figure 94: Eastern Europe Veterinary Imaging Market Revenue (US$ Mn) Comparison by By End-use (2016-2032)
- Figure 95: Eastern Europe Veterinary Imaging Market Y-o-Y Growth Rate Comparison by Country (2016-2032)
- Figure 96: Eastern Europe Veterinary Imaging Market Y-o-Y Growth Rate Comparison by By Product (2016-2032)
- Figure 97: Eastern Europe Veterinary Imaging Market Y-o-Y Growth Rate Comparison by By Animal Type (2016-2032)
- Figure 98: Eastern Europe Veterinary Imaging Market Y-o-Y Growth Rate Comparison by By Application (2016-2032)
- Figure 99: Eastern Europe Veterinary Imaging Market Y-o-Y Growth Rate Comparison by By End-use (2016-2032)
- Figure 100: Eastern Europe Veterinary Imaging Market Share Comparison by Country (2016-2032)
- Figure 101: Eastern Europe Veterinary Imaging Market Share Comparison by By Product (2016-2032)
- Figure 102: Eastern Europe Veterinary Imaging Market Share Comparison by By Animal Type (2016-2032)
- Figure 103: Eastern Europe Veterinary Imaging Market Share Comparison by By Application (2016-2032)
- Figure 104: Eastern Europe Veterinary Imaging Market Share Comparison by By End-use (2016-2032)
- Figure 105: APAC Veterinary Imaging Market Revenue (US$ Mn) Market Share by By Productin 2022
- Figure 106: APAC Veterinary Imaging Market Attractiveness Analysis by By Product, 2016-2032
- Figure 107: APAC Veterinary Imaging Market Revenue (US$ Mn) Market Share by By Animal Typein 2022
- Figure 108: APAC Veterinary Imaging Market Attractiveness Analysis by By Animal Type, 2016-2032
- Figure 109: APAC Veterinary Imaging Market Revenue (US$ Mn) Market Share by By Applicationin 2022
- Figure 110: APAC Veterinary Imaging Market Attractiveness Analysis by By Application, 2016-2032
- Figure 111: APAC Veterinary Imaging Market Revenue (US$ Mn) Market Share by By End-usein 2022
- Figure 112: APAC Veterinary Imaging Market Attractiveness Analysis by By End-use, 2016-2032
- Figure 113: APAC Veterinary Imaging Market Revenue (US$ Mn) Market Share by Country in 2022
- Figure 114: APAC Veterinary Imaging Market Attractiveness Analysis by Country, 2016-2032
- Figure 115: APAC Veterinary Imaging Market Revenue (US$ Mn) (2016-2032)
- Figure 116: APAC Veterinary Imaging Market Revenue (US$ Mn) Comparison by Country (2016-2032)
- Figure 117: APAC Veterinary Imaging Market Revenue (US$ Mn) Comparison by By Product (2016-2032)
- Figure 118: APAC Veterinary Imaging Market Revenue (US$ Mn) Comparison by By Animal Type (2016-2032)
- Figure 119: APAC Veterinary Imaging Market Revenue (US$ Mn) Comparison by By Application (2016-2032)
- Figure 120: APAC Veterinary Imaging Market Revenue (US$ Mn) Comparison by By End-use (2016-2032)
- Figure 121: APAC Veterinary Imaging Market Y-o-Y Growth Rate Comparison by Country (2016-2032)
- Figure 122: APAC Veterinary Imaging Market Y-o-Y Growth Rate Comparison by By Product (2016-2032)
- Figure 123: APAC Veterinary Imaging Market Y-o-Y Growth Rate Comparison by By Animal Type (2016-2032)
- Figure 124: APAC Veterinary Imaging Market Y-o-Y Growth Rate Comparison by By Application (2016-2032)
- Figure 125: APAC Veterinary Imaging Market Y-o-Y Growth Rate Comparison by By End-use (2016-2032)
- Figure 126: APAC Veterinary Imaging Market Share Comparison by Country (2016-2032)
- Figure 127: APAC Veterinary Imaging Market Share Comparison by By Product (2016-2032)
- Figure 128: APAC Veterinary Imaging Market Share Comparison by By Animal Type (2016-2032)
- Figure 129: APAC Veterinary Imaging Market Share Comparison by By Application (2016-2032)
- Figure 130: APAC Veterinary Imaging Market Share Comparison by By End-use (2016-2032)
- Figure 131: Latin America Veterinary Imaging Market Revenue (US$ Mn) Market Share by By Productin 2022
- Figure 132: Latin America Veterinary Imaging Market Attractiveness Analysis by By Product, 2016-2032
- Figure 133: Latin America Veterinary Imaging Market Revenue (US$ Mn) Market Share by By Animal Typein 2022
- Figure 134: Latin America Veterinary Imaging Market Attractiveness Analysis by By Animal Type, 2016-2032
- Figure 135: Latin America Veterinary Imaging Market Revenue (US$ Mn) Market Share by By Applicationin 2022
- Figure 136: Latin America Veterinary Imaging Market Attractiveness Analysis by By Application, 2016-2032
- Figure 137: Latin America Veterinary Imaging Market Revenue (US$ Mn) Market Share by By End-usein 2022
- Figure 138: Latin America Veterinary Imaging Market Attractiveness Analysis by By End-use, 2016-2032
- Figure 139: Latin America Veterinary Imaging Market Revenue (US$ Mn) Market Share by Country in 2022
- Figure 140: Latin America Veterinary Imaging Market Attractiveness Analysis by Country, 2016-2032
- Figure 141: Latin America Veterinary Imaging Market Revenue (US$ Mn) (2016-2032)
- Figure 142: Latin America Veterinary Imaging Market Revenue (US$ Mn) Comparison by Country (2016-2032)
- Figure 143: Latin America Veterinary Imaging Market Revenue (US$ Mn) Comparison by By Product (2016-2032)
- Figure 144: Latin America Veterinary Imaging Market Revenue (US$ Mn) Comparison by By Animal Type (2016-2032)
- Figure 145: Latin America Veterinary Imaging Market Revenue (US$ Mn) Comparison by By Application (2016-2032)
- Figure 146: Latin America Veterinary Imaging Market Revenue (US$ Mn) Comparison by By End-use (2016-2032)
- Figure 147: Latin America Veterinary Imaging Market Y-o-Y Growth Rate Comparison by Country (2016-2032)
- Figure 148: Latin America Veterinary Imaging Market Y-o-Y Growth Rate Comparison by By Product (2016-2032)
- Figure 149: Latin America Veterinary Imaging Market Y-o-Y Growth Rate Comparison by By Animal Type (2016-2032)
- Figure 150: Latin America Veterinary Imaging Market Y-o-Y Growth Rate Comparison by By Application (2016-2032)
- Figure 151: Latin America Veterinary Imaging Market Y-o-Y Growth Rate Comparison by By End-use (2016-2032)
- Figure 152: Latin America Veterinary Imaging Market Share Comparison by Country (2016-2032)
- Figure 153: Latin America Veterinary Imaging Market Share Comparison by By Product (2016-2032)
- Figure 154: Latin America Veterinary Imaging Market Share Comparison by By Animal Type (2016-2032)
- Figure 155: Latin America Veterinary Imaging Market Share Comparison by By Application (2016-2032)
- Figure 156: Latin America Veterinary Imaging Market Share Comparison by By End-use (2016-2032)
- Figure 157: Middle East & Africa Veterinary Imaging Market Revenue (US$ Mn) Market Share by By Productin 2022
- Figure 158: Middle East & Africa Veterinary Imaging Market Attractiveness Analysis by By Product, 2016-2032
- Figure 159: Middle East & Africa Veterinary Imaging Market Revenue (US$ Mn) Market Share by By Animal Typein 2022
- Figure 160: Middle East & Africa Veterinary Imaging Market Attractiveness Analysis by By Animal Type, 2016-2032
- Figure 161: Middle East & Africa Veterinary Imaging Market Revenue (US$ Mn) Market Share by By Applicationin 2022
- Figure 162: Middle East & Africa Veterinary Imaging Market Attractiveness Analysis by By Application, 2016-2032
- Figure 163: Middle East & Africa Veterinary Imaging Market Revenue (US$ Mn) Market Share by By End-usein 2022
- Figure 164: Middle East & Africa Veterinary Imaging Market Attractiveness Analysis by By End-use, 2016-2032
- Figure 165: Middle East & Africa Veterinary Imaging Market Revenue (US$ Mn) Market Share by Country in 2022
- Figure 166: Middle East & Africa Veterinary Imaging Market Attractiveness Analysis by Country, 2016-2032
- Figure 167: Middle East & Africa Veterinary Imaging Market Revenue (US$ Mn) (2016-2032)
- Figure 168: Middle East & Africa Veterinary Imaging Market Revenue (US$ Mn) Comparison by Country (2016-2032)
- Figure 169: Middle East & Africa Veterinary Imaging Market Revenue (US$ Mn) Comparison by By Product (2016-2032)
- Figure 170: Middle East & Africa Veterinary Imaging Market Revenue (US$ Mn) Comparison by By Animal Type (2016-2032)
- Figure 171: Middle East & Africa Veterinary Imaging Market Revenue (US$ Mn) Comparison by By Application (2016-2032)
- Figure 172: Middle East & Africa Veterinary Imaging Market Revenue (US$ Mn) Comparison by By End-use (2016-2032)
- Figure 173: Middle East & Africa Veterinary Imaging Market Y-o-Y Growth Rate Comparison by Country (2016-2032)
- Figure 174: Middle East & Africa Veterinary Imaging Market Y-o-Y Growth Rate Comparison by By Product (2016-2032)
- Figure 175: Middle East & Africa Veterinary Imaging Market Y-o-Y Growth Rate Comparison by By Animal Type (2016-2032)
- Figure 176: Middle East & Africa Veterinary Imaging Market Y-o-Y Growth Rate Comparison by By Application (2016-2032)
- Figure 177: Middle East & Africa Veterinary Imaging Market Y-o-Y Growth Rate Comparison by By End-use (2016-2032)
- Figure 178: Middle East & Africa Veterinary Imaging Market Share Comparison by Country (2016-2032)
- Figure 179: Middle East & Africa Veterinary Imaging Market Share Comparison by By Product (2016-2032)
- Figure 180: Middle East & Africa Veterinary Imaging Market Share Comparison by By Animal Type (2016-2032)
- Figure 181: Middle East & Africa Veterinary Imaging Market Share Comparison by By Application (2016-2032)
- Figure 182: Middle East & Africa Veterinary Imaging Market Share Comparison by By End-use (2016-2032)
- List of Tables
- Table 1: Global Veterinary Imaging Market Comparison by By Product (2016-2032)
- Table 2: Global Veterinary Imaging Market Comparison by By Animal Type (2016-2032)
- Table 3: Global Veterinary Imaging Market Comparison by By Application (2016-2032)
- Table 4: Global Veterinary Imaging Market Comparison by By End-use (2016-2032)
- Table 5: Global Veterinary Imaging Market Revenue (US$ Mn) Comparison by Region (2016-2032)
- Table 6: Global Veterinary Imaging Market Revenue (US$ Mn) (2016-2032)
- Table 7: Global Veterinary Imaging Market Revenue (US$ Mn) Comparison by Region (2016-2032)
- Table 8: Global Veterinary Imaging Market Revenue (US$ Mn) Comparison by By Product (2016-2032)
- Table 9: Global Veterinary Imaging Market Revenue (US$ Mn) Comparison by By Animal Type (2016-2032)
- Table 10: Global Veterinary Imaging Market Revenue (US$ Mn) Comparison by By Application (2016-2032)
- Table 11: Global Veterinary Imaging Market Revenue (US$ Mn) Comparison by By End-use (2016-2032)
- Table 12: Global Veterinary Imaging Market Y-o-Y Growth Rate Comparison by Region (2016-2032)
- Table 13: Global Veterinary Imaging Market Y-o-Y Growth Rate Comparison by By Product (2016-2032)
- Table 14: Global Veterinary Imaging Market Y-o-Y Growth Rate Comparison by By Animal Type (2016-2032)
- Table 15: Global Veterinary Imaging Market Y-o-Y Growth Rate Comparison by By Application (2016-2032)
- Table 16: Global Veterinary Imaging Market Y-o-Y Growth Rate Comparison by By End-use (2016-2032)
- Table 17: Global Veterinary Imaging Market Share Comparison by Region (2016-2032)
- Table 18: Global Veterinary Imaging Market Share Comparison by By Product (2016-2032)
- Table 19: Global Veterinary Imaging Market Share Comparison by By Animal Type (2016-2032)
- Table 20: Global Veterinary Imaging Market Share Comparison by By Application (2016-2032)
- Table 21: Global Veterinary Imaging Market Share Comparison by By End-use (2016-2032)
- Table 22: North America Veterinary Imaging Market Comparison by By Animal Type (2016-2032)
- Table 23: North America Veterinary Imaging Market Comparison by By Application (2016-2032)
- Table 24: North America Veterinary Imaging Market Comparison by By End-use (2016-2032)
- Table 25: North America Veterinary Imaging Market Revenue (US$ Mn) Comparison by Country (2016-2032)
- Table 26: North America Veterinary Imaging Market Revenue (US$ Mn) (2016-2032)
- Table 27: North America Veterinary Imaging Market Revenue (US$ Mn) Comparison by Country (2016-2032)
- Table 28: North America Veterinary Imaging Market Revenue (US$ Mn) Comparison by By Product (2016-2032)
- Table 29: North America Veterinary Imaging Market Revenue (US$ Mn) Comparison by By Animal Type (2016-2032)
- Table 30: North America Veterinary Imaging Market Revenue (US$ Mn) Comparison by By Application (2016-2032)
- Table 31: North America Veterinary Imaging Market Revenue (US$ Mn) Comparison by By End-use (2016-2032)
- Table 32: North America Veterinary Imaging Market Y-o-Y Growth Rate Comparison by Country (2016-2032)
- Table 33: North America Veterinary Imaging Market Y-o-Y Growth Rate Comparison by By Product (2016-2032)
- Table 34: North America Veterinary Imaging Market Y-o-Y Growth Rate Comparison by By Animal Type (2016-2032)
- Table 35: North America Veterinary Imaging Market Y-o-Y Growth Rate Comparison by By Application (2016-2032)
- Table 36: North America Veterinary Imaging Market Y-o-Y Growth Rate Comparison by By End-use (2016-2032)
- Table 37: North America Veterinary Imaging Market Share Comparison by Country (2016-2032)
- Table 38: North America Veterinary Imaging Market Share Comparison by By Product (2016-2032)
- Table 39: North America Veterinary Imaging Market Share Comparison by By Animal Type (2016-2032)
- Table 40: North America Veterinary Imaging Market Share Comparison by By Application (2016-2032)
- Table 41: North America Veterinary Imaging Market Share Comparison by By End-use (2016-2032)
- Table 42: Western Europe Veterinary Imaging Market Comparison by By Product (2016-2032)
- Table 43: Western Europe Veterinary Imaging Market Comparison by By Animal Type (2016-2032)
- Table 44: Western Europe Veterinary Imaging Market Comparison by By Application (2016-2032)
- Table 45: Western Europe Veterinary Imaging Market Comparison by By End-use (2016-2032)
- Table 46: Western Europe Veterinary Imaging Market Revenue (US$ Mn) Comparison by Country (2016-2032)
- Table 47: Western Europe Veterinary Imaging Market Revenue (US$ Mn) (2016-2032)
- Table 48: Western Europe Veterinary Imaging Market Revenue (US$ Mn) Comparison by Country (2016-2032)
- Table 49: Western Europe Veterinary Imaging Market Revenue (US$ Mn) Comparison by By Product (2016-2032)
- Table 50: Western Europe Veterinary Imaging Market Revenue (US$ Mn) Comparison by By Animal Type (2016-2032)
- Table 51: Western Europe Veterinary Imaging Market Revenue (US$ Mn) Comparison by By Application (2016-2032)
- Table 52: Western Europe Veterinary Imaging Market Revenue (US$ Mn) Comparison by By End-use (2016-2032)
- Table 53: Western Europe Veterinary Imaging Market Y-o-Y Growth Rate Comparison by Country (2016-2032)
- Table 54: Western Europe Veterinary Imaging Market Y-o-Y Growth Rate Comparison by By Product (2016-2032)
- Table 55: Western Europe Veterinary Imaging Market Y-o-Y Growth Rate Comparison by By Animal Type (2016-2032)
- Table 56: Western Europe Veterinary Imaging Market Y-o-Y Growth Rate Comparison by By Application (2016-2032)
- Table 57: Western Europe Veterinary Imaging Market Y-o-Y Growth Rate Comparison by By End-use (2016-2032)
- Table 58: Western Europe Veterinary Imaging Market Share Comparison by Country (2016-2032)
- Table 59: Western Europe Veterinary Imaging Market Share Comparison by By Product (2016-2032)
- Table 60: Western Europe Veterinary Imaging Market Share Comparison by By Animal Type (2016-2032)
- Table 61: Western Europe Veterinary Imaging Market Share Comparison by By Application (2016-2032)
- Table 62: Western Europe Veterinary Imaging Market Share Comparison by By End-use (2016-2032)
- Table 63: Eastern Europe Veterinary Imaging Market Comparison by By Product (2016-2032)
- Table 64: Eastern Europe Veterinary Imaging Market Comparison by By Animal Type (2016-2032)
- Table 65: Eastern Europe Veterinary Imaging Market Comparison by By Application (2016-2032)
- Table 66: Eastern Europe Veterinary Imaging Market Comparison by By End-use (2016-2032)
- Table 67: Eastern Europe Veterinary Imaging Market Revenue (US$ Mn) Comparison by Country (2016-2032)
- Table 68: Eastern Europe Veterinary Imaging Market Revenue (US$ Mn) (2016-2032)
- Table 69: Eastern Europe Veterinary Imaging Market Revenue (US$ Mn) Comparison by Country (2016-2032)
- Table 70: Eastern Europe Veterinary Imaging Market Revenue (US$ Mn) Comparison by By Product (2016-2032)
- Table 71: Eastern Europe Veterinary Imaging Market Revenue (US$ Mn) Comparison by By Animal Type (2016-2032)
- Table 72: Eastern Europe Veterinary Imaging Market Revenue (US$ Mn) Comparison by By Application (2016-2032)
- Table 73: Eastern Europe Veterinary Imaging Market Revenue (US$ Mn) Comparison by By End-use (2016-2032)
- Table 74: Eastern Europe Veterinary Imaging Market Y-o-Y Growth Rate Comparison by Country (2016-2032)
- Table 75: Eastern Europe Veterinary Imaging Market Y-o-Y Growth Rate Comparison by By Product (2016-2032)
- Table 76: Eastern Europe Veterinary Imaging Market Y-o-Y Growth Rate Comparison by By Animal Type (2016-2032)
- Table 77: Eastern Europe Veterinary Imaging Market Y-o-Y Growth Rate Comparison by By Application (2016-2032)
- Table 78: Eastern Europe Veterinary Imaging Market Y-o-Y Growth Rate Comparison by By End-use (2016-2032)
- Table 79: Eastern Europe Veterinary Imaging Market Share Comparison by Country (2016-2032)
- Table 80: Eastern Europe Veterinary Imaging Market Share Comparison by By Product (2016-2032)
- Table 81: Eastern Europe Veterinary Imaging Market Share Comparison by By Animal Type (2016-2032)
- Table 82: Eastern Europe Veterinary Imaging Market Share Comparison by By Application (2016-2032)
- Table 83: Eastern Europe Veterinary Imaging Market Share Comparison by By End-use (2016-2032)
- Table 84: APAC Veterinary Imaging Market Comparison by By Product (2016-2032)
- Table 85: APAC Veterinary Imaging Market Comparison by By Animal Type (2016-2032)
- Table 86: APAC Veterinary Imaging Market Comparison by By Application (2016-2032)
- Table 87: APAC Veterinary Imaging Market Comparison by By End-use (2016-2032)
- Table 88: APAC Veterinary Imaging Market Revenue (US$ Mn) Comparison by Country (2016-2032)
- Table 89: APAC Veterinary Imaging Market Revenue (US$ Mn) (2016-2032)
- Table 90: APAC Veterinary Imaging Market Revenue (US$ Mn) Comparison by Country (2016-2032)
- Table 91: APAC Veterinary Imaging Market Revenue (US$ Mn) Comparison by By Product (2016-2032)
- Table 92: APAC Veterinary Imaging Market Revenue (US$ Mn) Comparison by By Animal Type (2016-2032)
- Table 93: APAC Veterinary Imaging Market Revenue (US$ Mn) Comparison by By Application (2016-2032)
- Table 94: APAC Veterinary Imaging Market Revenue (US$ Mn) Comparison by By End-use (2016-2032)
- Table 95: APAC Veterinary Imaging Market Y-o-Y Growth Rate Comparison by Country (2016-2032)
- Table 96: APAC Veterinary Imaging Market Y-o-Y Growth Rate Comparison by By Product (2016-2032)
- Table 97: APAC Veterinary Imaging Market Y-o-Y Growth Rate Comparison by By Animal Type (2016-2032)
- Table 98: APAC Veterinary Imaging Market Y-o-Y Growth Rate Comparison by By Application (2016-2032)
- Table 99: APAC Veterinary Imaging Market Y-o-Y Growth Rate Comparison by By End-use (2016-2032)
- Table 100: APAC Veterinary Imaging Market Share Comparison by Country (2016-2032)
- Table 101: APAC Veterinary Imaging Market Share Comparison by By Product (2016-2032)
- Table 102: APAC Veterinary Imaging Market Share Comparison by By Animal Type (2016-2032)
- Table 103: APAC Veterinary Imaging Market Share Comparison by By Application (2016-2032)
- Table 104: APAC Veterinary Imaging Market Share Comparison by By End-use (2016-2032)
- Table 105: Latin America Veterinary Imaging Market Comparison by By Product (2016-2032)
- Table 106: Latin America Veterinary Imaging Market Comparison by By Animal Type (2016-2032)
- Table 107: Latin America Veterinary Imaging Market Comparison by By Application (2016-2032)
- Table 108: Latin America Veterinary Imaging Market Comparison by By End-use (2016-2032)
- Table 109: Latin America Veterinary Imaging Market Revenue (US$ Mn) Comparison by Country (2016-2032)
- Table 110: Latin America Veterinary Imaging Market Revenue (US$ Mn) (2016-2032)
- Table 111: Latin America Veterinary Imaging Market Revenue (US$ Mn) Comparison by Country (2016-2032)
- Table 112: Latin America Veterinary Imaging Market Revenue (US$ Mn) Comparison by By Product (2016-2032)
- Table 113: Latin America Veterinary Imaging Market Revenue (US$ Mn) Comparison by By Animal Type (2016-2032)
- Table 114: Latin America Veterinary Imaging Market Revenue (US$ Mn) Comparison by By Application (2016-2032)
- Table 115: Latin America Veterinary Imaging Market Revenue (US$ Mn) Comparison by By End-use (2016-2032)
- Table 116: Latin America Veterinary Imaging Market Y-o-Y Growth Rate Comparison by Country (2016-2032)
- Table 117: Latin America Veterinary Imaging Market Y-o-Y Growth Rate Comparison by By Product (2016-2032)
- Table 118: Latin America Veterinary Imaging Market Y-o-Y Growth Rate Comparison by By Animal Type (2016-2032)
- Table 119: Latin America Veterinary Imaging Market Y-o-Y Growth Rate Comparison by By Application (2016-2032)
- Table 120: Latin America Veterinary Imaging Market Y-o-Y Growth Rate Comparison by By End-use (2016-2032)
- Table 121: Latin America Veterinary Imaging Market Share Comparison by Country (2016-2032)
- Table 122: Latin America Veterinary Imaging Market Share Comparison by By Product (2016-2032)
- Table 123: Latin America Veterinary Imaging Market Share Comparison by By Animal Type (2016-2032)
- Table 124: Latin America Veterinary Imaging Market Share Comparison by By Application (2016-2032)
- Table 125: Latin America Veterinary Imaging Market Share Comparison by By End-use (2016-2032)
- Table 126: Middle East & Africa Veterinary Imaging Market Comparison by By Product (2016-2032)
- Table 127: Middle East & Africa Veterinary Imaging Market Comparison by By Animal Type (2016-2032)
- Table 128: Middle East & Africa Veterinary Imaging Market Comparison by By Application (2016-2032)
- Table 129: Middle East & Africa Veterinary Imaging Market Comparison by By End-use (2016-2032)
- Table 130: Middle East & Africa Veterinary Imaging Market Revenue (US$ Mn) Comparison by Country (2016-2032)
- Table 131: Middle East & Africa Veterinary Imaging Market Revenue (US$ Mn) (2016-2032)
- Table 132: Middle East & Africa Veterinary Imaging Market Revenue (US$ Mn) Comparison by Country (2016-2032)
- Table 133: Middle East & Africa Veterinary Imaging Market Revenue (US$ Mn) Comparison by By Product (2016-2032)
- Table 134: Middle East & Africa Veterinary Imaging Market Revenue (US$ Mn) Comparison by By Animal Type (2016-2032)
- Table 135: Middle East & Africa Veterinary Imaging Market Revenue (US$ Mn) Comparison by By Application (2016-2032)
- Table 136: Middle East & Africa Veterinary Imaging Market Revenue (US$ Mn) Comparison by By End-use (2016-2032)
- Table 137: Middle East & Africa Veterinary Imaging Market Y-o-Y Growth Rate Comparison by Country (2016-2032)
- Table 138: Middle East & Africa Veterinary Imaging Market Y-o-Y Growth Rate Comparison by By Product (2016-2032)
- Table 139: Middle East & Africa Veterinary Imaging Market Y-o-Y Growth Rate Comparison by By Animal Type (2016-2032)
- Table 140: Middle East & Africa Veterinary Imaging Market Y-o-Y Growth Rate Comparison by By Application (2016-2032)
- Table 141: Middle East & Africa Veterinary Imaging Market Y-o-Y Growth Rate Comparison by By End-use (2016-2032)
- Table 142: Middle East & Africa Veterinary Imaging Market Share Comparison by Country (2016-2032)
- Table 143: Middle East & Africa Veterinary Imaging Market Share Comparison by By Product (2016-2032)
- Table 144: Middle East & Africa Veterinary Imaging Market Share Comparison by By Animal Type (2016-2032)
- Table 145: Middle East & Africa Veterinary Imaging Market Share Comparison by By Application (2016-2032)
- Table 146: Middle East & Africa Veterinary Imaging Market Share Comparison by By End-use (2016-2032)
- 1. Executive Summary
-
- DEXX Laboratories, Inc.
- GE Healthcare
- Carestream Health
- FUJIFILM Holdings America Corporation
- Esaote SpA
- VetZ Limited
- Hallmarq Veterinary Imaging Ltd
- SUNI Medical Imaging, Inc.
- Universal Medical Systems, Inc.
Our Clients


View Our Licence Options
