
Global Tyrosine Kinase Inhibitors Market By Type(BCR-ABL Tyrosine Kinase Inhibitor, Epidermal Growth Factor Receptor (EGFR) Tyrosine Kinase Inhibitors, Vascular Endothelial Growth Factor Receptor (VEGFR) Tyrosine Kinase Inhibitors, Other Types), By Application(Chronic Myeloid Leukemia (CML), Lung Cancer, Breast Cancer, Renal cell cancer, Other Applications), By Region And Companies - Industry Segment Outlook, Market Assessment, Competition Scenario, Trends, And Forecast 2024-2033
-
22456
-
June 2024
-
300
-


-
This report was compiled by Trishita Deb Trishita Deb is an experienced market research and consulting professional with over 7 years of expertise across healthcare, consumer goods, and materials, contributing to over 400 healthcare-related reports. Correspondence Team Lead- Healthcare Linkedin | Detailed Market research Methodology Our methodology involves a mix of primary research, including interviews with leading mental health experts, and secondary research from reputable medical journals and databases. View Detailed Methodology Page
-
Quick Navigation
Report Overview
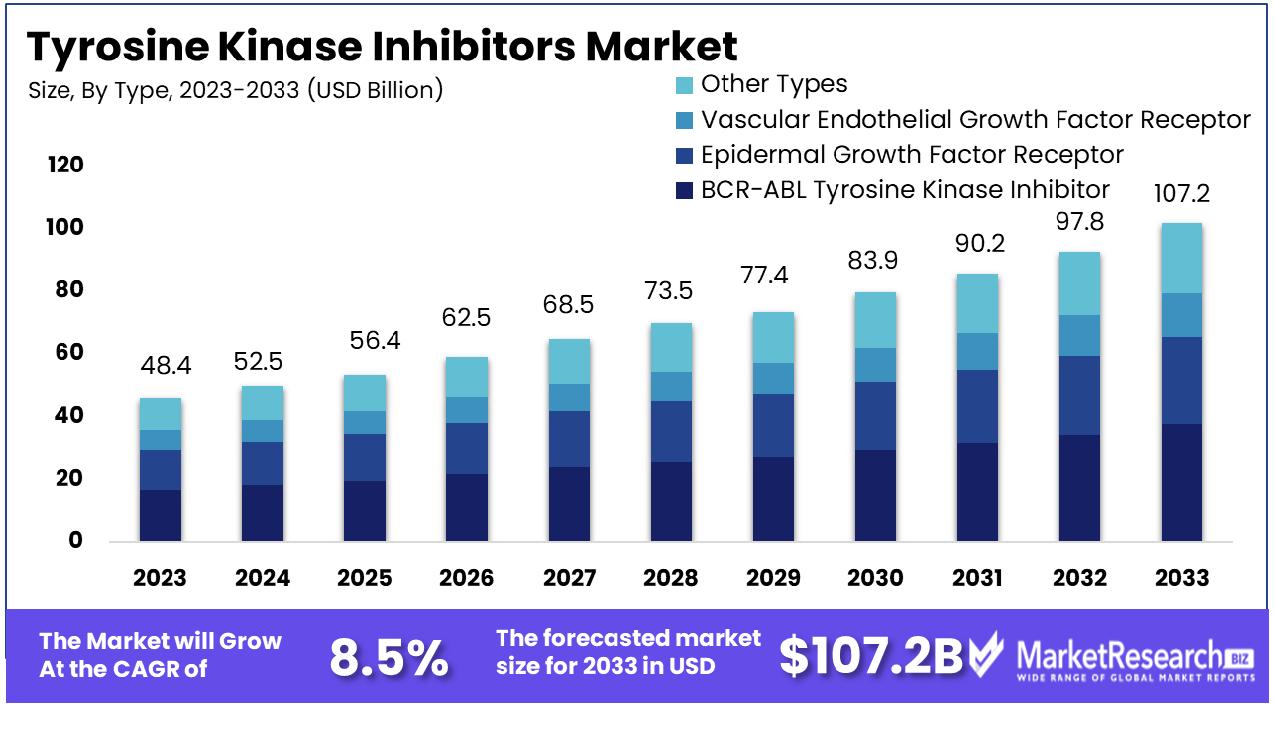
The Global Tyrosine Kinase Inhibitors Market was valued at USD 48.4 billion in 2023. It is expected to reach USD 107.2 billion by 2033, with a CAGR of 8.5% during the forecast period from 2024 to 2033.
The Tyrosine Kinase Inhibitors Market comprises the development, production, and sale of targeted therapeutic agents designed to block tyrosine kinase enzymes involved in the signaling pathways that regulate cellular processes such as growth, metabolism, and apoptosis.
These inhibitors play a critical role in the management of various cancers, including leukemia, lung cancer, and breast cancer, by impeding the enzymatic activity that contributes to malignant cell proliferation and survival.
The market is vital for pharmaceutical companies focused on oncology, offering significant opportunities for innovation in treatment protocols and personalized medicine, which are essential considerations for strategic leaders in the healthcare sector.
The Tyrosine Kinase Inhibitors (TKIs) market is characterized by robust growth and significant innovation, positioning it as a critical component in the landscape of targeted cancer therapies. As of November 2022, the U.S. Food and Drug Administration (FDA) has approved over 70 small molecule kinase inhibitors, reflecting the accelerated pace of development and the high potential of these compounds in therapeutic applications.
Recent advancements in research methodologies have further enriched our understanding of the TKI landscape. For instance, an extensive study profiling 1,183 kinase inhibitor tool compounds, derived from numerous drug discovery projects, has leveraged kinobeads technology to unveil their target spectra across various cancer cell lines. This research has been instrumental in mapping the complex interactions and efficacy of TKIs in a targeted manner.
The availability of such a comprehensive dataset, which encompasses nearly 1,000 kinase inhibitors targeting a broad section of the kinome space, serves as a foundational resource for the development of more effective therapeutic agents. The application of machine learning models on this dataset has demonstrated a high predictive accuracy (R2 of 0.7) in determining the sensitivity of cancer cell lines to specific kinase inhibitors.
This integration of advanced analytics and empirical data underscores a significant leap toward precision medicine, allowing for the development of highly targeted treatments with the potential to enhance patient outcomes significantly.
Key Takeaways
- Market Growth: The Global Tyrosine Kinase Inhibitors Market was valued at USD 48.4 billion in 2023. It is expected to reach USD 107.2 billion by 2033, with a CAGR of 8.5% during the forecast period from 2024 to 2033.
- By Type: BCR-ABL Tyrosine Kinase Inhibitors dominate 65% of the market.
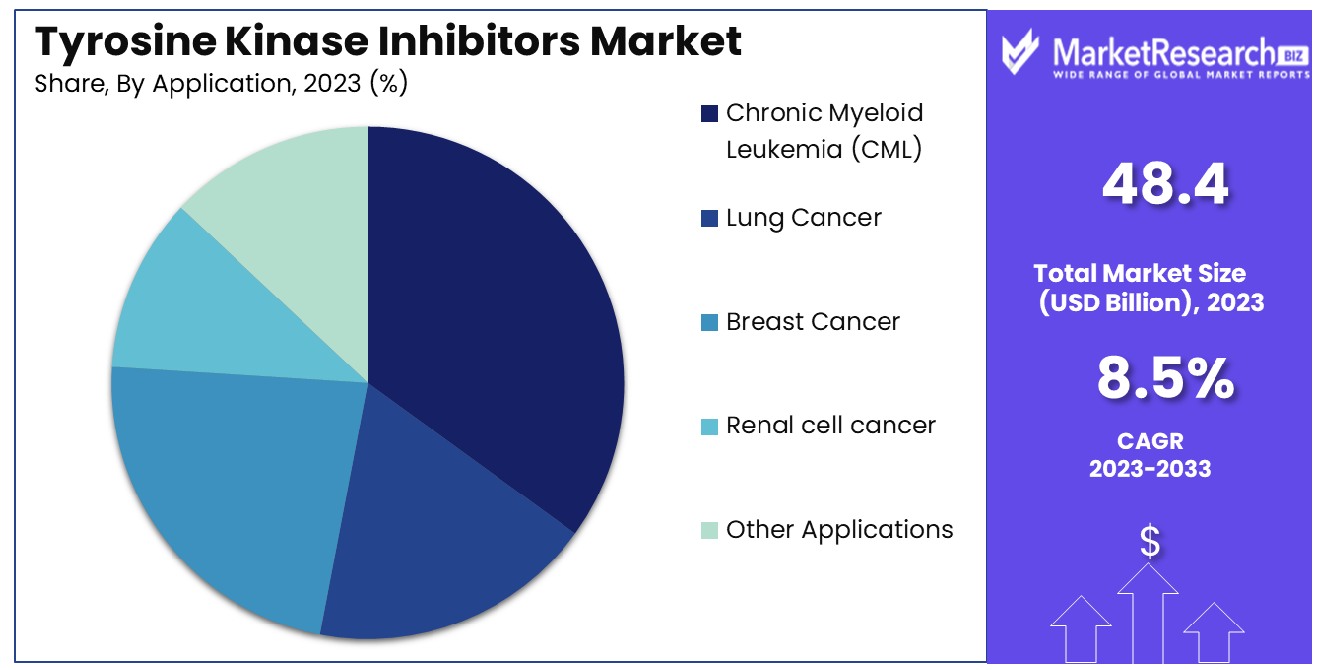
- By Application: Chronic Myeloid Leukemia leads with a 60% market share in applications.
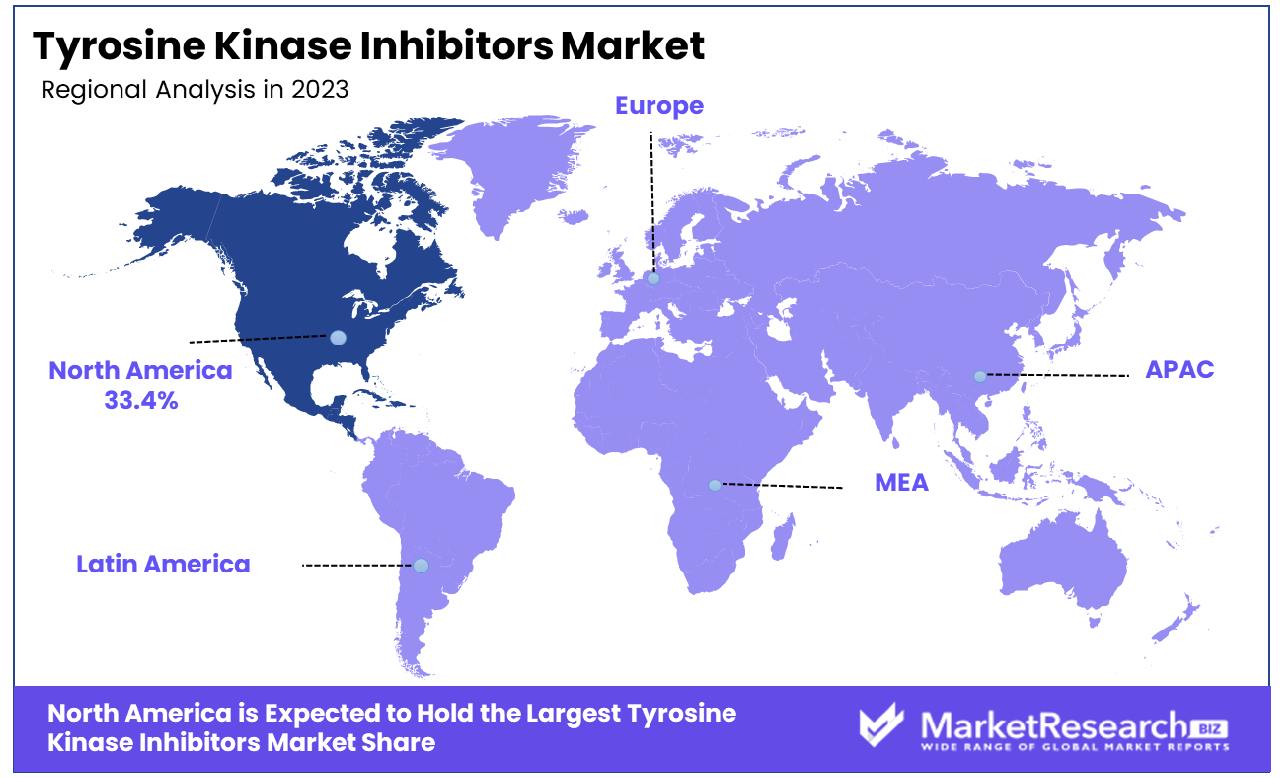
- Regional Dominance: North America holds 33.4% of the global Tyrosine Kinase Inhibitors market.
- Growth Opportunity: The Tyrosine Kinase Inhibitors market is growing due to their efficacy over traditional cancer treatments and bolstered by favorable government policies and accelerated regulatory approvals for new therapies.
Driving factors
Approval of Novel Tyrosine Kinase Inhibitors for Various Cancers
The approval of novel tyrosine kinase inhibitors (TKIs) is a significant driving force in the market’s expansion. Regulatory approvals are critical for market entry, and each new approval can open up lucrative opportunities. These approvals are often based on clinical evidence showing significant benefits in treating various cancers, including lung, breast, and blood cancers, which collectively affect millions globally.
For instance, the U.S. Food and Drug Administration’s recent approvals of several new TKIs have been linked to substantial improvements in patient outcomes, often becoming the standard of care upon release. This not only catalyzes market growth but also encourages continuous investment in R&D, expecting similar success. Such dynamics are indicative of the market's responsiveness to innovations that promise enhanced efficacy and patient survival rates.
Increasing Sales of Blockbuster Tyrosine Kinase Inhibitor Drugs
Blockbuster drugs, defined by their ability to generate revenues exceeding $1 billion, significantly contribute to the tyrosine kinase inhibitors market’s growth. The high sales figures are often reflective of their widespread acceptance and use in clinical settings. For example, drugs like Imatinib and Erlotinib have become integral in cancer treatment protocols, supported by their proven efficacy and broad therapeutic impact.
Their financial success not only boosts market valuation but also reinforces investor confidence, driving further capital into research and marketing. The increasing sales of these drugs underscore the market’s potential for high revenue generation, thereby attracting more pharmaceutical companies to invest in similar developments.
Strong Pipeline of Late-stage Tyrosine Kinase Inhibitor Molecules
A robust pipeline of late-stage TKI molecules is pivotal for sustained market growth. These late-stage developments indicate that a significant number of potential therapies are nearing market readiness, promising new treatment options and the potential for market disruption. The anticipation of new product launches based on these pipelines drives investor interest and strategic partnerships, aiming to capitalize on the forthcoming market opportunities.
The presence of these advanced-stage molecules also highlights the ongoing innovation within the pharmaceutical sector, aimed at addressing unmet medical needs and improving therapeutic outcomes in oncology. This factor not only ensures a continuous flow of new products but also helps maintain competitive dynamics within the market, encouraging perpetual improvements and adaptations.
Restraining Factors
High Cost of Development
The development of tyrosine kinase inhibitors (TKIs) involves substantial financial investment, primarily due to the lengthy and complex nature of clinical trials required to ensure safety and efficacy. The costs can be exacerbated by the high rates of attrition in drug development, where many compounds fail to make it through to approval. For example, the average cost to bring a cancer drug to market can range from $800 million to over $2 billion.
These significant expenditures can restrain market growth by limiting the number of new entrants and reducing the overall innovation within the field. High development costs necessitate successful commercialization to recoup investments, which may also lead to higher prices for these drugs, affecting market accessibility and adoption rates.
Limited Availability in Developing Countries
The availability of TKIs in developing countries is hindered by several factors including high costs, inadequate healthcare infrastructure, and regulatory complexities. These countries often face challenges in affording such high-cost treatments, which are predominantly priced for highly developed healthcare markets. Additionally, the lack of specialized healthcare facilities and trained oncologists can limit the effective administration and monitoring of TKI therapies, crucial for treating complex cancers.
This restricted availability can dampen the potential market expansion into these regions, thereby affecting the global growth of the TKI market. When combined with the high development costs, these factors collectively contribute to a market that is robust in developed regions but constrained globally, particularly in areas that might benefit most from these advanced therapies.
By Type Analysis
The BCR-ABL Tyrosine Kinase Inhibitor segment dominates, holding 65% of the market share.
In 2023, BCR-ABL Tyrosine Kinase Inhibitor held a dominant market position in the "By Type" segment of the Tyrosine Kinase Inhibitors Market, capturing more than a 65% share. This substantial market share is attributed to the critical role that BCR-ABL inhibitors play in the treatment of chronic myeloid leukemia (CML) and acute lymphoblastic leukemia (ALL), where their efficacy in targeting the BCR-ABL fusion protein results in high therapeutic outcomes. The robust adoption rate of these inhibitors has been bolstered by strong clinical results and the expansion of treatment guidelines endorsing their use as first-line therapies.
Following BCR-ABL Tyrosine Kinase Inhibitors in market share are the Epidermal Growth Factor Receptor (EGFR) Tyrosine Kinase Inhibitors, which are widely utilized in the treatment of various types of non-small cell lung cancer (NSCLC) and pancreatic cancer. These inhibitors work by blocking the EGFR pathways, which are often overexpressed in several epithelial cancers, thus inhibiting tumor growth and proliferation.
Vascular Endothelial Growth Factor Receptor (VEGFR) Tyrosine Kinase Inhibitors also hold a significant segment of the market. These inhibitors are essential in treating different malignancies, including renal cell carcinoma and soft tissue sarcoma, by blocking the angiogenesis process that tumors need for growth and survival.
The "Other Types" category includes several newer classes of tyrosine kinase inhibitors that target various other oncogenic pathways, each contributing to a smaller but rapidly growing portion of the market. These emerging therapies are exploring treatment possibilities in lesser-known targets and combinations, expanding the scope of tyrosine kinase inhibitor applications in oncology drugs.
By Application Analysis
Chronic Myeloid Leukemia (CML) leads with a significant 60% dominance in its category.
In 2023, Chronic Myeloid Leukemia (CML) held a dominant market position in the "By Application" segment of the Tyrosine Kinase Inhibitors Market, capturing more than a 60% share. This prominence is largely due to the pivotal role of tyrosine kinase inhibitors (TKIs) in the standard treatment protocol for CML.
The effectiveness of these inhibitors in targeting the BCR-ABL oncoprotein, responsible for the proliferation of leukemic cells, has made them the cornerstone of CML therapy, leading to significantly improved patient outcomes and survival rates.
Following closely behind in market share is Lung Cancer. Tyrosine kinase inhibitors are increasingly utilized in treating non-small cell lung cancer (NSCLC), specifically targeting mutations in the EGFR gene. Their targeted approach allows for more personalized treatment options, thereby enhancing efficacy and reducing toxicity compared to traditional chemotherapy.
Breast Cancer also represents a significant segment within the market. Tyrosine kinase inhibitors are used to target HER2-positive breast cancer, a subtype where the HER2 protein is overexpressed. These inhibitors have transformed the therapeutic landscape for such breast cancer patients, offering a targeted therapy that directly impacts the tumor growth pathways.
Renal Cell Cancer is another key area benefiting from TKI therapies. These inhibitors target VEGFR pathways to reduce angiogenesis, which is crucial for tumor growth and metastasis, thus proving effective in treating advanced renal cell carcinoma.
The "Other Applications" category includes diverse oncological conditions where tyrosine kinase inhibitors are being explored. This includes various solid and hematologic malignancies, expanding the potential clinical applications of TKIs.
Key Market Segments
By Type
- BCR-ABL Tyrosine Kinase Inhibitor
- Epidermal Growth Factor Receptor (EGFR) Tyrosine Kinase Inhibitors
- Vascular Endothelial Growth Factor Receptor (VEGFR) Tyrosine Kinase Inhibitors
- Other Types
By Application
- Chronic Myeloid Leukemia (CML)
- Lung Cancer
- Breast Cancer
- Renal cell cancer
- Other Applications
Growth Opportunity
Increasing Adoption of Tyrosine Kinase Inhibitors Over Traditional Cancer Therapies
The global Tyrosine Kinase Inhibitors (TKIs) market is witnessing significant growth, primarily driven by the increasing adoption of these inhibitors over traditional cancer therapies. TKIs, known for their targeted approach, directly interfere with the enzymatic pathways that promote cancer cell growth and survival, offering a more precise treatment option compared to conventional chemotherapy.
This shift is spurred by the higher efficacy and lower side effects associated with TKIs, which enhance patient adherence and outcomes. The evolution of precision medicine has further fueled this trend, as genetic testing and molecular profiling in oncology enable the identification of specific cancer types susceptible to TKIs. Consequently, the demand for TKIs is expected to surge, supported by a growing recognition of their benefits in treating various malignancies, including chronic myeloid leukemia and non-small cell lung cancer.
Favorable Government Initiatives and Regulatory Approvals for Tyrosine Kinase Inhibitors
Government initiatives and regulatory frameworks play a pivotal role in shaping the TKIs market landscape. In 2023, these factors are particularly influential, driving the market's expansion. Regulatory agencies across key regions have streamlined approval processes for new TKIs, reflecting a supportive stance towards innovations in cancer treatment. These approvals not only enhance market access but also encourage pharmaceutical companies to invest in R&D for developing novel TKIs.
Additionally, governments in many countries are implementing policies that favor cancer research, including financial incentives and grants that support clinical trials and research advancements. Such initiatives are crucial for the development and rapid approval of new treatment modalities, ensuring that effective therapies reach patients swiftly. As a result, the TKIs market is poised to capitalize on these favorable conditions, expecting robust growth and continued innovation.
Latest Trends
Adoption of TKIs in Developing Regions
In 2023, the global Tyrosine Kinase Inhibitors (TKIs) market is experiencing significant expansion into developing regions, a trend driven by the escalating incidence of cancer and an increasing awareness of advanced treatments. Countries in Asia, Africa, and Latin America are witnessing a surge in the adoption of TKIs, facilitated by improving healthcare infrastructures and growing economies that enable greater healthcare spending.
Governments and healthcare providers in these regions are actively promoting the adoption of advanced cancer therapies, including TKIs, to enhance patient outcomes. This trend is further supported by collaborations between global pharmaceutical companies and local entities, aiming to make these critical treatments more accessible and affordable. As a result, the market for TKIs in developing regions is expected to see robust growth, contributing significantly to the global market expansion.
Increased R&D Investment by Pharmaceutical Companies
The year 2023 marks a noteworthy increase in research and development (R&D) investments by pharmaceutical companies in the TKIs market. These investments are focused on enhancing the effectiveness and reducing the side effects of existing therapies, as well as discovering new therapeutic targets. The competitive landscape of the pharmaceutical industry, coupled with the promising potential of TKIs in oncology, has spurred companies to allocate substantial resources toward innovation.
This influx of investment is not only propelling the development of next-generation TKIs but also ensuring a rapid pace of clinical trials, leading to quicker market introductions. With a strong pipeline of TKIs under development, the market is poised for continued innovation and growth, driven by these sustained R&D efforts.
Regional Analysis
In 2023, North America holds a 33.4% share of the global Tyrosine Kinase Inhibitors market.
The global Tyrosine Kinase Inhibitors (TKIs) market is segmented across key regions: North America, Europe, Asia Pacific, Middle East & Africa, and Latin America, each exhibiting distinct market dynamics and growth potential.
North America dominates the global TKIs market with a 33.4% share, driven by advanced healthcare infrastructure, high healthcare expenditure, and a strong presence of leading pharmaceutical companies engaged in oncology research. The region's market leadership is further bolstered by a robust pipeline of TKIs in clinical trials and swift regulatory approvals.
Europe holds a significant portion of the market, supported by favorable government policies towards cancer research and healthcare funding. The region's focus on personalized medicine and targeted therapies continues to foster the adoption of TKIs, making it a key player in the global landscape.
The Asia Pacific region is emerging as the fastest-growing market for TKIs, attributed to rising cancer prevalence, increasing healthcare access, and improving economic conditions. Countries like China and India are pivotal, with their growing middle-class populations demanding more advanced medical treatments.
The Middle East & Africa region, although smaller in market size, is gradually adopting TKIs, driven by governmental efforts to enhance healthcare systems and collaborations with multinational pharmaceutical firms to provide advanced cancer treatments.
Latin America shows promising growth in the TKIs market, with ongoing healthcare reforms and increasing clinical trials conducted by global pharma giants to test and introduce new TKIs in the region.
Key Regions and Countries
North America
- The US
- Canada
- Rest of North America
Europe
- Germany
- France
- The UK
- Spain
- Netherlands
- Russia
- Italy
- Rest of Europe
Asia-Pacific
- China
- Japan
- Singapore
- Thailand
- South Korea
- Vietnam
- India
- New Zealand
- Rest of Asia Pacific
Latin America
- Mexico
- Brazil
- Rest of Latin America
Middle East & Africa
- Saudi Arabia
- South Africa
- UAE
- Rest of Middle East & Africa
Key Players Analysis
In the global Tyrosine Kinase Inhibitors Market in 2023, several key players have distinguished themselves through innovative strategies, broad product portfolios, and geographic expansion. Novartis AG leads prominently, leveraging its robust R&D capabilities to expand its tyrosine kinase inhibitor (TKI) offerings, thereby enhancing its competitive edge. Similarly, F. Hoffmann-La Roche Ltd continues to dominate part of the market with targeted therapies, emphasizing precision medicine.
Endo International Inc, Teva Pharmaceutical Industries Ltd, and Dr. Reddy’s Laboratories are also noteworthy. These companies have expanded their generic TKI portfolios, catering to cost-sensitive markets while ensuring accessibility. This strategy not only positions them strongly in emerging markets but also in developed regions that are focusing on cost-effective healthcare solutions.
Glenmark Pharmaceuticals, Cipla Inc, and Lupin are capitalizing on their strong manufacturing capabilities in India to scale up production and meet global demand. Their strategic partnerships and approvals in regulated markets are pivotal for their international footprint.
On the innovation frontier, companies like Takeda Pharmaceutical and Astellas Pharma are advancing their pipelines with novel TKIs that promise higher efficacy and fewer side effects, addressing significant unmet medical needs in oncology.
In the U.S., companies like Abbott and Pfizer are intensifying their presence by integrating TKIs into their broader oncology portfolios, thereby offering comprehensive therapeutic solutions. Pfizer, in particular, continues to lead with breakthrough therapies that are setting new standards in cancer treatment.
Market Key Players
- Novartis AG (Switzerland)
- Endo International Inc (Ireland)
- Teva Pharmaceutical Industries Ltd (Israel)
- Glenmark Pharmaceuticals Ltd (India)
- Cipla Inc (India)
- Dr Reddy's Laboratories Ltd (India)
- Abbott (U.S.)
- F. Hoffmann-La Roche Ltd (Switzerland)
- Pfizer Inc (U.S.)
- Lupin (India)
- Takeda Pharmaceutical Company Limited (Japan)
- Akorn, Incorporated (U.S.)
- Torrent Pharmaceuticals Ltd. (India)
- Amneal Pharmaceuticals LLC. (U.S.)
- Astellas Pharma Inc. (Japan)
- Sierra Oncology, Inc (Canada)
Recent Developement
- In May 2024, Novartis builds on decades of chronic myeloid leukemia (CML) research, unveiling an innovative compound targeting the BCR::ABL1 fusion protein. Successful trials offer hope for improved therapy options.
- In November 2023, Leading patent filers in tyrosine kinase inhibitors include Seattle Children's Hospital, F. Hoffmann-La Roche, Pfizer, and Arog Pharmaceuticals, with Seattle Children's Hospital holding the top position for application diversity and geographic reach.
- In May 2020, Pfizer Oncology advanced cancer treatment with positive Phase 3 trial results from JAVELIN Renal 101. Avelumab and axitinib combo show improved outcomes in advanced renal cell carcinoma patients.
Report Scope
Report Features Description Market Value (2023) USD 48.4 Billion Forecast Revenue (2033) USD 107.2 Billion CAGR (2024-2032) 8.5% Base Year for Estimation 2023 Historic Period 2016-2023 Forecast Period 2024-2033 Report Coverage Revenue Forecast, Market Dynamics, COVID-19 Impact, Competitive Landscape, Recent Developments Segments Covered By Type(BCR-ABL Tyrosine Kinase Inhibitor, Epidermal Growth Factor Receptor (EGFR) Tyrosine Kinase Inhibitors, Vascular Endothelial Growth Factor Receptor (VEGFR) Tyrosine Kinase Inhibitors, Other Types), By Application(Chronic Myeloid Leukemia (CML), Lung Cancer, Breast Cancer, Renal cell cancer, Other Applications) Regional Analysis North America - The US, Canada, Rest of North America, Europe - Germany, France, The UK, Spain, Italy, Russia, Netherlands, Rest of Europe, Asia-Pacific - China, Japan, South Korea, India, New Zealand, Singapore, Thailand, Vietnam, Rest of Asia Pacific, Latin America - Brazil, Mexico, Rest of Latin America, Middle East & Africa - South Africa, Saudi Arabia, UAE, Rest of Middle East & Africa Competitive Landscape Novartis AG (Switzerland), Endo International Inc (Ireland), Teva Pharmaceutical Industries Ltd (Israel), Glenmark Pharmaceuticals Ltd (India), Cipla Inc (India), Dr Reddy's Laboratories Ltd (India), Abbott (U.S.), F. Hoffmann-La Roche Ltd (Switzerland), Pfizer Inc (U.S.), Lupin (India), Takeda Pharmaceutical Company Limited (Japan), Akorn, Incorporated (U.S.), Torrent Pharmaceuticals Ltd. (India), Amneal Pharmaceuticals LLC. (U.S.), Astellas Pharma Inc. (Japan), Sierra Oncology, Inc (Canada) Customization Scope Customization for segments, region/country-level will be provided. Moreover, additional customization can be done based on the requirements. Purchase Options We have three licenses to opt for Single User License, Multi-User License (Up to 5 Users), Corporate Use License (Unlimited User and Printable PDF) -
- 1. Executive Summary
- 1.1. Definition
- 1.2. Taxonomy
- 1.3. Research Scope
- 1.4. Key Analysis
- 1.5. Key Findings by Major Segments
- 1.6. Top strategies by Major Players
- 2. Global Tyrosine Kinase Inhibitors Market Overview
- 2.1. Tyrosine Kinase Inhibitors Market Dynamics
- 2.1.1. Drivers
- 2.1.2. Opportunities
- 2.1.3. Restraints
- 2.1.4. Challenges
- 2.2. Macro-economic Factors
- 2.3. Regulatory Framework
- 2.4. Market Investment Feasibility Index
- 2.5. PEST Analysis
- 2.6. PORTER’S Five Force Analysis
- 2.7. Drivers & Restraints Impact Analysis
- 2.8. Industry Chain Analysis
- 2.9. Cost Structure Analysis
- 2.10. Marketing Strategy
- 2.11. Russia-Ukraine War Impact Analysis
- 2.12. Opportunity Map Analysis
- 2.13. Market Competition Scenario Analysis
- 2.14. Product Life Cycle Analysis
- 2.15. Opportunity Orbits
- 2.16. Manufacturer Intensity Map
- 2.17. Major Companies sales by Value & Volume
- 2.1. Tyrosine Kinase Inhibitors Market Dynamics
- 3. Global Tyrosine Kinase Inhibitors Market Analysis, Opportunity and Forecast, 2016-2032
- 3.1. Global Tyrosine Kinase Inhibitors Market Analysis, 2016-2021
- 3.2. Global Tyrosine Kinase Inhibitors Market Opportunity and Forecast, 2023-2032
- 3.3. Global Tyrosine Kinase Inhibitors Market Analysis, Opportunity and Forecast, By By Type, 2016-2032
- 3.3.1. Global Tyrosine Kinase Inhibitors Market Analysis by By Type: Introduction
- 3.3.2. Market Size Absolute $ Opportunity Analysis and Forecast, By By Type, 2016-2032
- 3.3.3. BCR-ABL Tyrosine Kinase Inhibitor
- 3.3.4. Epidermal Growth Factor Receptor (EGFR) Tyrosine Kinase Inhibitors
- 3.3.5. Vascular Endothelial Growth Factor Receptor (VEGFR) Tyrosine Kinase Inhibitors
- 3.3.6. Other Types
- 3.4. Global Tyrosine Kinase Inhibitors Market Analysis, Opportunity and Forecast, By By Application, 2016-2032
- 3.4.1. Global Tyrosine Kinase Inhibitors Market Analysis by By Application: Introduction
- 3.4.2. Market Size Absolute $ Opportunity Analysis and Forecast, By By Application, 2016-2032
- 3.4.3. Chronic Myeloid Leukemia (CML)
- 3.4.4. Lung Cancer
- 3.4.5. Breast Cancer
- 3.4.6. Renal cell cancer
- 3.4.7. Other Applications
- 4. North America Tyrosine Kinase Inhibitors Market Analysis, Opportunity and Forecast, 2016-2032
- 4.1. North America Tyrosine Kinase Inhibitors Market Analysis, 2016-2021
- 4.2. North America Tyrosine Kinase Inhibitors Market Opportunity and Forecast, 2023-2032
- 4.3. North America Tyrosine Kinase Inhibitors Market Analysis, Opportunity and Forecast, By By Type, 2016-2032
- 4.3.1. North America Tyrosine Kinase Inhibitors Market Analysis by By Type: Introduction
- 4.3.2. Market Size Absolute $ Opportunity Analysis and Forecast, By By Type, 2016-2032
- 4.3.3. BCR-ABL Tyrosine Kinase Inhibitor
- 4.3.4. Epidermal Growth Factor Receptor (EGFR) Tyrosine Kinase Inhibitors
- 4.3.5. Vascular Endothelial Growth Factor Receptor (VEGFR) Tyrosine Kinase Inhibitors
- 4.3.6. Other Types
- 4.4. North America Tyrosine Kinase Inhibitors Market Analysis, Opportunity and Forecast, By By Application, 2016-2032
- 4.4.1. North America Tyrosine Kinase Inhibitors Market Analysis by By Application: Introduction
- 4.4.2. Market Size Absolute $ Opportunity Analysis and Forecast, By By Application, 2016-2032
- 4.4.3. Chronic Myeloid Leukemia (CML)
- 4.4.4. Lung Cancer
- 4.4.5. Breast Cancer
- 4.4.6. Renal cell cancer
- 4.4.7. Other Applications
- 4.5. North America Tyrosine Kinase Inhibitors Market Analysis, Opportunity and Forecast, By Country , 2016-2032
- 4.5.1. North America Tyrosine Kinase Inhibitors Market Analysis by Country : Introduction
- 4.5.2. Market Size Absolute $ Opportunity Analysis and Forecast, Country , 2016-2032
- 4.5.2.1. The US
- 4.5.2.2. Canada
- 4.5.2.3. Mexico
- 5. Western Europe Tyrosine Kinase Inhibitors Market Analysis, Opportunity and Forecast, 2016-2032
- 5.1. Western Europe Tyrosine Kinase Inhibitors Market Analysis, 2016-2021
- 5.2. Western Europe Tyrosine Kinase Inhibitors Market Opportunity and Forecast, 2023-2032
- 5.3. Western Europe Tyrosine Kinase Inhibitors Market Analysis, Opportunity and Forecast, By By Type, 2016-2032
- 5.3.1. Western Europe Tyrosine Kinase Inhibitors Market Analysis by By Type: Introduction
- 5.3.2. Market Size Absolute $ Opportunity Analysis and Forecast, By By Type, 2016-2032
- 5.3.3. BCR-ABL Tyrosine Kinase Inhibitor
- 5.3.4. Epidermal Growth Factor Receptor (EGFR) Tyrosine Kinase Inhibitors
- 5.3.5. Vascular Endothelial Growth Factor Receptor (VEGFR) Tyrosine Kinase Inhibitors
- 5.3.6. Other Types
- 5.4. Western Europe Tyrosine Kinase Inhibitors Market Analysis, Opportunity and Forecast, By By Application, 2016-2032
- 5.4.1. Western Europe Tyrosine Kinase Inhibitors Market Analysis by By Application: Introduction
- 5.4.2. Market Size Absolute $ Opportunity Analysis and Forecast, By By Application, 2016-2032
- 5.4.3. Chronic Myeloid Leukemia (CML)
- 5.4.4. Lung Cancer
- 5.4.5. Breast Cancer
- 5.4.6. Renal cell cancer
- 5.4.7. Other Applications
- 5.5. Western Europe Tyrosine Kinase Inhibitors Market Analysis, Opportunity and Forecast, By Country , 2016-2032
- 5.5.1. Western Europe Tyrosine Kinase Inhibitors Market Analysis by Country : Introduction
- 5.5.2. Market Size Absolute $ Opportunity Analysis and Forecast, Country , 2016-2032
- 5.5.2.1. Germany
- 5.5.2.2. France
- 5.5.2.3. The UK
- 5.5.2.4. Spain
- 5.5.2.5. Italy
- 5.5.2.6. Portugal
- 5.5.2.7. Ireland
- 5.5.2.8. Austria
- 5.5.2.9. Switzerland
- 5.5.2.10. Benelux
- 5.5.2.11. Nordic
- 5.5.2.12. Rest of Western Europe
- 6. Eastern Europe Tyrosine Kinase Inhibitors Market Analysis, Opportunity and Forecast, 2016-2032
- 6.1. Eastern Europe Tyrosine Kinase Inhibitors Market Analysis, 2016-2021
- 6.2. Eastern Europe Tyrosine Kinase Inhibitors Market Opportunity and Forecast, 2023-2032
- 6.3. Eastern Europe Tyrosine Kinase Inhibitors Market Analysis, Opportunity and Forecast, By By Type, 2016-2032
- 6.3.1. Eastern Europe Tyrosine Kinase Inhibitors Market Analysis by By Type: Introduction
- 6.3.2. Market Size Absolute $ Opportunity Analysis and Forecast, By By Type, 2016-2032
- 6.3.3. BCR-ABL Tyrosine Kinase Inhibitor
- 6.3.4. Epidermal Growth Factor Receptor (EGFR) Tyrosine Kinase Inhibitors
- 6.3.5. Vascular Endothelial Growth Factor Receptor (VEGFR) Tyrosine Kinase Inhibitors
- 6.3.6. Other Types
- 6.4. Eastern Europe Tyrosine Kinase Inhibitors Market Analysis, Opportunity and Forecast, By By Application, 2016-2032
- 6.4.1. Eastern Europe Tyrosine Kinase Inhibitors Market Analysis by By Application: Introduction
- 6.4.2. Market Size Absolute $ Opportunity Analysis and Forecast, By By Application, 2016-2032
- 6.4.3. Chronic Myeloid Leukemia (CML)
- 6.4.4. Lung Cancer
- 6.4.5. Breast Cancer
- 6.4.6. Renal cell cancer
- 6.4.7. Other Applications
- 6.5. Eastern Europe Tyrosine Kinase Inhibitors Market Analysis, Opportunity and Forecast, By Country , 2016-2032
- 6.5.1. Eastern Europe Tyrosine Kinase Inhibitors Market Analysis by Country : Introduction
- 6.5.2. Market Size Absolute $ Opportunity Analysis and Forecast, Country , 2016-2032
- 6.5.2.1. Russia
- 6.5.2.2. Poland
- 6.5.2.3. The Czech Republic
- 6.5.2.4. Greece
- 6.5.2.5. Rest of Eastern Europe
- 7. APAC Tyrosine Kinase Inhibitors Market Analysis, Opportunity and Forecast, 2016-2032
- 7.1. APAC Tyrosine Kinase Inhibitors Market Analysis, 2016-2021
- 7.2. APAC Tyrosine Kinase Inhibitors Market Opportunity and Forecast, 2023-2032
- 7.3. APAC Tyrosine Kinase Inhibitors Market Analysis, Opportunity and Forecast, By By Type, 2016-2032
- 7.3.1. APAC Tyrosine Kinase Inhibitors Market Analysis by By Type: Introduction
- 7.3.2. Market Size Absolute $ Opportunity Analysis and Forecast, By By Type, 2016-2032
- 7.3.3. BCR-ABL Tyrosine Kinase Inhibitor
- 7.3.4. Epidermal Growth Factor Receptor (EGFR) Tyrosine Kinase Inhibitors
- 7.3.5. Vascular Endothelial Growth Factor Receptor (VEGFR) Tyrosine Kinase Inhibitors
- 7.3.6. Other Types
- 7.4. APAC Tyrosine Kinase Inhibitors Market Analysis, Opportunity and Forecast, By By Application, 2016-2032
- 7.4.1. APAC Tyrosine Kinase Inhibitors Market Analysis by By Application: Introduction
- 7.4.2. Market Size Absolute $ Opportunity Analysis and Forecast, By By Application, 2016-2032
- 7.4.3. Chronic Myeloid Leukemia (CML)
- 7.4.4. Lung Cancer
- 7.4.5. Breast Cancer
- 7.4.6. Renal cell cancer
- 7.4.7. Other Applications
- 7.5. APAC Tyrosine Kinase Inhibitors Market Analysis, Opportunity and Forecast, By Country , 2016-2032
- 7.5.1. APAC Tyrosine Kinase Inhibitors Market Analysis by Country : Introduction
- 7.5.2. Market Size Absolute $ Opportunity Analysis and Forecast, Country , 2016-2032
- 7.5.2.1. China
- 7.5.2.2. Japan
- 7.5.2.3. South Korea
- 7.5.2.4. India
- 7.5.2.5. Australia & New Zeland
- 7.5.2.6. Indonesia
- 7.5.2.7. Malaysia
- 7.5.2.8. Philippines
- 7.5.2.9. Singapore
- 7.5.2.10. Thailand
- 7.5.2.11. Vietnam
- 7.5.2.12. Rest of APAC
- 8. Latin America Tyrosine Kinase Inhibitors Market Analysis, Opportunity and Forecast, 2016-2032
- 8.1. Latin America Tyrosine Kinase Inhibitors Market Analysis, 2016-2021
- 8.2. Latin America Tyrosine Kinase Inhibitors Market Opportunity and Forecast, 2023-2032
- 8.3. Latin America Tyrosine Kinase Inhibitors Market Analysis, Opportunity and Forecast, By By Type, 2016-2032
- 8.3.1. Latin America Tyrosine Kinase Inhibitors Market Analysis by By Type: Introduction
- 8.3.2. Market Size Absolute $ Opportunity Analysis and Forecast, By By Type, 2016-2032
- 8.3.3. BCR-ABL Tyrosine Kinase Inhibitor
- 8.3.4. Epidermal Growth Factor Receptor (EGFR) Tyrosine Kinase Inhibitors
- 8.3.5. Vascular Endothelial Growth Factor Receptor (VEGFR) Tyrosine Kinase Inhibitors
- 8.3.6. Other Types
- 8.4. Latin America Tyrosine Kinase Inhibitors Market Analysis, Opportunity and Forecast, By By Application, 2016-2032
- 8.4.1. Latin America Tyrosine Kinase Inhibitors Market Analysis by By Application: Introduction
- 8.4.2. Market Size Absolute $ Opportunity Analysis and Forecast, By By Application, 2016-2032
- 8.4.3. Chronic Myeloid Leukemia (CML)
- 8.4.4. Lung Cancer
- 8.4.5. Breast Cancer
- 8.4.6. Renal cell cancer
- 8.4.7. Other Applications
- 8.5. Latin America Tyrosine Kinase Inhibitors Market Analysis, Opportunity and Forecast, By Country , 2016-2032
- 8.5.1. Latin America Tyrosine Kinase Inhibitors Market Analysis by Country : Introduction
- 8.5.2. Market Size Absolute $ Opportunity Analysis and Forecast, Country , 2016-2032
- 8.5.2.1. Brazil
- 8.5.2.2. Colombia
- 8.5.2.3. Chile
- 8.5.2.4. Argentina
- 8.5.2.5. Costa Rica
- 8.5.2.6. Rest of Latin America
- 9. Middle East & Africa Tyrosine Kinase Inhibitors Market Analysis, Opportunity and Forecast, 2016-2032
- 9.1. Middle East & Africa Tyrosine Kinase Inhibitors Market Analysis, 2016-2021
- 9.2. Middle East & Africa Tyrosine Kinase Inhibitors Market Opportunity and Forecast, 2023-2032
- 9.3. Middle East & Africa Tyrosine Kinase Inhibitors Market Analysis, Opportunity and Forecast, By By Type, 2016-2032
- 9.3.1. Middle East & Africa Tyrosine Kinase Inhibitors Market Analysis by By Type: Introduction
- 9.3.2. Market Size Absolute $ Opportunity Analysis and Forecast, By By Type, 2016-2032
- 9.3.3. BCR-ABL Tyrosine Kinase Inhibitor
- 9.3.4. Epidermal Growth Factor Receptor (EGFR) Tyrosine Kinase Inhibitors
- 9.3.5. Vascular Endothelial Growth Factor Receptor (VEGFR) Tyrosine Kinase Inhibitors
- 9.3.6. Other Types
- 9.4. Middle East & Africa Tyrosine Kinase Inhibitors Market Analysis, Opportunity and Forecast, By By Application, 2016-2032
- 9.4.1. Middle East & Africa Tyrosine Kinase Inhibitors Market Analysis by By Application: Introduction
- 9.4.2. Market Size Absolute $ Opportunity Analysis and Forecast, By By Application, 2016-2032
- 9.4.3. Chronic Myeloid Leukemia (CML)
- 9.4.4. Lung Cancer
- 9.4.5. Breast Cancer
- 9.4.6. Renal cell cancer
- 9.4.7. Other Applications
- 9.5. Middle East & Africa Tyrosine Kinase Inhibitors Market Analysis, Opportunity and Forecast, By Country , 2016-2032
- 9.5.1. Middle East & Africa Tyrosine Kinase Inhibitors Market Analysis by Country : Introduction
- 9.5.2. Market Size Absolute $ Opportunity Analysis and Forecast, Country , 2016-2032
- 9.5.2.1. Algeria
- 9.5.2.2. Egypt
- 9.5.2.3. Israel
- 9.5.2.4. Kuwait
- 9.5.2.5. Nigeria
- 9.5.2.6. Saudi Arabia
- 9.5.2.7. South Africa
- 9.5.2.8. Turkey
- 9.5.2.9. The UAE
- 9.5.2.10. Rest of MEA
- 10. Global Tyrosine Kinase Inhibitors Market Analysis, Opportunity and Forecast, By Region , 2016-2032
- 10.1. Global Tyrosine Kinase Inhibitors Market Analysis by Region : Introduction
- 10.2. Market Size Absolute $ Opportunity Analysis and Forecast, By Region , 2016-2032
- 10.2.1. North America
- 10.2.2. Western Europe
- 10.2.3. Eastern Europe
- 10.2.4. APAC
- 10.2.5. Latin America
- 10.2.6. Middle East & Africa
- 11. Global Tyrosine Kinase Inhibitors Market Competitive Landscape, Market Share Analysis, and Company Profiles
- 11.1. Market Share Analysis
- 11.2. Company Profiles
- 11.3. Novartis AG (Switzerland)
- 11.3.1. Company Overview
- 11.3.2. Financial Highlights
- 11.3.3. Product Portfolio
- 11.3.4. SWOT Analysis
- 11.3.5. Key Strategies and Developments
- 11.4. Endo International Inc (Ireland)
- 11.4.1. Company Overview
- 11.4.2. Financial Highlights
- 11.4.3. Product Portfolio
- 11.4.4. SWOT Analysis
- 11.4.5. Key Strategies and Developments
- 11.5. Teva Pharmaceutical Industries Ltd (Israel)
- 11.5.1. Company Overview
- 11.5.2. Financial Highlights
- 11.5.3. Product Portfolio
- 11.5.4. SWOT Analysis
- 11.5.5. Key Strategies and Developments
- 11.6. Glenmark Pharmaceuticals Ltd (India)
- 11.6.1. Company Overview
- 11.6.2. Financial Highlights
- 11.6.3. Product Portfolio
- 11.6.4. SWOT Analysis
- 11.6.5. Key Strategies and Developments
- 11.7. Cipla Inc (India)
- 11.7.1. Company Overview
- 11.7.2. Financial Highlights
- 11.7.3. Product Portfolio
- 11.7.4. SWOT Analysis
- 11.7.5. Key Strategies and Developments
- 11.8. Dr Reddy's Laboratories Ltd (India)
- 11.8.1. Company Overview
- 11.8.2. Financial Highlights
- 11.8.3. Product Portfolio
- 11.8.4. SWOT Analysis
- 11.8.5. Key Strategies and Developments
- 11.9. Abbott (U.S.)
- 11.9.1. Company Overview
- 11.9.2. Financial Highlights
- 11.9.3. Product Portfolio
- 11.9.4. SWOT Analysis
- 11.9.5. Key Strategies and Developments
- 11.10. F. Hoffmann-La Roche Ltd (Switzerland)
- 11.10.1. Company Overview
- 11.10.2. Financial Highlights
- 11.10.3. Product Portfolio
- 11.10.4. SWOT Analysis
- 11.10.5. Key Strategies and Developments
- 11.11. Pfizer Inc (U.S.)
- 11.11.1. Company Overview
- 11.11.2. Financial Highlights
- 11.11.3. Product Portfolio
- 11.11.4. SWOT Analysis
- 11.11.5. Key Strategies and Developments
- 11.12. Lupin (India)
- 11.12.1. Company Overview
- 11.12.2. Financial Highlights
- 11.12.3. Product Portfolio
- 11.12.4. SWOT Analysis
- 11.12.5. Key Strategies and Developments
- 11.13.1. Company Overview
- 11.13.2. Financial Highlights
- 11.13.3. Product Portfolio
- 11.13.4. SWOT Analysis
- 11.13.5. Key Strategies and Developments
- 11.14. Takeda Pharmaceutical Company Limited (Japan)
- 11.14.1. Company Overview
- 11.14.2. Financial Highlights
- 11.14.3. Product Portfolio
- 11.14.4. SWOT Analysis
- 11.14.5. Key Strategies and Developments
- 11.15. Torrent Pharmaceuticals Ltd. (India)
- 11.15.1. Company Overview
- 11.15.2. Financial Highlights
- 11.15.3. Product Portfolio
- 11.15.4. SWOT Analysis
- 11.15.5. Key Strategies and Developments
- 11.16. Amneal Pharmaceuticals LLC. (U.S.)
- 11.16.1. Company Overview
- 11.16.2. Financial Highlights
- 11.16.3. Product Portfolio
- 11.16.4. SWOT Analysis
- 11.16.5. Key Strategies and Developments
- 11.17. Astellas Pharma Inc. (Japan)
- 11.17.1. Company Overview
- 11.17.2. Financial Highlights
- 11.17.3. Product Portfolio
- 11.17.4. SWOT Analysis
- 11.17.5. Key Strategies and Developments
- 11.18. Sierra Oncology, Inc (Canada)
- 11.18.1. Company Overview
- 11.18.2. Financial Highlights
- 11.18.3. Product Portfolio
- 11.18.4. SWOT Analysis
- 11.18.5. Key Strategies and Developments
- 12. Assumptions and Acronyms
- 13. Research Methodology
- 14. Contact
"
- List of Figures
- "
- Figure 1: Global Tyrosine Kinase Inhibitors Market Revenue (US$ Mn) Market Share by By Type in 2022
- Figure 2: Global Tyrosine Kinase Inhibitors Market Market Attractiveness Analysis by By Type, 2016-2032
- Figure 3: Global Tyrosine Kinase Inhibitors Market Revenue (US$ Mn) Market Share by By Applicationin 2022
- Figure 4: Global Tyrosine Kinase Inhibitors Market Market Attractiveness Analysis by By Application, 2016-2032
- Figure 5: Global Tyrosine Kinase Inhibitors Market Revenue (US$ Mn) Market Share by Region in 2022
- Figure 6: Global Tyrosine Kinase Inhibitors Market Market Attractiveness Analysis by Region, 2016-2032
- Figure 7: Global Tyrosine Kinase Inhibitors Market Market Revenue (US$ Mn) (2016-2032)
- Figure 8: Global Tyrosine Kinase Inhibitors Market Market Revenue (US$ Mn) Comparison by Region (2016-2032)
- Figure 9: Global Tyrosine Kinase Inhibitors Market Market Revenue (US$ Mn) Comparison by By Type (2016-2032)
- Figure 10: Global Tyrosine Kinase Inhibitors Market Market Revenue (US$ Mn) Comparison by By Application (2016-2032)
- Figure 11: Global Tyrosine Kinase Inhibitors Market Market Y-o-Y Growth Rate Comparison by Region (2016-2032)
- Figure 12: Global Tyrosine Kinase Inhibitors Market Market Y-o-Y Growth Rate Comparison by By Type (2016-2032)
- Figure 13: Global Tyrosine Kinase Inhibitors Market Market Y-o-Y Growth Rate Comparison by By Application (2016-2032)
- Figure 14: Global Tyrosine Kinase Inhibitors Market Market Share Comparison by Region (2016-2032)
- Figure 15: Global Tyrosine Kinase Inhibitors Market Market Share Comparison by By Type (2016-2032)
- Figure 16: Global Tyrosine Kinase Inhibitors Market Market Share Comparison by By Application (2016-2032)
- Figure 17: North America Tyrosine Kinase Inhibitors Market Revenue (US$ Mn) Market Share by By Typein 2022
- Figure 18: North America Tyrosine Kinase Inhibitors Market Market Attractiveness Analysis by By Type, 2016-2032
- Figure 19: North America Tyrosine Kinase Inhibitors Market Revenue (US$ Mn) Market Share by By Applicationin 2022
- Figure 20: North America Tyrosine Kinase Inhibitors Market Market Attractiveness Analysis by By Application, 2016-2032
- Figure 21: North America Tyrosine Kinase Inhibitors Market Revenue (US$ Mn) Market Share by Country in 2022
- Figure 22: North America Tyrosine Kinase Inhibitors Market Market Attractiveness Analysis by Country, 2016-2032
- Figure 23: North America Tyrosine Kinase Inhibitors Market Market Revenue (US$ Mn) (2016-2032)
- Figure 24: North America Tyrosine Kinase Inhibitors Market Market Revenue (US$ Mn) Comparison by Country (2016-2032)
- Figure 25: North America Tyrosine Kinase Inhibitors Market Market Revenue (US$ Mn) Comparison by By Type (2016-2032)
- Figure 26: North America Tyrosine Kinase Inhibitors Market Market Revenue (US$ Mn) Comparison by By Application (2016-2032)
- Figure 27: North America Tyrosine Kinase Inhibitors Market Market Y-o-Y Growth Rate Comparison by Country (2016-2032)
- Figure 28: North America Tyrosine Kinase Inhibitors Market Market Y-o-Y Growth Rate Comparison by By Type (2016-2032)
- Figure 29: North America Tyrosine Kinase Inhibitors Market Market Y-o-Y Growth Rate Comparison by By Application (2016-2032)
- Figure 30: North America Tyrosine Kinase Inhibitors Market Market Share Comparison by Country (2016-2032)
- Figure 31: North America Tyrosine Kinase Inhibitors Market Market Share Comparison by By Type (2016-2032)
- Figure 32: North America Tyrosine Kinase Inhibitors Market Market Share Comparison by By Application (2016-2032)
- Figure 33: Western Europe Tyrosine Kinase Inhibitors Market Revenue (US$ Mn) Market Share by By Typein 2022
- Figure 34: Western Europe Tyrosine Kinase Inhibitors Market Market Attractiveness Analysis by By Type, 2016-2032
- Figure 35: Western Europe Tyrosine Kinase Inhibitors Market Revenue (US$ Mn) Market Share by By Applicationin 2022
- Figure 36: Western Europe Tyrosine Kinase Inhibitors Market Market Attractiveness Analysis by By Application, 2016-2032
- Figure 37: Western Europe Tyrosine Kinase Inhibitors Market Revenue (US$ Mn) Market Share by Country in 2022
- Figure 38: Western Europe Tyrosine Kinase Inhibitors Market Market Attractiveness Analysis by Country, 2016-2032
- Figure 39: Western Europe Tyrosine Kinase Inhibitors Market Market Revenue (US$ Mn) (2016-2032)
- Figure 40: Western Europe Tyrosine Kinase Inhibitors Market Market Revenue (US$ Mn) Comparison by Country (2016-2032)
- Figure 41: Western Europe Tyrosine Kinase Inhibitors Market Market Revenue (US$ Mn) Comparison by By Type (2016-2032)
- Figure 42: Western Europe Tyrosine Kinase Inhibitors Market Market Revenue (US$ Mn) Comparison by By Application (2016-2032)
- Figure 43: Western Europe Tyrosine Kinase Inhibitors Market Market Y-o-Y Growth Rate Comparison by Country (2016-2032)
- Figure 44: Western Europe Tyrosine Kinase Inhibitors Market Market Y-o-Y Growth Rate Comparison by By Type (2016-2032)
- Figure 45: Western Europe Tyrosine Kinase Inhibitors Market Market Y-o-Y Growth Rate Comparison by By Application (2016-2032)
- Figure 46: Western Europe Tyrosine Kinase Inhibitors Market Market Share Comparison by Country (2016-2032)
- Figure 47: Western Europe Tyrosine Kinase Inhibitors Market Market Share Comparison by By Type (2016-2032)
- Figure 48: Western Europe Tyrosine Kinase Inhibitors Market Market Share Comparison by By Application (2016-2032)
- Figure 49: Eastern Europe Tyrosine Kinase Inhibitors Market Revenue (US$ Mn) Market Share by By Typein 2022
- Figure 50: Eastern Europe Tyrosine Kinase Inhibitors Market Market Attractiveness Analysis by By Type, 2016-2032
- Figure 51: Eastern Europe Tyrosine Kinase Inhibitors Market Revenue (US$ Mn) Market Share by By Applicationin 2022
- Figure 52: Eastern Europe Tyrosine Kinase Inhibitors Market Market Attractiveness Analysis by By Application, 2016-2032
- Figure 53: Eastern Europe Tyrosine Kinase Inhibitors Market Revenue (US$ Mn) Market Share by Country in 2022
- Figure 54: Eastern Europe Tyrosine Kinase Inhibitors Market Market Attractiveness Analysis by Country, 2016-2032
- Figure 55: Eastern Europe Tyrosine Kinase Inhibitors Market Market Revenue (US$ Mn) (2016-2032)
- Figure 56: Eastern Europe Tyrosine Kinase Inhibitors Market Market Revenue (US$ Mn) Comparison by Country (2016-2032)
- Figure 57: Eastern Europe Tyrosine Kinase Inhibitors Market Market Revenue (US$ Mn) Comparison by By Type (2016-2032)
- Figure 58: Eastern Europe Tyrosine Kinase Inhibitors Market Market Revenue (US$ Mn) Comparison by By Application (2016-2032)
- Figure 59: Eastern Europe Tyrosine Kinase Inhibitors Market Market Y-o-Y Growth Rate Comparison by Country (2016-2032)
- Figure 60: Eastern Europe Tyrosine Kinase Inhibitors Market Market Y-o-Y Growth Rate Comparison by By Type (2016-2032)
- Figure 61: Eastern Europe Tyrosine Kinase Inhibitors Market Market Y-o-Y Growth Rate Comparison by By Application (2016-2032)
- Figure 62: Eastern Europe Tyrosine Kinase Inhibitors Market Market Share Comparison by Country (2016-2032)
- Figure 63: Eastern Europe Tyrosine Kinase Inhibitors Market Market Share Comparison by By Type (2016-2032)
- Figure 64: Eastern Europe Tyrosine Kinase Inhibitors Market Market Share Comparison by By Application (2016-2032)
- Figure 65: APAC Tyrosine Kinase Inhibitors Market Revenue (US$ Mn) Market Share by By Typein 2022
- Figure 66: APAC Tyrosine Kinase Inhibitors Market Market Attractiveness Analysis by By Type, 2016-2032
- Figure 67: APAC Tyrosine Kinase Inhibitors Market Revenue (US$ Mn) Market Share by By Applicationin 2022
- Figure 68: APAC Tyrosine Kinase Inhibitors Market Market Attractiveness Analysis by By Application, 2016-2032
- Figure 69: APAC Tyrosine Kinase Inhibitors Market Revenue (US$ Mn) Market Share by Country in 2022
- Figure 70: APAC Tyrosine Kinase Inhibitors Market Market Attractiveness Analysis by Country, 2016-2032
- Figure 71: APAC Tyrosine Kinase Inhibitors Market Market Revenue (US$ Mn) (2016-2032)
- Figure 72: APAC Tyrosine Kinase Inhibitors Market Market Revenue (US$ Mn) Comparison by Country (2016-2032)
- Figure 73: APAC Tyrosine Kinase Inhibitors Market Market Revenue (US$ Mn) Comparison by By Type (2016-2032)
- Figure 74: APAC Tyrosine Kinase Inhibitors Market Market Revenue (US$ Mn) Comparison by By Application (2016-2032)
- Figure 75: APAC Tyrosine Kinase Inhibitors Market Market Y-o-Y Growth Rate Comparison by Country (2016-2032)
- Figure 76: APAC Tyrosine Kinase Inhibitors Market Market Y-o-Y Growth Rate Comparison by By Type (2016-2032)
- Figure 77: APAC Tyrosine Kinase Inhibitors Market Market Y-o-Y Growth Rate Comparison by By Application (2016-2032)
- Figure 78: APAC Tyrosine Kinase Inhibitors Market Market Share Comparison by Country (2016-2032)
- Figure 79: APAC Tyrosine Kinase Inhibitors Market Market Share Comparison by By Type (2016-2032)
- Figure 80: APAC Tyrosine Kinase Inhibitors Market Market Share Comparison by By Application (2016-2032)
- Figure 81: Latin America Tyrosine Kinase Inhibitors Market Revenue (US$ Mn) Market Share by By Typein 2022
- Figure 82: Latin America Tyrosine Kinase Inhibitors Market Market Attractiveness Analysis by By Type, 2016-2032
- Figure 83: Latin America Tyrosine Kinase Inhibitors Market Revenue (US$ Mn) Market Share by By Applicationin 2022
- Figure 84: Latin America Tyrosine Kinase Inhibitors Market Market Attractiveness Analysis by By Application, 2016-2032
- Figure 85: Latin America Tyrosine Kinase Inhibitors Market Revenue (US$ Mn) Market Share by Country in 2022
- Figure 86: Latin America Tyrosine Kinase Inhibitors Market Market Attractiveness Analysis by Country, 2016-2032
- Figure 87: Latin America Tyrosine Kinase Inhibitors Market Market Revenue (US$ Mn) (2016-2032)
- Figure 88: Latin America Tyrosine Kinase Inhibitors Market Market Revenue (US$ Mn) Comparison by Country (2016-2032)
- Figure 89: Latin America Tyrosine Kinase Inhibitors Market Market Revenue (US$ Mn) Comparison by By Type (2016-2032)
- Figure 90: Latin America Tyrosine Kinase Inhibitors Market Market Revenue (US$ Mn) Comparison by By Application (2016-2032)
- Figure 91: Latin America Tyrosine Kinase Inhibitors Market Market Y-o-Y Growth Rate Comparison by Country (2016-2032)
- Figure 92: Latin America Tyrosine Kinase Inhibitors Market Market Y-o-Y Growth Rate Comparison by By Type (2016-2032)
- Figure 93: Latin America Tyrosine Kinase Inhibitors Market Market Y-o-Y Growth Rate Comparison by By Application (2016-2032)
- Figure 94: Latin America Tyrosine Kinase Inhibitors Market Market Share Comparison by Country (2016-2032)
- Figure 95: Latin America Tyrosine Kinase Inhibitors Market Market Share Comparison by By Type (2016-2032)
- Figure 96: Latin America Tyrosine Kinase Inhibitors Market Market Share Comparison by By Application (2016-2032)
- Figure 97: Middle East & Africa Tyrosine Kinase Inhibitors Market Revenue (US$ Mn) Market Share by By Typein 2022
- Figure 98: Middle East & Africa Tyrosine Kinase Inhibitors Market Market Attractiveness Analysis by By Type, 2016-2032
- Figure 99: Middle East & Africa Tyrosine Kinase Inhibitors Market Revenue (US$ Mn) Market Share by By Applicationin 2022
- Figure 100: Middle East & Africa Tyrosine Kinase Inhibitors Market Market Attractiveness Analysis by By Application, 2016-2032
- Figure 101: Middle East & Africa Tyrosine Kinase Inhibitors Market Revenue (US$ Mn) Market Share by Country in 2022
- Figure 102: Middle East & Africa Tyrosine Kinase Inhibitors Market Market Attractiveness Analysis by Country, 2016-2032
- Figure 103: Middle East & Africa Tyrosine Kinase Inhibitors Market Market Revenue (US$ Mn) (2016-2032)
- Figure 104: Middle East & Africa Tyrosine Kinase Inhibitors Market Market Revenue (US$ Mn) Comparison by Country (2016-2032)
- Figure 105: Middle East & Africa Tyrosine Kinase Inhibitors Market Market Revenue (US$ Mn) Comparison by By Type (2016-2032)
- Figure 106: Middle East & Africa Tyrosine Kinase Inhibitors Market Market Revenue (US$ Mn) Comparison by By Application (2016-2032)
- Figure 107: Middle East & Africa Tyrosine Kinase Inhibitors Market Market Y-o-Y Growth Rate Comparison by Country (2016-2032)
- Figure 108: Middle East & Africa Tyrosine Kinase Inhibitors Market Market Y-o-Y Growth Rate Comparison by By Type (2016-2032)
- Figure 109: Middle East & Africa Tyrosine Kinase Inhibitors Market Market Y-o-Y Growth Rate Comparison by By Application (2016-2032)
- Figure 110: Middle East & Africa Tyrosine Kinase Inhibitors Market Market Share Comparison by Country (2016-2032)
- Figure 111: Middle East & Africa Tyrosine Kinase Inhibitors Market Market Share Comparison by By Type (2016-2032)
- Figure 112: Middle East & Africa Tyrosine Kinase Inhibitors Market Market Share Comparison by By Application (2016-2032)
"
- List of Tables
- "
- Table 1: Global Tyrosine Kinase Inhibitors Market Market Comparison by By Type (2016-2032)
- Table 2: Global Tyrosine Kinase Inhibitors Market Market Comparison by By Application (2016-2032)
- Table 3: Global Tyrosine Kinase Inhibitors Market Revenue (US$ Mn) Comparison by Region (2016-2032)
- Table 4: Global Tyrosine Kinase Inhibitors Market Market Revenue (US$ Mn) (2016-2032)
- Table 5: Global Tyrosine Kinase Inhibitors Market Market Revenue (US$ Mn) Comparison by Region (2016-2032)
- Table 6: Global Tyrosine Kinase Inhibitors Market Market Revenue (US$ Mn) Comparison by By Type (2016-2032)
- Table 7: Global Tyrosine Kinase Inhibitors Market Market Revenue (US$ Mn) Comparison by By Application (2016-2032)
- Table 8: Global Tyrosine Kinase Inhibitors Market Market Y-o-Y Growth Rate Comparison by Region (2016-2032)
- Table 9: Global Tyrosine Kinase Inhibitors Market Market Y-o-Y Growth Rate Comparison by By Type (2016-2032)
- Table 10: Global Tyrosine Kinase Inhibitors Market Market Y-o-Y Growth Rate Comparison by By Application (2016-2032)
- Table 11: Global Tyrosine Kinase Inhibitors Market Market Share Comparison by Region (2016-2032)
- Table 12: Global Tyrosine Kinase Inhibitors Market Market Share Comparison by By Type (2016-2032)
- Table 13: Global Tyrosine Kinase Inhibitors Market Market Share Comparison by By Application (2016-2032)
- Table 14: North America Tyrosine Kinase Inhibitors Market Market Comparison by By Application (2016-2032)
- Table 15: North America Tyrosine Kinase Inhibitors Market Revenue (US$ Mn) Comparison by Country (2016-2032)
- Table 16: North America Tyrosine Kinase Inhibitors Market Market Revenue (US$ Mn) (2016-2032)
- Table 17: North America Tyrosine Kinase Inhibitors Market Market Revenue (US$ Mn) Comparison by Country (2016-2032)
- Table 18: North America Tyrosine Kinase Inhibitors Market Market Revenue (US$ Mn) Comparison by By Type (2016-2032)
- Table 19: North America Tyrosine Kinase Inhibitors Market Market Revenue (US$ Mn) Comparison by By Application (2016-2032)
- Table 20: North America Tyrosine Kinase Inhibitors Market Market Y-o-Y Growth Rate Comparison by Country (2016-2032)
- Table 21: North America Tyrosine Kinase Inhibitors Market Market Y-o-Y Growth Rate Comparison by By Type (2016-2032)
- Table 22: North America Tyrosine Kinase Inhibitors Market Market Y-o-Y Growth Rate Comparison by By Application (2016-2032)
- Table 23: North America Tyrosine Kinase Inhibitors Market Market Share Comparison by Country (2016-2032)
- Table 24: North America Tyrosine Kinase Inhibitors Market Market Share Comparison by By Type (2016-2032)
- Table 25: North America Tyrosine Kinase Inhibitors Market Market Share Comparison by By Application (2016-2032)
- Table 26: Western Europe Tyrosine Kinase Inhibitors Market Market Comparison by By Type (2016-2032)
- Table 27: Western Europe Tyrosine Kinase Inhibitors Market Market Comparison by By Application (2016-2032)
- Table 28: Western Europe Tyrosine Kinase Inhibitors Market Revenue (US$ Mn) Comparison by Country (2016-2032)
- Table 29: Western Europe Tyrosine Kinase Inhibitors Market Market Revenue (US$ Mn) (2016-2032)
- Table 30: Western Europe Tyrosine Kinase Inhibitors Market Market Revenue (US$ Mn) Comparison by Country (2016-2032)
- Table 31: Western Europe Tyrosine Kinase Inhibitors Market Market Revenue (US$ Mn) Comparison by By Type (2016-2032)
- Table 32: Western Europe Tyrosine Kinase Inhibitors Market Market Revenue (US$ Mn) Comparison by By Application (2016-2032)
- Table 33: Western Europe Tyrosine Kinase Inhibitors Market Market Y-o-Y Growth Rate Comparison by Country (2016-2032)
- Table 34: Western Europe Tyrosine Kinase Inhibitors Market Market Y-o-Y Growth Rate Comparison by By Type (2016-2032)
- Table 35: Western Europe Tyrosine Kinase Inhibitors Market Market Y-o-Y Growth Rate Comparison by By Application (2016-2032)
- Table 36: Western Europe Tyrosine Kinase Inhibitors Market Market Share Comparison by Country (2016-2032)
- Table 37: Western Europe Tyrosine Kinase Inhibitors Market Market Share Comparison by By Type (2016-2032)
- Table 38: Western Europe Tyrosine Kinase Inhibitors Market Market Share Comparison by By Application (2016-2032)
- Table 39: Eastern Europe Tyrosine Kinase Inhibitors Market Market Comparison by By Type (2016-2032)
- Table 40: Eastern Europe Tyrosine Kinase Inhibitors Market Market Comparison by By Application (2016-2032)
- Table 41: Eastern Europe Tyrosine Kinase Inhibitors Market Revenue (US$ Mn) Comparison by Country (2016-2032)
- Table 42: Eastern Europe Tyrosine Kinase Inhibitors Market Market Revenue (US$ Mn) (2016-2032)
- Table 43: Eastern Europe Tyrosine Kinase Inhibitors Market Market Revenue (US$ Mn) Comparison by Country (2016-2032)
- Table 44: Eastern Europe Tyrosine Kinase Inhibitors Market Market Revenue (US$ Mn) Comparison by By Type (2016-2032)
- Table 45: Eastern Europe Tyrosine Kinase Inhibitors Market Market Revenue (US$ Mn) Comparison by By Application (2016-2032)
- Table 46: Eastern Europe Tyrosine Kinase Inhibitors Market Market Y-o-Y Growth Rate Comparison by Country (2016-2032)
- Table 47: Eastern Europe Tyrosine Kinase Inhibitors Market Market Y-o-Y Growth Rate Comparison by By Type (2016-2032)
- Table 48: Eastern Europe Tyrosine Kinase Inhibitors Market Market Y-o-Y Growth Rate Comparison by By Application (2016-2032)
- Table 49: Eastern Europe Tyrosine Kinase Inhibitors Market Market Share Comparison by Country (2016-2032)
- Table 50: Eastern Europe Tyrosine Kinase Inhibitors Market Market Share Comparison by By Type (2016-2032)
- Table 51: Eastern Europe Tyrosine Kinase Inhibitors Market Market Share Comparison by By Application (2016-2032)
- Table 52: APAC Tyrosine Kinase Inhibitors Market Market Comparison by By Type (2016-2032)
- Table 53: APAC Tyrosine Kinase Inhibitors Market Market Comparison by By Application (2016-2032)
- Table 54: APAC Tyrosine Kinase Inhibitors Market Revenue (US$ Mn) Comparison by Country (2016-2032)
- Table 55: APAC Tyrosine Kinase Inhibitors Market Market Revenue (US$ Mn) (2016-2032)
- Table 56: APAC Tyrosine Kinase Inhibitors Market Market Revenue (US$ Mn) Comparison by Country (2016-2032)
- Table 57: APAC Tyrosine Kinase Inhibitors Market Market Revenue (US$ Mn) Comparison by By Type (2016-2032)
- Table 58: APAC Tyrosine Kinase Inhibitors Market Market Revenue (US$ Mn) Comparison by By Application (2016-2032)
- Table 59: APAC Tyrosine Kinase Inhibitors Market Market Y-o-Y Growth Rate Comparison by Country (2016-2032)
- Table 60: APAC Tyrosine Kinase Inhibitors Market Market Y-o-Y Growth Rate Comparison by By Type (2016-2032)
- Table 61: APAC Tyrosine Kinase Inhibitors Market Market Y-o-Y Growth Rate Comparison by By Application (2016-2032)
- Table 62: APAC Tyrosine Kinase Inhibitors Market Market Share Comparison by Country (2016-2032)
- Table 63: APAC Tyrosine Kinase Inhibitors Market Market Share Comparison by By Type (2016-2032)
- Table 64: APAC Tyrosine Kinase Inhibitors Market Market Share Comparison by By Application (2016-2032)
- Table 65: Latin America Tyrosine Kinase Inhibitors Market Market Comparison by By Type (2016-2032)
- Table 66: Latin America Tyrosine Kinase Inhibitors Market Market Comparison by By Application (2016-2032)
- Table 67: Latin America Tyrosine Kinase Inhibitors Market Revenue (US$ Mn) Comparison by Country (2016-2032)
- Table 68: Latin America Tyrosine Kinase Inhibitors Market Market Revenue (US$ Mn) (2016-2032)
- Table 69: Latin America Tyrosine Kinase Inhibitors Market Market Revenue (US$ Mn) Comparison by Country (2016-2032)
- Table 70: Latin America Tyrosine Kinase Inhibitors Market Market Revenue (US$ Mn) Comparison by By Type (2016-2032)
- Table 71: Latin America Tyrosine Kinase Inhibitors Market Market Revenue (US$ Mn) Comparison by By Application (2016-2032)
- Table 72: Latin America Tyrosine Kinase Inhibitors Market Market Y-o-Y Growth Rate Comparison by Country (2016-2032)
- Table 73: Latin America Tyrosine Kinase Inhibitors Market Market Y-o-Y Growth Rate Comparison by By Type (2016-2032)
- Table 74: Latin America Tyrosine Kinase Inhibitors Market Market Y-o-Y Growth Rate Comparison by By Application (2016-2032)
- Table 75: Latin America Tyrosine Kinase Inhibitors Market Market Share Comparison by Country (2016-2032)
- Table 76: Latin America Tyrosine Kinase Inhibitors Market Market Share Comparison by By Type (2016-2032)
- Table 77: Latin America Tyrosine Kinase Inhibitors Market Market Share Comparison by By Application (2016-2032)
- Table 78: Middle East & Africa Tyrosine Kinase Inhibitors Market Market Comparison by By Type (2016-2032)
- Table 79: Middle East & Africa Tyrosine Kinase Inhibitors Market Market Comparison by By Application (2016-2032)
- Table 80: Middle East & Africa Tyrosine Kinase Inhibitors Market Revenue (US$ Mn) Comparison by Country (2016-2032)
- Table 81: Middle East & Africa Tyrosine Kinase Inhibitors Market Market Revenue (US$ Mn) (2016-2032)
- Table 82: Middle East & Africa Tyrosine Kinase Inhibitors Market Market Revenue (US$ Mn) Comparison by Country (2016-2032)
- Table 83: Middle East & Africa Tyrosine Kinase Inhibitors Market Market Revenue (US$ Mn) Comparison by By Type (2016-2032)
- Table 84: Middle East & Africa Tyrosine Kinase Inhibitors Market Market Revenue (US$ Mn) Comparison by By Application (2016-2032)
- Table 85: Middle East & Africa Tyrosine Kinase Inhibitors Market Market Y-o-Y Growth Rate Comparison by Country (2016-2032)
- Table 86: Middle East & Africa Tyrosine Kinase Inhibitors Market Market Y-o-Y Growth Rate Comparison by By Type (2016-2032)
- Table 87: Middle East & Africa Tyrosine Kinase Inhibitors Market Market Y-o-Y Growth Rate Comparison by By Application (2016-2032)
- Table 88: Middle East & Africa Tyrosine Kinase Inhibitors Market Market Share Comparison by Country (2016-2032)
- Table 89: Middle East & Africa Tyrosine Kinase Inhibitors Market Market Share Comparison by By Type (2016-2032)
- Table 90: Middle East & Africa Tyrosine Kinase Inhibitors Market Market Share Comparison by By Application (2016-2032)
- 1. Executive Summary
-
- Novartis AG (Switzerland)
- Endo International Inc (Ireland)
- Teva Pharmaceutical Industries Ltd (Israel)
- Glenmark Pharmaceuticals Ltd (India)
- Cipla Inc (India)
- Dr Reddy's Laboratories Ltd (India)
- Abbott (U.S.)
- F. Hoffmann-La Roche Ltd (Switzerland)
- Pfizer Inc (U.S.)
- Lupin (India)
- Takeda Pharmaceutical Company Limited (Japan)
- Akorn, Incorporated (U.S.)
- Torrent Pharmaceuticals Ltd. (India)
- Amneal Pharmaceuticals LLC. (U.S.)
- Astellas Pharma Inc. (Japan)
- Sierra Oncology, Inc (Canada)
Our Clients


View Our Licence Options
