
Transaction Monitoring Market By Deployment Mode (On-premise and Cloud), By Enterprises Size (Small and Medium-sized Enterprises and Large Enterprises), By Application (Fraud detection and prevention, Anti-money laundering, Compliance management, Customer identity management), By Function (Dashboard and reporting, Case management, Watch list screening, KYC/customer onboarding), By Vertical , By Region and Companies - Industry Segment Outlook, Market Assessment, Competition Scenario, Trends and Forecast 2024-2033
-
48105
-
June 2024
-
300
-


-
This report was compiled by Vishwa Gaul Vishwa is an experienced market research and consulting professional with over 8 years of expertise in the ICT industry, contributing to over 700 reports across telecommunications, software, hardware, and digital solutions. Correspondence Team Lead- ICT Linkedin | Detailed Market research Methodology Our methodology involves a mix of primary research, including interviews with leading mental health experts, and secondary research from reputable medical journals and databases. View Detailed Methodology Page
-
Quick Navigation
- Report Overview
- Key Takeaways
- Driving factors
- Restraining Factors
- By Component Analysis
- By Deployment Mode Analysis
- By Enterprises Size Analysis
- By Application Analysis
- By Function Analysis
- By Vertical Analysis
- Key Market Segments
- Growth Opportunity
- Latest Trends
- Regional Analysis
- Key Players Analysis
- Recent Development
- Report Scope
Report Overview
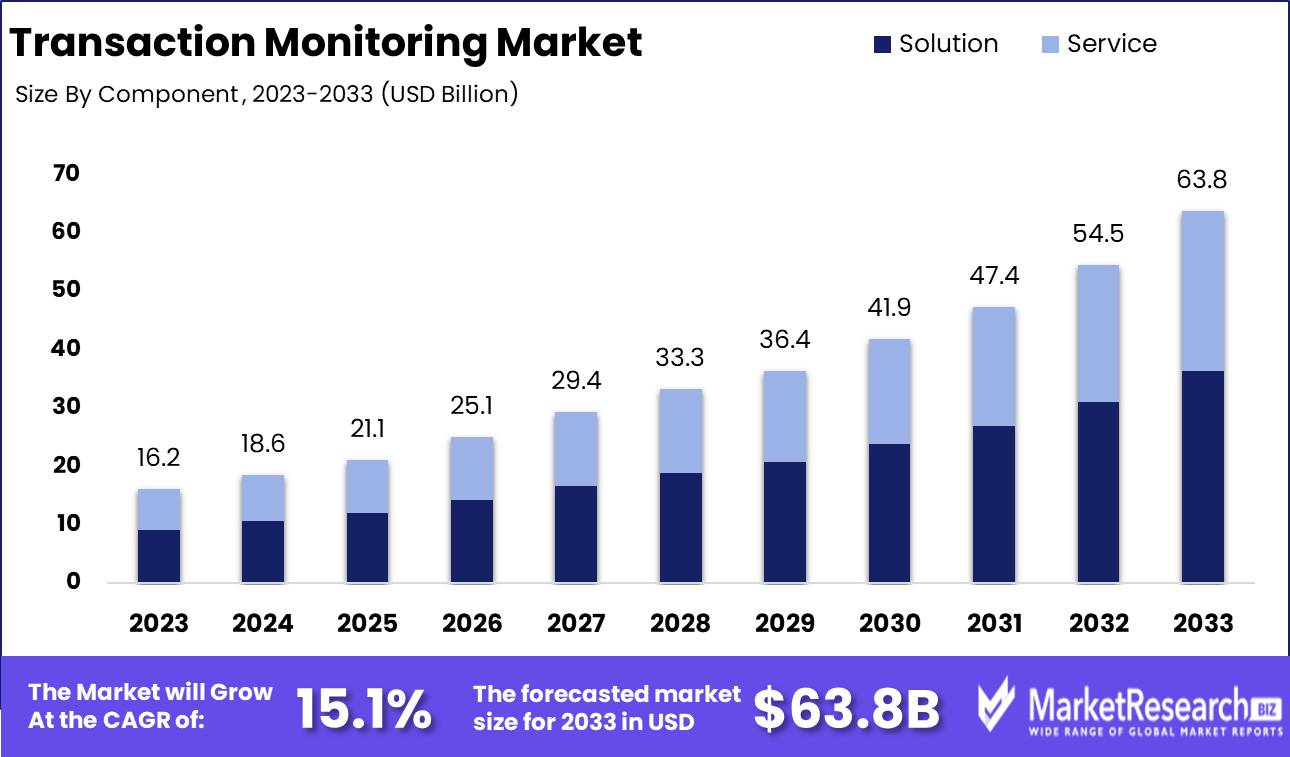
The Transaction Monitoring Market was valued at USD 16.2 billion in 2023. It is expected to reach USD 63.8 billion by 2033, with a CAGR of 15.1% during the forecast period from 2024 to 2033.
The Transaction Monitoring Market encompasses solutions and services designed to scrutinize financial transactions in real-time or batch processing to detect suspicious activities, ensuring compliance with regulatory requirements and preventing financial crimes. This market integrates advanced technologies like artificial intelligence, machine learning, and big data analytics to enhance the detection accuracy of fraudulent activities, money laundering, and other illicit financial behaviors. With rising regulatory demands and increasing instances of financial fraud, organizations are prioritizing robust transaction monitoring systems to safeguard their financial integrity, maintain regulatory compliance, and enhance overall security measures within the financial ecosystem.
The transaction monitoring market is poised for significant growth, driven by an interplay of regulatory pressures and the rapid proliferation of digital transactions. Stringent regulatory frameworks such as the EU’s Fifth Anti-Money Laundering Directive (AMLD5) and the US’s Bank Secrecy Act are primary catalysts, compelling financial institutions to adopt advanced transaction monitoring solutions. These regulations mandate rigorous oversight and reporting of suspicious activities, thereby necessitating the deployment of sophisticated monitoring systems to ensure compliance and mitigate risks. Financial institutions are increasingly prioritizing investment in these technologies to navigate the complexities of global regulatory landscapes effectively.
Additionally, the exponential rise in digital transactions, fueled by the surge in online and mobile banking, e-commerce, and digital payments, underscores the critical need for robust transaction monitoring systems. As digital financial ecosystems expand, the volume and velocity of transactions present heightened challenges in detecting fraudulent activities and ensuring transactional integrity. Organizations are therefore compelled to implement dynamic, scalable monitoring solutions capable of real-time analysis and threat detection.
The convergence of regulatory imperatives and the digital transaction boom is expected to drive substantial advancements in transaction monitoring technologies, fostering innovation and enhancing security measures across the financial sector. This growth trajectory reflects a broader industry shift towards integrating advanced analytics and machine learning to anticipate and respond to evolving financial crime threats proactively.
Key Takeaways
- Market Growth: The Transaction Monitoring Market was valued at USD 16.2 billion in 2023. It is expected to reach USD 63.8 billion by 2033, with a CAGR of 15.1% during the forecast period from 2024 to 2033.
- By Component: Solution dominates the Transaction Monitoring Market with comprehensive solutions and services.
- By Deployment Mode: Cloud solutions dominated transaction monitoring with superior scalability.
- By Enterprises Size: SMEs dominated transaction monitoring, crucial for all enterprise sizes.
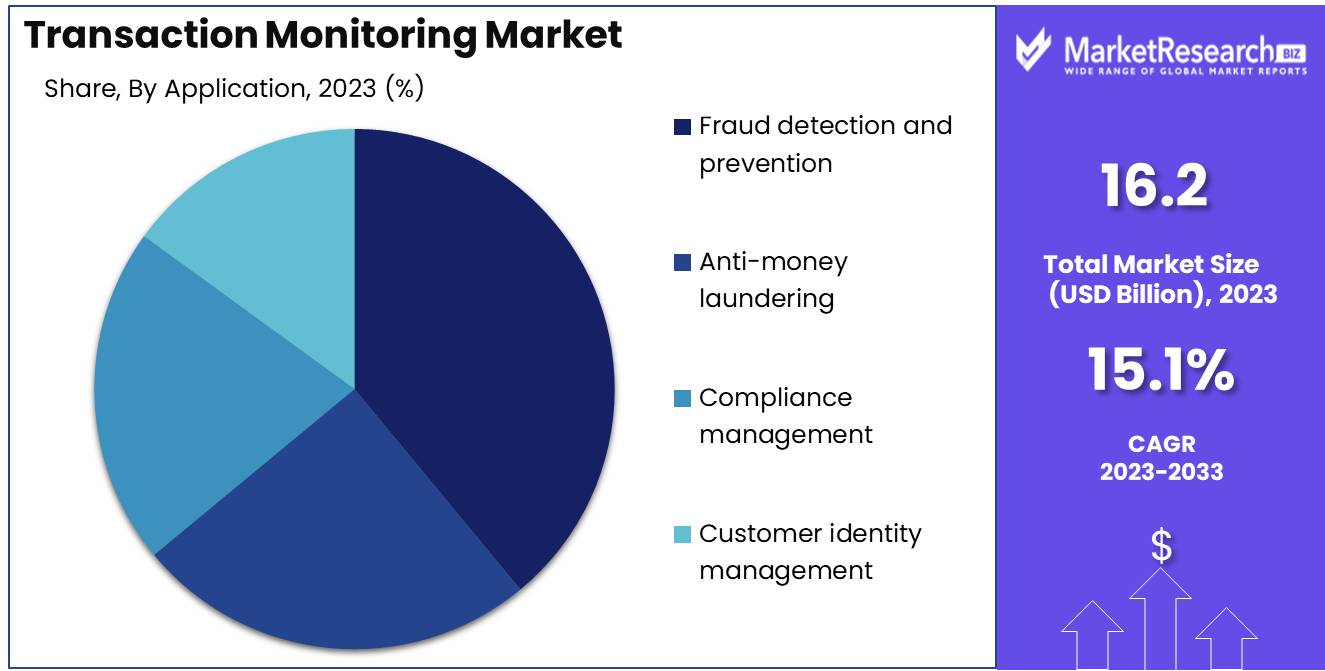
- By Application: Fraud detection and Prevention dominated transaction monitoring applications.
- By Function: Dashboard and Reporting dominated the Transaction Monitoring Market functions.
- By Vertical: Banking and Financial Services dominated the Transaction Monitoring Market.
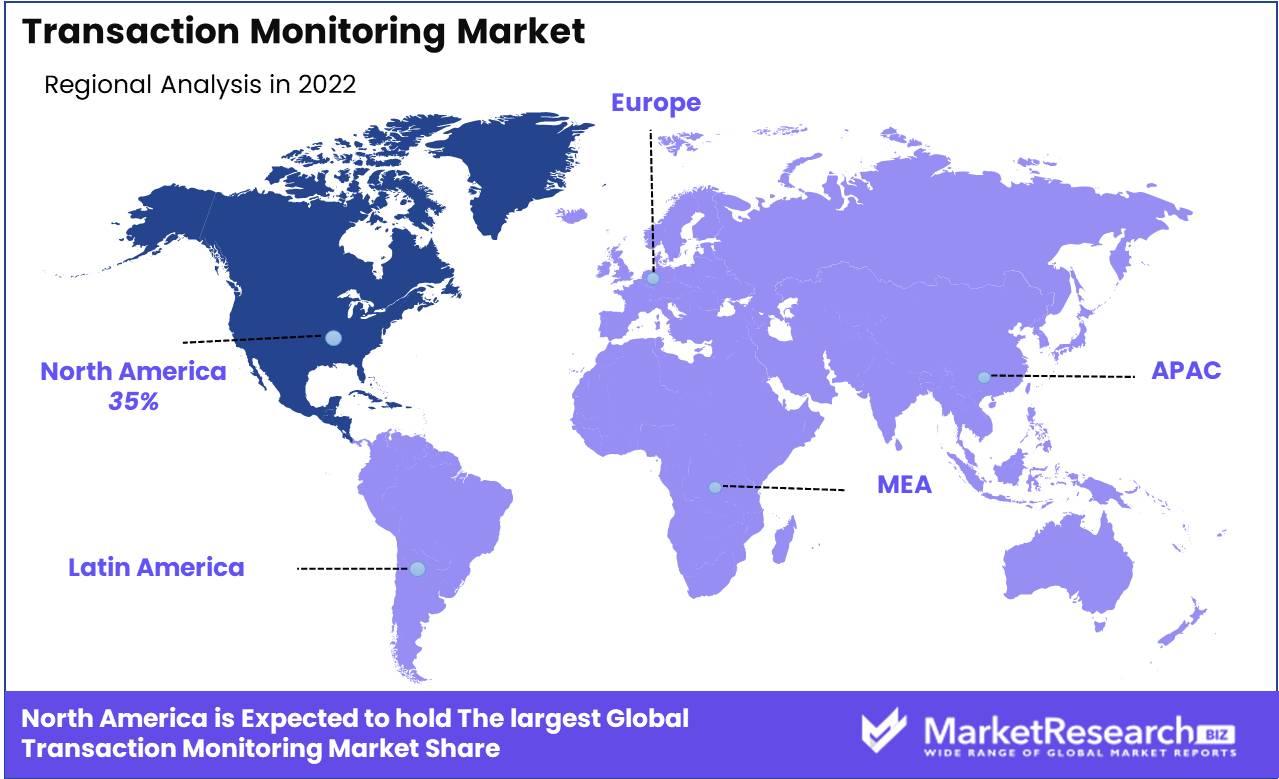
- Regional Dominance: North America dominates the global transaction monitoring market with 35% share.
- Growth Opportunity: The transaction monitoring market will grow due to advanced analytics, AI/ML, and increasing real-time monitoring demands.
Driving factors
Stringent Regulatory Compliance Requirements Fuel Market Growth
The escalating stringency of regulatory compliance requirements is a primary driver of growth in the transaction monitoring market. Regulatory bodies worldwide, including the Financial Action Task Force (FATF) and the European Union's Anti-Money Laundering Directives (AMLD), continuously enhance regulations to combat money laundering, terrorist financing, and other financial crimes. These regulations necessitate that financial institutions implement robust transaction monitoring systems to detect and report suspicious activities. Consequently, organizations are increasingly investing in advanced transaction monitoring solutions to ensure compliance, thereby driving market expansion.
Financial Penalties and Reputational Damage Drive Adoption of Advanced Solutions
The severe financial penalties, reputational damage, and potential legal action associated with non-compliance are significant motivators for adopting transaction monitoring systems. Financial institutions face hefty fines if they fail to comply with regulatory requirements. For example, in 2020, major banks globally paid over $10 billion in fines related to anti-money laundering violations. Beyond financial loss, non-compliance can severely damage an institution's reputation, eroding customer trust and loyalty. Legal repercussions can also be extensive, involving prolonged litigation and operational disruptions. As a result, institutions are compelled to invest in advanced transaction monitoring systems that offer real-time surveillance and comprehensive reporting capabilities, thereby mitigating risks and ensuring compliance.
Rising Demand from the Healthcare Sector Boosts Market Growth
The increasing demand from the healthcare sector is another pivotal factor contributing to the growth of the transaction monitoring market. The healthcare industry, dealing with a substantial volume of transactions, is vulnerable to financial crimes such as billing fraud, identity theft, and money laundering. Regulatory frameworks like the Health Insurance Portability and Accountability Act (HIPAA) in the United States require stringent monitoring of financial transactions to protect patient data and prevent fraud. Healthcare providers are thus adopting advanced transaction monitoring systems to enhance security, comply with regulations, and ensure the integrity of their financial operations. This sector's growing reliance on digital transactions and electronic health records further propels the need for robust monitoring solutions, driving market growth.
Restraining Factors
Technological Complexities and Sophistication of Attacks Hamper Market Expansion
The increased technological complexities and the sophistication of cyber-attacks pose significant challenges to the growth of the Transaction Monitoring Market. As cyber criminals employ more advanced and elusive techniques, transaction monitoring systems must continually evolve to keep pace. This relentless arms race necessitates substantial investment in cutting-edge technology, skilled personnel, and continuous system upgrades, which can be financially draining and operationally taxing for organizations. The sophistication of attacks also demands more robust and sophisticated transaction monitoring solutions, which are often more expensive and require advanced integration and maintenance. Consequently, smaller firms or those with limited budgets may find adopting or upgrading to these advanced systems challenging, slowing overall market growth.
Furthermore, as the complexity of these systems increases, so does the difficulty of their implementation and maintenance. This complexity can lead to longer deployment times and a steeper learning curve for users, resulting in resistance or delays in adoption. The market's ability to scale and penetrate different sectors is therefore hindered, as businesses may struggle to justify the substantial investment required to stay ahead of increasingly sophisticated threats.
Data Quality and Integration Issues Stymie Market Progress
Data quality and integration issues present another formidable barrier to the growth of the Transaction Monitoring Market. Effective transaction monitoring relies heavily on the accuracy, completeness, and timeliness of data from various sources. However, organizations often face challenges with data silos, inconsistent data formats, and poor data quality, which can significantly impair the effectiveness of transaction monitoring systems.
For instance, if data from disparate sources cannot be seamlessly integrated, the system's ability to detect and respond to suspicious activities in real time is compromised. This not only diminishes the effectiveness of the monitoring system but also undermines confidence in its reliability, deterring organizations from investing in these solutions. Additionally, poor data quality can lead to false positives and negatives, increasing the workload for compliance teams and potentially missing actual threats, which further dissuades companies from adopting or upgrading transaction monitoring systems.
By Component Analysis
Solution dominates the Transaction Monitoring Market with comprehensive solutions and services.
In 2023, Solution held a dominant market position in the By Component segment of the Transaction Monitoring Market, encompassing both the Solution and Service subpoints. The Solution sub-segment includes advanced software and platforms designed to enhance the detection and prevention of fraudulent activities, money laundering, and suspicious transactions. These solutions leverage machine learning, artificial intelligence, and real-time data analytics to provide comprehensive monitoring and risk assessment. Leading companies in this space have prioritized user-friendly interfaces and seamless integration with existing financial systems, significantly driving market growth.
Simultaneously, the Service sub-segment complements these technological offerings by providing essential support, including implementation, maintenance, training, and consulting services. This ensures that organizations can maximize the effectiveness of their transaction monitoring systems. The high demand for expert consultation and ongoing technical support has bolstered the service sub-segment, as companies seek to navigate the complexities of regulatory compliance and rapidly evolving financial threats.
By Deployment Mode Analysis
In 2023, Cloud solutions dominated transaction monitoring with superior scalability.
In 2023, Cloud solutions held a dominant market position in the 'By Deployment Mode' segment of the Transaction Monitoring Market. The adoption of cloud-based transaction monitoring systems has surged due to their scalability, cost-efficiency, and enhanced data security. Enterprises, particularly in financial services and retail, are increasingly leveraging cloud platforms to ensure real-time monitoring and compliance with regulatory standards. Cloud solutions offer seamless integration with existing IT infrastructure and provide advanced analytics capabilities, which are crucial for detecting and mitigating fraudulent activities.
Conversely, on-premise deployment, while still relevant, is witnessing a gradual decline in preference. Organizations that prioritize stringent control over data and possess the necessary resources for maintenance often opt for on-premise solutions. These setups offer enhanced customization and direct oversight but at a higher cost and with increased operational complexity.
By Enterprises Size Analysis
In 2023, SMEs dominated transaction monitoring, crucial for all enterprise sizes.
In 2023, Small and Medium-sized Enterprises (SMEs) held a dominant market position in the By Enterprises Size segment of the Transaction Monitoring Market. SMEs, with their agile business structures and increasing adoption of advanced technologies, contributed significantly to market growth. These enterprises are increasingly recognizing the importance of robust transaction monitoring solutions to mitigate risks associated with financial fraud and compliance issues. Their investment in sophisticated monitoring tools is driven by the need to protect against emerging threats and to ensure regulatory adherence, thereby fostering trust and operational integrity.
Conversely, Large Enterprises also played a crucial role in this segment. These organizations, characterized by their extensive transaction volumes and complex operational frameworks, necessitate comprehensive and scalable transaction monitoring systems. The substantial financial resources of large enterprises enable them to invest in cutting-edge technologies and customized solutions, thereby enhancing their capabilities in detecting and preventing fraudulent activities. Furthermore, the regulatory landscape for large corporations is stringent, compelling them to implement robust monitoring systems to maintain compliance and avoid hefty penalties.
By Application Analysis
In 2023, Fraud Detection and Prevention dominated transaction monitoring applications.
In 2023, Fraud Detection and Prevention held a dominant market position in the By Application segment of the Transaction Monitoring Market. This segment is critical as organizations increasingly prioritize safeguarding financial transactions from fraudulent activities. Leveraging advanced analytics, machine learning, and artificial intelligence, fraud detection, and prevention solutions offer robust capabilities to identify and mitigate suspicious activities in real-time.
Anti-money laundering (AML) follows closely, driven by stringent regulatory requirements and the growing need for comprehensive financial crime compliance. AML solutions enable institutions to detect, report, and prevent money laundering activities, ensuring adherence to national and international regulations.
Compliance management is another crucial application, that addresses the increasing complexity of regulatory landscapes. Businesses rely on these solutions to streamline compliance processes, reduce risk exposure, and maintain operational integrity. Effective compliance management systems help organizations avoid hefty fines and reputational damage by ensuring adherence to evolving regulatory standards.
Lastly, Customer identity management solutions are gaining traction as organizations focus on enhancing customer experience while maintaining security. These systems ensure accurate customer verification, reducing fraud risks and improving customer trust. By leveraging biometric authentication, blockchain, and secure digital identities, these solutions provide a seamless yet secure transactional environment.
By Function Analysis
In 2023, Dashboard and Reporting dominated the Transaction Monitoring Market functions.
In 2023, Dashboard and Reporting held a dominant market position in the By Function segment of the Transaction Monitoring Market. This segment's prominence can be attributed to the growing demand for real-time analytics and actionable insights, enabling businesses to enhance their decision-making processes. Case Management also played a critical role, facilitating the efficient investigation and resolution of suspicious activities. This function's value lies in its ability to streamline compliance workflows, reduce manual errors, and ensure regulatory adherence.
Watch List Screening remained essential for identifying and managing high-risk entities, leveraging advanced algorithms and comprehensive databases to mitigate potential threats. This function's effectiveness in preventing fraudulent activities and maintaining operational integrity is widely recognized.
KYC/Customer Onboarding continues to be vital, ensuring thorough verification of customer identities and fostering trust in financial transactions. By implementing robust KYC processes, businesses can enhance customer experience, reduce onboarding times, and comply with stringent regulatory requirements. Collectively, these functions contribute to a holistic approach to transaction monitoring, underscoring the importance of comprehensive, integrated solutions in maintaining financial security and compliance.
By Vertical Analysis
In 2023, Banking and Financial Services dominated the Transaction Monitoring Market.
In 2023, The Banking and Financial Services sector held a dominant market position in the "By Vertical" segment of the Transaction Monitoring Market. This sector's prominence can be attributed to the stringent regulatory requirements and the increasing need to combat financial crimes, such as money laundering and fraud. Within this landscape, several other verticals also demonstrated significant traction.
The Insurance industry, for example, has been enhancing its transaction monitoring capabilities to detect and prevent fraudulent claims. Government and Defense sectors have been leveraging these technologies to secure public funds and national security interests against illicit financial activities. The IT and Telecommunications sector has adopted transaction monitoring to safeguard against cyber threats and unauthorized transactions. Retail companies are increasingly using these solutions to manage high volumes of transactions and mitigate fraud risks.
Healthcare providers are focusing on compliance with regulatory standards and preventing billing fraud. The Energy sector utilizes transaction monitoring to manage complex supply chains and financial transactions. Utilities companies are implementing these systems to monitor financial activities and ensure operational integrity. The Manufacturing industry is integrating transaction monitoring to enhance supply chain transparency and prevent financial losses.
Other sectors, including education and non-profits, are also recognizing the value of transaction monitoring in ensuring financial compliance and operational security. This multifaceted adoption across verticals underscores the critical importance of robust transaction monitoring systems in maintaining financial integrity and security across industries.
Key Market Segments
By Component
- Solution
- Service
By Deployment Mode
- On-premise
- Cloud
By Enterprises Size
- Small and Medium-sized Enterprises
- Large Enterprises
By Application
- Fraud detection and prevention
- Anti-money laundering
- Compliance management
- Customer identity management
By Function
- Dashboard and reporting
- Case management
- Watch list screening
- KYC/customer onboarding
By Vertical
- Banking and financial services
- Insurance
- Government and defense
- IT and telecommunications
- Retail
- Healthcare
- Energy
- Utilities
- Manufacturing
- Others
Growth Opportunity
Increasing Adoption of Advanced Analytics and AI/ML
The global transaction monitoring market is poised for substantial growth driven by the increasing adoption of advanced analytics and AI/ML technologies. These advanced tools enhance the ability of organizations to detect and mitigate fraudulent activities, ensuring compliance with stringent regulatory requirements. Artificial Intelligence (AI) and machine learning algorithms enable systems to learn from historical data, predict potential threats, and identify anomalies with higher accuracy and speed. This shift towards more sophisticated analytics is not only improving the efficiency of transaction monitoring processes but also significantly reducing the incidence of false positives, thus streamlining operations and reducing costs. Companies investing in these technologies are likely to gain a competitive edge by offering more robust and reliable monitoring solutions.
Rising Demand for Real-Time Monitoring
Another pivotal growth driver for the transaction monitoring market is the rising demand for real-time monitoring capabilities. In an increasingly digital world, the ability to monitor transactions in real time is becoming critical to prevent fraud and ensure compliance. Real-time transaction monitoring allows organizations to detect and respond to suspicious activities instantaneously, thereby mitigating risks before they escalate. This demand is particularly pronounced in sectors such as banking, financial services, and e-commerce, where the volume and velocity of transactions are exceptionally high. By integrating real-time monitoring solutions, businesses can enhance their security posture, build trust with customers, and comply with regulatory mandates more effectively.
Latest Trends
Adoption of Machine Learning for Behavioral Analysis
The integration of machine learning (ML) for behavioral analysis is poised to revolutionize the transaction monitoring market. ML algorithms enable financial institutions to detect anomalies and suspicious activities more accurately by analyzing vast datasets and identifying patterns indicative of fraud. These systems learn from historical data, continuously improving their predictive accuracy and reducing false positives. By leveraging ML, organizations can streamline compliance processes, enhance risk management, and maintain a robust defense against increasingly sophisticated financial crimes. This trend underscores a shift towards proactive and intelligent monitoring solutions, offering significant improvements in operational efficiency and security.
Incorporation of Blockchain Analytics
Blockchain analytics is emerging as a critical component of transaction monitoring. As blockchain technology gains widespread adoption, particularly in the realms of cryptocurrency and decentralized finance (DeFi), the ability to track and analyze blockchain transactions has become essential. Blockchain analytics tools provide transparency, traceability, and immutability, allowing financial institutions to monitor transactions on the blockchain network with unprecedented clarity. These tools help identify illicit activities, such as money laundering and fraud, by tracing the flow of funds across the blockchain. The incorporation of blockchain analytics not only enhances compliance with regulatory requirements but also strengthens the overall security framework within the financial sector.
Regional Analysis
North America dominates the global transaction monitoring market with a 35% share.
The global transaction monitoring market exhibits notable regional variations, driven by distinct regulatory landscapes, technological advancements, and financial infrastructure maturity. North America leads the market, commanding a dominant 35% share, underpinned by stringent regulatory requirements and the robust adoption of advanced analytics and AI technologies. The U.S. and Canada, as key players, emphasize compliance with regulations such as the Bank Secrecy Act (BSA) and the USA PATRIOT Act, fostering a mature market landscape.
Europe follows, contributing approximately 28% to the global market, with countries like the UK, Germany, and France spearheading growth. The region's regulatory frameworks, including the EU's Fourth Anti-Money Laundering Directive (4AMLD) and the General Data Protection Regulation (GDPR), necessitate sophisticated transaction monitoring solutions.
In the Asia Pacific, rapid digitalization and increasing financial transactions, particularly in China, Japan, and India, drive a 22% market share. The burgeoning fintech sector and evolving regulatory standards, such as the Anti-Money Laundering (AML) guidelines in these countries, bolster market growth.
The Middle East & Africa, accounting for 8%, and Latin America, with a 7% share, exhibit growing awareness and implementation of transaction monitoring systems. Key markets like the UAE and Brazil are enhancing regulatory frameworks to curb financial crimes, thereby accelerating the adoption of transaction monitoring technologies.
Key Regions and Countries
North America
- The US
- Canada
- Rest of North America
Europe
- Germany
- France
- The UK
- Spain
- Netherlands
- Russia
- Italy
- Rest of Europe
Asia-Pacific
- China
- Japan
- Singapore
- Thailand
- South Korea
- Vietnam
- India
- New Zealand
- Rest of Asia Pacific
Latin America
- Mexico
- Brazil
- Rest of Latin America
Middle East & Africa
- Saudi Arabia
- South Africa
- UAE
- Rest of the Middle East & Africa
Key Players Analysis
The global transaction monitoring market in 2024 is poised for significant growth, driven by increasing regulatory requirements and the rising prevalence of financial crimes. Key players in this market, including industry giants like Fiserv, Inc., SAS Institute, Inc., and IBM Corporation, are at the forefront, leveraging advanced technologies to enhance their monitoring solutions.
Fiserv, Inc. continues to innovate with robust financial crime risk management tools, ensuring comprehensive monitoring capabilities. SAS Institute, Inc. remains a leader in analytics, providing powerful solutions that integrate machine learning and artificial intelligence to detect suspicious activities. IBM Corporation’s strength lies in its holistic approach, combining advanced analytics with cognitive computing to offer superior fraud detection and prevention.
FIS and Oracle Corporation are also pivotal, offering scalable solutions that cater to diverse financial institutions. Fair Isaac Corporation (FICO) maintains its competitive edge with sophisticated analytics and decision management solutions. NICE Systems Ltd and ACI Worldwide leverage their extensive experience in financial services to deliver comprehensive transaction monitoring systems.
Emerging players like Beam Solutions, Inc. and ACTICO GmbH are gaining traction by offering innovative, agile solutions tailored to modern financial landscapes. Infrasoft Technologies and Software AG provide a strong regional presence and specialized offerings, enhancing their market positions.
Overall, these companies are driving advancements in transaction monitoring through strategic investments in technology, ensuring compliance, and mitigating risks associated with financial crimes.
Market Key Players
- Fiserv, Inc.
- SAS Institute, Inc.
- IBM Corporation
- FIS
- Oracle Corporation
- Fair Isaac Corporation
- NICE Systems Ltd
- ACI Worldwide
- ACTICO GmbH
- Bottomline Technologies
- Beam Solutions, Inc.
- Infrasoft Technologies
- Software AG
- Experian Information Solutions, Inc.
- BAE Systems
Recent Development
- In April 2024, IBM announced a strategic partnership with NICE Actimize, a leading provider of financial crime, risk, and compliance solutions. The collaboration aims to integrate IBM's AI and cloud capabilities with NICE Actimize's transaction monitoring and financial crime prevention solutions. This partnership is expected to deliver enhanced security and compliance services to financial institutions, leveraging the strengths of both companies.
- In March 2024, Refinitiv, a global provider of financial market data and infrastructure, launched an AI-driven transaction monitoring platform. The new platform leverages advanced machine learning algorithms to detect suspicious activities and enhance compliance with regulatory requirements. This development underscores Refinitiv's commitment to utilizing artificial intelligence to improve the efficiency and accuracy of transaction monitoring systems.
- In January 2024, FICO, a global leader in predictive analytics and decision management technology, announced its acquisition of AML Partners, a company specializing in anti-money laundering (AML) and fraud detection solutions. This acquisition aims to enhance FICO's capabilities in transaction monitoring by integrating AML Partners' cutting-edge technologies into its portfolio, providing comprehensive solutions to financial institutions.
Report Scope
Report Features Description Market Value (2023) USD 16.2 Billion Forecast Revenue (2033) USD 63.8 Billion CAGR (2024-2032) 15.1% Base Year for Estimation 2023 Historic Period 2016-2023 Forecast Period 2024-2033 Report Coverage Revenue Forecast, Market Dynamics, COVID-19 Impact, Competitive Landscape, Recent Developments Segments Covered By Component (Solution and Service), By Deployment Mode (On-premise and Cloud), By Enterprises Size (Small and Medium-sized Enterprises and Large Enterprises), By Application (Fraud detection and prevention, Anti-money laundering, Compliance management, Customer identity management), By Function (Dashboard and reporting, Case management, Watch list screening, KYC/customer onboarding), By Vertical (Banking and financial services, Insurance, Government and defense, IT and telecommunications, Retail, Healthcare, Energy, Utilities, Manufacturing, Others) Regional Analysis North America - The US, Canada, Rest of North America, Europe - Germany, France, The UK, Spain, Italy, Russia, Netherlands, Rest of Europe, Asia-Pacific - China, Japan, South Korea, India, New Zealand, Singapore, Thailand, Vietnam, Rest of Asia Pacific, Latin America - Brazil, Mexico, Rest of Latin America, Middle East & Africa - South Africa, Saudi Arabia, UAE, Rest of Middle East & Africa Competitive Landscape Fiserv, Inc., SAS Institute, Inc., IBM Corporation, FIS, Oracle Corporation, Fair Isaac Corporation, NICE Systems Ltd, ACI Worldwide, ACTICO GmbH, Bottomline Technologies, Beam Solutions, Inc., Infrasoft Technologies, Software AG, Experian Information Solutions, Inc., BAE Systems Customization Scope Customization for segments, region/country-level will be provided. Moreover, additional customization can be done based on the requirements. Purchase Options We have three licenses to opt for Single User License, Multi-User License (Up to 5 Users), Corporate Use License (Unlimited User and Printable PDF) -
- 1. Executive Summary
- 1.1. Definition
- 1.2. Taxonomy
- 1.3. Research Scope
- 1.4. Key Analysis
- 1.5. Key Findings by Major Segments
- 1.6. Top strategies by Major Players
- 2. Global Transaction Monitoring Market Overview
- 2.1. Transaction Monitoring Market Dynamics
- 2.1.1. Drivers
- 2.1.2. Opportunities
- 2.1.3. Restraints
- 2.1.4. Challenges
- 2.2. Macro-economic Factors
- 2.3. Regulatory Framework
- 2.4. Market Investment Feasibility Index
- 2.5. PEST Analysis
- 2.6. PORTER’S Five Force Analysis
- 2.7. Drivers & Restraints Impact Analysis
- 2.8. Industry Chain Analysis
- 2.9. Cost Structure Analysis
- 2.10. Marketing Strategy
- 2.11. Russia-Ukraine War Impact Analysis
- 2.12. Opportunity Map Analysis
- 2.13. Market Competition Scenario Analysis
- 2.14. Product Life Cycle Analysis
- 2.15. Opportunity Orbits
- 2.16. Manufacturer Intensity Map
- 2.17. Major Companies sales by Value & Volume
- 2.1. Transaction Monitoring Market Dynamics
- 3. Global Transaction Monitoring Market Analysis, Opportunity and Forecast, 2016-2032
- 3.1. Global Transaction Monitoring Market Analysis, 2016-2021
- 3.2. Global Transaction Monitoring Market Opportunity and Forecast, 2023-2032
- 3.3. Global Transaction Monitoring Market Analysis, Opportunity and Forecast, By Component, 2016-2032
- 3.3.1. Global Transaction Monitoring Market Analysis by Component: Introduction
- 3.3.2. Market Size Absolute $ Opportunity Analysis and Forecast, By Component, 2016-2032
- 3.3.3. Solution
- 3.3.4. Service
- 3.4. Global Transaction Monitoring Market Analysis, Opportunity and Forecast, By Deployment Mode, 2016-2032
- 3.4.1. Global Transaction Monitoring Market Analysis by Deployment Mode: Introduction
- 3.4.2. Market Size Absolute $ Opportunity Analysis and Forecast, By Deployment Mode, 2016-2032
- 3.4.3. On-premise
- 3.4.4. Cloud
- 3.5. Global Transaction Monitoring Market Analysis, Opportunity and Forecast, By Enterprises Size, 2016-2032
- 3.5.1. Global Transaction Monitoring Market Analysis by Enterprises Size: Introduction
- 3.5.2. Market Size Absolute $ Opportunity Analysis and Forecast, By Enterprises Size, 2016-2032
- 3.5.3. Small and Medium-sized Enterprises
- 3.5.4. Large Enterprises
- 3.6. Global Transaction Monitoring Market Analysis, Opportunity and Forecast, By Application, 2016-2032
- 3.6.1. Global Transaction Monitoring Market Analysis by Application: Introduction
- 3.6.2. Market Size Absolute $ Opportunity Analysis and Forecast, By Application, 2016-2032
- 3.6.3. Fraud detection and prevention
- 3.6.4. Anti-money laundering
- 3.6.5. Compliance management
- 3.6.6. Customer identity management
- 3.7. Global Transaction Monitoring Market Analysis, Opportunity and Forecast, By Function, 2016-2032
- 3.7.1. Global Transaction Monitoring Market Analysis by Function: Introduction
- 3.7.2. Market Size Absolute $ Opportunity Analysis and Forecast, By Function, 2016-2032
- 3.7.3. Dashboard and reporting
- 3.7.4. Case management
- 3.7.5. Watch list screening
- 3.7.6. KYC/customer onboarding
- 3.8. Global Transaction Monitoring Market Analysis, Opportunity and Forecast, By Vertical, 2016-2032
- 3.8.1. Global Transaction Monitoring Market Analysis by Vertical: Introduction
- 3.8.2. Market Size Absolute $ Opportunity Analysis and Forecast, By Vertical, 2016-2032
- 3.8.3. Banking and financial services
- 3.8.4. Insurance
- 3.8.5. Government and defense
- 3.8.6. IT and telecommunications
- 3.8.7. Retail
- 3.8.8. Healthcare
- 3.8.9. Energy
- 3.8.10. Utilities
- 3.8.11. Manufacturing
- 3.8.12. Others
- 4. North America Transaction Monitoring Market Analysis, Opportunity and Forecast, 2016-2032
- 4.1. North America Transaction Monitoring Market Analysis, 2016-2021
- 4.2. North America Transaction Monitoring Market Opportunity and Forecast, 2023-2032
- 4.3. North America Transaction Monitoring Market Analysis, Opportunity and Forecast, By Component, 2016-2032
- 4.3.1. North America Transaction Monitoring Market Analysis by Component: Introduction
- 4.3.2. Market Size Absolute $ Opportunity Analysis and Forecast, By Component, 2016-2032
- 4.3.3. Solution
- 4.3.4. Service
- 4.4. North America Transaction Monitoring Market Analysis, Opportunity and Forecast, By Deployment Mode, 2016-2032
- 4.4.1. North America Transaction Monitoring Market Analysis by Deployment Mode: Introduction
- 4.4.2. Market Size Absolute $ Opportunity Analysis and Forecast, By Deployment Mode, 2016-2032
- 4.4.3. On-premise
- 4.4.4. Cloud
- 4.5. North America Transaction Monitoring Market Analysis, Opportunity and Forecast, By Enterprises Size, 2016-2032
- 4.5.1. North America Transaction Monitoring Market Analysis by Enterprises Size: Introduction
- 4.5.2. Market Size Absolute $ Opportunity Analysis and Forecast, By Enterprises Size, 2016-2032
- 4.5.3. Small and Medium-sized Enterprises
- 4.5.4. Large Enterprises
- 4.6. North America Transaction Monitoring Market Analysis, Opportunity and Forecast, By Application, 2016-2032
- 4.6.1. North America Transaction Monitoring Market Analysis by Application: Introduction
- 4.6.2. Market Size Absolute $ Opportunity Analysis and Forecast, By Application, 2016-2032
- 4.6.3. Fraud detection and prevention
- 4.6.4. Anti-money laundering
- 4.6.5. Compliance management
- 4.6.6. Customer identity management
- 4.7. North America Transaction Monitoring Market Analysis, Opportunity and Forecast, By Function, 2016-2032
- 4.7.1. North America Transaction Monitoring Market Analysis by Function: Introduction
- 4.7.2. Market Size Absolute $ Opportunity Analysis and Forecast, By Function, 2016-2032
- 4.7.3. Dashboard and reporting
- 4.7.4. Case management
- 4.7.5. Watch list screening
- 4.7.6. KYC/customer onboarding
- 4.8. North America Transaction Monitoring Market Analysis, Opportunity and Forecast, By Vertical, 2016-2032
- 4.8.1. North America Transaction Monitoring Market Analysis by Vertical: Introduction
- 4.8.2. Market Size Absolute $ Opportunity Analysis and Forecast, By Vertical, 2016-2032
- 4.8.3. Banking and financial services
- 4.8.4. Insurance
- 4.8.5. Government and defense
- 4.8.6. IT and telecommunications
- 4.8.7. Retail
- 4.8.8. Healthcare
- 4.8.9. Energy
- 4.8.10. Utilities
- 4.8.11. Manufacturing
- 4.8.12. Others
- 4.9. North America Transaction Monitoring Market Analysis, Opportunity and Forecast, By Country , 2016-2032
- 4.9.1. North America Transaction Monitoring Market Analysis by Country : Introduction
- 4.9.2. Market Size Absolute $ Opportunity Analysis and Forecast, Country , 2016-2032
- 4.9.2.1. The US
- 4.9.2.2. Canada
- 4.9.2.3. Mexico
- 5. Western Europe Transaction Monitoring Market Analysis, Opportunity and Forecast, 2016-2032
- 5.1. Western Europe Transaction Monitoring Market Analysis, 2016-2021
- 5.2. Western Europe Transaction Monitoring Market Opportunity and Forecast, 2023-2032
- 5.3. Western Europe Transaction Monitoring Market Analysis, Opportunity and Forecast, By Component, 2016-2032
- 5.3.1. Western Europe Transaction Monitoring Market Analysis by Component: Introduction
- 5.3.2. Market Size Absolute $ Opportunity Analysis and Forecast, By Component, 2016-2032
- 5.3.3. Solution
- 5.3.4. Service
- 5.4. Western Europe Transaction Monitoring Market Analysis, Opportunity and Forecast, By Deployment Mode, 2016-2032
- 5.4.1. Western Europe Transaction Monitoring Market Analysis by Deployment Mode: Introduction
- 5.4.2. Market Size Absolute $ Opportunity Analysis and Forecast, By Deployment Mode, 2016-2032
- 5.4.3. On-premise
- 5.4.4. Cloud
- 5.5. Western Europe Transaction Monitoring Market Analysis, Opportunity and Forecast, By Enterprises Size, 2016-2032
- 5.5.1. Western Europe Transaction Monitoring Market Analysis by Enterprises Size: Introduction
- 5.5.2. Market Size Absolute $ Opportunity Analysis and Forecast, By Enterprises Size, 2016-2032
- 5.5.3. Small and Medium-sized Enterprises
- 5.5.4. Large Enterprises
- 5.6. Western Europe Transaction Monitoring Market Analysis, Opportunity and Forecast, By Application, 2016-2032
- 5.6.1. Western Europe Transaction Monitoring Market Analysis by Application: Introduction
- 5.6.2. Market Size Absolute $ Opportunity Analysis and Forecast, By Application, 2016-2032
- 5.6.3. Fraud detection and prevention
- 5.6.4. Anti-money laundering
- 5.6.5. Compliance management
- 5.6.6. Customer identity management
- 5.7. Western Europe Transaction Monitoring Market Analysis, Opportunity and Forecast, By Function, 2016-2032
- 5.7.1. Western Europe Transaction Monitoring Market Analysis by Function: Introduction
- 5.7.2. Market Size Absolute $ Opportunity Analysis and Forecast, By Function, 2016-2032
- 5.7.3. Dashboard and reporting
- 5.7.4. Case management
- 5.7.5. Watch list screening
- 5.7.6. KYC/customer onboarding
- 5.8. Western Europe Transaction Monitoring Market Analysis, Opportunity and Forecast, By Vertical, 2016-2032
- 5.8.1. Western Europe Transaction Monitoring Market Analysis by Vertical: Introduction
- 5.8.2. Market Size Absolute $ Opportunity Analysis and Forecast, By Vertical, 2016-2032
- 5.8.3. Banking and financial services
- 5.8.4. Insurance
- 5.8.5. Government and defense
- 5.8.6. IT and telecommunications
- 5.8.7. Retail
- 5.8.8. Healthcare
- 5.8.9. Energy
- 5.8.10. Utilities
- 5.8.11. Manufacturing
- 5.8.12. Others
- 5.9. Western Europe Transaction Monitoring Market Analysis, Opportunity and Forecast, By Country , 2016-2032
- 5.9.1. Western Europe Transaction Monitoring Market Analysis by Country : Introduction
- 5.9.2. Market Size Absolute $ Opportunity Analysis and Forecast, Country , 2016-2032
- 5.9.2.1. Germany
- 5.9.2.2. France
- 5.9.2.3. The UK
- 5.9.2.4. Spain
- 5.9.2.5. Italy
- 5.9.2.6. Portugal
- 5.9.2.7. Ireland
- 5.9.2.8. Austria
- 5.9.2.9. Switzerland
- 5.9.2.10. Benelux
- 5.9.2.11. Nordic
- 5.9.2.12. Rest of Western Europe
- 6. Eastern Europe Transaction Monitoring Market Analysis, Opportunity and Forecast, 2016-2032
- 6.1. Eastern Europe Transaction Monitoring Market Analysis, 2016-2021
- 6.2. Eastern Europe Transaction Monitoring Market Opportunity and Forecast, 2023-2032
- 6.3. Eastern Europe Transaction Monitoring Market Analysis, Opportunity and Forecast, By Component, 2016-2032
- 6.3.1. Eastern Europe Transaction Monitoring Market Analysis by Component: Introduction
- 6.3.2. Market Size Absolute $ Opportunity Analysis and Forecast, By Component, 2016-2032
- 6.3.3. Solution
- 6.3.4. Service
- 6.4. Eastern Europe Transaction Monitoring Market Analysis, Opportunity and Forecast, By Deployment Mode, 2016-2032
- 6.4.1. Eastern Europe Transaction Monitoring Market Analysis by Deployment Mode: Introduction
- 6.4.2. Market Size Absolute $ Opportunity Analysis and Forecast, By Deployment Mode, 2016-2032
- 6.4.3. On-premise
- 6.4.4. Cloud
- 6.5. Eastern Europe Transaction Monitoring Market Analysis, Opportunity and Forecast, By Enterprises Size, 2016-2032
- 6.5.1. Eastern Europe Transaction Monitoring Market Analysis by Enterprises Size: Introduction
- 6.5.2. Market Size Absolute $ Opportunity Analysis and Forecast, By Enterprises Size, 2016-2032
- 6.5.3. Small and Medium-sized Enterprises
- 6.5.4. Large Enterprises
- 6.6. Eastern Europe Transaction Monitoring Market Analysis, Opportunity and Forecast, By Application, 2016-2032
- 6.6.1. Eastern Europe Transaction Monitoring Market Analysis by Application: Introduction
- 6.6.2. Market Size Absolute $ Opportunity Analysis and Forecast, By Application, 2016-2032
- 6.6.3. Fraud detection and prevention
- 6.6.4. Anti-money laundering
- 6.6.5. Compliance management
- 6.6.6. Customer identity management
- 6.7. Eastern Europe Transaction Monitoring Market Analysis, Opportunity and Forecast, By Function, 2016-2032
- 6.7.1. Eastern Europe Transaction Monitoring Market Analysis by Function: Introduction
- 6.7.2. Market Size Absolute $ Opportunity Analysis and Forecast, By Function, 2016-2032
- 6.7.3. Dashboard and reporting
- 6.7.4. Case management
- 6.7.5. Watch list screening
- 6.7.6. KYC/customer onboarding
- 6.8. Eastern Europe Transaction Monitoring Market Analysis, Opportunity and Forecast, By Vertical, 2016-2032
- 6.8.1. Eastern Europe Transaction Monitoring Market Analysis by Vertical: Introduction
- 6.8.2. Market Size Absolute $ Opportunity Analysis and Forecast, By Vertical, 2016-2032
- 6.8.3. Banking and financial services
- 6.8.4. Insurance
- 6.8.5. Government and defense
- 6.8.6. IT and telecommunications
- 6.8.7. Retail
- 6.8.8. Healthcare
- 6.8.9. Energy
- 6.8.10. Utilities
- 6.8.11. Manufacturing
- 6.8.12. Others
- 6.9. Eastern Europe Transaction Monitoring Market Analysis, Opportunity and Forecast, By Country , 2016-2032
- 6.9.1. Eastern Europe Transaction Monitoring Market Analysis by Country : Introduction
- 6.9.2. Market Size Absolute $ Opportunity Analysis and Forecast, Country , 2016-2032
- 6.9.2.1. Russia
- 6.9.2.2. Poland
- 6.9.2.3. The Czech Republic
- 6.9.2.4. Greece
- 6.9.2.5. Rest of Eastern Europe
- 7. APAC Transaction Monitoring Market Analysis, Opportunity and Forecast, 2016-2032
- 7.1. APAC Transaction Monitoring Market Analysis, 2016-2021
- 7.2. APAC Transaction Monitoring Market Opportunity and Forecast, 2023-2032
- 7.3. APAC Transaction Monitoring Market Analysis, Opportunity and Forecast, By Component, 2016-2032
- 7.3.1. APAC Transaction Monitoring Market Analysis by Component: Introduction
- 7.3.2. Market Size Absolute $ Opportunity Analysis and Forecast, By Component, 2016-2032
- 7.3.3. Solution
- 7.3.4. Service
- 7.4. APAC Transaction Monitoring Market Analysis, Opportunity and Forecast, By Deployment Mode, 2016-2032
- 7.4.1. APAC Transaction Monitoring Market Analysis by Deployment Mode: Introduction
- 7.4.2. Market Size Absolute $ Opportunity Analysis and Forecast, By Deployment Mode, 2016-2032
- 7.4.3. On-premise
- 7.4.4. Cloud
- 7.5. APAC Transaction Monitoring Market Analysis, Opportunity and Forecast, By Enterprises Size, 2016-2032
- 7.5.1. APAC Transaction Monitoring Market Analysis by Enterprises Size: Introduction
- 7.5.2. Market Size Absolute $ Opportunity Analysis and Forecast, By Enterprises Size, 2016-2032
- 7.5.3. Small and Medium-sized Enterprises
- 7.5.4. Large Enterprises
- 7.6. APAC Transaction Monitoring Market Analysis, Opportunity and Forecast, By Application, 2016-2032
- 7.6.1. APAC Transaction Monitoring Market Analysis by Application: Introduction
- 7.6.2. Market Size Absolute $ Opportunity Analysis and Forecast, By Application, 2016-2032
- 7.6.3. Fraud detection and prevention
- 7.6.4. Anti-money laundering
- 7.6.5. Compliance management
- 7.6.6. Customer identity management
- 7.7. APAC Transaction Monitoring Market Analysis, Opportunity and Forecast, By Function, 2016-2032
- 7.7.1. APAC Transaction Monitoring Market Analysis by Function: Introduction
- 7.7.2. Market Size Absolute $ Opportunity Analysis and Forecast, By Function, 2016-2032
- 7.7.3. Dashboard and reporting
- 7.7.4. Case management
- 7.7.5. Watch list screening
- 7.7.6. KYC/customer onboarding
- 7.8. APAC Transaction Monitoring Market Analysis, Opportunity and Forecast, By Vertical, 2016-2032
- 7.8.1. APAC Transaction Monitoring Market Analysis by Vertical: Introduction
- 7.8.2. Market Size Absolute $ Opportunity Analysis and Forecast, By Vertical, 2016-2032
- 7.8.3. Banking and financial services
- 7.8.4. Insurance
- 7.8.5. Government and defense
- 7.8.6. IT and telecommunications
- 7.8.7. Retail
- 7.8.8. Healthcare
- 7.8.9. Energy
- 7.8.10. Utilities
- 7.8.11. Manufacturing
- 7.8.12. Others
- 7.9. APAC Transaction Monitoring Market Analysis, Opportunity and Forecast, By Country , 2016-2032
- 7.9.1. APAC Transaction Monitoring Market Analysis by Country : Introduction
- 7.9.2. Market Size Absolute $ Opportunity Analysis and Forecast, Country , 2016-2032
- 7.9.2.1. China
- 7.9.2.2. Japan
- 7.9.2.3. South Korea
- 7.9.2.4. India
- 7.9.2.5. Australia & New Zeland
- 7.9.2.6. Indonesia
- 7.9.2.7. Malaysia
- 7.9.2.8. Philippines
- 7.9.2.9. Singapore
- 7.9.2.10. Thailand
- 7.9.2.11. Vietnam
- 7.9.2.12. Rest of APAC
- 8. Latin America Transaction Monitoring Market Analysis, Opportunity and Forecast, 2016-2032
- 8.1. Latin America Transaction Monitoring Market Analysis, 2016-2021
- 8.2. Latin America Transaction Monitoring Market Opportunity and Forecast, 2023-2032
- 8.3. Latin America Transaction Monitoring Market Analysis, Opportunity and Forecast, By Component, 2016-2032
- 8.3.1. Latin America Transaction Monitoring Market Analysis by Component: Introduction
- 8.3.2. Market Size Absolute $ Opportunity Analysis and Forecast, By Component, 2016-2032
- 8.3.3. Solution
- 8.3.4. Service
- 8.4. Latin America Transaction Monitoring Market Analysis, Opportunity and Forecast, By Deployment Mode, 2016-2032
- 8.4.1. Latin America Transaction Monitoring Market Analysis by Deployment Mode: Introduction
- 8.4.2. Market Size Absolute $ Opportunity Analysis and Forecast, By Deployment Mode, 2016-2032
- 8.4.3. On-premise
- 8.4.4. Cloud
- 8.5. Latin America Transaction Monitoring Market Analysis, Opportunity and Forecast, By Enterprises Size, 2016-2032
- 8.5.1. Latin America Transaction Monitoring Market Analysis by Enterprises Size: Introduction
- 8.5.2. Market Size Absolute $ Opportunity Analysis and Forecast, By Enterprises Size, 2016-2032
- 8.5.3. Small and Medium-sized Enterprises
- 8.5.4. Large Enterprises
- 8.6. Latin America Transaction Monitoring Market Analysis, Opportunity and Forecast, By Application, 2016-2032
- 8.6.1. Latin America Transaction Monitoring Market Analysis by Application: Introduction
- 8.6.2. Market Size Absolute $ Opportunity Analysis and Forecast, By Application, 2016-2032
- 8.6.3. Fraud detection and prevention
- 8.6.4. Anti-money laundering
- 8.6.5. Compliance management
- 8.6.6. Customer identity management
- 8.7. Latin America Transaction Monitoring Market Analysis, Opportunity and Forecast, By Function, 2016-2032
- 8.7.1. Latin America Transaction Monitoring Market Analysis by Function: Introduction
- 8.7.2. Market Size Absolute $ Opportunity Analysis and Forecast, By Function, 2016-2032
- 8.7.3. Dashboard and reporting
- 8.7.4. Case management
- 8.7.5. Watch list screening
- 8.7.6. KYC/customer onboarding
- 8.8. Latin America Transaction Monitoring Market Analysis, Opportunity and Forecast, By Vertical, 2016-2032
- 8.8.1. Latin America Transaction Monitoring Market Analysis by Vertical: Introduction
- 8.8.2. Market Size Absolute $ Opportunity Analysis and Forecast, By Vertical, 2016-2032
- 8.8.3. Banking and financial services
- 8.8.4. Insurance
- 8.8.5. Government and defense
- 8.8.6. IT and telecommunications
- 8.8.7. Retail
- 8.8.8. Healthcare
- 8.8.9. Energy
- 8.8.10. Utilities
- 8.8.11. Manufacturing
- 8.8.12. Others
- 8.9. Latin America Transaction Monitoring Market Analysis, Opportunity and Forecast, By Country , 2016-2032
- 8.9.1. Latin America Transaction Monitoring Market Analysis by Country : Introduction
- 8.9.2. Market Size Absolute $ Opportunity Analysis and Forecast, Country , 2016-2032
- 8.9.2.1. Brazil
- 8.9.2.2. Colombia
- 8.9.2.3. Chile
- 8.9.2.4. Argentina
- 8.9.2.5. Costa Rica
- 8.9.2.6. Rest of Latin America
- 9. Middle East & Africa Transaction Monitoring Market Analysis, Opportunity and Forecast, 2016-2032
- 9.1. Middle East & Africa Transaction Monitoring Market Analysis, 2016-2021
- 9.2. Middle East & Africa Transaction Monitoring Market Opportunity and Forecast, 2023-2032
- 9.3. Middle East & Africa Transaction Monitoring Market Analysis, Opportunity and Forecast, By Component, 2016-2032
- 9.3.1. Middle East & Africa Transaction Monitoring Market Analysis by Component: Introduction
- 9.3.2. Market Size Absolute $ Opportunity Analysis and Forecast, By Component, 2016-2032
- 9.3.3. Solution
- 9.3.4. Service
- 9.4. Middle East & Africa Transaction Monitoring Market Analysis, Opportunity and Forecast, By Deployment Mode, 2016-2032
- 9.4.1. Middle East & Africa Transaction Monitoring Market Analysis by Deployment Mode: Introduction
- 9.4.2. Market Size Absolute $ Opportunity Analysis and Forecast, By Deployment Mode, 2016-2032
- 9.4.3. On-premise
- 9.4.4. Cloud
- 9.5. Middle East & Africa Transaction Monitoring Market Analysis, Opportunity and Forecast, By Enterprises Size, 2016-2032
- 9.5.1. Middle East & Africa Transaction Monitoring Market Analysis by Enterprises Size: Introduction
- 9.5.2. Market Size Absolute $ Opportunity Analysis and Forecast, By Enterprises Size, 2016-2032
- 9.5.3. Small and Medium-sized Enterprises
- 9.5.4. Large Enterprises
- 9.6. Middle East & Africa Transaction Monitoring Market Analysis, Opportunity and Forecast, By Application, 2016-2032
- 9.6.1. Middle East & Africa Transaction Monitoring Market Analysis by Application: Introduction
- 9.6.2. Market Size Absolute $ Opportunity Analysis and Forecast, By Application, 2016-2032
- 9.6.3. Fraud detection and prevention
- 9.6.4. Anti-money laundering
- 9.6.5. Compliance management
- 9.6.6. Customer identity management
- 9.7. Middle East & Africa Transaction Monitoring Market Analysis, Opportunity and Forecast, By Function, 2016-2032
- 9.7.1. Middle East & Africa Transaction Monitoring Market Analysis by Function: Introduction
- 9.7.2. Market Size Absolute $ Opportunity Analysis and Forecast, By Function, 2016-2032
- 9.7.3. Dashboard and reporting
- 9.7.4. Case management
- 9.7.5. Watch list screening
- 9.7.6. KYC/customer onboarding
- 9.8. Middle East & Africa Transaction Monitoring Market Analysis, Opportunity and Forecast, By Vertical, 2016-2032
- 9.8.1. Middle East & Africa Transaction Monitoring Market Analysis by Vertical: Introduction
- 9.8.2. Market Size Absolute $ Opportunity Analysis and Forecast, By Vertical, 2016-2032
- 9.8.3. Banking and financial services
- 9.8.4. Insurance
- 9.8.5. Government and defense
- 9.8.6. IT and telecommunications
- 9.8.7. Retail
- 9.8.8. Healthcare
- 9.8.9. Energy
- 9.8.10. Utilities
- 9.8.11. Manufacturing
- 9.8.12. Others
- 9.9. Middle East & Africa Transaction Monitoring Market Analysis, Opportunity and Forecast, By Country , 2016-2032
- 9.9.1. Middle East & Africa Transaction Monitoring Market Analysis by Country : Introduction
- 9.9.2. Market Size Absolute $ Opportunity Analysis and Forecast, Country , 2016-2032
- 9.9.2.1. Algeria
- 9.9.2.2. Egypt
- 9.9.2.3. Israel
- 9.9.2.4. Kuwait
- 9.9.2.5. Nigeria
- 9.9.2.6. Saudi Arabia
- 9.9.2.7. South Africa
- 9.9.2.8. Turkey
- 9.9.2.9. The UAE
- 9.9.2.10. Rest of MEA
- 10. Global Transaction Monitoring Market Analysis, Opportunity and Forecast, By Region , 2016-2032
- 10.1. Global Transaction Monitoring Market Analysis by Region : Introduction
- 10.2. Market Size Absolute $ Opportunity Analysis and Forecast, By Region , 2016-2032
- 10.2.1. North America
- 10.2.2. Western Europe
- 10.2.3. Eastern Europe
- 10.2.4. APAC
- 10.2.5. Latin America
- 10.2.6. Middle East & Africa
- 11. Global Transaction Monitoring Market Competitive Landscape, Market Share Analysis, and Company Profiles
- 11.1. Market Share Analysis
- 11.2. Company Profiles
- 11.3. Fiserv, Inc.
- 11.3.1. Company Overview
- 11.3.2. Financial Highlights
- 11.3.3. Product Portfolio
- 11.3.4. SWOT Analysis
- 11.3.5. Key Strategies and Developments
- 11.4. SAS Institute, Inc.
- 11.4.1. Company Overview
- 11.4.2. Financial Highlights
- 11.4.3. Product Portfolio
- 11.4.4. SWOT Analysis
- 11.4.5. Key Strategies and Developments
- 11.5. IBM Corporation
- 11.5.1. Company Overview
- 11.5.2. Financial Highlights
- 11.5.3. Product Portfolio
- 11.5.4. SWOT Analysis
- 11.5.5. Key Strategies and Developments
- 11.6. FIS
- 11.6.1. Company Overview
- 11.6.2. Financial Highlights
- 11.6.3. Product Portfolio
- 11.6.4. SWOT Analysis
- 11.6.5. Key Strategies and Developments
- 11.7. Oracle Corporation
- 11.7.1. Company Overview
- 11.7.2. Financial Highlights
- 11.7.3. Product Portfolio
- 11.7.4. SWOT Analysis
- 11.7.5. Key Strategies and Developments
- 11.8. Fair Isaac Corporation
- 11.8.1. Company Overview
- 11.8.2. Financial Highlights
- 11.8.3. Product Portfolio
- 11.8.4. SWOT Analysis
- 11.8.5. Key Strategies and Developments
- 11.9. NICE Systems Ltd
- 11.9.1. Company Overview
- 11.9.2. Financial Highlights
- 11.9.3. Product Portfolio
- 11.9.4. SWOT Analysis
- 11.9.5. Key Strategies and Developments
- 11.10. ACI Worldwide
- 11.10.1. Company Overview
- 11.10.2. Financial Highlights
- 11.10.3. Product Portfolio
- 11.10.4. SWOT Analysis
- 11.10.5. Key Strategies and Developments
- 11.11. ACTICO GmbH
- 11.11.1. Company Overview
- 11.11.2. Financial Highlights
- 11.11.3. Product Portfolio
- 11.11.4. SWOT Analysis
- 11.11.5. Key Strategies and Developments
- 11.12. Bottomline Technologies
- 11.12.1. Company Overview
- 11.12.2. Financial Highlights
- 11.12.3. Product Portfolio
- 11.12.4. SWOT Analysis
- 11.12.5. Key Strategies and Developments
- 11.13.1. Company Overview
- 11.13.2. Financial Highlights
- 11.13.3. Product Portfolio
- 11.13.4. SWOT Analysis
- 11.13.5. Key Strategies and Developments
- 11.14. Beam Solutions, Inc.
- 11.14.1. Company Overview
- 11.14.2. Financial Highlights
- 11.14.3. Product Portfolio
- 11.14.4. SWOT Analysis
- 11.14.5. Key Strategies and Developments
- 11.15. Software AG
- 11.15.1. Company Overview
- 11.15.2. Financial Highlights
- 11.15.3. Product Portfolio
- 11.15.4. SWOT Analysis
- 11.15.5. Key Strategies and Developments
- 11.16. Experian Information Solutions, Inc.
- 11.16.1. Company Overview
- 11.16.2. Financial Highlights
- 11.16.3. Product Portfolio
- 11.16.4. SWOT Analysis
- 11.16.5. Key Strategies and Developments
- 11.17. BAE Systems
- 11.17.1. Company Overview
- 11.17.2. Financial Highlights
- 11.17.3. Product Portfolio
- 11.17.4. SWOT Analysis
- 11.17.5. Key Strategies and Developments
- 12. Assumptions and Acronyms
- 13. Research Methodology
- 14. Contact
"
- List of Figures
- "
- Figure 1: Global Transaction Monitoring Market Revenue (US$ Mn) Market Share by Component in 2022
- Figure 2: Global Transaction Monitoring Market Market Attractiveness Analysis by Component, 2016-2032
- Figure 3: Global Transaction Monitoring Market Revenue (US$ Mn) Market Share by Deployment Modein 2022
- Figure 4: Global Transaction Monitoring Market Market Attractiveness Analysis by Deployment Mode, 2016-2032
- Figure 5: Global Transaction Monitoring Market Revenue (US$ Mn) Market Share by Enterprises Sizein 2022
- Figure 6: Global Transaction Monitoring Market Market Attractiveness Analysis by Enterprises Size, 2016-2032
- Figure 7: Global Transaction Monitoring Market Revenue (US$ Mn) Market Share by Applicationin 2022
- Figure 8: Global Transaction Monitoring Market Market Attractiveness Analysis by Application, 2016-2032
- Figure 9: Global Transaction Monitoring Market Revenue (US$ Mn) Market Share by Functionin 2022
- Figure 10: Global Transaction Monitoring Market Market Attractiveness Analysis by Function, 2016-2032
- Figure 11: Global Transaction Monitoring Market Revenue (US$ Mn) Market Share by Verticalin 2022
- Figure 12: Global Transaction Monitoring Market Market Attractiveness Analysis by Vertical, 2016-2032
- Figure 13: Global Transaction Monitoring Market Revenue (US$ Mn) Market Share by Region in 2022
- Figure 14: Global Transaction Monitoring Market Market Attractiveness Analysis by Region, 2016-2032
- Figure 15: Global Transaction Monitoring Market Market Revenue (US$ Mn) (2016-2032)
- Figure 16: Global Transaction Monitoring Market Market Revenue (US$ Mn) Comparison by Region (2016-2032)
- Figure 17: Global Transaction Monitoring Market Market Revenue (US$ Mn) Comparison by Component (2016-2032)
- Figure 18: Global Transaction Monitoring Market Market Revenue (US$ Mn) Comparison by Deployment Mode (2016-2032)
- Figure 19: Global Transaction Monitoring Market Market Revenue (US$ Mn) Comparison by Enterprises Size (2016-2032)
- Figure 20: Global Transaction Monitoring Market Market Revenue (US$ Mn) Comparison by Application (2016-2032)
- Figure 21: Global Transaction Monitoring Market Market Revenue (US$ Mn) Comparison by Function (2016-2032)
- Figure 22: Global Transaction Monitoring Market Market Revenue (US$ Mn) Comparison by Vertical (2016-2032)
- Figure 23: Global Transaction Monitoring Market Market Y-o-Y Growth Rate Comparison by Region (2016-2032)
- Figure 24: Global Transaction Monitoring Market Market Y-o-Y Growth Rate Comparison by Component (2016-2032)
- Figure 25: Global Transaction Monitoring Market Market Y-o-Y Growth Rate Comparison by Deployment Mode (2016-2032)
- Figure 26: Global Transaction Monitoring Market Market Y-o-Y Growth Rate Comparison by Enterprises Size (2016-2032)
- Figure 27: Global Transaction Monitoring Market Market Y-o-Y Growth Rate Comparison by Application (2016-2032)
- Figure 28: Global Transaction Monitoring Market Market Y-o-Y Growth Rate Comparison by Function (2016-2032)
- Figure 29: Global Transaction Monitoring Market Market Y-o-Y Growth Rate Comparison by Vertical (2016-2032)
- Figure 30: Global Transaction Monitoring Market Market Share Comparison by Region (2016-2032)
- Figure 31: Global Transaction Monitoring Market Market Share Comparison by Component (2016-2032)
- Figure 32: Global Transaction Monitoring Market Market Share Comparison by Deployment Mode (2016-2032)
- Figure 33: Global Transaction Monitoring Market Market Share Comparison by Enterprises Size (2016-2032)
- Figure 34: Global Transaction Monitoring Market Market Share Comparison by Application (2016-2032)
- Figure 35: Global Transaction Monitoring Market Market Share Comparison by Function (2016-2032)
- Figure 36: Global Transaction Monitoring Market Market Share Comparison by Vertical (2016-2032)
- Figure 37: North America Transaction Monitoring Market Revenue (US$ Mn) Market Share by Componentin 2022
- Figure 38: North America Transaction Monitoring Market Market Attractiveness Analysis by Component, 2016-2032
- Figure 39: North America Transaction Monitoring Market Revenue (US$ Mn) Market Share by Deployment Modein 2022
- Figure 40: North America Transaction Monitoring Market Market Attractiveness Analysis by Deployment Mode, 2016-2032
- Figure 41: North America Transaction Monitoring Market Revenue (US$ Mn) Market Share by Enterprises Sizein 2022
- Figure 42: North America Transaction Monitoring Market Market Attractiveness Analysis by Enterprises Size, 2016-2032
- Figure 43: North America Transaction Monitoring Market Revenue (US$ Mn) Market Share by Applicationin 2022
- Figure 44: North America Transaction Monitoring Market Market Attractiveness Analysis by Application, 2016-2032
- Figure 45: North America Transaction Monitoring Market Revenue (US$ Mn) Market Share by Functionin 2022
- Figure 46: North America Transaction Monitoring Market Market Attractiveness Analysis by Function, 2016-2032
- Figure 47: North America Transaction Monitoring Market Revenue (US$ Mn) Market Share by Verticalin 2022
- Figure 48: North America Transaction Monitoring Market Market Attractiveness Analysis by Vertical, 2016-2032
- Figure 49: North America Transaction Monitoring Market Revenue (US$ Mn) Market Share by Country in 2022
- Figure 50: North America Transaction Monitoring Market Market Attractiveness Analysis by Country, 2016-2032
- Figure 51: North America Transaction Monitoring Market Market Revenue (US$ Mn) (2016-2032)
- Figure 52: North America Transaction Monitoring Market Market Revenue (US$ Mn) Comparison by Country (2016-2032)
- Figure 53: North America Transaction Monitoring Market Market Revenue (US$ Mn) Comparison by Component (2016-2032)
- Figure 54: North America Transaction Monitoring Market Market Revenue (US$ Mn) Comparison by Deployment Mode (2016-2032)
- Figure 55: North America Transaction Monitoring Market Market Revenue (US$ Mn) Comparison by Enterprises Size (2016-2032)
- Figure 56: North America Transaction Monitoring Market Market Revenue (US$ Mn) Comparison by Application (2016-2032)
- Figure 57: North America Transaction Monitoring Market Market Revenue (US$ Mn) Comparison by Function (2016-2032)
- Figure 58: North America Transaction Monitoring Market Market Revenue (US$ Mn) Comparison by Vertical (2016-2032)
- Figure 59: North America Transaction Monitoring Market Market Y-o-Y Growth Rate Comparison by Country (2016-2032)
- Figure 60: North America Transaction Monitoring Market Market Y-o-Y Growth Rate Comparison by Component (2016-2032)
- Figure 61: North America Transaction Monitoring Market Market Y-o-Y Growth Rate Comparison by Deployment Mode (2016-2032)
- Figure 62: North America Transaction Monitoring Market Market Y-o-Y Growth Rate Comparison by Enterprises Size (2016-2032)
- Figure 63: North America Transaction Monitoring Market Market Y-o-Y Growth Rate Comparison by Application (2016-2032)
- Figure 64: North America Transaction Monitoring Market Market Y-o-Y Growth Rate Comparison by Function (2016-2032)
- Figure 65: North America Transaction Monitoring Market Market Y-o-Y Growth Rate Comparison by Vertical (2016-2032)
- Figure 66: North America Transaction Monitoring Market Market Share Comparison by Country (2016-2032)
- Figure 67: North America Transaction Monitoring Market Market Share Comparison by Component (2016-2032)
- Figure 68: North America Transaction Monitoring Market Market Share Comparison by Deployment Mode (2016-2032)
- Figure 69: North America Transaction Monitoring Market Market Share Comparison by Enterprises Size (2016-2032)
- Figure 70: North America Transaction Monitoring Market Market Share Comparison by Application (2016-2032)
- Figure 71: North America Transaction Monitoring Market Market Share Comparison by Function (2016-2032)
- Figure 72: North America Transaction Monitoring Market Market Share Comparison by Vertical (2016-2032)
- Figure 73: Western Europe Transaction Monitoring Market Revenue (US$ Mn) Market Share by Componentin 2022
- Figure 74: Western Europe Transaction Monitoring Market Market Attractiveness Analysis by Component, 2016-2032
- Figure 75: Western Europe Transaction Monitoring Market Revenue (US$ Mn) Market Share by Deployment Modein 2022
- Figure 76: Western Europe Transaction Monitoring Market Market Attractiveness Analysis by Deployment Mode, 2016-2032
- Figure 77: Western Europe Transaction Monitoring Market Revenue (US$ Mn) Market Share by Enterprises Sizein 2022
- Figure 78: Western Europe Transaction Monitoring Market Market Attractiveness Analysis by Enterprises Size, 2016-2032
- Figure 79: Western Europe Transaction Monitoring Market Revenue (US$ Mn) Market Share by Applicationin 2022
- Figure 80: Western Europe Transaction Monitoring Market Market Attractiveness Analysis by Application, 2016-2032
- Figure 81: Western Europe Transaction Monitoring Market Revenue (US$ Mn) Market Share by Functionin 2022
- Figure 82: Western Europe Transaction Monitoring Market Market Attractiveness Analysis by Function, 2016-2032
- Figure 83: Western Europe Transaction Monitoring Market Revenue (US$ Mn) Market Share by Verticalin 2022
- Figure 84: Western Europe Transaction Monitoring Market Market Attractiveness Analysis by Vertical, 2016-2032
- Figure 85: Western Europe Transaction Monitoring Market Revenue (US$ Mn) Market Share by Country in 2022
- Figure 86: Western Europe Transaction Monitoring Market Market Attractiveness Analysis by Country, 2016-2032
- Figure 87: Western Europe Transaction Monitoring Market Market Revenue (US$ Mn) (2016-2032)
- Figure 88: Western Europe Transaction Monitoring Market Market Revenue (US$ Mn) Comparison by Country (2016-2032)
- Figure 89: Western Europe Transaction Monitoring Market Market Revenue (US$ Mn) Comparison by Component (2016-2032)
- Figure 90: Western Europe Transaction Monitoring Market Market Revenue (US$ Mn) Comparison by Deployment Mode (2016-2032)
- Figure 91: Western Europe Transaction Monitoring Market Market Revenue (US$ Mn) Comparison by Enterprises Size (2016-2032)
- Figure 92: Western Europe Transaction Monitoring Market Market Revenue (US$ Mn) Comparison by Application (2016-2032)
- Figure 93: Western Europe Transaction Monitoring Market Market Revenue (US$ Mn) Comparison by Function (2016-2032)
- Figure 94: Western Europe Transaction Monitoring Market Market Revenue (US$ Mn) Comparison by Vertical (2016-2032)
- Figure 95: Western Europe Transaction Monitoring Market Market Y-o-Y Growth Rate Comparison by Country (2016-2032)
- Figure 96: Western Europe Transaction Monitoring Market Market Y-o-Y Growth Rate Comparison by Component (2016-2032)
- Figure 97: Western Europe Transaction Monitoring Market Market Y-o-Y Growth Rate Comparison by Deployment Mode (2016-2032)
- Figure 98: Western Europe Transaction Monitoring Market Market Y-o-Y Growth Rate Comparison by Enterprises Size (2016-2032)
- Figure 99: Western Europe Transaction Monitoring Market Market Y-o-Y Growth Rate Comparison by Application (2016-2032)
- Figure 100: Western Europe Transaction Monitoring Market Market Y-o-Y Growth Rate Comparison by Function (2016-2032)
- Figure 101: Western Europe Transaction Monitoring Market Market Y-o-Y Growth Rate Comparison by Vertical (2016-2032)
- Figure 102: Western Europe Transaction Monitoring Market Market Share Comparison by Country (2016-2032)
- Figure 103: Western Europe Transaction Monitoring Market Market Share Comparison by Component (2016-2032)
- Figure 104: Western Europe Transaction Monitoring Market Market Share Comparison by Deployment Mode (2016-2032)
- Figure 105: Western Europe Transaction Monitoring Market Market Share Comparison by Enterprises Size (2016-2032)
- Figure 106: Western Europe Transaction Monitoring Market Market Share Comparison by Application (2016-2032)
- Figure 107: Western Europe Transaction Monitoring Market Market Share Comparison by Function (2016-2032)
- Figure 108: Western Europe Transaction Monitoring Market Market Share Comparison by Vertical (2016-2032)
- Figure 109: Eastern Europe Transaction Monitoring Market Revenue (US$ Mn) Market Share by Componentin 2022
- Figure 110: Eastern Europe Transaction Monitoring Market Market Attractiveness Analysis by Component, 2016-2032
- Figure 111: Eastern Europe Transaction Monitoring Market Revenue (US$ Mn) Market Share by Deployment Modein 2022
- Figure 112: Eastern Europe Transaction Monitoring Market Market Attractiveness Analysis by Deployment Mode, 2016-2032
- Figure 113: Eastern Europe Transaction Monitoring Market Revenue (US$ Mn) Market Share by Enterprises Sizein 2022
- Figure 114: Eastern Europe Transaction Monitoring Market Market Attractiveness Analysis by Enterprises Size, 2016-2032
- Figure 115: Eastern Europe Transaction Monitoring Market Revenue (US$ Mn) Market Share by Applicationin 2022
- Figure 116: Eastern Europe Transaction Monitoring Market Market Attractiveness Analysis by Application, 2016-2032
- Figure 117: Eastern Europe Transaction Monitoring Market Revenue (US$ Mn) Market Share by Functionin 2022
- Figure 118: Eastern Europe Transaction Monitoring Market Market Attractiveness Analysis by Function, 2016-2032
- Figure 119: Eastern Europe Transaction Monitoring Market Revenue (US$ Mn) Market Share by Verticalin 2022
- Figure 120: Eastern Europe Transaction Monitoring Market Market Attractiveness Analysis by Vertical, 2016-2032
- Figure 121: Eastern Europe Transaction Monitoring Market Revenue (US$ Mn) Market Share by Country in 2022
- Figure 122: Eastern Europe Transaction Monitoring Market Market Attractiveness Analysis by Country, 2016-2032
- Figure 123: Eastern Europe Transaction Monitoring Market Market Revenue (US$ Mn) (2016-2032)
- Figure 124: Eastern Europe Transaction Monitoring Market Market Revenue (US$ Mn) Comparison by Country (2016-2032)
- Figure 125: Eastern Europe Transaction Monitoring Market Market Revenue (US$ Mn) Comparison by Component (2016-2032)
- Figure 126: Eastern Europe Transaction Monitoring Market Market Revenue (US$ Mn) Comparison by Deployment Mode (2016-2032)
- Figure 127: Eastern Europe Transaction Monitoring Market Market Revenue (US$ Mn) Comparison by Enterprises Size (2016-2032)
- Figure 128: Eastern Europe Transaction Monitoring Market Market Revenue (US$ Mn) Comparison by Application (2016-2032)
- Figure 129: Eastern Europe Transaction Monitoring Market Market Revenue (US$ Mn) Comparison by Function (2016-2032)
- Figure 130: Eastern Europe Transaction Monitoring Market Market Revenue (US$ Mn) Comparison by Vertical (2016-2032)
- Figure 131: Eastern Europe Transaction Monitoring Market Market Y-o-Y Growth Rate Comparison by Country (2016-2032)
- Figure 132: Eastern Europe Transaction Monitoring Market Market Y-o-Y Growth Rate Comparison by Component (2016-2032)
- Figure 133: Eastern Europe Transaction Monitoring Market Market Y-o-Y Growth Rate Comparison by Deployment Mode (2016-2032)
- Figure 134: Eastern Europe Transaction Monitoring Market Market Y-o-Y Growth Rate Comparison by Enterprises Size (2016-2032)
- Figure 135: Eastern Europe Transaction Monitoring Market Market Y-o-Y Growth Rate Comparison by Application (2016-2032)
- Figure 136: Eastern Europe Transaction Monitoring Market Market Y-o-Y Growth Rate Comparison by Function (2016-2032)
- Figure 137: Eastern Europe Transaction Monitoring Market Market Y-o-Y Growth Rate Comparison by Vertical (2016-2032)
- Figure 138: Eastern Europe Transaction Monitoring Market Market Share Comparison by Country (2016-2032)
- Figure 139: Eastern Europe Transaction Monitoring Market Market Share Comparison by Component (2016-2032)
- Figure 140: Eastern Europe Transaction Monitoring Market Market Share Comparison by Deployment Mode (2016-2032)
- Figure 141: Eastern Europe Transaction Monitoring Market Market Share Comparison by Enterprises Size (2016-2032)
- Figure 142: Eastern Europe Transaction Monitoring Market Market Share Comparison by Application (2016-2032)
- Figure 143: Eastern Europe Transaction Monitoring Market Market Share Comparison by Function (2016-2032)
- Figure 144: Eastern Europe Transaction Monitoring Market Market Share Comparison by Vertical (2016-2032)
- Figure 145: APAC Transaction Monitoring Market Revenue (US$ Mn) Market Share by Componentin 2022
- Figure 146: APAC Transaction Monitoring Market Market Attractiveness Analysis by Component, 2016-2032
- Figure 147: APAC Transaction Monitoring Market Revenue (US$ Mn) Market Share by Deployment Modein 2022
- Figure 148: APAC Transaction Monitoring Market Market Attractiveness Analysis by Deployment Mode, 2016-2032
- Figure 149: APAC Transaction Monitoring Market Revenue (US$ Mn) Market Share by Enterprises Sizein 2022
- Figure 150: APAC Transaction Monitoring Market Market Attractiveness Analysis by Enterprises Size, 2016-2032
- Figure 151: APAC Transaction Monitoring Market Revenue (US$ Mn) Market Share by Applicationin 2022
- Figure 152: APAC Transaction Monitoring Market Market Attractiveness Analysis by Application, 2016-2032
- Figure 153: APAC Transaction Monitoring Market Revenue (US$ Mn) Market Share by Functionin 2022
- Figure 154: APAC Transaction Monitoring Market Market Attractiveness Analysis by Function, 2016-2032
- Figure 155: APAC Transaction Monitoring Market Revenue (US$ Mn) Market Share by Verticalin 2022
- Figure 156: APAC Transaction Monitoring Market Market Attractiveness Analysis by Vertical, 2016-2032
- Figure 157: APAC Transaction Monitoring Market Revenue (US$ Mn) Market Share by Country in 2022
- Figure 158: APAC Transaction Monitoring Market Market Attractiveness Analysis by Country, 2016-2032
- Figure 159: APAC Transaction Monitoring Market Market Revenue (US$ Mn) (2016-2032)
- Figure 160: APAC Transaction Monitoring Market Market Revenue (US$ Mn) Comparison by Country (2016-2032)
- Figure 161: APAC Transaction Monitoring Market Market Revenue (US$ Mn) Comparison by Component (2016-2032)
- Figure 162: APAC Transaction Monitoring Market Market Revenue (US$ Mn) Comparison by Deployment Mode (2016-2032)
- Figure 163: APAC Transaction Monitoring Market Market Revenue (US$ Mn) Comparison by Enterprises Size (2016-2032)
- Figure 164: APAC Transaction Monitoring Market Market Revenue (US$ Mn) Comparison by Application (2016-2032)
- Figure 165: APAC Transaction Monitoring Market Market Revenue (US$ Mn) Comparison by Function (2016-2032)
- Figure 166: APAC Transaction Monitoring Market Market Revenue (US$ Mn) Comparison by Vertical (2016-2032)
- Figure 167: APAC Transaction Monitoring Market Market Y-o-Y Growth Rate Comparison by Country (2016-2032)
- Figure 168: APAC Transaction Monitoring Market Market Y-o-Y Growth Rate Comparison by Component (2016-2032)
- Figure 169: APAC Transaction Monitoring Market Market Y-o-Y Growth Rate Comparison by Deployment Mode (2016-2032)
- Figure 170: APAC Transaction Monitoring Market Market Y-o-Y Growth Rate Comparison by Enterprises Size (2016-2032)
- Figure 171: APAC Transaction Monitoring Market Market Y-o-Y Growth Rate Comparison by Application (2016-2032)
- Figure 172: APAC Transaction Monitoring Market Market Y-o-Y Growth Rate Comparison by Function (2016-2032)
- Figure 173: APAC Transaction Monitoring Market Market Y-o-Y Growth Rate Comparison by Vertical (2016-2032)
- Figure 174: APAC Transaction Monitoring Market Market Share Comparison by Country (2016-2032)
- Figure 175: APAC Transaction Monitoring Market Market Share Comparison by Component (2016-2032)
- Figure 176: APAC Transaction Monitoring Market Market Share Comparison by Deployment Mode (2016-2032)
- Figure 177: APAC Transaction Monitoring Market Market Share Comparison by Enterprises Size (2016-2032)
- Figure 178: APAC Transaction Monitoring Market Market Share Comparison by Application (2016-2032)
- Figure 179: APAC Transaction Monitoring Market Market Share Comparison by Function (2016-2032)
- Figure 180: APAC Transaction Monitoring Market Market Share Comparison by Vertical (2016-2032)
- Figure 181: Latin America Transaction Monitoring Market Revenue (US$ Mn) Market Share by Componentin 2022
- Figure 182: Latin America Transaction Monitoring Market Market Attractiveness Analysis by Component, 2016-2032
- Figure 183: Latin America Transaction Monitoring Market Revenue (US$ Mn) Market Share by Deployment Modein 2022
- Figure 184: Latin America Transaction Monitoring Market Market Attractiveness Analysis by Deployment Mode, 2016-2032
- Figure 185: Latin America Transaction Monitoring Market Revenue (US$ Mn) Market Share by Enterprises Sizein 2022
- Figure 186: Latin America Transaction Monitoring Market Market Attractiveness Analysis by Enterprises Size, 2016-2032
- Figure 187: Latin America Transaction Monitoring Market Revenue (US$ Mn) Market Share by Applicationin 2022
- Figure 188: Latin America Transaction Monitoring Market Market Attractiveness Analysis by Application, 2016-2032
- Figure 189: Latin America Transaction Monitoring Market Revenue (US$ Mn) Market Share by Functionin 2022
- Figure 190: Latin America Transaction Monitoring Market Market Attractiveness Analysis by Function, 2016-2032
- Figure 191: Latin America Transaction Monitoring Market Revenue (US$ Mn) Market Share by Verticalin 2022
- Figure 192: Latin America Transaction Monitoring Market Market Attractiveness Analysis by Vertical, 2016-2032
- Figure 193: Latin America Transaction Monitoring Market Revenue (US$ Mn) Market Share by Country in 2022
- Figure 194: Latin America Transaction Monitoring Market Market Attractiveness Analysis by Country, 2016-2032
- Figure 195: Latin America Transaction Monitoring Market Market Revenue (US$ Mn) (2016-2032)
- Figure 196: Latin America Transaction Monitoring Market Market Revenue (US$ Mn) Comparison by Country (2016-2032)
- Figure 197: Latin America Transaction Monitoring Market Market Revenue (US$ Mn) Comparison by Component (2016-2032)
- Figure 198: Latin America Transaction Monitoring Market Market Revenue (US$ Mn) Comparison by Deployment Mode (2016-2032)
- Figure 199: Latin America Transaction Monitoring Market Market Revenue (US$ Mn) Comparison by Enterprises Size (2016-2032)
- Figure 200: Latin America Transaction Monitoring Market Market Revenue (US$ Mn) Comparison by Application (2016-2032)
- Figure 201: Latin America Transaction Monitoring Market Market Revenue (US$ Mn) Comparison by Function (2016-2032)
- Figure 202: Latin America Transaction Monitoring Market Market Revenue (US$ Mn) Comparison by Vertical (2016-2032)
- Figure 203: Latin America Transaction Monitoring Market Market Y-o-Y Growth Rate Comparison by Country (2016-2032)
- Figure 204: Latin America Transaction Monitoring Market Market Y-o-Y Growth Rate Comparison by Component (2016-2032)
- Figure 205: Latin America Transaction Monitoring Market Market Y-o-Y Growth Rate Comparison by Deployment Mode (2016-2032)
- Figure 206: Latin America Transaction Monitoring Market Market Y-o-Y Growth Rate Comparison by Enterprises Size (2016-2032)
- Figure 207: Latin America Transaction Monitoring Market Market Y-o-Y Growth Rate Comparison by Application (2016-2032)
- Figure 208: Latin America Transaction Monitoring Market Market Y-o-Y Growth Rate Comparison by Function (2016-2032)
- Figure 209: Latin America Transaction Monitoring Market Market Y-o-Y Growth Rate Comparison by Vertical (2016-2032)
- Figure 210: Latin America Transaction Monitoring Market Market Share Comparison by Country (2016-2032)
- Figure 211: Latin America Transaction Monitoring Market Market Share Comparison by Component (2016-2032)
- Figure 212: Latin America Transaction Monitoring Market Market Share Comparison by Deployment Mode (2016-2032)
- Figure 213: Latin America Transaction Monitoring Market Market Share Comparison by Enterprises Size (2016-2032)
- Figure 214: Latin America Transaction Monitoring Market Market Share Comparison by Application (2016-2032)
- Figure 215: Latin America Transaction Monitoring Market Market Share Comparison by Function (2016-2032)
- Figure 216: Latin America Transaction Monitoring Market Market Share Comparison by Vertical (2016-2032)
- Figure 217: Middle East & Africa Transaction Monitoring Market Revenue (US$ Mn) Market Share by Componentin 2022
- Figure 218: Middle East & Africa Transaction Monitoring Market Market Attractiveness Analysis by Component, 2016-2032
- Figure 219: Middle East & Africa Transaction Monitoring Market Revenue (US$ Mn) Market Share by Deployment Modein 2022
- Figure 220: Middle East & Africa Transaction Monitoring Market Market Attractiveness Analysis by Deployment Mode, 2016-2032
- Figure 221: Middle East & Africa Transaction Monitoring Market Revenue (US$ Mn) Market Share by Enterprises Sizein 2022
- Figure 222: Middle East & Africa Transaction Monitoring Market Market Attractiveness Analysis by Enterprises Size, 2016-2032
- Figure 223: Middle East & Africa Transaction Monitoring Market Revenue (US$ Mn) Market Share by Applicationin 2022
- Figure 224: Middle East & Africa Transaction Monitoring Market Market Attractiveness Analysis by Application, 2016-2032
- Figure 225: Middle East & Africa Transaction Monitoring Market Revenue (US$ Mn) Market Share by Functionin 2022
- Figure 226: Middle East & Africa Transaction Monitoring Market Market Attractiveness Analysis by Function, 2016-2032
- Figure 227: Middle East & Africa Transaction Monitoring Market Revenue (US$ Mn) Market Share by Verticalin 2022
- Figure 228: Middle East & Africa Transaction Monitoring Market Market Attractiveness Analysis by Vertical, 2016-2032
- Figure 229: Middle East & Africa Transaction Monitoring Market Revenue (US$ Mn) Market Share by Country in 2022
- Figure 230: Middle East & Africa Transaction Monitoring Market Market Attractiveness Analysis by Country, 2016-2032
- Figure 231: Middle East & Africa Transaction Monitoring Market Market Revenue (US$ Mn) (2016-2032)
- Figure 232: Middle East & Africa Transaction Monitoring Market Market Revenue (US$ Mn) Comparison by Country (2016-2032)
- Figure 233: Middle East & Africa Transaction Monitoring Market Market Revenue (US$ Mn) Comparison by Component (2016-2032)
- Figure 234: Middle East & Africa Transaction Monitoring Market Market Revenue (US$ Mn) Comparison by Deployment Mode (2016-2032)
- Figure 235: Middle East & Africa Transaction Monitoring Market Market Revenue (US$ Mn) Comparison by Enterprises Size (2016-2032)
- Figure 236: Middle East & Africa Transaction Monitoring Market Market Revenue (US$ Mn) Comparison by Application (2016-2032)
- Figure 237: Middle East & Africa Transaction Monitoring Market Market Revenue (US$ Mn) Comparison by Function (2016-2032)
- Figure 238: Middle East & Africa Transaction Monitoring Market Market Revenue (US$ Mn) Comparison by Vertical (2016-2032)
- Figure 239: Middle East & Africa Transaction Monitoring Market Market Y-o-Y Growth Rate Comparison by Country (2016-2032)
- Figure 240: Middle East & Africa Transaction Monitoring Market Market Y-o-Y Growth Rate Comparison by Component (2016-2032)
- Figure 241: Middle East & Africa Transaction Monitoring Market Market Y-o-Y Growth Rate Comparison by Deployment Mode (2016-2032)
- Figure 242: Middle East & Africa Transaction Monitoring Market Market Y-o-Y Growth Rate Comparison by Enterprises Size (2016-2032)
- Figure 243: Middle East & Africa Transaction Monitoring Market Market Y-o-Y Growth Rate Comparison by Application (2016-2032)
- Figure 244: Middle East & Africa Transaction Monitoring Market Market Y-o-Y Growth Rate Comparison by Function (2016-2032)
- Figure 245: Middle East & Africa Transaction Monitoring Market Market Y-o-Y Growth Rate Comparison by Vertical (2016-2032)
- Figure 246: Middle East & Africa Transaction Monitoring Market Market Share Comparison by Country (2016-2032)
- Figure 247: Middle East & Africa Transaction Monitoring Market Market Share Comparison by Component (2016-2032)
- Figure 248: Middle East & Africa Transaction Monitoring Market Market Share Comparison by Deployment Mode (2016-2032)
- Figure 249: Middle East & Africa Transaction Monitoring Market Market Share Comparison by Enterprises Size (2016-2032)
- Figure 250: Middle East & Africa Transaction Monitoring Market Market Share Comparison by Application (2016-2032)
- Figure 251: Middle East & Africa Transaction Monitoring Market Market Share Comparison by Function (2016-2032)
- Figure 252: Middle East & Africa Transaction Monitoring Market Market Share Comparison by Vertical (2016-2032)
"
- List of Tables
- "
- Table 1: Global Transaction Monitoring Market Market Comparison by Component (2016-2032)
- Table 2: Global Transaction Monitoring Market Market Comparison by Deployment Mode (2016-2032)
- Table 3: Global Transaction Monitoring Market Market Comparison by Enterprises Size (2016-2032)
- Table 4: Global Transaction Monitoring Market Market Comparison by Application (2016-2032)
- Table 5: Global Transaction Monitoring Market Market Comparison by Function (2016-2032)
- Table 6: Global Transaction Monitoring Market Market Comparison by Vertical (2016-2032)
- Table 7: Global Transaction Monitoring Market Revenue (US$ Mn) Comparison by Region (2016-2032)
- Table 8: Global Transaction Monitoring Market Market Revenue (US$ Mn) (2016-2032)
- Table 9: Global Transaction Monitoring Market Market Revenue (US$ Mn) Comparison by Region (2016-2032)
- Table 10: Global Transaction Monitoring Market Market Revenue (US$ Mn) Comparison by Component (2016-2032)
- Table 11: Global Transaction Monitoring Market Market Revenue (US$ Mn) Comparison by Deployment Mode (2016-2032)
- Table 12: Global Transaction Monitoring Market Market Revenue (US$ Mn) Comparison by Enterprises Size (2016-2032)
- Table 13: Global Transaction Monitoring Market Market Revenue (US$ Mn) Comparison by Application (2016-2032)
- Table 14: Global Transaction Monitoring Market Market Revenue (US$ Mn) Comparison by Function (2016-2032)
- Table 15: Global Transaction Monitoring Market Market Revenue (US$ Mn) Comparison by Vertical (2016-2032)
- Table 16: Global Transaction Monitoring Market Market Y-o-Y Growth Rate Comparison by Region (2016-2032)
- Table 17: Global Transaction Monitoring Market Market Y-o-Y Growth Rate Comparison by Component (2016-2032)
- Table 18: Global Transaction Monitoring Market Market Y-o-Y Growth Rate Comparison by Deployment Mode (2016-2032)
- Table 19: Global Transaction Monitoring Market Market Y-o-Y Growth Rate Comparison by Enterprises Size (2016-2032)
- Table 20: Global Transaction Monitoring Market Market Y-o-Y Growth Rate Comparison by Application (2016-2032)
- Table 21: Global Transaction Monitoring Market Market Y-o-Y Growth Rate Comparison by Function (2016-2032)
- Table 22: Global Transaction Monitoring Market Market Y-o-Y Growth Rate Comparison by Vertical (2016-2032)
- Table 23: Global Transaction Monitoring Market Market Share Comparison by Region (2016-2032)
- Table 24: Global Transaction Monitoring Market Market Share Comparison by Component (2016-2032)
- Table 25: Global Transaction Monitoring Market Market Share Comparison by Deployment Mode (2016-2032)
- Table 26: Global Transaction Monitoring Market Market Share Comparison by Enterprises Size (2016-2032)
- Table 27: Global Transaction Monitoring Market Market Share Comparison by Application (2016-2032)
- Table 28: Global Transaction Monitoring Market Market Share Comparison by Function (2016-2032)
- Table 29: Global Transaction Monitoring Market Market Share Comparison by Vertical (2016-2032)
- Table 30: North America Transaction Monitoring Market Market Comparison by Deployment Mode (2016-2032)
- Table 31: North America Transaction Monitoring Market Market Comparison by Enterprises Size (2016-2032)
- Table 32: North America Transaction Monitoring Market Market Comparison by Application (2016-2032)
- Table 33: North America Transaction Monitoring Market Market Comparison by Function (2016-2032)
- Table 34: North America Transaction Monitoring Market Market Comparison by Vertical (2016-2032)
- Table 35: North America Transaction Monitoring Market Revenue (US$ Mn) Comparison by Country (2016-2032)
- Table 36: North America Transaction Monitoring Market Market Revenue (US$ Mn) (2016-2032)
- Table 37: North America Transaction Monitoring Market Market Revenue (US$ Mn) Comparison by Country (2016-2032)
- Table 38: North America Transaction Monitoring Market Market Revenue (US$ Mn) Comparison by Component (2016-2032)
- Table 39: North America Transaction Monitoring Market Market Revenue (US$ Mn) Comparison by Deployment Mode (2016-2032)
- Table 40: North America Transaction Monitoring Market Market Revenue (US$ Mn) Comparison by Enterprises Size (2016-2032)
- Table 41: North America Transaction Monitoring Market Market Revenue (US$ Mn) Comparison by Application (2016-2032)
- Table 42: North America Transaction Monitoring Market Market Revenue (US$ Mn) Comparison by Function (2016-2032)
- Table 43: North America Transaction Monitoring Market Market Revenue (US$ Mn) Comparison by Vertical (2016-2032)
- Table 44: North America Transaction Monitoring Market Market Y-o-Y Growth Rate Comparison by Country (2016-2032)
- Table 45: North America Transaction Monitoring Market Market Y-o-Y Growth Rate Comparison by Component (2016-2032)
- Table 46: North America Transaction Monitoring Market Market Y-o-Y Growth Rate Comparison by Deployment Mode (2016-2032)
- Table 47: North America Transaction Monitoring Market Market Y-o-Y Growth Rate Comparison by Enterprises Size (2016-2032)
- Table 48: North America Transaction Monitoring Market Market Y-o-Y Growth Rate Comparison by Application (2016-2032)
- Table 49: North America Transaction Monitoring Market Market Y-o-Y Growth Rate Comparison by Function (2016-2032)
- Table 50: North America Transaction Monitoring Market Market Y-o-Y Growth Rate Comparison by Vertical (2016-2032)
- Table 51: North America Transaction Monitoring Market Market Share Comparison by Country (2016-2032)
- Table 52: North America Transaction Monitoring Market Market Share Comparison by Component (2016-2032)
- Table 53: North America Transaction Monitoring Market Market Share Comparison by Deployment Mode (2016-2032)
- Table 54: North America Transaction Monitoring Market Market Share Comparison by Enterprises Size (2016-2032)
- Table 55: North America Transaction Monitoring Market Market Share Comparison by Application (2016-2032)
- Table 56: North America Transaction Monitoring Market Market Share Comparison by Function (2016-2032)
- Table 57: North America Transaction Monitoring Market Market Share Comparison by Vertical (2016-2032)
- Table 58: Western Europe Transaction Monitoring Market Market Comparison by Component (2016-2032)
- Table 59: Western Europe Transaction Monitoring Market Market Comparison by Deployment Mode (2016-2032)
- Table 60: Western Europe Transaction Monitoring Market Market Comparison by Enterprises Size (2016-2032)
- Table 61: Western Europe Transaction Monitoring Market Market Comparison by Application (2016-2032)
- Table 62: Western Europe Transaction Monitoring Market Market Comparison by Function (2016-2032)
- Table 63: Western Europe Transaction Monitoring Market Market Comparison by Vertical (2016-2032)
- Table 64: Western Europe Transaction Monitoring Market Revenue (US$ Mn) Comparison by Country (2016-2032)
- Table 65: Western Europe Transaction Monitoring Market Market Revenue (US$ Mn) (2016-2032)
- Table 66: Western Europe Transaction Monitoring Market Market Revenue (US$ Mn) Comparison by Country (2016-2032)
- Table 67: Western Europe Transaction Monitoring Market Market Revenue (US$ Mn) Comparison by Component (2016-2032)
- Table 68: Western Europe Transaction Monitoring Market Market Revenue (US$ Mn) Comparison by Deployment Mode (2016-2032)
- Table 69: Western Europe Transaction Monitoring Market Market Revenue (US$ Mn) Comparison by Enterprises Size (2016-2032)
- Table 70: Western Europe Transaction Monitoring Market Market Revenue (US$ Mn) Comparison by Application (2016-2032)
- Table 71: Western Europe Transaction Monitoring Market Market Revenue (US$ Mn) Comparison by Function (2016-2032)
- Table 72: Western Europe Transaction Monitoring Market Market Revenue (US$ Mn) Comparison by Vertical (2016-2032)
- Table 73: Western Europe Transaction Monitoring Market Market Y-o-Y Growth Rate Comparison by Country (2016-2032)
- Table 74: Western Europe Transaction Monitoring Market Market Y-o-Y Growth Rate Comparison by Component (2016-2032)
- Table 75: Western Europe Transaction Monitoring Market Market Y-o-Y Growth Rate Comparison by Deployment Mode (2016-2032)
- Table 76: Western Europe Transaction Monitoring Market Market Y-o-Y Growth Rate Comparison by Enterprises Size (2016-2032)
- Table 77: Western Europe Transaction Monitoring Market Market Y-o-Y Growth Rate Comparison by Application (2016-2032)
- Table 78: Western Europe Transaction Monitoring Market Market Y-o-Y Growth Rate Comparison by Function (2016-2032)
- Table 79: Western Europe Transaction Monitoring Market Market Y-o-Y Growth Rate Comparison by Vertical (2016-2032)
- Table 80: Western Europe Transaction Monitoring Market Market Share Comparison by Country (2016-2032)
- Table 81: Western Europe Transaction Monitoring Market Market Share Comparison by Component (2016-2032)
- Table 82: Western Europe Transaction Monitoring Market Market Share Comparison by Deployment Mode (2016-2032)
- Table 83: Western Europe Transaction Monitoring Market Market Share Comparison by Enterprises Size (2016-2032)
- Table 84: Western Europe Transaction Monitoring Market Market Share Comparison by Application (2016-2032)
- Table 85: Western Europe Transaction Monitoring Market Market Share Comparison by Function (2016-2032)
- Table 86: Western Europe Transaction Monitoring Market Market Share Comparison by Vertical (2016-2032)
- Table 87: Eastern Europe Transaction Monitoring Market Market Comparison by Component (2016-2032)
- Table 88: Eastern Europe Transaction Monitoring Market Market Comparison by Deployment Mode (2016-2032)
- Table 89: Eastern Europe Transaction Monitoring Market Market Comparison by Enterprises Size (2016-2032)
- Table 90: Eastern Europe Transaction Monitoring Market Market Comparison by Application (2016-2032)
- Table 91: Eastern Europe Transaction Monitoring Market Market Comparison by Function (2016-2032)
- Table 92: Eastern Europe Transaction Monitoring Market Market Comparison by Vertical (2016-2032)
- Table 93: Eastern Europe Transaction Monitoring Market Revenue (US$ Mn) Comparison by Country (2016-2032)
- Table 94: Eastern Europe Transaction Monitoring Market Market Revenue (US$ Mn) (2016-2032)
- Table 95: Eastern Europe Transaction Monitoring Market Market Revenue (US$ Mn) Comparison by Country (2016-2032)
- Table 96: Eastern Europe Transaction Monitoring Market Market Revenue (US$ Mn) Comparison by Component (2016-2032)
- Table 97: Eastern Europe Transaction Monitoring Market Market Revenue (US$ Mn) Comparison by Deployment Mode (2016-2032)
- Table 98: Eastern Europe Transaction Monitoring Market Market Revenue (US$ Mn) Comparison by Enterprises Size (2016-2032)
- Table 99: Eastern Europe Transaction Monitoring Market Market Revenue (US$ Mn) Comparison by Application (2016-2032)
- Table 100: Eastern Europe Transaction Monitoring Market Market Revenue (US$ Mn) Comparison by Function (2016-2032)
- Table 101: Eastern Europe Transaction Monitoring Market Market Revenue (US$ Mn) Comparison by Vertical (2016-2032)
- Table 102: Eastern Europe Transaction Monitoring Market Market Y-o-Y Growth Rate Comparison by Country (2016-2032)
- Table 103: Eastern Europe Transaction Monitoring Market Market Y-o-Y Growth Rate Comparison by Component (2016-2032)
- Table 104: Eastern Europe Transaction Monitoring Market Market Y-o-Y Growth Rate Comparison by Deployment Mode (2016-2032)
- Table 105: Eastern Europe Transaction Monitoring Market Market Y-o-Y Growth Rate Comparison by Enterprises Size (2016-2032)
- Table 106: Eastern Europe Transaction Monitoring Market Market Y-o-Y Growth Rate Comparison by Application (2016-2032)
- Table 107: Eastern Europe Transaction Monitoring Market Market Y-o-Y Growth Rate Comparison by Function (2016-2032)
- Table 108: Eastern Europe Transaction Monitoring Market Market Y-o-Y Growth Rate Comparison by Vertical (2016-2032)
- Table 109: Eastern Europe Transaction Monitoring Market Market Share Comparison by Country (2016-2032)
- Table 110: Eastern Europe Transaction Monitoring Market Market Share Comparison by Component (2016-2032)
- Table 111: Eastern Europe Transaction Monitoring Market Market Share Comparison by Deployment Mode (2016-2032)
- Table 112: Eastern Europe Transaction Monitoring Market Market Share Comparison by Enterprises Size (2016-2032)
- Table 113: Eastern Europe Transaction Monitoring Market Market Share Comparison by Application (2016-2032)
- Table 114: Eastern Europe Transaction Monitoring Market Market Share Comparison by Function (2016-2032)
- Table 115: Eastern Europe Transaction Monitoring Market Market Share Comparison by Vertical (2016-2032)
- Table 116: APAC Transaction Monitoring Market Market Comparison by Component (2016-2032)
- Table 117: APAC Transaction Monitoring Market Market Comparison by Deployment Mode (2016-2032)
- Table 118: APAC Transaction Monitoring Market Market Comparison by Enterprises Size (2016-2032)
- Table 119: APAC Transaction Monitoring Market Market Comparison by Application (2016-2032)
- Table 120: APAC Transaction Monitoring Market Market Comparison by Function (2016-2032)
- Table 121: APAC Transaction Monitoring Market Market Comparison by Vertical (2016-2032)
- Table 122: APAC Transaction Monitoring Market Revenue (US$ Mn) Comparison by Country (2016-2032)
- Table 123: APAC Transaction Monitoring Market Market Revenue (US$ Mn) (2016-2032)
- Table 124: APAC Transaction Monitoring Market Market Revenue (US$ Mn) Comparison by Country (2016-2032)
- Table 125: APAC Transaction Monitoring Market Market Revenue (US$ Mn) Comparison by Component (2016-2032)
- Table 126: APAC Transaction Monitoring Market Market Revenue (US$ Mn) Comparison by Deployment Mode (2016-2032)
- Table 127: APAC Transaction Monitoring Market Market Revenue (US$ Mn) Comparison by Enterprises Size (2016-2032)
- Table 128: APAC Transaction Monitoring Market Market Revenue (US$ Mn) Comparison by Application (2016-2032)
- Table 129: APAC Transaction Monitoring Market Market Revenue (US$ Mn) Comparison by Function (2016-2032)
- Table 130: APAC Transaction Monitoring Market Market Revenue (US$ Mn) Comparison by Vertical (2016-2032)
- Table 131: APAC Transaction Monitoring Market Market Y-o-Y Growth Rate Comparison by Country (2016-2032)
- Table 132: APAC Transaction Monitoring Market Market Y-o-Y Growth Rate Comparison by Component (2016-2032)
- Table 133: APAC Transaction Monitoring Market Market Y-o-Y Growth Rate Comparison by Deployment Mode (2016-2032)
- Table 134: APAC Transaction Monitoring Market Market Y-o-Y Growth Rate Comparison by Enterprises Size (2016-2032)
- Table 135: APAC Transaction Monitoring Market Market Y-o-Y Growth Rate Comparison by Application (2016-2032)
- Table 136: APAC Transaction Monitoring Market Market Y-o-Y Growth Rate Comparison by Function (2016-2032)
- Table 137: APAC Transaction Monitoring Market Market Y-o-Y Growth Rate Comparison by Vertical (2016-2032)
- Table 138: APAC Transaction Monitoring Market Market Share Comparison by Country (2016-2032)
- Table 139: APAC Transaction Monitoring Market Market Share Comparison by Component (2016-2032)
- Table 140: APAC Transaction Monitoring Market Market Share Comparison by Deployment Mode (2016-2032)
- Table 141: APAC Transaction Monitoring Market Market Share Comparison by Enterprises Size (2016-2032)
- Table 142: APAC Transaction Monitoring Market Market Share Comparison by Application (2016-2032)
- Table 143: APAC Transaction Monitoring Market Market Share Comparison by Function (2016-2032)
- Table 144: APAC Transaction Monitoring Market Market Share Comparison by Vertical (2016-2032)
- Table 145: Latin America Transaction Monitoring Market Market Comparison by Component (2016-2032)
- Table 146: Latin America Transaction Monitoring Market Market Comparison by Deployment Mode (2016-2032)
- Table 147: Latin America Transaction Monitoring Market Market Comparison by Enterprises Size (2016-2032)
- Table 148: Latin America Transaction Monitoring Market Market Comparison by Application (2016-2032)
- Table 149: Latin America Transaction Monitoring Market Market Comparison by Function (2016-2032)
- Table 150: Latin America Transaction Monitoring Market Market Comparison by Vertical (2016-2032)
- Table 151: Latin America Transaction Monitoring Market Revenue (US$ Mn) Comparison by Country (2016-2032)
- Table 152: Latin America Transaction Monitoring Market Market Revenue (US$ Mn) (2016-2032)
- Table 153: Latin America Transaction Monitoring Market Market Revenue (US$ Mn) Comparison by Country (2016-2032)
- Table 154: Latin America Transaction Monitoring Market Market Revenue (US$ Mn) Comparison by Component (2016-2032)
- Table 155: Latin America Transaction Monitoring Market Market Revenue (US$ Mn) Comparison by Deployment Mode (2016-2032)
- Table 156: Latin America Transaction Monitoring Market Market Revenue (US$ Mn) Comparison by Enterprises Size (2016-2032)
- Table 157: Latin America Transaction Monitoring Market Market Revenue (US$ Mn) Comparison by Application (2016-2032)
- Table 158: Latin America Transaction Monitoring Market Market Revenue (US$ Mn) Comparison by Function (2016-2032)
- Table 159: Latin America Transaction Monitoring Market Market Revenue (US$ Mn) Comparison by Vertical (2016-2032)
- Table 160: Latin America Transaction Monitoring Market Market Y-o-Y Growth Rate Comparison by Country (2016-2032)
- Table 161: Latin America Transaction Monitoring Market Market Y-o-Y Growth Rate Comparison by Component (2016-2032)
- Table 162: Latin America Transaction Monitoring Market Market Y-o-Y Growth Rate Comparison by Deployment Mode (2016-2032)
- Table 163: Latin America Transaction Monitoring Market Market Y-o-Y Growth Rate Comparison by Enterprises Size (2016-2032)
- Table 164: Latin America Transaction Monitoring Market Market Y-o-Y Growth Rate Comparison by Application (2016-2032)
- Table 165: Latin America Transaction Monitoring Market Market Y-o-Y Growth Rate Comparison by Function (2016-2032)
- Table 166: Latin America Transaction Monitoring Market Market Y-o-Y Growth Rate Comparison by Vertical (2016-2032)
- Table 167: Latin America Transaction Monitoring Market Market Share Comparison by Country (2016-2032)
- Table 168: Latin America Transaction Monitoring Market Market Share Comparison by Component (2016-2032)
- Table 169: Latin America Transaction Monitoring Market Market Share Comparison by Deployment Mode (2016-2032)
- Table 170: Latin America Transaction Monitoring Market Market Share Comparison by Enterprises Size (2016-2032)
- Table 171: Latin America Transaction Monitoring Market Market Share Comparison by Application (2016-2032)
- Table 172: Latin America Transaction Monitoring Market Market Share Comparison by Function (2016-2032)
- Table 173: Latin America Transaction Monitoring Market Market Share Comparison by Vertical (2016-2032)
- Table 174: Middle East & Africa Transaction Monitoring Market Market Comparison by Component (2016-2032)
- Table 175: Middle East & Africa Transaction Monitoring Market Market Comparison by Deployment Mode (2016-2032)
- Table 176: Middle East & Africa Transaction Monitoring Market Market Comparison by Enterprises Size (2016-2032)
- Table 177: Middle East & Africa Transaction Monitoring Market Market Comparison by Application (2016-2032)
- Table 178: Middle East & Africa Transaction Monitoring Market Market Comparison by Function (2016-2032)
- Table 179: Middle East & Africa Transaction Monitoring Market Market Comparison by Vertical (2016-2032)
- Table 180: Middle East & Africa Transaction Monitoring Market Revenue (US$ Mn) Comparison by Country (2016-2032)
- Table 181: Middle East & Africa Transaction Monitoring Market Market Revenue (US$ Mn) (2016-2032)
- Table 182: Middle East & Africa Transaction Monitoring Market Market Revenue (US$ Mn) Comparison by Country (2016-2032)
- Table 183: Middle East & Africa Transaction Monitoring Market Market Revenue (US$ Mn) Comparison by Component (2016-2032)
- Table 184: Middle East & Africa Transaction Monitoring Market Market Revenue (US$ Mn) Comparison by Deployment Mode (2016-2032)
- Table 185: Middle East & Africa Transaction Monitoring Market Market Revenue (US$ Mn) Comparison by Enterprises Size (2016-2032)
- Table 186: Middle East & Africa Transaction Monitoring Market Market Revenue (US$ Mn) Comparison by Application (2016-2032)
- Table 187: Middle East & Africa Transaction Monitoring Market Market Revenue (US$ Mn) Comparison by Function (2016-2032)
- Table 188: Middle East & Africa Transaction Monitoring Market Market Revenue (US$ Mn) Comparison by Vertical (2016-2032)
- Table 189: Middle East & Africa Transaction Monitoring Market Market Y-o-Y Growth Rate Comparison by Country (2016-2032)
- Table 190: Middle East & Africa Transaction Monitoring Market Market Y-o-Y Growth Rate Comparison by Component (2016-2032)
- Table 191: Middle East & Africa Transaction Monitoring Market Market Y-o-Y Growth Rate Comparison by Deployment Mode (2016-2032)
- Table 192: Middle East & Africa Transaction Monitoring Market Market Y-o-Y Growth Rate Comparison by Enterprises Size (2016-2032)
- Table 193: Middle East & Africa Transaction Monitoring Market Market Y-o-Y Growth Rate Comparison by Application (2016-2032)
- Table 194: Middle East & Africa Transaction Monitoring Market Market Y-o-Y Growth Rate Comparison by Function (2016-2032)
- Table 195: Middle East & Africa Transaction Monitoring Market Market Y-o-Y Growth Rate Comparison by Vertical (2016-2032)
- Table 196: Middle East & Africa Transaction Monitoring Market Market Share Comparison by Country (2016-2032)
- Table 197: Middle East & Africa Transaction Monitoring Market Market Share Comparison by Component (2016-2032)
- Table 198: Middle East & Africa Transaction Monitoring Market Market Share Comparison by Deployment Mode (2016-2032)
- Table 199: Middle East & Africa Transaction Monitoring Market Market Share Comparison by Enterprises Size (2016-2032)
- Table 200: Middle East & Africa Transaction Monitoring Market Market Share Comparison by Application (2016-2032)
- Table 201: Middle East & Africa Transaction Monitoring Market Market Share Comparison by Function (2016-2032)
- Table 202: Middle East & Africa Transaction Monitoring Market Market Share Comparison by Vertical (2016-2032)
- 1. Executive Summary
-
- Fiserv, Inc.
- SAS Institute, Inc.
- IBM Corporation
- FIS
- Oracle Corporation
- Fair Isaac Corporation
- NICE Systems Ltd
- ACI Worldwide
- ACTICO GmbH
- Bottomline Technologies
- Beam Solutions, Inc.
- Infrasoft Technologies
- Software AG
- Experian Information Solutions, Inc.
- BAE Systems
Our Clients


View Our Licence Options
