
Global Third-Party Logistics (3PL) Market By Service(Domestic Transportation Management (DTM), International Transportation Management (ITM), Dedicated Contract Carriage (DCC)/ Freight forwarding, Value-Added Logistics Services (VALs), Warehousing & Distribution (W&D)), By Transport(Railways, Roadways, Airways, Waterways), By End-Use(Retail, Manufacturing, Automotive, Healthcare, Others), By Region And Companies - Industry Segment Outlook, Market Assessment, Competition Scenario, Trends, And Forecast 2024-2033
-
47894
-
June 2024
-
300
-


-
This report was compiled by Kalyani Khudsange Kalyani Khudsange is a Research Analyst at Prudour Pvt. Ltd. with 2.5 years of experience in market research and a strong technical background in Chemical Engineering and manufacturing. Correspondence Sr. Research Analyst Linkedin | Detailed Market research Methodology Our methodology involves a mix of primary research, including interviews with leading mental health experts, and secondary research from reputable medical journals and databases. View Detailed Methodology Page
-
Quick Navigation
Report Overview
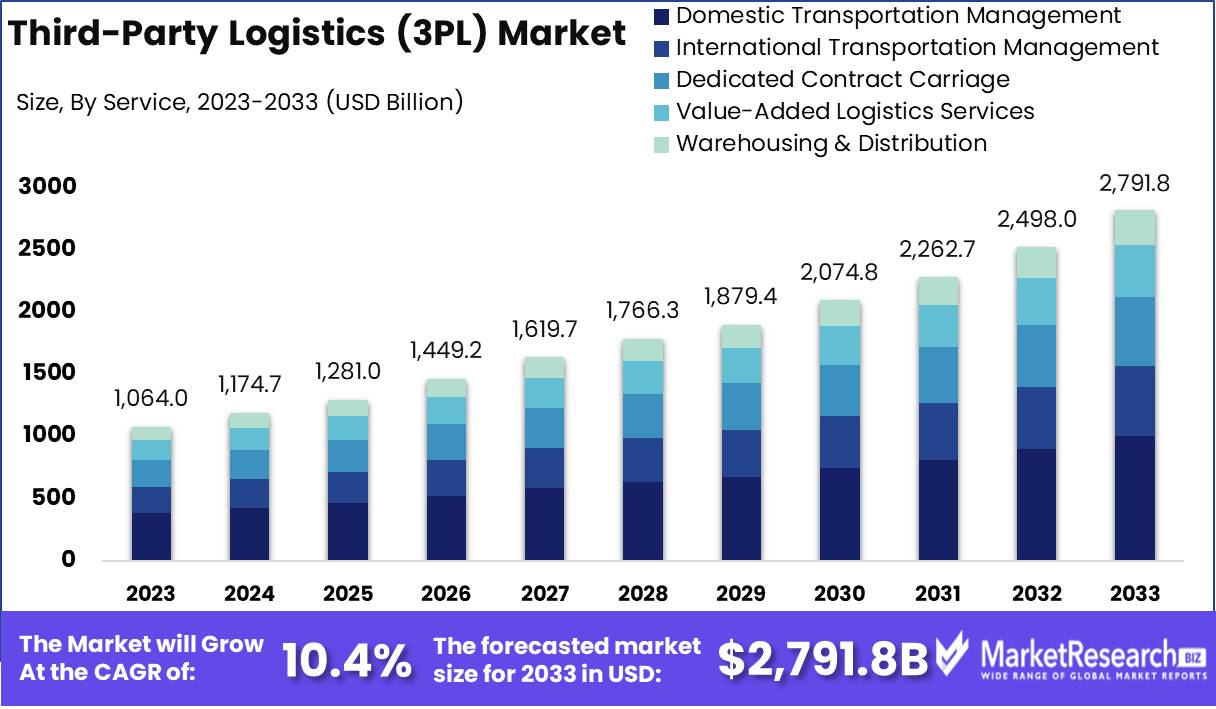
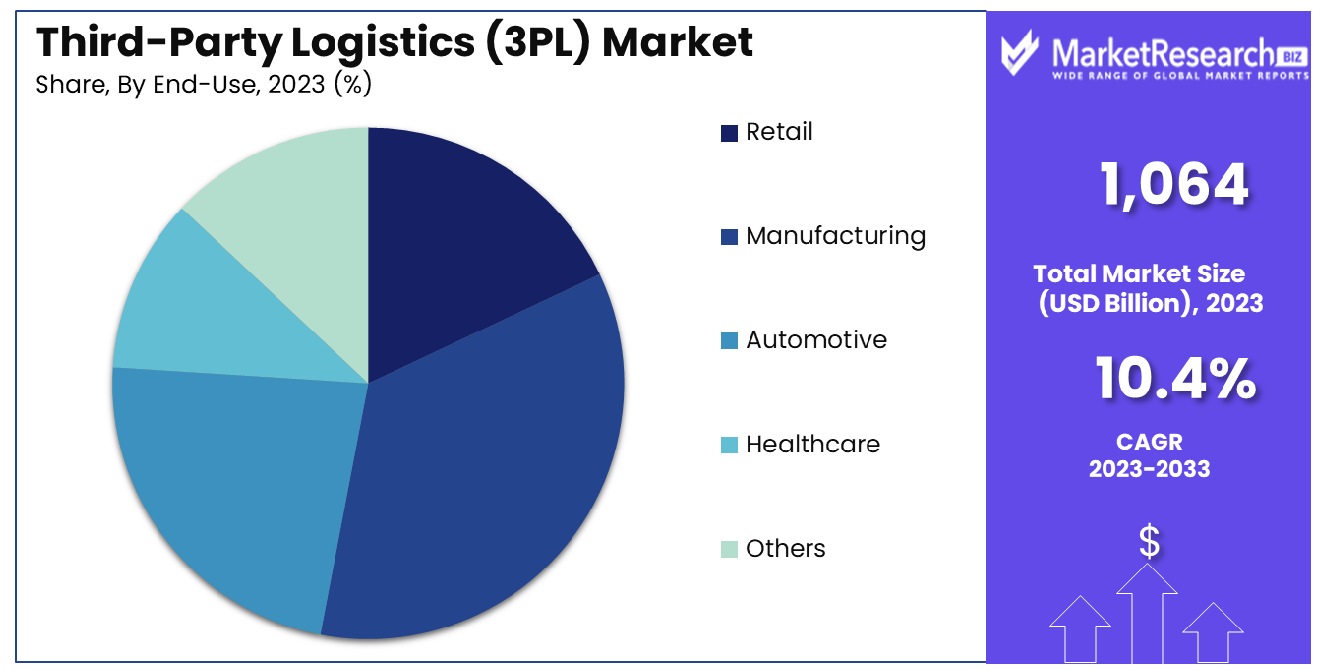
The Global Third-Party Logistics (3PL) Market was valued at USD 1,064 billion in 2023. It is expected to reach USD 2,791.8 billion by 2033, with a CAGR of 10.4% during the forecast period from 2024 to 2033.
The Third-Party Logistics (3PL) Market encompasses service providers that manage and execute logistics operations for other businesses. These services include transportation, warehousing, and distribution management, allowing companies to optimize their supply chain efficiency and focus on core business competencies. This market is pivotal for organizations looking to streamline operations and reduce costs through outsourcing.
As companies globalize and consumer demands evolve, the reliance on 3PL providers increases, positioning them as essential partners in facilitating responsive, flexible, and scalable supply chain solutions. This market is integral for executives aiming to enhance operational efficiency and competitiveness in a global marketplace.
In recent years, the Third-Party Logistics (3PL) Market has witnessed significant transformations, driven by evolving business needs and external economic pressures. The market dynamics of 2023 suggest a notable shift in operational capacities and cost structures. Notably, the proportion of 3PL warehouses operating above 90% capacity has dramatically reduced from 59% in 2022 to 33% in 2023. This decline points towards a substantial correction in inventory levels, potentially indicating a recalibration of supply chain strategies among 3PL providers.
Financially, the sector is grappling with increased labor costs, a trend reported by 70% of respondents. This rise in costs is linked with the broader economic context of wage inflation and could reflect tighter labor markets. Interestingly, only 10% reported decreased labor costs, which correlates with declines in order volumes and profitability, highlighting the impact of reduced economic activity on the logistics sector.
Despite these challenges, the relationship dynamics within the market remain strong. A significant 83% of shippers perceive their relationships with 3PL providers as successful, contrasting with an even more optimistic view from the providers, where 99% consider these partnerships successful. However, there is a notable decline in the proportion of logistics expenditures devoted to outsourcing, down to 42%. This reduction could suggest a cautious approach from shippers, possibly adjusting to the current economic climate and re-evaluating the cost-effectiveness of outsourcing logistics operations.
Key Takeaways
- Market Growth: The Global Third-Party Logistics (3PL) Market was valued at USD 1,064 billion in 2023. It is expected to reach USD 2,791.8 billion by 2033, with a CAGR of 10.4% during the forecast period from 2024 to 2033.
- By Service: In Domestic Transportation Management (DTM), efficiency and logistics planning dominate.
- By Transport: The roadways transport sector is primarily dominated by flexibility and accessibility.
- By End-Use: The Manufacturing sector shows dominance in end-use applications across various industries.
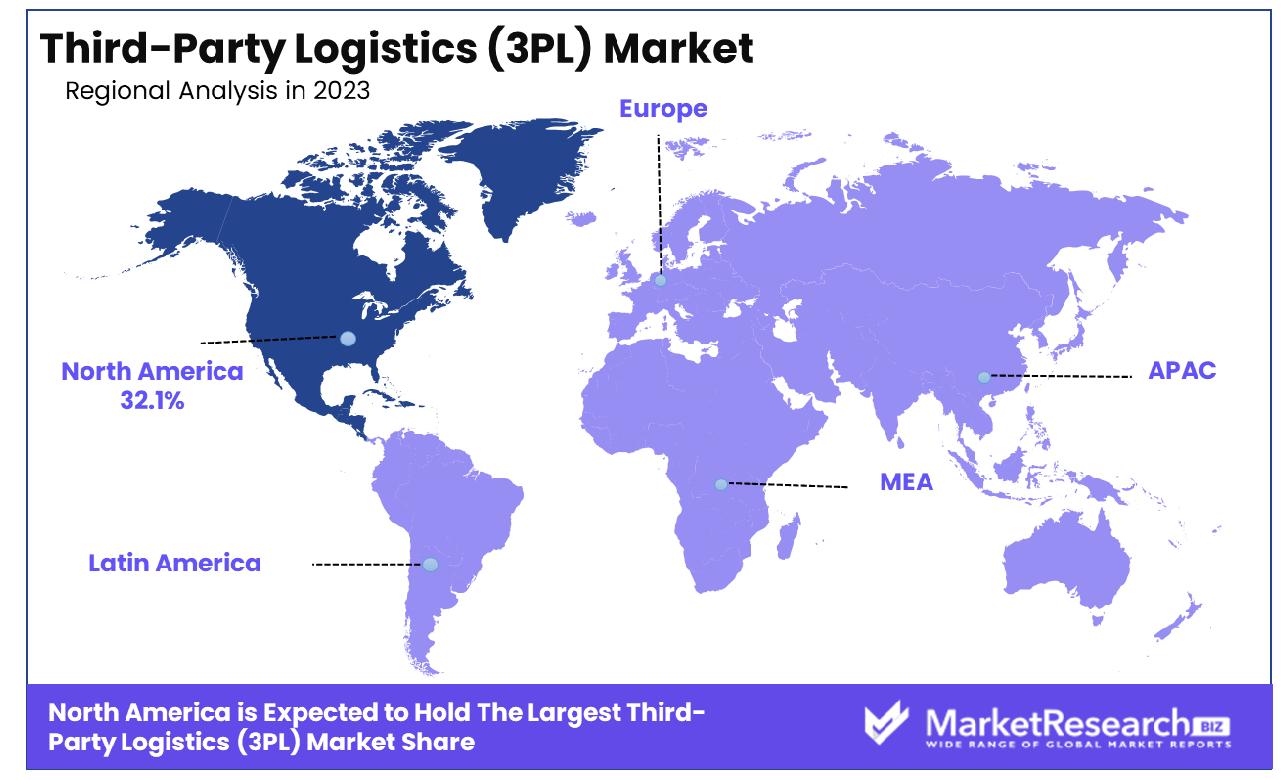
- Regional Dominance: The Third-Party Logistics (3PL) Market in North America holds a 32.1% share.
- Growth Opportunity: The global Third-Party Logistics (3PL) market in 2023 will benefit from integrating game-changing technologies like AI, ML, IoT, and robotics, enhancing efficiency, accuracy, and operational scalability.
Driving factors
Globalization and International Trade: Catalysts for Expanding 3PL Markets
The relentless expansion of globalization significantly fuels the growth of the Third-Party Logistics (3PL) market. As businesses reach across borders, the complexity of managing logistics increases, driving the demand for 3PL services that offer specialized knowledge of local markets, customs regulations, and transportation management. This is particularly vital as companies aim to penetrate new and emerging markets.
Moreover, international trade agreements and regional trade blocs tend to reduce tariffs and streamline cross-border commerce, creating more opportunities for 3PL providers. By enabling more efficient global trade, these providers play a crucial role in the supply chains of multinational corporations, thus escalating the market's growth trajectory.
Improved Infrastructure: Enabling Enhanced 3PL Capabilities
Infrastructure improvements, particularly in emerging economies, directly enhance the operational capabilities of 3PL providers. The development of modern ports, upgraded transportation networks, and advanced logistics hubs allow for smoother transit of goods, reduced delivery times, and lower costs. These enhancements make it more feasible for businesses to outsource their logistics functions to 3PL providers, who can leverage these infrastructures to offer more reliable and efficient services.
Furthermore, advancements in information and communication technology (ICT) infrastructure, such as the Internet of Things (IoT) and cloud computing, empower 3PL providers to offer better tracking, real-time data, and enhanced communication, thus improving overall supply chain visibility and efficiency.
Sustainability Initiatives: Driving Eco-Friendly Logistics Solutions
Sustainability initiatives are increasingly becoming a critical driving force in the 3PL market. Companies, driven by both regulatory requirements and consumer demand for environmental responsibility, are seeking 3PL providers that can offer eco-friendly logistics solutions. This includes the utilization of green vehicles, energy-efficient warehousing, and optimization of transportation routes to reduce carbon footprints.
Moreover, as the global focus on sustainability intensifies, 3PL providers that innovate in green logistics are likely to attract more clients looking to enhance their brand reputation and comply with environmental standards. This shift not only fosters growth in the 3PL market but also encourages the industry to innovate continually in environmental management practices.
Restraining Factors
High Initial Investments: A Barrier to Entry and Expansion in the 3PL Market
High initial investments required for setting up and expanding logistics operations represent a significant restraint in the Third-Party Logistics (3PL) market. The need for substantial capital to acquire and maintain advanced logistics technologies, fleet management, warehousing facilities, and sophisticated IT systems can deter new entrants and limit the expansion capabilities of existing players.
This financial barrier can be particularly challenging for small to medium-sized enterprises (SMEs) that might lack the necessary capital to compete with larger, more established companies. The high cost of entry not only restricts the number of new players in the market but also affects the pace at which existing providers can scale their operations, thereby impacting the overall growth potential of the market.
Dependence on Infrastructure: Limiting Market Reach and Efficiency
The dependence on robust infrastructure is another critical restraining factor for the 3PL market. In regions where infrastructure is underdeveloped, the inefficiencies of transport networks, ports, and logistics hubs can significantly impede the operational effectiveness of 3PL providers. This limitation affects their ability to offer timely and cost-effective services, ultimately making these regions less attractive for business expansion.
Furthermore, in countries with inadequate technological infrastructure, the lack of advanced IT and communication systems can hinder the real-time tracking and management of logistics operations, affecting service reliability and customer satisfaction. These infrastructural dependencies necessitate large investments in local and international markets, thus slowing down the rapid scaling of 3PL services globally.
By Service Analysis
Domestic Transportation Management (DTM) dominated the logistics sector due to efficient and cost-effective solutions.
In 2023, Domestic Transportation Management (DTM) held a dominant market position in the By Service segment of the Third-Party Logistics (3PL) Market. DTM services encompass a crucial aspect of logistics outsourcing, facilitating the efficient movement of goods within national borders. This segment's dominance can be attributed to increasing globalization and the need for streamlined supply chain operations across diverse industry verticals.
International Transportation Management (ITM), another significant player in the 3PL sector, focuses on managing complex logistics networks spanning international borders. This service segment saw robust growth in 2023, driven by expanding global trade volumes and the demand for comprehensive supply chain solutions.
Dedicated Contract Carriage (DCC) and Freight Forwarding services also played pivotal roles within the 3PL market landscape. DCC provides specialized transportation solutions tailored to specific client needs, ensuring dedicated fleet operations for enhanced control and efficiency. Freight forwarding services, on the other hand, manage the intricate process of shipping goods internationally, navigating regulatory compliance, and optimizing transit times.
Value-Added Logistics Services (VALs) continued to see steady adoption, offering customized solutions such as packaging, assembly, and order fulfillment. These services add significant value to supply chain operations by enhancing efficiency and reducing costs for businesses.
Warehousing & Distribution (W&D) services remained fundamental in the 3PL market, providing essential infrastructure and logistical support for storing and distributing goods. The growth of e-commerce and omnichannel retailing further bolstered the demand for advanced warehousing solutions capable of handling diverse product inventories and meeting stringent delivery timelines.
By Transport Analysis
Roadways dominated the transportation industry, offering flexibility, reliability, and extensive network coverage.
In 2023, Roadways held a dominant market position in the By Transport segment of the Third-Party Logistics (3PL) Market. This segment's prominence underscores the pivotal role of road transportation in the logistics industry, catering to diverse cargo requirements across regional and national landscapes. Roadways offer flexibility, accessibility, and cost-efficiency, making them the preferred choice for last-mile delivery and transportation of goods where infrastructure supports road networks.
Railways, while significant in long-distance and bulk transportation, faced challenges in agility and door-to-door delivery capabilities compared to road transport. However, railways continued to play a crucial role in intermodal logistics solutions, particularly for heavy and bulk cargo movements across extensive distances, leveraging their efficiency in fuel consumption and carbon footprint reduction.
Airways maintained their niche in the 3PL market, primarily serving time-sensitive shipments and high-value goods requiring rapid delivery across global distances. The air transport segment saw growth driven by the expansion of e-commerce and global trade, necessitating swift and reliable logistics solutions to meet consumer demands for expedited shipping.
Waterways, though a traditional mode of transportation for bulk goods and international trade, faced challenges related to infrastructure development and operational efficiency. Nevertheless, water transport continued to offer cost-effective solutions for transporting large volumes of cargo over long distances, particularly for industries reliant on global supply chains and maritime trade routes.
By End-Use Analysis
Manufacturing dominated the logistics demand, requiring efficient supply chains for production and distribution processes.
In 2023, Manufacturing held a dominant market position in the By End-Use segment of the Third-Party Logistics (3PL) Market. This segment's leadership underscores the critical role of logistics services in supporting the complex supply chains of manufacturing industries worldwide. Manufacturing companies rely heavily on 3PL providers to streamline operations, optimize inventory management, and ensure efficient distribution of raw materials and finished goods across global markets.
Retail followed closely, benefiting from 3PL solutions that enhance inventory visibility, order fulfillment speed, and customer satisfaction in the competitive retail landscape. The surge in e-commerce activities further propelled demand for agile logistics services capable of handling diverse product assortments and meeting dynamic consumer expectations.
The Automotive sector also saw significant utilization of 3PL services, leveraging specialized transportation and supply chain solutions to manage parts distribution, aftermarket logistics, and global assembly operations. This segment's reliance on just-in-time deliveries and stringent quality control standards drove the adoption of advanced logistics technologies and strategic partnerships with 3PL providers.
Healthcare emerged as a critical end-use segment for 3PL services, driven by regulatory complexities, temperature-sensitive shipments, and the need for compliant storage and distribution of pharmaceuticals and medical devices. 3PL providers in this sector specialize in ensuring product integrity, traceability, and adherence to stringent regulatory requirements, thereby supporting the healthcare industry's mission-critical logistics needs.
Key Market Segments
By Service
- Domestic Transportation Management (DTM)
- International Transportation Management (ITM)
- Dedicated Contract Carriage (DCC)/ Freight forwarding
- Value-Added Logistics Services (VALs)
- Warehousing & Distribution (W&D)
By Transport
- Railways
- Roadways
- Airways
- Waterways
By End-Use
- Retail
- Manufacturing
- Automotive
- Healthcare
- Others
Growth Opportunity
Increased Use Of Emerging New Game-Changing Technologies
The global Third-Party Logistics (3PL) market in 2023 stands on the precipice of transformation, primarily fueled by the incorporation of new, game-changing technologies. As industries continue to navigate the complexities of supply chain management, the integration of technologies such as IoT, blockchain, and advanced data analytics into 3PL services offers a significant competitive edge. These technologies not only enhance operational efficiency but also improve the accuracy of inventory tracking and the reliability of supply chain transparency.
The potential for real-time data processing and enhanced visibility across the logistics network can drastically reduce errors and costs, thereby enhancing overall customer satisfaction and loyalty. This strategic incorporation of cutting-edge technologies is expected to not only retain existing clients but also attract new ones who are seeking innovative logistics solutions that can adapt swiftly to changing market dynamics.
Integration of Artificial Intelligence, Machine Learning, and Robotics
The adoption of Artificial Intelligence (AI), Machine Learning (ML), and robotics in the Third-Party Logistics (3PL) market is set to redefine the operational paradigms of this industry. AI and ML are pivotal in optimizing routes and predicting market trends, which can significantly mitigate risks and maximize efficiency. Robotics, on the other hand, streamlines warehouse operations, reducing the burden of manual labor and accelerating order processing times.
This integration not only propels productivity but also enhances scalability by allowing 3PL providers to handle larger volumes of operations without a proportional increase in errors or costs. Consequently, these technological integrations are critical for 3PL providers aiming to enhance service offerings and maintain competitive advantage in an increasingly digital and automated world.
Latest Trends
Personalized and Value-Added Services
In 2023, the global Third-Party Logistics (3PL) market is witnessing a significant shift towards personalized and value-added services. As the market becomes increasingly competitive, 3PL providers are differentiating themselves by offering customized logistics solutions tailored to specific client needs. This trend is driven by the growing demand for more than just basic logistics; clients now expect services that contribute directly to their value chain, such as real-time data access, enhanced inventory management, and advanced reporting capabilities.
Additionally, value-added services like reverse logistics, eco-friendly packaging, and specialized handling for unique product categories are becoming standard offerings. These personalized services not only improve client satisfaction and retention but also enable 3PL providers to command higher premiums, thereby boosting their profitability in a crowded market.
Collaborative Logistics Models
Collaborative logistics models are gaining traction in the 2023 global Third-Party Logistics (3PL) market as businesses seek to optimize supply chain efficiencies through partnership and cooperation. This trend involves sharing logistics infrastructure and information among multiple stakeholders to reduce costs and improve service delivery. By leveraging shared resources, companies can achieve economies of scale, reducing overheads and enhancing flexibility to respond to market changes.
Collaborative models also facilitate a more integrated approach to supply chain management, enabling smoother coordination and communication between partners. This is particularly beneficial in handling complex logistics operations and can lead to more innovative solutions and improved customer service across the board.
Regional Analysis
North America holds a 32.1% share in the Third-Party Logistics (3PL) Market.
The Third-Party Logistics (3PL) Market is segmented into various regions, including North America, Europe, Asia Pacific, the Middle East & Africa, and Latin America, each demonstrating unique growth patterns and market dynamics.
North America holds the dominant position, accounting for 32.1% of the global market share, driven by robust infrastructure, advanced technology adoption, and the presence of key industry players. The region's market value is further bolstered by the expanding e-commerce sector and the demand for efficient logistics solutions.
Europe follows closely, marked by significant contributions from Germany, the UK, and France, driven by the integration of advanced logistics technologies and the region’s commitment to sustainable practices. The European 3PL market benefits from a well-established transportation network and regulatory frameworks that facilitate smooth cross-border trade, fostering market growth.
The Asia Pacific region exhibits the fastest growth rate due to rapid industrialization, economic growth, and increasing e-commerce activities, particularly in China, India, and Japan. The region’s market expansion is underpinned by investments in infrastructure development, government initiatives to enhance logistics efficiency, and a growing consumer base that demands swift and reliable delivery services.
The Middle East & Africa region is also witnessing steady growth, propelled by the development of logistics hubs, free trade zones, and increased trade activities within the Gulf Cooperation Council (GCC) countries. The strategic geographical location of the Middle East as a global trade corridor enhances its market potential.
In Latin America, Brazil and Mexico lead the 3PL market, supported by growing industrialization and improvements in transportation infrastructure. The region's market growth is also driven by the increasing adoption of outsourced logistics services by various industries aiming to optimize supply chain operations.
Key Regions and Countries
North America
- The US
- Canada
- Rest of North America
Europe
- Germany
- France
- The UK
- Spain
- Netherlands
- Russia
- Italy
- Rest of Europe
Asia-Pacific
- China
- Japan
- Singapore
- Thailand
- South Korea
- Vietnam
- India
- New Zealand
- Rest of Asia Pacific
Latin America
- Mexico
- Brazil
- Rest of Latin America
Middle East & Africa
- Saudi Arabia
- South Africa
- UAE
- Rest of Middle East & Africa
Key Players Analysis
In 2023, the global Third-Party Logistics (3PL) Market is characterized by the strategic maneuvers and operational excellence of key industry players, including Burris Logistics, CEVA Logistics, C.H. Robinson Worldwide (CHRW) Inc., DB Schenker Logistics, FedEx Corporation, BDP International, UPS Supply Chain Solutions, Inc., Kuehne + Nagel International AG, J.B. Hunt Transport Services, Inc., Nippon Express Co., Ltd., and XPO Logistics, Inc.
Burris Logistics continues to innovate in cold chain solutions, leveraging advanced technology to enhance efficiency and reliability. CEVA Logistics, known for its comprehensive global network, focuses on expanding its presence in emerging markets, enhancing its e-commerce logistics capabilities. C.H. Robinson Worldwide (CHRW) Inc. remains a significant player due to its extensive transportation network and robust digital platform, which offers data-driven insights and optimized logistics solutions.
DB Schenker Logistics, with its strong European foothold, emphasizes sustainability and digital transformation, positioning itself as a leader in green logistics. FedEx Corporation maintains its competitive edge through continuous investments in automation and last-mile delivery solutions, catering to the growing e-commerce sector. BDP International leverages its expertise in specialized logistics, particularly in the chemicals and healthcare sectors, to offer customized solutions.
UPS Supply Chain Solutions, Inc. strengthens its market position with a focus on global trade facilitation and innovative supply chain solutions. Kuehne + Nagel International AG leads in sea freight logistics, with a strong emphasis on digital logistics and customer-centric services. J.B. Hunt Transport Services, Inc. continues to excel in intermodal logistics, leveraging its extensive transportation network in North America.
Nippon Express Co., Ltd. capitalizes on its vast network across Asia, providing integrated logistics solutions and expanding its global reach. XPO Logistics, Inc. focuses on technology-driven logistics, optimizing supply chain operations through advanced automation and data analytics.
Collectively, these companies drive the global 3PL market forward through strategic expansions, technological advancements, and a strong emphasis on sustainability and customer-centric solutions. Their continuous innovations and robust market presence contribute significantly to the overall growth and dynamism of the 3PL industry in 2023.
Market Key Players
- Burris Logistics
- CEVA Logistics
- C.H. Robinson Worldwide (CHRW) Inc.
- DB Schenker Logistics
- FedEx Corporation
- BDP International
- UPS Supply Chain Solutions, Inc.
- Kuehne + Nagel International AG
- J.B. Hunt Transport Services, Inc.
- Nippon Express Co., Ltd.
- XPO Logistics, Inc
Recent Development
- In April 2024, Omni Logistics, in partnership with AWS Advanced Partner BizCloud Experts, achieved a 35% cost reduction post-migration, eliminated colocation data centers, and enhanced scalability and innovation.
- In July 2023, Ecom Express Limited, led by COO Vishwachetan Nadamani, tackled challenges in e-commerce supply chains, emphasizing data-driven solutions, efficient reverse logistics management, and customer-centric approaches for D2C growth.
Report Scope
Report Features Description Market Value (2023) USD 1,064 Billion Forecast Revenue (2033) USD 2,791.8 Billion CAGR (2024-2032) 10.4% Base Year for Estimation 2023 Historic Period 2016-2023 Forecast Period 2024-2033 Report Coverage Revenue Forecast, Market Dynamics, COVID-19 Impact, Competitive Landscape, Recent Developments Segments Covered By Service(Domestic Transportation Management (DTM), International Transportation Management (ITM), Dedicated Contract Carriage (DCC)/ Freight forwarding, Value-Added Logistics Services (VALs), Warehousing & Distribution (W&D)), By Transport(Railways, Roadways, Airways, Waterways), By End-Use(Retail, Manufacturing, Automotive, Healthcare, Others) Regional Analysis North America - The US, Canada, Rest of North America, Europe - Germany, France, The UK, Spain, Italy, Russia, Netherlands, Rest of Europe, Asia-Pacific - China, Japan, South Korea, India, New Zealand, Singapore, Thailand, Vietnam, Rest of Asia Pacific, Latin America - Brazil, Mexico, Rest of Latin America, Middle East & Africa - South Africa, Saudi Arabia, UAE, Rest of Middle East & Africa Competitive Landscape Burris Logistics, CEVA Logistics, C.H. Robinson Worldwide (CHRW) Inc., DB Schenker Logistics, FedEx Corporation, BDP International, UPS Supply Chain Solutions, Inc., Kuehne + Nagel International AG, J.B. Hunt Transport Services, Inc., Nippon Express Co., Ltd., XPO Logistics, Inc Customization Scope Customization for segments, region/country-level will be provided. Moreover, additional customization can be done based on the requirements. Purchase Options We have three licenses to opt for Single User License, Multi-User License (Up to 5 Users), Corporate Use License (Unlimited User and Printable PDF) -
- 1. Executive Summary
- 1.1. Definition
- 1.2. Taxonomy
- 1.3. Research Scope
- 1.4. Key Analysis
- 1.5. Key Findings by Major Segments
- 1.6. Top strategies by Major Players
- 2. Global Third-Party Logistics (3PL) Market Overview
- 2.1. Third-Party Logistics (3PL) Market Dynamics
- 2.1.1. Drivers
- 2.1.2. Opportunities
- 2.1.3. Restraints
- 2.1.4. Challenges
- 2.2. Macro-economic Factors
- 2.3. Regulatory Framework
- 2.4. Market Investment Feasibility Index
- 2.5. PEST Analysis
- 2.6. PORTER’S Five Force Analysis
- 2.7. Drivers & Restraints Impact Analysis
- 2.8. Industry Chain Analysis
- 2.9. Cost Structure Analysis
- 2.10. Marketing Strategy
- 2.11. Russia-Ukraine War Impact Analysis
- 2.12. Opportunity Map Analysis
- 2.13. Market Competition Scenario Analysis
- 2.14. Product Life Cycle Analysis
- 2.15. Opportunity Orbits
- 2.16. Manufacturer Intensity Map
- 2.17. Major Companies sales by Value & Volume
- 2.1. Third-Party Logistics (3PL) Market Dynamics
- 3. Global Third-Party Logistics (3PL) Market Analysis, Opportunity and Forecast, 2016-2032
- 3.1. Global Third-Party Logistics (3PL) Market Analysis, 2016-2021
- 3.2. Global Third-Party Logistics (3PL) Market Opportunity and Forecast, 2023-2032
- 3.3. Global Third-Party Logistics (3PL) Market Analysis, Opportunity and Forecast, By By Service, 2016-2032
- 3.3.1. Global Third-Party Logistics (3PL) Market Analysis by By Service: Introduction
- 3.3.2. Market Size Absolute $ Opportunity Analysis and Forecast, By By Service, 2016-2032
- 3.3.3. Domestic Transportation Management (DTM)
- 3.3.4. International Transportation Management (ITM)
- 3.3.5. Dedicated Contract Carriage (DCC)/ Freight forwarding
- 3.3.6. Value-Added Logistics Services (VALs)
- 3.3.7. Warehousing & Distribution (W&D)
- 3.4. Global Third-Party Logistics (3PL) Market Analysis, Opportunity and Forecast, By By Transport, 2016-2032
- 3.4.1. Global Third-Party Logistics (3PL) Market Analysis by By Transport: Introduction
- 3.4.2. Market Size Absolute $ Opportunity Analysis and Forecast, By By Transport, 2016-2032
- 3.4.3. Railways
- 3.4.4. Roadways
- 3.4.5. Airways
- 3.4.6. Waterways
- 3.5. Global Third-Party Logistics (3PL) Market Analysis, Opportunity and Forecast, By By End-Use, 2016-2032
- 3.5.1. Global Third-Party Logistics (3PL) Market Analysis by By End-Use: Introduction
- 3.5.2. Market Size Absolute $ Opportunity Analysis and Forecast, By By End-Use, 2016-2032
- 3.5.3. Retail
- 3.5.4. Manufacturing
- 3.5.5. Automotive
- 3.5.6. Healthcare
- 3.5.7. Others
- 4. North America Third-Party Logistics (3PL) Market Analysis, Opportunity and Forecast, 2016-2032
- 4.1. North America Third-Party Logistics (3PL) Market Analysis, 2016-2021
- 4.2. North America Third-Party Logistics (3PL) Market Opportunity and Forecast, 2023-2032
- 4.3. North America Third-Party Logistics (3PL) Market Analysis, Opportunity and Forecast, By By Service, 2016-2032
- 4.3.1. North America Third-Party Logistics (3PL) Market Analysis by By Service: Introduction
- 4.3.2. Market Size Absolute $ Opportunity Analysis and Forecast, By By Service, 2016-2032
- 4.3.3. Domestic Transportation Management (DTM)
- 4.3.4. International Transportation Management (ITM)
- 4.3.5. Dedicated Contract Carriage (DCC)/ Freight forwarding
- 4.3.6. Value-Added Logistics Services (VALs)
- 4.3.7. Warehousing & Distribution (W&D)
- 4.4. North America Third-Party Logistics (3PL) Market Analysis, Opportunity and Forecast, By By Transport, 2016-2032
- 4.4.1. North America Third-Party Logistics (3PL) Market Analysis by By Transport: Introduction
- 4.4.2. Market Size Absolute $ Opportunity Analysis and Forecast, By By Transport, 2016-2032
- 4.4.3. Railways
- 4.4.4. Roadways
- 4.4.5. Airways
- 4.4.6. Waterways
- 4.5. North America Third-Party Logistics (3PL) Market Analysis, Opportunity and Forecast, By By End-Use, 2016-2032
- 4.5.1. North America Third-Party Logistics (3PL) Market Analysis by By End-Use: Introduction
- 4.5.2. Market Size Absolute $ Opportunity Analysis and Forecast, By By End-Use, 2016-2032
- 4.5.3. Retail
- 4.5.4. Manufacturing
- 4.5.5. Automotive
- 4.5.6. Healthcare
- 4.5.7. Others
- 4.6. North America Third-Party Logistics (3PL) Market Analysis, Opportunity and Forecast, By Country , 2016-2032
- 4.6.1. North America Third-Party Logistics (3PL) Market Analysis by Country : Introduction
- 4.6.2. Market Size Absolute $ Opportunity Analysis and Forecast, Country , 2016-2032
- 4.6.2.1. The US
- 4.6.2.2. Canada
- 4.6.2.3. Mexico
- 5. Western Europe Third-Party Logistics (3PL) Market Analysis, Opportunity and Forecast, 2016-2032
- 5.1. Western Europe Third-Party Logistics (3PL) Market Analysis, 2016-2021
- 5.2. Western Europe Third-Party Logistics (3PL) Market Opportunity and Forecast, 2023-2032
- 5.3. Western Europe Third-Party Logistics (3PL) Market Analysis, Opportunity and Forecast, By By Service, 2016-2032
- 5.3.1. Western Europe Third-Party Logistics (3PL) Market Analysis by By Service: Introduction
- 5.3.2. Market Size Absolute $ Opportunity Analysis and Forecast, By By Service, 2016-2032
- 5.3.3. Domestic Transportation Management (DTM)
- 5.3.4. International Transportation Management (ITM)
- 5.3.5. Dedicated Contract Carriage (DCC)/ Freight forwarding
- 5.3.6. Value-Added Logistics Services (VALs)
- 5.3.7. Warehousing & Distribution (W&D)
- 5.4. Western Europe Third-Party Logistics (3PL) Market Analysis, Opportunity and Forecast, By By Transport, 2016-2032
- 5.4.1. Western Europe Third-Party Logistics (3PL) Market Analysis by By Transport: Introduction
- 5.4.2. Market Size Absolute $ Opportunity Analysis and Forecast, By By Transport, 2016-2032
- 5.4.3. Railways
- 5.4.4. Roadways
- 5.4.5. Airways
- 5.4.6. Waterways
- 5.5. Western Europe Third-Party Logistics (3PL) Market Analysis, Opportunity and Forecast, By By End-Use, 2016-2032
- 5.5.1. Western Europe Third-Party Logistics (3PL) Market Analysis by By End-Use: Introduction
- 5.5.2. Market Size Absolute $ Opportunity Analysis and Forecast, By By End-Use, 2016-2032
- 5.5.3. Retail
- 5.5.4. Manufacturing
- 5.5.5. Automotive
- 5.5.6. Healthcare
- 5.5.7. Others
- 5.6. Western Europe Third-Party Logistics (3PL) Market Analysis, Opportunity and Forecast, By Country , 2016-2032
- 5.6.1. Western Europe Third-Party Logistics (3PL) Market Analysis by Country : Introduction
- 5.6.2. Market Size Absolute $ Opportunity Analysis and Forecast, Country , 2016-2032
- 5.6.2.1. Germany
- 5.6.2.2. France
- 5.6.2.3. The UK
- 5.6.2.4. Spain
- 5.6.2.5. Italy
- 5.6.2.6. Portugal
- 5.6.2.7. Ireland
- 5.6.2.8. Austria
- 5.6.2.9. Switzerland
- 5.6.2.10. Benelux
- 5.6.2.11. Nordic
- 5.6.2.12. Rest of Western Europe
- 6. Eastern Europe Third-Party Logistics (3PL) Market Analysis, Opportunity and Forecast, 2016-2032
- 6.1. Eastern Europe Third-Party Logistics (3PL) Market Analysis, 2016-2021
- 6.2. Eastern Europe Third-Party Logistics (3PL) Market Opportunity and Forecast, 2023-2032
- 6.3. Eastern Europe Third-Party Logistics (3PL) Market Analysis, Opportunity and Forecast, By By Service, 2016-2032
- 6.3.1. Eastern Europe Third-Party Logistics (3PL) Market Analysis by By Service: Introduction
- 6.3.2. Market Size Absolute $ Opportunity Analysis and Forecast, By By Service, 2016-2032
- 6.3.3. Domestic Transportation Management (DTM)
- 6.3.4. International Transportation Management (ITM)
- 6.3.5. Dedicated Contract Carriage (DCC)/ Freight forwarding
- 6.3.6. Value-Added Logistics Services (VALs)
- 6.3.7. Warehousing & Distribution (W&D)
- 6.4. Eastern Europe Third-Party Logistics (3PL) Market Analysis, Opportunity and Forecast, By By Transport, 2016-2032
- 6.4.1. Eastern Europe Third-Party Logistics (3PL) Market Analysis by By Transport: Introduction
- 6.4.2. Market Size Absolute $ Opportunity Analysis and Forecast, By By Transport, 2016-2032
- 6.4.3. Railways
- 6.4.4. Roadways
- 6.4.5. Airways
- 6.4.6. Waterways
- 6.5. Eastern Europe Third-Party Logistics (3PL) Market Analysis, Opportunity and Forecast, By By End-Use, 2016-2032
- 6.5.1. Eastern Europe Third-Party Logistics (3PL) Market Analysis by By End-Use: Introduction
- 6.5.2. Market Size Absolute $ Opportunity Analysis and Forecast, By By End-Use, 2016-2032
- 6.5.3. Retail
- 6.5.4. Manufacturing
- 6.5.5. Automotive
- 6.5.6. Healthcare
- 6.5.7. Others
- 6.6. Eastern Europe Third-Party Logistics (3PL) Market Analysis, Opportunity and Forecast, By Country , 2016-2032
- 6.6.1. Eastern Europe Third-Party Logistics (3PL) Market Analysis by Country : Introduction
- 6.6.2. Market Size Absolute $ Opportunity Analysis and Forecast, Country , 2016-2032
- 6.6.2.1. Russia
- 6.6.2.2. Poland
- 6.6.2.3. The Czech Republic
- 6.6.2.4. Greece
- 6.6.2.5. Rest of Eastern Europe
- 7. APAC Third-Party Logistics (3PL) Market Analysis, Opportunity and Forecast, 2016-2032
- 7.1. APAC Third-Party Logistics (3PL) Market Analysis, 2016-2021
- 7.2. APAC Third-Party Logistics (3PL) Market Opportunity and Forecast, 2023-2032
- 7.3. APAC Third-Party Logistics (3PL) Market Analysis, Opportunity and Forecast, By By Service, 2016-2032
- 7.3.1. APAC Third-Party Logistics (3PL) Market Analysis by By Service: Introduction
- 7.3.2. Market Size Absolute $ Opportunity Analysis and Forecast, By By Service, 2016-2032
- 7.3.3. Domestic Transportation Management (DTM)
- 7.3.4. International Transportation Management (ITM)
- 7.3.5. Dedicated Contract Carriage (DCC)/ Freight forwarding
- 7.3.6. Value-Added Logistics Services (VALs)
- 7.3.7. Warehousing & Distribution (W&D)
- 7.4. APAC Third-Party Logistics (3PL) Market Analysis, Opportunity and Forecast, By By Transport, 2016-2032
- 7.4.1. APAC Third-Party Logistics (3PL) Market Analysis by By Transport: Introduction
- 7.4.2. Market Size Absolute $ Opportunity Analysis and Forecast, By By Transport, 2016-2032
- 7.4.3. Railways
- 7.4.4. Roadways
- 7.4.5. Airways
- 7.4.6. Waterways
- 7.5. APAC Third-Party Logistics (3PL) Market Analysis, Opportunity and Forecast, By By End-Use, 2016-2032
- 7.5.1. APAC Third-Party Logistics (3PL) Market Analysis by By End-Use: Introduction
- 7.5.2. Market Size Absolute $ Opportunity Analysis and Forecast, By By End-Use, 2016-2032
- 7.5.3. Retail
- 7.5.4. Manufacturing
- 7.5.5. Automotive
- 7.5.6. Healthcare
- 7.5.7. Others
- 7.6. APAC Third-Party Logistics (3PL) Market Analysis, Opportunity and Forecast, By Country , 2016-2032
- 7.6.1. APAC Third-Party Logistics (3PL) Market Analysis by Country : Introduction
- 7.6.2. Market Size Absolute $ Opportunity Analysis and Forecast, Country , 2016-2032
- 7.6.2.1. China
- 7.6.2.2. Japan
- 7.6.2.3. South Korea
- 7.6.2.4. India
- 7.6.2.5. Australia & New Zeland
- 7.6.2.6. Indonesia
- 7.6.2.7. Malaysia
- 7.6.2.8. Philippines
- 7.6.2.9. Singapore
- 7.6.2.10. Thailand
- 7.6.2.11. Vietnam
- 7.6.2.12. Rest of APAC
- 8. Latin America Third-Party Logistics (3PL) Market Analysis, Opportunity and Forecast, 2016-2032
- 8.1. Latin America Third-Party Logistics (3PL) Market Analysis, 2016-2021
- 8.2. Latin America Third-Party Logistics (3PL) Market Opportunity and Forecast, 2023-2032
- 8.3. Latin America Third-Party Logistics (3PL) Market Analysis, Opportunity and Forecast, By By Service, 2016-2032
- 8.3.1. Latin America Third-Party Logistics (3PL) Market Analysis by By Service: Introduction
- 8.3.2. Market Size Absolute $ Opportunity Analysis and Forecast, By By Service, 2016-2032
- 8.3.3. Domestic Transportation Management (DTM)
- 8.3.4. International Transportation Management (ITM)
- 8.3.5. Dedicated Contract Carriage (DCC)/ Freight forwarding
- 8.3.6. Value-Added Logistics Services (VALs)
- 8.3.7. Warehousing & Distribution (W&D)
- 8.4. Latin America Third-Party Logistics (3PL) Market Analysis, Opportunity and Forecast, By By Transport, 2016-2032
- 8.4.1. Latin America Third-Party Logistics (3PL) Market Analysis by By Transport: Introduction
- 8.4.2. Market Size Absolute $ Opportunity Analysis and Forecast, By By Transport, 2016-2032
- 8.4.3. Railways
- 8.4.4. Roadways
- 8.4.5. Airways
- 8.4.6. Waterways
- 8.5. Latin America Third-Party Logistics (3PL) Market Analysis, Opportunity and Forecast, By By End-Use, 2016-2032
- 8.5.1. Latin America Third-Party Logistics (3PL) Market Analysis by By End-Use: Introduction
- 8.5.2. Market Size Absolute $ Opportunity Analysis and Forecast, By By End-Use, 2016-2032
- 8.5.3. Retail
- 8.5.4. Manufacturing
- 8.5.5. Automotive
- 8.5.6. Healthcare
- 8.5.7. Others
- 8.6. Latin America Third-Party Logistics (3PL) Market Analysis, Opportunity and Forecast, By Country , 2016-2032
- 8.6.1. Latin America Third-Party Logistics (3PL) Market Analysis by Country : Introduction
- 8.6.2. Market Size Absolute $ Opportunity Analysis and Forecast, Country , 2016-2032
- 8.6.2.1. Brazil
- 8.6.2.2. Colombia
- 8.6.2.3. Chile
- 8.6.2.4. Argentina
- 8.6.2.5. Costa Rica
- 8.6.2.6. Rest of Latin America
- 9. Middle East & Africa Third-Party Logistics (3PL) Market Analysis, Opportunity and Forecast, 2016-2032
- 9.1. Middle East & Africa Third-Party Logistics (3PL) Market Analysis, 2016-2021
- 9.2. Middle East & Africa Third-Party Logistics (3PL) Market Opportunity and Forecast, 2023-2032
- 9.3. Middle East & Africa Third-Party Logistics (3PL) Market Analysis, Opportunity and Forecast, By By Service, 2016-2032
- 9.3.1. Middle East & Africa Third-Party Logistics (3PL) Market Analysis by By Service: Introduction
- 9.3.2. Market Size Absolute $ Opportunity Analysis and Forecast, By By Service, 2016-2032
- 9.3.3. Domestic Transportation Management (DTM)
- 9.3.4. International Transportation Management (ITM)
- 9.3.5. Dedicated Contract Carriage (DCC)/ Freight forwarding
- 9.3.6. Value-Added Logistics Services (VALs)
- 9.3.7. Warehousing & Distribution (W&D)
- 9.4. Middle East & Africa Third-Party Logistics (3PL) Market Analysis, Opportunity and Forecast, By By Transport, 2016-2032
- 9.4.1. Middle East & Africa Third-Party Logistics (3PL) Market Analysis by By Transport: Introduction
- 9.4.2. Market Size Absolute $ Opportunity Analysis and Forecast, By By Transport, 2016-2032
- 9.4.3. Railways
- 9.4.4. Roadways
- 9.4.5. Airways
- 9.4.6. Waterways
- 9.5. Middle East & Africa Third-Party Logistics (3PL) Market Analysis, Opportunity and Forecast, By By End-Use, 2016-2032
- 9.5.1. Middle East & Africa Third-Party Logistics (3PL) Market Analysis by By End-Use: Introduction
- 9.5.2. Market Size Absolute $ Opportunity Analysis and Forecast, By By End-Use, 2016-2032
- 9.5.3. Retail
- 9.5.4. Manufacturing
- 9.5.5. Automotive
- 9.5.6. Healthcare
- 9.5.7. Others
- 9.6. Middle East & Africa Third-Party Logistics (3PL) Market Analysis, Opportunity and Forecast, By Country , 2016-2032
- 9.6.1. Middle East & Africa Third-Party Logistics (3PL) Market Analysis by Country : Introduction
- 9.6.2. Market Size Absolute $ Opportunity Analysis and Forecast, Country , 2016-2032
- 9.6.2.1. Algeria
- 9.6.2.2. Egypt
- 9.6.2.3. Israel
- 9.6.2.4. Kuwait
- 9.6.2.5. Nigeria
- 9.6.2.6. Saudi Arabia
- 9.6.2.7. South Africa
- 9.6.2.8. Turkey
- 9.6.2.9. The UAE
- 9.6.2.10. Rest of MEA
- 10. Global Third-Party Logistics (3PL) Market Analysis, Opportunity and Forecast, By Region , 2016-2032
- 10.1. Global Third-Party Logistics (3PL) Market Analysis by Region : Introduction
- 10.2. Market Size Absolute $ Opportunity Analysis and Forecast, By Region , 2016-2032
- 10.2.1. North America
- 10.2.2. Western Europe
- 10.2.3. Eastern Europe
- 10.2.4. APAC
- 10.2.5. Latin America
- 10.2.6. Middle East & Africa
- 11. Global Third-Party Logistics (3PL) Market Competitive Landscape, Market Share Analysis, and Company Profiles
- 11.1. Market Share Analysis
- 11.2. Company Profiles
- 11.3. Burris Logistics
- 11.3.1. Company Overview
- 11.3.2. Financial Highlights
- 11.3.3. Product Portfolio
- 11.3.4. SWOT Analysis
- 11.3.5. Key Strategies and Developments
- 11.4. CEVA Logistics
- 11.4.1. Company Overview
- 11.4.2. Financial Highlights
- 11.4.3. Product Portfolio
- 11.4.4. SWOT Analysis
- 11.4.5. Key Strategies and Developments
- 11.5. C.H. Robinson Worldwide (CHRW) Inc.
- 11.5.1. Company Overview
- 11.5.2. Financial Highlights
- 11.5.3. Product Portfolio
- 11.5.4. SWOT Analysis
- 11.5.5. Key Strategies and Developments
- 11.6. DB Schenker Logistics
- 11.6.1. Company Overview
- 11.6.2. Financial Highlights
- 11.6.3. Product Portfolio
- 11.6.4. SWOT Analysis
- 11.6.5. Key Strategies and Developments
- 11.7. FedEx Corporation
- 11.7.1. Company Overview
- 11.7.2. Financial Highlights
- 11.7.3. Product Portfolio
- 11.7.4. SWOT Analysis
- 11.7.5. Key Strategies and Developments
- 11.8. BDP International
- 11.8.1. Company Overview
- 11.8.2. Financial Highlights
- 11.8.3. Product Portfolio
- 11.8.4. SWOT Analysis
- 11.8.5. Key Strategies and Developments
- 11.9. UPS Supply Chain Solutions, Inc.
- 11.9.1. Company Overview
- 11.9.2. Financial Highlights
- 11.9.3. Product Portfolio
- 11.9.4. SWOT Analysis
- 11.9.5. Key Strategies and Developments
- 11.10. Kuehne + Nagel International AG
- 11.10.1. Company Overview
- 11.10.2. Financial Highlights
- 11.10.3. Product Portfolio
- 11.10.4. SWOT Analysis
- 11.10.5. Key Strategies and Developments
- 11.11. J.B. Hunt Transport Services, Inc.
- 11.11.1. Company Overview
- 11.11.2. Financial Highlights
- 11.11.3. Product Portfolio
- 11.11.4. SWOT Analysis
- 11.11.5. Key Strategies and Developments
- 11.12. Nippon Express Co., Ltd.
- 11.12.1. Company Overview
- 11.12.2. Financial Highlights
- 11.12.3. Product Portfolio
- 11.12.4. SWOT Analysis
- 11.12.5. Key Strategies and Developments
- 11.13.1. Company Overview
- 11.13.2. Financial Highlights
- 11.13.3. Product Portfolio
- 11.13.4. SWOT Analysis
- 11.13.5. Key Strategies and Developments
- 11.14. XPO Logistics, Inc
- 11.14.1. Company Overview
- 11.14.2. Financial Highlights
- 11.14.3. Product Portfolio
- 11.14.4. SWOT Analysis
- 11.14.5. Key Strategies and Developments
- 12. Assumptions and Acronyms
- 13. Research Methodology
- 14. Contact
"
- List of Figures
- "
- Figure 1: Global Third-Party Logistics (3PL) Market Revenue (US$ Mn) Market Share by By Service in 2022
- Figure 2: Global Third-Party Logistics (3PL) Market Market Attractiveness Analysis by By Service, 2016-2032
- Figure 3: Global Third-Party Logistics (3PL) Market Revenue (US$ Mn) Market Share by By Transportin 2022
- Figure 4: Global Third-Party Logistics (3PL) Market Market Attractiveness Analysis by By Transport, 2016-2032
- Figure 5: Global Third-Party Logistics (3PL) Market Revenue (US$ Mn) Market Share by By End-Usein 2022
- Figure 6: Global Third-Party Logistics (3PL) Market Market Attractiveness Analysis by By End-Use, 2016-2032
- Figure 7: Global Third-Party Logistics (3PL) Market Revenue (US$ Mn) Market Share by Region in 2022
- Figure 8: Global Third-Party Logistics (3PL) Market Market Attractiveness Analysis by Region, 2016-2032
- Figure 9: Global Third-Party Logistics (3PL) Market Market Revenue (US$ Mn) (2016-2032)
- Figure 10: Global Third-Party Logistics (3PL) Market Market Revenue (US$ Mn) Comparison by Region (2016-2032)
- Figure 11: Global Third-Party Logistics (3PL) Market Market Revenue (US$ Mn) Comparison by By Service (2016-2032)
- Figure 12: Global Third-Party Logistics (3PL) Market Market Revenue (US$ Mn) Comparison by By Transport (2016-2032)
- Figure 13: Global Third-Party Logistics (3PL) Market Market Revenue (US$ Mn) Comparison by By End-Use (2016-2032)
- Figure 14: Global Third-Party Logistics (3PL) Market Market Y-o-Y Growth Rate Comparison by Region (2016-2032)
- Figure 15: Global Third-Party Logistics (3PL) Market Market Y-o-Y Growth Rate Comparison by By Service (2016-2032)
- Figure 16: Global Third-Party Logistics (3PL) Market Market Y-o-Y Growth Rate Comparison by By Transport (2016-2032)
- Figure 17: Global Third-Party Logistics (3PL) Market Market Y-o-Y Growth Rate Comparison by By End-Use (2016-2032)
- Figure 18: Global Third-Party Logistics (3PL) Market Market Share Comparison by Region (2016-2032)
- Figure 19: Global Third-Party Logistics (3PL) Market Market Share Comparison by By Service (2016-2032)
- Figure 20: Global Third-Party Logistics (3PL) Market Market Share Comparison by By Transport (2016-2032)
- Figure 21: Global Third-Party Logistics (3PL) Market Market Share Comparison by By End-Use (2016-2032)
- Figure 22: North America Third-Party Logistics (3PL) Market Revenue (US$ Mn) Market Share by By Servicein 2022
- Figure 23: North America Third-Party Logistics (3PL) Market Market Attractiveness Analysis by By Service, 2016-2032
- Figure 24: North America Third-Party Logistics (3PL) Market Revenue (US$ Mn) Market Share by By Transportin 2022
- Figure 25: North America Third-Party Logistics (3PL) Market Market Attractiveness Analysis by By Transport, 2016-2032
- Figure 26: North America Third-Party Logistics (3PL) Market Revenue (US$ Mn) Market Share by By End-Usein 2022
- Figure 27: North America Third-Party Logistics (3PL) Market Market Attractiveness Analysis by By End-Use, 2016-2032
- Figure 28: North America Third-Party Logistics (3PL) Market Revenue (US$ Mn) Market Share by Country in 2022
- Figure 29: North America Third-Party Logistics (3PL) Market Market Attractiveness Analysis by Country, 2016-2032
- Figure 30: North America Third-Party Logistics (3PL) Market Market Revenue (US$ Mn) (2016-2032)
- Figure 31: North America Third-Party Logistics (3PL) Market Market Revenue (US$ Mn) Comparison by Country (2016-2032)
- Figure 32: North America Third-Party Logistics (3PL) Market Market Revenue (US$ Mn) Comparison by By Service (2016-2032)
- Figure 33: North America Third-Party Logistics (3PL) Market Market Revenue (US$ Mn) Comparison by By Transport (2016-2032)
- Figure 34: North America Third-Party Logistics (3PL) Market Market Revenue (US$ Mn) Comparison by By End-Use (2016-2032)
- Figure 35: North America Third-Party Logistics (3PL) Market Market Y-o-Y Growth Rate Comparison by Country (2016-2032)
- Figure 36: North America Third-Party Logistics (3PL) Market Market Y-o-Y Growth Rate Comparison by By Service (2016-2032)
- Figure 37: North America Third-Party Logistics (3PL) Market Market Y-o-Y Growth Rate Comparison by By Transport (2016-2032)
- Figure 38: North America Third-Party Logistics (3PL) Market Market Y-o-Y Growth Rate Comparison by By End-Use (2016-2032)
- Figure 39: North America Third-Party Logistics (3PL) Market Market Share Comparison by Country (2016-2032)
- Figure 40: North America Third-Party Logistics (3PL) Market Market Share Comparison by By Service (2016-2032)
- Figure 41: North America Third-Party Logistics (3PL) Market Market Share Comparison by By Transport (2016-2032)
- Figure 42: North America Third-Party Logistics (3PL) Market Market Share Comparison by By End-Use (2016-2032)
- Figure 43: Western Europe Third-Party Logistics (3PL) Market Revenue (US$ Mn) Market Share by By Servicein 2022
- Figure 44: Western Europe Third-Party Logistics (3PL) Market Market Attractiveness Analysis by By Service, 2016-2032
- Figure 45: Western Europe Third-Party Logistics (3PL) Market Revenue (US$ Mn) Market Share by By Transportin 2022
- Figure 46: Western Europe Third-Party Logistics (3PL) Market Market Attractiveness Analysis by By Transport, 2016-2032
- Figure 47: Western Europe Third-Party Logistics (3PL) Market Revenue (US$ Mn) Market Share by By End-Usein 2022
- Figure 48: Western Europe Third-Party Logistics (3PL) Market Market Attractiveness Analysis by By End-Use, 2016-2032
- Figure 49: Western Europe Third-Party Logistics (3PL) Market Revenue (US$ Mn) Market Share by Country in 2022
- Figure 50: Western Europe Third-Party Logistics (3PL) Market Market Attractiveness Analysis by Country, 2016-2032
- Figure 51: Western Europe Third-Party Logistics (3PL) Market Market Revenue (US$ Mn) (2016-2032)
- Figure 52: Western Europe Third-Party Logistics (3PL) Market Market Revenue (US$ Mn) Comparison by Country (2016-2032)
- Figure 53: Western Europe Third-Party Logistics (3PL) Market Market Revenue (US$ Mn) Comparison by By Service (2016-2032)
- Figure 54: Western Europe Third-Party Logistics (3PL) Market Market Revenue (US$ Mn) Comparison by By Transport (2016-2032)
- Figure 55: Western Europe Third-Party Logistics (3PL) Market Market Revenue (US$ Mn) Comparison by By End-Use (2016-2032)
- Figure 56: Western Europe Third-Party Logistics (3PL) Market Market Y-o-Y Growth Rate Comparison by Country (2016-2032)
- Figure 57: Western Europe Third-Party Logistics (3PL) Market Market Y-o-Y Growth Rate Comparison by By Service (2016-2032)
- Figure 58: Western Europe Third-Party Logistics (3PL) Market Market Y-o-Y Growth Rate Comparison by By Transport (2016-2032)
- Figure 59: Western Europe Third-Party Logistics (3PL) Market Market Y-o-Y Growth Rate Comparison by By End-Use (2016-2032)
- Figure 60: Western Europe Third-Party Logistics (3PL) Market Market Share Comparison by Country (2016-2032)
- Figure 61: Western Europe Third-Party Logistics (3PL) Market Market Share Comparison by By Service (2016-2032)
- Figure 62: Western Europe Third-Party Logistics (3PL) Market Market Share Comparison by By Transport (2016-2032)
- Figure 63: Western Europe Third-Party Logistics (3PL) Market Market Share Comparison by By End-Use (2016-2032)
- Figure 64: Eastern Europe Third-Party Logistics (3PL) Market Revenue (US$ Mn) Market Share by By Servicein 2022
- Figure 65: Eastern Europe Third-Party Logistics (3PL) Market Market Attractiveness Analysis by By Service, 2016-2032
- Figure 66: Eastern Europe Third-Party Logistics (3PL) Market Revenue (US$ Mn) Market Share by By Transportin 2022
- Figure 67: Eastern Europe Third-Party Logistics (3PL) Market Market Attractiveness Analysis by By Transport, 2016-2032
- Figure 68: Eastern Europe Third-Party Logistics (3PL) Market Revenue (US$ Mn) Market Share by By End-Usein 2022
- Figure 69: Eastern Europe Third-Party Logistics (3PL) Market Market Attractiveness Analysis by By End-Use, 2016-2032
- Figure 70: Eastern Europe Third-Party Logistics (3PL) Market Revenue (US$ Mn) Market Share by Country in 2022
- Figure 71: Eastern Europe Third-Party Logistics (3PL) Market Market Attractiveness Analysis by Country, 2016-2032
- Figure 72: Eastern Europe Third-Party Logistics (3PL) Market Market Revenue (US$ Mn) (2016-2032)
- Figure 73: Eastern Europe Third-Party Logistics (3PL) Market Market Revenue (US$ Mn) Comparison by Country (2016-2032)
- Figure 74: Eastern Europe Third-Party Logistics (3PL) Market Market Revenue (US$ Mn) Comparison by By Service (2016-2032)
- Figure 75: Eastern Europe Third-Party Logistics (3PL) Market Market Revenue (US$ Mn) Comparison by By Transport (2016-2032)
- Figure 76: Eastern Europe Third-Party Logistics (3PL) Market Market Revenue (US$ Mn) Comparison by By End-Use (2016-2032)
- Figure 77: Eastern Europe Third-Party Logistics (3PL) Market Market Y-o-Y Growth Rate Comparison by Country (2016-2032)
- Figure 78: Eastern Europe Third-Party Logistics (3PL) Market Market Y-o-Y Growth Rate Comparison by By Service (2016-2032)
- Figure 79: Eastern Europe Third-Party Logistics (3PL) Market Market Y-o-Y Growth Rate Comparison by By Transport (2016-2032)
- Figure 80: Eastern Europe Third-Party Logistics (3PL) Market Market Y-o-Y Growth Rate Comparison by By End-Use (2016-2032)
- Figure 81: Eastern Europe Third-Party Logistics (3PL) Market Market Share Comparison by Country (2016-2032)
- Figure 82: Eastern Europe Third-Party Logistics (3PL) Market Market Share Comparison by By Service (2016-2032)
- Figure 83: Eastern Europe Third-Party Logistics (3PL) Market Market Share Comparison by By Transport (2016-2032)
- Figure 84: Eastern Europe Third-Party Logistics (3PL) Market Market Share Comparison by By End-Use (2016-2032)
- Figure 85: APAC Third-Party Logistics (3PL) Market Revenue (US$ Mn) Market Share by By Servicein 2022
- Figure 86: APAC Third-Party Logistics (3PL) Market Market Attractiveness Analysis by By Service, 2016-2032
- Figure 87: APAC Third-Party Logistics (3PL) Market Revenue (US$ Mn) Market Share by By Transportin 2022
- Figure 88: APAC Third-Party Logistics (3PL) Market Market Attractiveness Analysis by By Transport, 2016-2032
- Figure 89: APAC Third-Party Logistics (3PL) Market Revenue (US$ Mn) Market Share by By End-Usein 2022
- Figure 90: APAC Third-Party Logistics (3PL) Market Market Attractiveness Analysis by By End-Use, 2016-2032
- Figure 91: APAC Third-Party Logistics (3PL) Market Revenue (US$ Mn) Market Share by Country in 2022
- Figure 92: APAC Third-Party Logistics (3PL) Market Market Attractiveness Analysis by Country, 2016-2032
- Figure 93: APAC Third-Party Logistics (3PL) Market Market Revenue (US$ Mn) (2016-2032)
- Figure 94: APAC Third-Party Logistics (3PL) Market Market Revenue (US$ Mn) Comparison by Country (2016-2032)
- Figure 95: APAC Third-Party Logistics (3PL) Market Market Revenue (US$ Mn) Comparison by By Service (2016-2032)
- Figure 96: APAC Third-Party Logistics (3PL) Market Market Revenue (US$ Mn) Comparison by By Transport (2016-2032)
- Figure 97: APAC Third-Party Logistics (3PL) Market Market Revenue (US$ Mn) Comparison by By End-Use (2016-2032)
- Figure 98: APAC Third-Party Logistics (3PL) Market Market Y-o-Y Growth Rate Comparison by Country (2016-2032)
- Figure 99: APAC Third-Party Logistics (3PL) Market Market Y-o-Y Growth Rate Comparison by By Service (2016-2032)
- Figure 100: APAC Third-Party Logistics (3PL) Market Market Y-o-Y Growth Rate Comparison by By Transport (2016-2032)
- Figure 101: APAC Third-Party Logistics (3PL) Market Market Y-o-Y Growth Rate Comparison by By End-Use (2016-2032)
- Figure 102: APAC Third-Party Logistics (3PL) Market Market Share Comparison by Country (2016-2032)
- Figure 103: APAC Third-Party Logistics (3PL) Market Market Share Comparison by By Service (2016-2032)
- Figure 104: APAC Third-Party Logistics (3PL) Market Market Share Comparison by By Transport (2016-2032)
- Figure 105: APAC Third-Party Logistics (3PL) Market Market Share Comparison by By End-Use (2016-2032)
- Figure 106: Latin America Third-Party Logistics (3PL) Market Revenue (US$ Mn) Market Share by By Servicein 2022
- Figure 107: Latin America Third-Party Logistics (3PL) Market Market Attractiveness Analysis by By Service, 2016-2032
- Figure 108: Latin America Third-Party Logistics (3PL) Market Revenue (US$ Mn) Market Share by By Transportin 2022
- Figure 109: Latin America Third-Party Logistics (3PL) Market Market Attractiveness Analysis by By Transport, 2016-2032
- Figure 110: Latin America Third-Party Logistics (3PL) Market Revenue (US$ Mn) Market Share by By End-Usein 2022
- Figure 111: Latin America Third-Party Logistics (3PL) Market Market Attractiveness Analysis by By End-Use, 2016-2032
- Figure 112: Latin America Third-Party Logistics (3PL) Market Revenue (US$ Mn) Market Share by Country in 2022
- Figure 113: Latin America Third-Party Logistics (3PL) Market Market Attractiveness Analysis by Country, 2016-2032
- Figure 114: Latin America Third-Party Logistics (3PL) Market Market Revenue (US$ Mn) (2016-2032)
- Figure 115: Latin America Third-Party Logistics (3PL) Market Market Revenue (US$ Mn) Comparison by Country (2016-2032)
- Figure 116: Latin America Third-Party Logistics (3PL) Market Market Revenue (US$ Mn) Comparison by By Service (2016-2032)
- Figure 117: Latin America Third-Party Logistics (3PL) Market Market Revenue (US$ Mn) Comparison by By Transport (2016-2032)
- Figure 118: Latin America Third-Party Logistics (3PL) Market Market Revenue (US$ Mn) Comparison by By End-Use (2016-2032)
- Figure 119: Latin America Third-Party Logistics (3PL) Market Market Y-o-Y Growth Rate Comparison by Country (2016-2032)
- Figure 120: Latin America Third-Party Logistics (3PL) Market Market Y-o-Y Growth Rate Comparison by By Service (2016-2032)
- Figure 121: Latin America Third-Party Logistics (3PL) Market Market Y-o-Y Growth Rate Comparison by By Transport (2016-2032)
- Figure 122: Latin America Third-Party Logistics (3PL) Market Market Y-o-Y Growth Rate Comparison by By End-Use (2016-2032)
- Figure 123: Latin America Third-Party Logistics (3PL) Market Market Share Comparison by Country (2016-2032)
- Figure 124: Latin America Third-Party Logistics (3PL) Market Market Share Comparison by By Service (2016-2032)
- Figure 125: Latin America Third-Party Logistics (3PL) Market Market Share Comparison by By Transport (2016-2032)
- Figure 126: Latin America Third-Party Logistics (3PL) Market Market Share Comparison by By End-Use (2016-2032)
- Figure 127: Middle East & Africa Third-Party Logistics (3PL) Market Revenue (US$ Mn) Market Share by By Servicein 2022
- Figure 128: Middle East & Africa Third-Party Logistics (3PL) Market Market Attractiveness Analysis by By Service, 2016-2032
- Figure 129: Middle East & Africa Third-Party Logistics (3PL) Market Revenue (US$ Mn) Market Share by By Transportin 2022
- Figure 130: Middle East & Africa Third-Party Logistics (3PL) Market Market Attractiveness Analysis by By Transport, 2016-2032
- Figure 131: Middle East & Africa Third-Party Logistics (3PL) Market Revenue (US$ Mn) Market Share by By End-Usein 2022
- Figure 132: Middle East & Africa Third-Party Logistics (3PL) Market Market Attractiveness Analysis by By End-Use, 2016-2032
- Figure 133: Middle East & Africa Third-Party Logistics (3PL) Market Revenue (US$ Mn) Market Share by Country in 2022
- Figure 134: Middle East & Africa Third-Party Logistics (3PL) Market Market Attractiveness Analysis by Country, 2016-2032
- Figure 135: Middle East & Africa Third-Party Logistics (3PL) Market Market Revenue (US$ Mn) (2016-2032)
- Figure 136: Middle East & Africa Third-Party Logistics (3PL) Market Market Revenue (US$ Mn) Comparison by Country (2016-2032)
- Figure 137: Middle East & Africa Third-Party Logistics (3PL) Market Market Revenue (US$ Mn) Comparison by By Service (2016-2032)
- Figure 138: Middle East & Africa Third-Party Logistics (3PL) Market Market Revenue (US$ Mn) Comparison by By Transport (2016-2032)
- Figure 139: Middle East & Africa Third-Party Logistics (3PL) Market Market Revenue (US$ Mn) Comparison by By End-Use (2016-2032)
- Figure 140: Middle East & Africa Third-Party Logistics (3PL) Market Market Y-o-Y Growth Rate Comparison by Country (2016-2032)
- Figure 141: Middle East & Africa Third-Party Logistics (3PL) Market Market Y-o-Y Growth Rate Comparison by By Service (2016-2032)
- Figure 142: Middle East & Africa Third-Party Logistics (3PL) Market Market Y-o-Y Growth Rate Comparison by By Transport (2016-2032)
- Figure 143: Middle East & Africa Third-Party Logistics (3PL) Market Market Y-o-Y Growth Rate Comparison by By End-Use (2016-2032)
- Figure 144: Middle East & Africa Third-Party Logistics (3PL) Market Market Share Comparison by Country (2016-2032)
- Figure 145: Middle East & Africa Third-Party Logistics (3PL) Market Market Share Comparison by By Service (2016-2032)
- Figure 146: Middle East & Africa Third-Party Logistics (3PL) Market Market Share Comparison by By Transport (2016-2032)
- Figure 147: Middle East & Africa Third-Party Logistics (3PL) Market Market Share Comparison by By End-Use (2016-2032)
"
- List of Tables
- "
- Table 1: Global Third-Party Logistics (3PL) Market Market Comparison by By Service (2016-2032)
- Table 2: Global Third-Party Logistics (3PL) Market Market Comparison by By Transport (2016-2032)
- Table 3: Global Third-Party Logistics (3PL) Market Market Comparison by By End-Use (2016-2032)
- Table 4: Global Third-Party Logistics (3PL) Market Revenue (US$ Mn) Comparison by Region (2016-2032)
- Table 5: Global Third-Party Logistics (3PL) Market Market Revenue (US$ Mn) (2016-2032)
- Table 6: Global Third-Party Logistics (3PL) Market Market Revenue (US$ Mn) Comparison by Region (2016-2032)
- Table 7: Global Third-Party Logistics (3PL) Market Market Revenue (US$ Mn) Comparison by By Service (2016-2032)
- Table 8: Global Third-Party Logistics (3PL) Market Market Revenue (US$ Mn) Comparison by By Transport (2016-2032)
- Table 9: Global Third-Party Logistics (3PL) Market Market Revenue (US$ Mn) Comparison by By End-Use (2016-2032)
- Table 10: Global Third-Party Logistics (3PL) Market Market Y-o-Y Growth Rate Comparison by Region (2016-2032)
- Table 11: Global Third-Party Logistics (3PL) Market Market Y-o-Y Growth Rate Comparison by By Service (2016-2032)
- Table 12: Global Third-Party Logistics (3PL) Market Market Y-o-Y Growth Rate Comparison by By Transport (2016-2032)
- Table 13: Global Third-Party Logistics (3PL) Market Market Y-o-Y Growth Rate Comparison by By End-Use (2016-2032)
- Table 14: Global Third-Party Logistics (3PL) Market Market Share Comparison by Region (2016-2032)
- Table 15: Global Third-Party Logistics (3PL) Market Market Share Comparison by By Service (2016-2032)
- Table 16: Global Third-Party Logistics (3PL) Market Market Share Comparison by By Transport (2016-2032)
- Table 17: Global Third-Party Logistics (3PL) Market Market Share Comparison by By End-Use (2016-2032)
- Table 18: North America Third-Party Logistics (3PL) Market Market Comparison by By Transport (2016-2032)
- Table 19: North America Third-Party Logistics (3PL) Market Market Comparison by By End-Use (2016-2032)
- Table 20: North America Third-Party Logistics (3PL) Market Revenue (US$ Mn) Comparison by Country (2016-2032)
- Table 21: North America Third-Party Logistics (3PL) Market Market Revenue (US$ Mn) (2016-2032)
- Table 22: North America Third-Party Logistics (3PL) Market Market Revenue (US$ Mn) Comparison by Country (2016-2032)
- Table 23: North America Third-Party Logistics (3PL) Market Market Revenue (US$ Mn) Comparison by By Service (2016-2032)
- Table 24: North America Third-Party Logistics (3PL) Market Market Revenue (US$ Mn) Comparison by By Transport (2016-2032)
- Table 25: North America Third-Party Logistics (3PL) Market Market Revenue (US$ Mn) Comparison by By End-Use (2016-2032)
- Table 26: North America Third-Party Logistics (3PL) Market Market Y-o-Y Growth Rate Comparison by Country (2016-2032)
- Table 27: North America Third-Party Logistics (3PL) Market Market Y-o-Y Growth Rate Comparison by By Service (2016-2032)
- Table 28: North America Third-Party Logistics (3PL) Market Market Y-o-Y Growth Rate Comparison by By Transport (2016-2032)
- Table 29: North America Third-Party Logistics (3PL) Market Market Y-o-Y Growth Rate Comparison by By End-Use (2016-2032)
- Table 30: North America Third-Party Logistics (3PL) Market Market Share Comparison by Country (2016-2032)
- Table 31: North America Third-Party Logistics (3PL) Market Market Share Comparison by By Service (2016-2032)
- Table 32: North America Third-Party Logistics (3PL) Market Market Share Comparison by By Transport (2016-2032)
- Table 33: North America Third-Party Logistics (3PL) Market Market Share Comparison by By End-Use (2016-2032)
- Table 34: Western Europe Third-Party Logistics (3PL) Market Market Comparison by By Service (2016-2032)
- Table 35: Western Europe Third-Party Logistics (3PL) Market Market Comparison by By Transport (2016-2032)
- Table 36: Western Europe Third-Party Logistics (3PL) Market Market Comparison by By End-Use (2016-2032)
- Table 37: Western Europe Third-Party Logistics (3PL) Market Revenue (US$ Mn) Comparison by Country (2016-2032)
- Table 38: Western Europe Third-Party Logistics (3PL) Market Market Revenue (US$ Mn) (2016-2032)
- Table 39: Western Europe Third-Party Logistics (3PL) Market Market Revenue (US$ Mn) Comparison by Country (2016-2032)
- Table 40: Western Europe Third-Party Logistics (3PL) Market Market Revenue (US$ Mn) Comparison by By Service (2016-2032)
- Table 41: Western Europe Third-Party Logistics (3PL) Market Market Revenue (US$ Mn) Comparison by By Transport (2016-2032)
- Table 42: Western Europe Third-Party Logistics (3PL) Market Market Revenue (US$ Mn) Comparison by By End-Use (2016-2032)
- Table 43: Western Europe Third-Party Logistics (3PL) Market Market Y-o-Y Growth Rate Comparison by Country (2016-2032)
- Table 44: Western Europe Third-Party Logistics (3PL) Market Market Y-o-Y Growth Rate Comparison by By Service (2016-2032)
- Table 45: Western Europe Third-Party Logistics (3PL) Market Market Y-o-Y Growth Rate Comparison by By Transport (2016-2032)
- Table 46: Western Europe Third-Party Logistics (3PL) Market Market Y-o-Y Growth Rate Comparison by By End-Use (2016-2032)
- Table 47: Western Europe Third-Party Logistics (3PL) Market Market Share Comparison by Country (2016-2032)
- Table 48: Western Europe Third-Party Logistics (3PL) Market Market Share Comparison by By Service (2016-2032)
- Table 49: Western Europe Third-Party Logistics (3PL) Market Market Share Comparison by By Transport (2016-2032)
- Table 50: Western Europe Third-Party Logistics (3PL) Market Market Share Comparison by By End-Use (2016-2032)
- Table 51: Eastern Europe Third-Party Logistics (3PL) Market Market Comparison by By Service (2016-2032)
- Table 52: Eastern Europe Third-Party Logistics (3PL) Market Market Comparison by By Transport (2016-2032)
- Table 53: Eastern Europe Third-Party Logistics (3PL) Market Market Comparison by By End-Use (2016-2032)
- Table 54: Eastern Europe Third-Party Logistics (3PL) Market Revenue (US$ Mn) Comparison by Country (2016-2032)
- Table 55: Eastern Europe Third-Party Logistics (3PL) Market Market Revenue (US$ Mn) (2016-2032)
- Table 56: Eastern Europe Third-Party Logistics (3PL) Market Market Revenue (US$ Mn) Comparison by Country (2016-2032)
- Table 57: Eastern Europe Third-Party Logistics (3PL) Market Market Revenue (US$ Mn) Comparison by By Service (2016-2032)
- Table 58: Eastern Europe Third-Party Logistics (3PL) Market Market Revenue (US$ Mn) Comparison by By Transport (2016-2032)
- Table 59: Eastern Europe Third-Party Logistics (3PL) Market Market Revenue (US$ Mn) Comparison by By End-Use (2016-2032)
- Table 60: Eastern Europe Third-Party Logistics (3PL) Market Market Y-o-Y Growth Rate Comparison by Country (2016-2032)
- Table 61: Eastern Europe Third-Party Logistics (3PL) Market Market Y-o-Y Growth Rate Comparison by By Service (2016-2032)
- Table 62: Eastern Europe Third-Party Logistics (3PL) Market Market Y-o-Y Growth Rate Comparison by By Transport (2016-2032)
- Table 63: Eastern Europe Third-Party Logistics (3PL) Market Market Y-o-Y Growth Rate Comparison by By End-Use (2016-2032)
- Table 64: Eastern Europe Third-Party Logistics (3PL) Market Market Share Comparison by Country (2016-2032)
- Table 65: Eastern Europe Third-Party Logistics (3PL) Market Market Share Comparison by By Service (2016-2032)
- Table 66: Eastern Europe Third-Party Logistics (3PL) Market Market Share Comparison by By Transport (2016-2032)
- Table 67: Eastern Europe Third-Party Logistics (3PL) Market Market Share Comparison by By End-Use (2016-2032)
- Table 68: APAC Third-Party Logistics (3PL) Market Market Comparison by By Service (2016-2032)
- Table 69: APAC Third-Party Logistics (3PL) Market Market Comparison by By Transport (2016-2032)
- Table 70: APAC Third-Party Logistics (3PL) Market Market Comparison by By End-Use (2016-2032)
- Table 71: APAC Third-Party Logistics (3PL) Market Revenue (US$ Mn) Comparison by Country (2016-2032)
- Table 72: APAC Third-Party Logistics (3PL) Market Market Revenue (US$ Mn) (2016-2032)
- Table 73: APAC Third-Party Logistics (3PL) Market Market Revenue (US$ Mn) Comparison by Country (2016-2032)
- Table 74: APAC Third-Party Logistics (3PL) Market Market Revenue (US$ Mn) Comparison by By Service (2016-2032)
- Table 75: APAC Third-Party Logistics (3PL) Market Market Revenue (US$ Mn) Comparison by By Transport (2016-2032)
- Table 76: APAC Third-Party Logistics (3PL) Market Market Revenue (US$ Mn) Comparison by By End-Use (2016-2032)
- Table 77: APAC Third-Party Logistics (3PL) Market Market Y-o-Y Growth Rate Comparison by Country (2016-2032)
- Table 78: APAC Third-Party Logistics (3PL) Market Market Y-o-Y Growth Rate Comparison by By Service (2016-2032)
- Table 79: APAC Third-Party Logistics (3PL) Market Market Y-o-Y Growth Rate Comparison by By Transport (2016-2032)
- Table 80: APAC Third-Party Logistics (3PL) Market Market Y-o-Y Growth Rate Comparison by By End-Use (2016-2032)
- Table 81: APAC Third-Party Logistics (3PL) Market Market Share Comparison by Country (2016-2032)
- Table 82: APAC Third-Party Logistics (3PL) Market Market Share Comparison by By Service (2016-2032)
- Table 83: APAC Third-Party Logistics (3PL) Market Market Share Comparison by By Transport (2016-2032)
- Table 84: APAC Third-Party Logistics (3PL) Market Market Share Comparison by By End-Use (2016-2032)
- Table 85: Latin America Third-Party Logistics (3PL) Market Market Comparison by By Service (2016-2032)
- Table 86: Latin America Third-Party Logistics (3PL) Market Market Comparison by By Transport (2016-2032)
- Table 87: Latin America Third-Party Logistics (3PL) Market Market Comparison by By End-Use (2016-2032)
- Table 88: Latin America Third-Party Logistics (3PL) Market Revenue (US$ Mn) Comparison by Country (2016-2032)
- Table 89: Latin America Third-Party Logistics (3PL) Market Market Revenue (US$ Mn) (2016-2032)
- Table 90: Latin America Third-Party Logistics (3PL) Market Market Revenue (US$ Mn) Comparison by Country (2016-2032)
- Table 91: Latin America Third-Party Logistics (3PL) Market Market Revenue (US$ Mn) Comparison by By Service (2016-2032)
- Table 92: Latin America Third-Party Logistics (3PL) Market Market Revenue (US$ Mn) Comparison by By Transport (2016-2032)
- Table 93: Latin America Third-Party Logistics (3PL) Market Market Revenue (US$ Mn) Comparison by By End-Use (2016-2032)
- Table 94: Latin America Third-Party Logistics (3PL) Market Market Y-o-Y Growth Rate Comparison by Country (2016-2032)
- Table 95: Latin America Third-Party Logistics (3PL) Market Market Y-o-Y Growth Rate Comparison by By Service (2016-2032)
- Table 96: Latin America Third-Party Logistics (3PL) Market Market Y-o-Y Growth Rate Comparison by By Transport (2016-2032)
- Table 97: Latin America Third-Party Logistics (3PL) Market Market Y-o-Y Growth Rate Comparison by By End-Use (2016-2032)
- Table 98: Latin America Third-Party Logistics (3PL) Market Market Share Comparison by Country (2016-2032)
- Table 99: Latin America Third-Party Logistics (3PL) Market Market Share Comparison by By Service (2016-2032)
- Table 100: Latin America Third-Party Logistics (3PL) Market Market Share Comparison by By Transport (2016-2032)
- Table 101: Latin America Third-Party Logistics (3PL) Market Market Share Comparison by By End-Use (2016-2032)
- Table 102: Middle East & Africa Third-Party Logistics (3PL) Market Market Comparison by By Service (2016-2032)
- Table 103: Middle East & Africa Third-Party Logistics (3PL) Market Market Comparison by By Transport (2016-2032)
- Table 104: Middle East & Africa Third-Party Logistics (3PL) Market Market Comparison by By End-Use (2016-2032)
- Table 105: Middle East & Africa Third-Party Logistics (3PL) Market Revenue (US$ Mn) Comparison by Country (2016-2032)
- Table 106: Middle East & Africa Third-Party Logistics (3PL) Market Market Revenue (US$ Mn) (2016-2032)
- Table 107: Middle East & Africa Third-Party Logistics (3PL) Market Market Revenue (US$ Mn) Comparison by Country (2016-2032)
- Table 108: Middle East & Africa Third-Party Logistics (3PL) Market Market Revenue (US$ Mn) Comparison by By Service (2016-2032)
- Table 109: Middle East & Africa Third-Party Logistics (3PL) Market Market Revenue (US$ Mn) Comparison by By Transport (2016-2032)
- Table 110: Middle East & Africa Third-Party Logistics (3PL) Market Market Revenue (US$ Mn) Comparison by By End-Use (2016-2032)
- Table 111: Middle East & Africa Third-Party Logistics (3PL) Market Market Y-o-Y Growth Rate Comparison by Country (2016-2032)
- Table 112: Middle East & Africa Third-Party Logistics (3PL) Market Market Y-o-Y Growth Rate Comparison by By Service (2016-2032)
- Table 113: Middle East & Africa Third-Party Logistics (3PL) Market Market Y-o-Y Growth Rate Comparison by By Transport (2016-2032)
- Table 114: Middle East & Africa Third-Party Logistics (3PL) Market Market Y-o-Y Growth Rate Comparison by By End-Use (2016-2032)
- Table 115: Middle East & Africa Third-Party Logistics (3PL) Market Market Share Comparison by Country (2016-2032)
- Table 116: Middle East & Africa Third-Party Logistics (3PL) Market Market Share Comparison by By Service (2016-2032)
- Table 117: Middle East & Africa Third-Party Logistics (3PL) Market Market Share Comparison by By Transport (2016-2032)
- Table 118: Middle East & Africa Third-Party Logistics (3PL) Market Market Share Comparison by By End-Use (2016-2032)
- 1. Executive Summary
-
- Burris Logistics
- CEVA Logistics
- C.H. Robinson Worldwide (CHRW) Inc.
- DB Schenker Logistics
- FedEx Corporation
- BDP International
- UPS Supply Chain Solutions, Inc.
- Kuehne + Nagel International AG
- J.B. Hunt Transport Services, Inc.
- Nippon Express Co., Ltd.
- XPO Logistics, Inc
Our Clients


View Our Licence Options
