
Textile Yarn Market Report By Source (Animal Source, Plant Source, Chemical Source, Others), By Type (Natural Yarn [Animal Yarn {Silk Yarn, Wool Yarn}, Plant Yarn {Cotton Yarn, Flax Yarn, Hemp Yarn, Jute Yarn, Ramie Yarn}], Artificial Yarn [Polyester, Nylon, Acrylic, Viscose, Others]), By Application (Apparel, Home Textile, Industrial, Others), By Region and Companies - Industry Segment Outlook, Market Assessment, Competition Scenario, Trends and Forecast 2024-2033
-
48346
-
July 2024
-
290
-


-
This report was compiled by Research Team Research team of over 50 passionate professionals leverages advanced research methodologies and analytical expertise to deliver insightful, data-driven market intelligence that empowers businesses across diverse industries to make strategic, well-informed Correspondence Research Team Linkedin | Detailed Market research Methodology Our methodology involves a mix of primary research, including interviews with leading mental health experts, and secondary research from reputable medical journals and databases. View Detailed Methodology Page
-
Quick Navigation
Report Overview
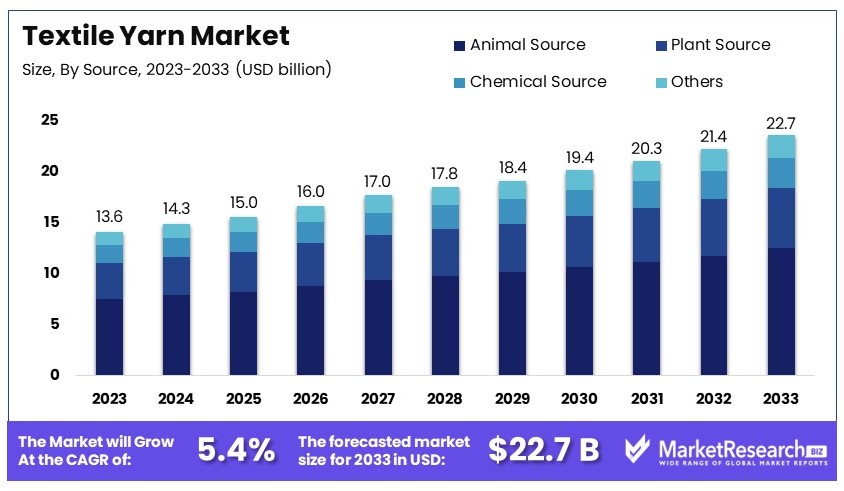
The Global Textile Yarn Market size is expected to be worth around USD 22.7 Billion by 2033, from USD 13.6 Billion in 2023, growing at a CAGR of 5.4% during the forecast period from 2024 to 2033.
The Textile Yarn Market encompasses the global production and distribution of yarns used in the manufacturing of textiles. This market supplies essential materials for sectors such as fashion, home furnishings, and industrial applications. Key products include natural fibers like cotton and wool, and synthetic fibers such as polyester and nylon.
Market dynamics are influenced by factors like raw material availability, technological advancements in spinning, and shifts in consumer preferences towards sustainable materials. The market is pivotal for stakeholders in the textile industry, from manufacturers to end users, ensuring the availability of diverse yarn qualities and types for various applications.
The textile yarn market is poised for significant growth, driven by robust production and strategic initiatives. India, the largest producer of cotton globally, has projected a cotton output of 31.6 million bales for 2023-24. This strong production base is complemented by India's fiber production, which reached 2.15 million tonnes in 2022-23, and yarn production, which stood at 5,185 million kgs.
Globally, polyester remains the most widely produced fiber, with production increasing from 61 million tonnes in 2021 to 63 million tonnes in 2022. This upward trend indicates a growing demand for synthetic fibers, highlighting a shift in market dynamics.
India's government has implemented several initiatives to strengthen its textile industry. The Scheme for Integrated Textile Parks (SITP), Technology Upgradation Fund Scheme (TUFS), and the Mega Integrated Textile Region and Apparel (MITRA) Park scheme are key programs designed to attract private equity and boost employment. These initiatives are expected to enhance the competitiveness of the Indian textile sector on the global stage.
Foreign Direct Investment (FDI) inflows in the Indian textiles sector have been substantial, totaling $4.43 billion between April 2000 and December 2023. This influx of investment underscores the sector's potential and the confidence of international investors in India's textile market.
The textile yarn market is experiencing robust growth, supported by significant production outputs and strategic government initiatives. The increasing production of both natural and synthetic fibers, coupled with substantial FDI inflows, positions the market for continued expansion and enhanced global competitiveness.
Key Takeaways
- Market Value: The Textile Yarn Market was valued at USD 13.6 billion in 2023 and is expected to reach USD 22.7 billion by 2033, with a CAGR of 5.4%.
- Source Analysis: Plant source dominates with 55%, highlighting the demand for natural fibers.
- Type Analysis: Cotton yarn dominates with 65%, emphasizing its extensive use in textiles.
- Application Analysis: Apparel application dominates with 70%, indicating its major consumption in clothing.
- Dominant Region: Asia Pacific leads with ~37%, driven by large-scale textile production.
- Analyst Viewpoint: The market exhibits moderate saturation with significant competition, expected to grow steadily with rising demand for natural yarn.
- Growth Opportunities: Key players can leverage innovations in sustainable and high-performance yarns to stand out in the market.
Driving Factors
Increasing Demand for Apparel and Home Furnishings Drives Market Growth
The textile yarn market is significantly bolstered by the growing consumer appetite for apparel and home furnishings. As global populations increase and disposable incomes rise, especially in emerging economies, there is a marked shift towards fashionable and high-quality textiles.
This trend is particularly evident with the rise of fast fashion and the proliferation of online clothing retailers, which necessitates increased production of textile yarns. The surge in lifestyle spending and the ease of access provided by e-commerce platforms are key drivers, seamlessly connecting consumers to a vast array of textiles, thereby fueling market growth.
Growth of Technical Textiles Drives Market Growth
Technical textiles are at the forefront of the textile yarn market expansion, thanks to their essential roles across diverse industries such as automotive, construction, and healthcare. These applications demand yarns with specialized properties like high strength and moisture resistance.
For example, the automotive industry relies on these yarns for components such as seat covers and airbags, driving substantial demand. This sector's growth is also supported by ongoing innovations and stringent industry standards that call for improved quality and functionality in technical textiles, further stimulating market development.
Innovation in Yarn Materials and Technologies Drives Market Growth
Innovation in yarn materials and technological advancements are key growth drivers in the textile yarn market. The push towards sustainable and eco-friendly yarns, derived from materials like bamboo, recycled plastics, and organic cotton, aligns with increasing environmental consciousness among consumers. These materials are seeing heightened interest as the global focus on sustainability intensifies.
Additionally, advancements such as antimicrobial and self-cleaning yarns are expanding the application range of textile yarns, especially in sectors requiring high hygiene standards like healthcare. These innovations are integrating with broader market trends towards sustainability and enhanced functionality, thereby propelling market expansion.
Restraining Factors
Fluctuations in Raw Material Prices Restrain Textile Yarn Market Growth
Fluctuations in raw material prices significantly impact the textile yarn market. Key raw materials like cotton, wool, and synthetic fibers are essential for yarn production. When the prices of these materials increase, it directly affects production costs. For instance, cotton prices can rise due to unfavorable weather conditions or supply chain disruptions. Higher production costs reduce profitability for yarn manufacturers.
This, in turn, can lead to higher prices for the final yarn products, making them less competitive in the market. The unpredictability of raw material prices adds financial uncertainty for manufacturers, making it harder to plan and invest in future growth. For example, if cotton prices surge unexpectedly, manufacturers might reduce production to avoid losses, slowing down market growth.
Environmental Concerns and Regulations Restrain Textile Yarn Market Growth
Environmental concerns and regulations pose significant challenges to the textile yarn market. The textile industry is under pressure to adopt sustainable practices due to its environmental impact, such as water pollution, greenhouse gas emissions, and waste generation. Governments and consumers are demanding eco-friendly products, pushing manufacturers to invest in sustainable technologies and processes. However, these investments can be costly.
Manufacturers who fail to comply with stringent environmental regulations risk losing market share to more environmentally conscious competitors. This shift towards sustainability, while beneficial in the long term, can strain the financial resources of manufacturers in the short term. Compliance with environmental regulations often requires significant capital expenditure, which can be a deterrent for smaller manufacturers and slow market growth.
Source Analysis
Plant source dominates with 55% due to its sustainable properties and widespread availability.
The textile yarn market is segmented by source into animal, plant, chemical, and others. Among these, plant source yarn exhibits the largest market share. This dominance can be attributed to the growing demand for sustainable and eco-friendly products, as consumers increasingly prioritize environmental impact in their purchasing decisions. Plant-based yarns, such as cotton and flax, are not only renewable but also biodegradable, which enhances their appeal.
Animal source yarns, including silk and wool, are highly valued for their quality and unique properties such as warmth and durability. However, issues such as higher production costs and ethical concerns regarding animal welfare curtail their market growth.
Chemical source yarns, such as polyester and nylon, are prized for their strength, durability, and elasticity. However, environmental concerns over their non-biodegradable nature are prompting consumers and manufacturers to consider more sustainable alternatives.
The "others" category includes innovative sources like recycled materials, which are gaining traction as part of the industry’s move towards sustainability. These materials are critical in reducing the environmental footprint of the textile industry, contributing significantly to market growth by addressing the increasing demand for eco-friendly products.
Type Analysis
Cotton Yarn dominates with 65% due to its versatility and consumer preference for comfort.
The Type segment in the textile yarn market is broadly categorized into natural yarn and artificial yarn. Within natural yarn, cotton yarn holds the preeminent position. Its dominance is driven by its breathability, comfort, and hypoallergenic properties, making it highly desirable for a wide range of applications, from apparel to home textiles.
Other natural yarns such as flax, hemp, and jute are recognized for their environmental benefits and are seeing increased usage due to the rising trend towards sustainability. However, their market share is comparatively smaller due to limited cultivation and processing technologies.
Among artificial yarns, polyester leads due to its cost-effectiveness and extensive application across various textile segments. Nylon, acrylic, and viscose also hold significant shares, with particular strengths such as elasticity and color retention enhancing their suitability for specific applications.
The remaining sub-segments within the artificial yarns, such as specialized synthetic fibers, are critical for their roles in specific industrial applications where performance specifications exceed the capacities of natural fibers.
Application Analysis
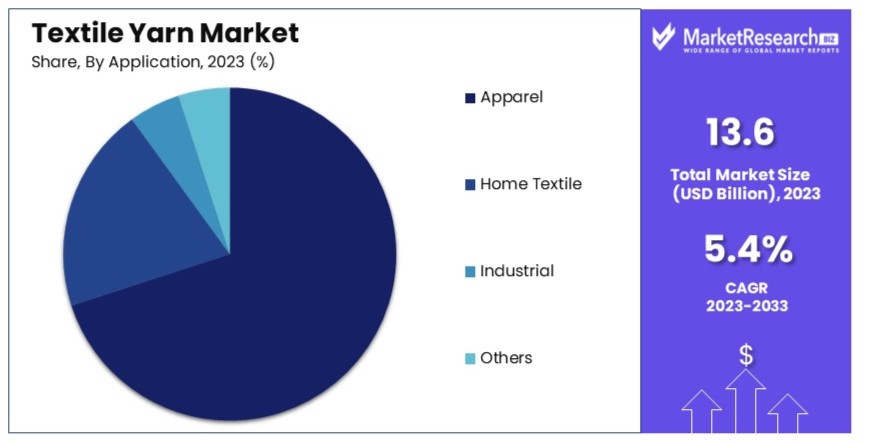
Apparel dominates with 70% due to high consumer demand across global fashion markets.
The Application segment of the textile yarn market is divided into apparel, home textile, industrial, and others. Apparel takes the largest share, driven by global fashion industry demands and the constant need for clothing. The versatility and adaptability of textile yarns to various fashion needs make this segment particularly robust.
Home textiles also represent a significant share, with growth driven by increasing consumer spending on home decor and furnishing. As lifestyle standards rise globally, consumers are investing more in quality home textile products.
Industrial applications include technical textiles used in automotive, healthcare, and other industries. These segments are expanding due to technological advancements and increased requirements for specialized textile materials.
The "others" category encompasses uses in sectors like agriculture and protective clothing, which, while smaller in market size, are experiencing rapid growth due to innovation and new material developments. These applications are essential for driving the market's expansion by fulfilling niche market needs and adapting to new technological trends.
Key Market Segments
By Source
- Animal Source
- Plant Source
- Chemical Source
- Others
By Type
- Natural Yarn
- Animal Yarn
- Silk Yarn
- Wool Yarn
- Plant Yarn
- Cotton Yarn
- Flax Yarn
- Hemp Yarn
- Jute Yarn
- Ramie Yarn
- Animal Yarn
- Artificial Yarn
- Polyester
- Nylon
- Acrylic
- Viscose
- Others
By Application
- Apparel
- Home Textile
- Industrial
- Others
Growth Opportunities
Increasing Demand for Sustainable and Eco-Friendly Yarns Offers Growth Opportunity
The rising demand for sustainable and eco-friendly yarns is driven by increasing environmental awareness among consumers. This trend provides growth opportunities for yarn manufacturers who can develop and market yarns made from recycled materials and organic fibers. Companies like Patagonia and Tentree have successfully leveraged this trend by using recycled and sustainable yarns in their clothing lines. By focusing on eco-friendly production processes, yarn manufacturers can attract environmentally conscious consumers and expand their market share.
Growth of Smart Textiles and Wearable Technology Offers Growth Opportunity
The integration of technology into textiles has led to a growing market for smart textiles, e-textiles and wearable technology. This trend creates demand for specialized yarns with conductive properties and the ability to integrate sensors and electronics. Companies like Google and Apple are exploring the use of conductive yarns in their smart clothing and wearable products. Yarn manufacturers investing in innovative yarn technologies can benefit from this trend and capture new market opportunities.
Trending Factors
Customization and Personalization Are Trending Factors
The increasing desire for personalized and customized textile products is a significant trend driving the demand for specialized yarns. Consumers seek unique styles and preferences, prompting manufacturers to develop yarns that cater to these individual needs. This trend allows for the creation of bespoke products that resonate with consumers on a personal level, fostering brand loyalty and opening up new market segments for yarn producers.
Digital Printing on Textiles Are Trending Factors
The rise of digital printing technology in the textile industry is creating opportunities for yarn manufacturers to develop specialized yarns optimized for digital printing processes. This technology allows for intricate designs and vibrant colors, enhancing the appeal of textile products. Yarn manufacturers can capitalize on this trend by producing yarns that ensure high-quality printing results, thus meeting the growing demand for digitally printed textiles and expanding their market presence.
Regional Analysis
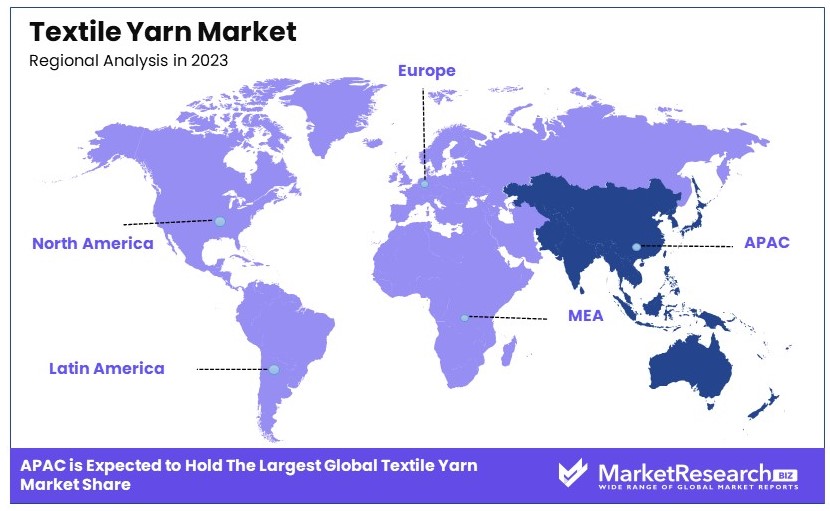
Asia Pacific Dominates with 37% Market Share in the Textile Yarn Industry
The Asia Pacific region's commanding 37% share of the global textile yarn market can be attributed to several key factors. Firstly, the presence of a robust textile manufacturing infrastructure and a substantial base of skilled labor significantly contribute to this dominance. Additionally, the region benefits from favorable government policies that support textile exports and industry growth. High domestic demand in populous countries like China and India also plays a crucial role, along with competitive cost structures that attract international clothing brands to manufacture in these countries.
The textile yarn industry in Asia Pacific is characterized by its integration within the global supply chain, which positions it as a crucial supplier to international markets. This region's dominance is further reinforced by advancements in textile technology and sustainable practices that meet global environmental standards, attracting partnerships and investments. The diverse range of yarns produced, from basic cotton to sophisticated synthetics, enables Asia Pacific to cater to a wide array of market segments, both domestic and international.
Regional Market Shares and Dynamics:
North America: Holding approximately 15% of the global textile yarn market, North America's performance is bolstered by technological innovations and a strong focus on sustainable and bio-based materials. The region's market is expected to see moderate growth, driven by consumer demand for eco-friendly products and local manufacturing resurgence.
Europe: Europe commands around 20% of the market share, with its strength lying in high-quality, luxury textile yarns that are preferred in fashion industries worldwide. The market is driven by stringent environmental regulations promoting sustainable production methods, which is expected to sustain its growth.
Middle East & Africa: This region, with about 10% market share, is experiencing gradual growth due to increasing investment in textile infrastructure and the rising local demand. The development of textile zones and favorable trade agreements are pivotal in enhancing its market presence.
Latin America: Latin America holds a smaller share of around 5%, but is poised for growth through increased focus on sustainable practices and the expansion of local manufacturing capacities to reduce dependence on imports.
Key Regions and Countries
- North America
- The US
- Canada
- Mexico
- Western Europe
- Germany
- France
- The UK
- Spain
- Italy
- Portugal
- Ireland
- Austria
- Switzerland
- Benelux
- Nordic
- Rest of Western Europe
- Eastern Europe
- Russia
- Poland
- The Czech Republic
- Greece
- Rest of Eastern Europe
- APAC
- China
- Japan
- South Korea
- India
- Australia & New Zealand
- Indonesia
- Malaysia
- Philippines
- Singapore
- Thailand
- Vietnam
- Rest of APAC
- Latin America
- Brazil
- Colombia
- Chile
- Argentina
- Costa Rica
- Rest of Latin America
- Middle East & Africa
- Algeria
- Egypt
- Israel
- Kuwait
- Nigeria
- Saudi Arabia
- South Africa
- Turkey
- United Arab Emirates
- Rest of MEA
Key Players Analysis
The Textile Yarn Market is influenced by several major players. These companies hold strategic positions and have significant market influence. Vardhman Textiles Ltd., Grasim Industries Limited, and Raymond Ltd. are notable for their established reputations and wide product ranges. Their strong supply chains and robust distribution networks provide a competitive edge.
Weiqiao Textile Company Limited and Huvis Corporation lead in technological advancements, focusing on innovation and high-quality yarn production. Parkdale Mills Incorporated and Hengli Group are significant due to their large-scale operations and efficient production methods.
Indorama Ventures Public Company Limited and Jaya Shree Textiles stand out for their global reach and diversified product offerings. Their strategies include vertical integration and strategic acquisitions to enhance market presence.
Kairuide Holding Co., Ltd. and Shandong Demian Incorporated Company have a strong regional presence, leveraging local resources and cost advantages. Alok Industries Ltd. and Arvind Limited are key players in sustainability, emphasizing eco-friendly practices and products.
RSWM Ltd. and PT. Indo-Rama Synthetics Tbk excel in niche markets, focusing on specialty yarns and innovative solutions. Their strategic positioning allows them to cater to specific customer needs and maintain a loyal customer base.
Overall, the market is characterized by a mix of large, diversified corporations and specialized firms, each contributing to the market's growth and development through various strategies and innovations.
Market Key Players
- Vardhman Textiles Ltd.
- Grasim Industries Limited
- Raymond Ltd.
- Weiqiao Textile Company Limited
- Huvis Corporation
- Parkdale Mills Incorporated
- Hengli Group
- Indorama Ventures Public Company Limited
- Jaya Shree Textiles
- Kairuide Holding Co., Ltd.
- Shandong Demian Incorporated Company
- Alok Industries Ltd.
- Arvind Limited
- RSWM Ltd.
- PT. Indo-Rama Synthetics Tbk
Recent Developments
- ColossusTex's Launch of Graphene Yarn: On March 2024, ColossusTex introduced its revolutionary Graphene Yarn at Bharat Tex 2024. This new yarn offers numerous benefits, including antibacterial properties, UV protection, and enhanced blood circulation. It also features an anion generation that purifies the skin surface and air, and is available in various polymers such as Polyester Filament, Nylon Filament, and Cotton Nylon Blends.
- Yarn Expo Autumn 2024: Yarn Expo Autumn 2024 is scheduled for August 2024, in Shanghai. The event will focus on sustainability and will feature a wide range of eco-friendly yarns and fibers. The expo is expected to attract numerous exhibitors and buyers, promoting innovation and sustainability in the yarn industry.
Report Scope
Report Features Description Market Value (2023) USD 13.6 Billion Forecast Revenue (2033) USD 22.7 Billion CAGR (2024-2033) 5.4% Base Year for Estimation 2023 Historic Period 2018-2023 Forecast Period 2024-2033 Report Coverage Revenue Forecast, Market Dynamics, Competitive Landscape, Recent Developments Segments Covered By Source (Animal Source, Plant Source, Chemical Source, Others), By Type (Natural Yarn [Animal Yarn {Silk Yarn, Wool Yarn}, Plant Yarn {Cotton Yarn, Flax Yarn, Hemp Yarn, Jute Yarn, Ramie Yarn}], Artificial Yarn [Polyester, Nylon, Acrylic, Viscose, Others]), By Application (Apparel, Home Textile, Industrial, Others) Regional Analysis North America - The US, Canada, & Mexico; Western Europe - Germany, France, The UK, Spain, Italy, Portugal, Ireland, Austria, Switzerland, Benelux, Nordic, & Rest of Western Europe; Eastern Europe - Russia, Poland, The Czech Republic, Greece, & Rest of Eastern Europe; APAC - China, Japan, South Korea, India, Australia & New Zealand, Indonesia, Malaysia, Philippines, Singapore, Thailand, Vietnam, & Rest of APAC; Latin America - Brazil, Colombia, Chile, Argentina, Costa Rica, & Rest of Latin America; Middle East & Africa - Algeria, Egypt, Israel, Kuwait, Nigeria, Saudi Arabia, South Africa, Turkey, United Arab Emirates, & Rest of MEA Competitive Landscape Vardhman Textiles Ltd., Grasim Industries Limited, Raymond Ltd., Weiqiao Textile Company Limited, Huvis Corporation, Parkdale Mills Incorporated, Hengli Group, Indorama Ventures Public Company Limited, Jaya Shree Textiles, Kairuide Holding Co., Ltd., Shandong Demian Incorporated Company, Alok Industries Ltd., Arvind Limited, RSWM Ltd., PT. Indo-Rama Synthetics Tbk Customization Scope Customization for segments, region/country-level will be provided. Moreover, additional customization can be done based on the requirements. Purchase Options We have three licenses to opt for: Single User License, Multi-User License (Up to 5 Users), Corporate Use License (Unlimited User and Printable PDF) -
- 1. Executive Summary
- 1.1. Definition
- 1.2. Taxonomy
- 1.3. Research Scope
- 1.4. Key Analysis
- 1.5. Key Findings by Major Segments
- 1.6. Top strategies by Major Players
- 2. Global Textile Yarn Market Overview
- 2.1. Textile Yarn Market Dynamics
- 2.1.1. Drivers
- 2.1.2. Opportunities
- 2.1.3. Restraints
- 2.1.4. Challenges
- 2.2. Macro-economic Factors
- 2.3. Regulatory Framework
- 2.4. Market Investment Feasibility Index
- 2.5. PEST Analysis
- 2.6. PORTER’S Five Force Analysis
- 2.7. Drivers & Restraints Impact Analysis
- 2.8. Industry Chain Analysis
- 2.9. Cost Structure Analysis
- 2.10. Marketing Strategy
- 2.11. Russia-Ukraine War Impact Analysis
- 2.12. Opportunity Map Analysis
- 2.13. Market Competition Scenario Analysis
- 2.14. Product Life Cycle Analysis
- 2.15. Opportunity Orbits
- 2.16. Manufacturer Intensity Map
- 2.17. Major Companies sales by Value & Volume
- 2.1. Textile Yarn Market Dynamics
- 3. Global Textile Yarn Market Analysis, Opportunity and Forecast, 2016-2032
- 3.1. Global Textile Yarn Market Analysis, 2016-2021
- 3.2. Global Textile Yarn Market Opportunity and Forecast, 2023-2032
- 3.3. Global Textile Yarn Market Analysis, Opportunity and Forecast, By Source, 2016-2032
- 3.3.1. Global Textile Yarn Market Analysis by Source: Introduction
- 3.3.2. Market Size Absolute $ Opportunity Analysis and Forecast, By Source, 2016-2032
- 3.3.3. Animal Source
- 3.3.4. Plant Source
- 3.3.5. Chemical Source
- 3.3.6. Others
- 3.4. Global Textile Yarn Market Analysis, Opportunity and Forecast, By Type, 2016-2032
- 3.4.1. Global Textile Yarn Market Analysis by Type: Introduction
- 3.4.2. Market Size Absolute $ Opportunity Analysis and Forecast, By Type, 2016-2032
- 3.4.3. Natural Yarn
- 3.4.4. Artificial Yarn
- 3.5. Global Textile Yarn Market Analysis, Opportunity and Forecast, By Application, 2016-2032
- 3.5.1. Global Textile Yarn Market Analysis by Application: Introduction
- 3.5.2. Market Size Absolute $ Opportunity Analysis and Forecast, By Application, 2016-2032
- 3.5.3. Apparel
- 3.5.4. Home Textile
- 3.5.5. Industrial
- 3.5.6. Others
- 4. North America Textile Yarn Market Analysis, Opportunity and Forecast, 2016-2032
- 4.1. North America Textile Yarn Market Analysis, 2016-2021
- 4.2. North America Textile Yarn Market Opportunity and Forecast, 2023-2032
- 4.3. North America Textile Yarn Market Analysis, Opportunity and Forecast, By Source, 2016-2032
- 4.3.1. North America Textile Yarn Market Analysis by Source: Introduction
- 4.3.2. Market Size Absolute $ Opportunity Analysis and Forecast, By Source, 2016-2032
- 4.3.3. Animal Source
- 4.3.4. Plant Source
- 4.3.5. Chemical Source
- 4.3.6. Others
- 4.4. North America Textile Yarn Market Analysis, Opportunity and Forecast, By Type, 2016-2032
- 4.4.1. North America Textile Yarn Market Analysis by Type: Introduction
- 4.4.2. Market Size Absolute $ Opportunity Analysis and Forecast, By Type, 2016-2032
- 4.4.3. Natural Yarn
- 4.4.4. Artificial Yarn
- 4.5. North America Textile Yarn Market Analysis, Opportunity and Forecast, By Application, 2016-2032
- 4.5.1. North America Textile Yarn Market Analysis by Application: Introduction
- 4.5.2. Market Size Absolute $ Opportunity Analysis and Forecast, By Application, 2016-2032
- 4.5.3. Apparel
- 4.5.4. Home Textile
- 4.5.5. Industrial
- 4.5.6. Others
- 4.6. North America Textile Yarn Market Analysis, Opportunity and Forecast, By Country , 2016-2032
- 4.6.1. North America Textile Yarn Market Analysis by Country : Introduction
- 4.6.2. Market Size Absolute $ Opportunity Analysis and Forecast, Country , 2016-2032
- 4.6.2.1. The US
- 4.6.2.2. Canada
- 4.6.2.3. Mexico
- 5. Western Europe Textile Yarn Market Analysis, Opportunity and Forecast, 2016-2032
- 5.1. Western Europe Textile Yarn Market Analysis, 2016-2021
- 5.2. Western Europe Textile Yarn Market Opportunity and Forecast, 2023-2032
- 5.3. Western Europe Textile Yarn Market Analysis, Opportunity and Forecast, By Source, 2016-2032
- 5.3.1. Western Europe Textile Yarn Market Analysis by Source: Introduction
- 5.3.2. Market Size Absolute $ Opportunity Analysis and Forecast, By Source, 2016-2032
- 5.3.3. Animal Source
- 5.3.4. Plant Source
- 5.3.5. Chemical Source
- 5.3.6. Others
- 5.4. Western Europe Textile Yarn Market Analysis, Opportunity and Forecast, By Type, 2016-2032
- 5.4.1. Western Europe Textile Yarn Market Analysis by Type: Introduction
- 5.4.2. Market Size Absolute $ Opportunity Analysis and Forecast, By Type, 2016-2032
- 5.4.3. Natural Yarn
- 5.4.4. Artificial Yarn
- 5.5. Western Europe Textile Yarn Market Analysis, Opportunity and Forecast, By Application, 2016-2032
- 5.5.1. Western Europe Textile Yarn Market Analysis by Application: Introduction
- 5.5.2. Market Size Absolute $ Opportunity Analysis and Forecast, By Application, 2016-2032
- 5.5.3. Apparel
- 5.5.4. Home Textile
- 5.5.5. Industrial
- 5.5.6. Others
- 5.6. Western Europe Textile Yarn Market Analysis, Opportunity and Forecast, By Country , 2016-2032
- 5.6.1. Western Europe Textile Yarn Market Analysis by Country : Introduction
- 5.6.2. Market Size Absolute $ Opportunity Analysis and Forecast, Country , 2016-2032
- 5.6.2.1. Germany
- 5.6.2.2. France
- 5.6.2.3. The UK
- 5.6.2.4. Spain
- 5.6.2.5. Italy
- 5.6.2.6. Portugal
- 5.6.2.7. Ireland
- 5.6.2.8. Austria
- 5.6.2.9. Switzerland
- 5.6.2.10. Benelux
- 5.6.2.11. Nordic
- 5.6.2.12. Rest of Western Europe
- 6. Eastern Europe Textile Yarn Market Analysis, Opportunity and Forecast, 2016-2032
- 6.1. Eastern Europe Textile Yarn Market Analysis, 2016-2021
- 6.2. Eastern Europe Textile Yarn Market Opportunity and Forecast, 2023-2032
- 6.3. Eastern Europe Textile Yarn Market Analysis, Opportunity and Forecast, By Source, 2016-2032
- 6.3.1. Eastern Europe Textile Yarn Market Analysis by Source: Introduction
- 6.3.2. Market Size Absolute $ Opportunity Analysis and Forecast, By Source, 2016-2032
- 6.3.3. Animal Source
- 6.3.4. Plant Source
- 6.3.5. Chemical Source
- 6.3.6. Others
- 6.4. Eastern Europe Textile Yarn Market Analysis, Opportunity and Forecast, By Type, 2016-2032
- 6.4.1. Eastern Europe Textile Yarn Market Analysis by Type: Introduction
- 6.4.2. Market Size Absolute $ Opportunity Analysis and Forecast, By Type, 2016-2032
- 6.4.3. Natural Yarn
- 6.4.4. Artificial Yarn
- 6.5. Eastern Europe Textile Yarn Market Analysis, Opportunity and Forecast, By Application, 2016-2032
- 6.5.1. Eastern Europe Textile Yarn Market Analysis by Application: Introduction
- 6.5.2. Market Size Absolute $ Opportunity Analysis and Forecast, By Application, 2016-2032
- 6.5.3. Apparel
- 6.5.4. Home Textile
- 6.5.5. Industrial
- 6.5.6. Others
- 6.6. Eastern Europe Textile Yarn Market Analysis, Opportunity and Forecast, By Country , 2016-2032
- 6.6.1. Eastern Europe Textile Yarn Market Analysis by Country : Introduction
- 6.6.2. Market Size Absolute $ Opportunity Analysis and Forecast, Country , 2016-2032
- 6.6.2.1. Russia
- 6.6.2.2. Poland
- 6.6.2.3. The Czech Republic
- 6.6.2.4. Greece
- 6.6.2.5. Rest of Eastern Europe
- 7. APAC Textile Yarn Market Analysis, Opportunity and Forecast, 2016-2032
- 7.1. APAC Textile Yarn Market Analysis, 2016-2021
- 7.2. APAC Textile Yarn Market Opportunity and Forecast, 2023-2032
- 7.3. APAC Textile Yarn Market Analysis, Opportunity and Forecast, By Source, 2016-2032
- 7.3.1. APAC Textile Yarn Market Analysis by Source: Introduction
- 7.3.2. Market Size Absolute $ Opportunity Analysis and Forecast, By Source, 2016-2032
- 7.3.3. Animal Source
- 7.3.4. Plant Source
- 7.3.5. Chemical Source
- 7.3.6. Others
- 7.4. APAC Textile Yarn Market Analysis, Opportunity and Forecast, By Type, 2016-2032
- 7.4.1. APAC Textile Yarn Market Analysis by Type: Introduction
- 7.4.2. Market Size Absolute $ Opportunity Analysis and Forecast, By Type, 2016-2032
- 7.4.3. Natural Yarn
- 7.4.4. Artificial Yarn
- 7.5. APAC Textile Yarn Market Analysis, Opportunity and Forecast, By Application, 2016-2032
- 7.5.1. APAC Textile Yarn Market Analysis by Application: Introduction
- 7.5.2. Market Size Absolute $ Opportunity Analysis and Forecast, By Application, 2016-2032
- 7.5.3. Apparel
- 7.5.4. Home Textile
- 7.5.5. Industrial
- 7.5.6. Others
- 7.6. APAC Textile Yarn Market Analysis, Opportunity and Forecast, By Country , 2016-2032
- 7.6.1. APAC Textile Yarn Market Analysis by Country : Introduction
- 7.6.2. Market Size Absolute $ Opportunity Analysis and Forecast, Country , 2016-2032
- 7.6.2.1. China
- 7.6.2.2. Japan
- 7.6.2.3. South Korea
- 7.6.2.4. India
- 7.6.2.5. Australia & New Zeland
- 7.6.2.6. Indonesia
- 7.6.2.7. Malaysia
- 7.6.2.8. Philippines
- 7.6.2.9. Singapore
- 7.6.2.10. Thailand
- 7.6.2.11. Vietnam
- 7.6.2.12. Rest of APAC
- 8. Latin America Textile Yarn Market Analysis, Opportunity and Forecast, 2016-2032
- 8.1. Latin America Textile Yarn Market Analysis, 2016-2021
- 8.2. Latin America Textile Yarn Market Opportunity and Forecast, 2023-2032
- 8.3. Latin America Textile Yarn Market Analysis, Opportunity and Forecast, By Source, 2016-2032
- 8.3.1. Latin America Textile Yarn Market Analysis by Source: Introduction
- 8.3.2. Market Size Absolute $ Opportunity Analysis and Forecast, By Source, 2016-2032
- 8.3.3. Animal Source
- 8.3.4. Plant Source
- 8.3.5. Chemical Source
- 8.3.6. Others
- 8.4. Latin America Textile Yarn Market Analysis, Opportunity and Forecast, By Type, 2016-2032
- 8.4.1. Latin America Textile Yarn Market Analysis by Type: Introduction
- 8.4.2. Market Size Absolute $ Opportunity Analysis and Forecast, By Type, 2016-2032
- 8.4.3. Natural Yarn
- 8.4.4. Artificial Yarn
- 8.5. Latin America Textile Yarn Market Analysis, Opportunity and Forecast, By Application, 2016-2032
- 8.5.1. Latin America Textile Yarn Market Analysis by Application: Introduction
- 8.5.2. Market Size Absolute $ Opportunity Analysis and Forecast, By Application, 2016-2032
- 8.5.3. Apparel
- 8.5.4. Home Textile
- 8.5.5. Industrial
- 8.5.6. Others
- 8.6. Latin America Textile Yarn Market Analysis, Opportunity and Forecast, By Country , 2016-2032
- 8.6.1. Latin America Textile Yarn Market Analysis by Country : Introduction
- 8.6.2. Market Size Absolute $ Opportunity Analysis and Forecast, Country , 2016-2032
- 8.6.2.1. Brazil
- 8.6.2.2. Colombia
- 8.6.2.3. Chile
- 8.6.2.4. Argentina
- 8.6.2.5. Costa Rica
- 8.6.2.6. Rest of Latin America
- 9. Middle East & Africa Textile Yarn Market Analysis, Opportunity and Forecast, 2016-2032
- 9.1. Middle East & Africa Textile Yarn Market Analysis, 2016-2021
- 9.2. Middle East & Africa Textile Yarn Market Opportunity and Forecast, 2023-2032
- 9.3. Middle East & Africa Textile Yarn Market Analysis, Opportunity and Forecast, By Source, 2016-2032
- 9.3.1. Middle East & Africa Textile Yarn Market Analysis by Source: Introduction
- 9.3.2. Market Size Absolute $ Opportunity Analysis and Forecast, By Source, 2016-2032
- 9.3.3. Animal Source
- 9.3.4. Plant Source
- 9.3.5. Chemical Source
- 9.3.6. Others
- 9.4. Middle East & Africa Textile Yarn Market Analysis, Opportunity and Forecast, By Type, 2016-2032
- 9.4.1. Middle East & Africa Textile Yarn Market Analysis by Type: Introduction
- 9.4.2. Market Size Absolute $ Opportunity Analysis and Forecast, By Type, 2016-2032
- 9.4.3. Natural Yarn
- 9.4.4. Artificial Yarn
- 9.5. Middle East & Africa Textile Yarn Market Analysis, Opportunity and Forecast, By Application, 2016-2032
- 9.5.1. Middle East & Africa Textile Yarn Market Analysis by Application: Introduction
- 9.5.2. Market Size Absolute $ Opportunity Analysis and Forecast, By Application, 2016-2032
- 9.5.3. Apparel
- 9.5.4. Home Textile
- 9.5.5. Industrial
- 9.5.6. Others
- 9.6. Middle East & Africa Textile Yarn Market Analysis, Opportunity and Forecast, By Country , 2016-2032
- 9.6.1. Middle East & Africa Textile Yarn Market Analysis by Country : Introduction
- 9.6.2. Market Size Absolute $ Opportunity Analysis and Forecast, Country , 2016-2032
- 9.6.2.1. Algeria
- 9.6.2.2. Egypt
- 9.6.2.3. Israel
- 9.6.2.4. Kuwait
- 9.6.2.5. Nigeria
- 9.6.2.6. Saudi Arabia
- 9.6.2.7. South Africa
- 9.6.2.8. Turkey
- 9.6.2.9. The UAE
- 9.6.2.10. Rest of MEA
- 10. Global Textile Yarn Market Analysis, Opportunity and Forecast, By Region , 2016-2032
- 10.1. Global Textile Yarn Market Analysis by Region : Introduction
- 10.2. Market Size Absolute $ Opportunity Analysis and Forecast, By Region , 2016-2032
- 10.2.1. North America
- 10.2.2. Western Europe
- 10.2.3. Eastern Europe
- 10.2.4. APAC
- 10.2.5. Latin America
- 10.2.6. Middle East & Africa
- 11. Global Textile Yarn Market Competitive Landscape, Market Share Analysis, and Company Profiles
- 11.1. Market Share Analysis
- 11.2. Company Profiles
- 11.3. Vardhman Textiles Ltd.
- 11.3.1. Company Overview
- 11.3.2. Financial Highlights
- 11.3.3. Product Portfolio
- 11.3.4. SWOT Analysis
- 11.3.5. Key Strategies and Developments
- 11.4. Grasim Industries Limited
- 11.4.1. Company Overview
- 11.4.2. Financial Highlights
- 11.4.3. Product Portfolio
- 11.4.4. SWOT Analysis
- 11.4.5. Key Strategies and Developments
- 11.5. Raymond Ltd.
- 11.5.1. Company Overview
- 11.5.2. Financial Highlights
- 11.5.3. Product Portfolio
- 11.5.4. SWOT Analysis
- 11.5.5. Key Strategies and Developments
- 11.6. Weiqiao Textile Company Limited
- 11.6.1. Company Overview
- 11.6.2. Financial Highlights
- 11.6.3. Product Portfolio
- 11.6.4. SWOT Analysis
- 11.6.5. Key Strategies and Developments
- 11.7. Huvis Corporation
- 11.7.1. Company Overview
- 11.7.2. Financial Highlights
- 11.7.3. Product Portfolio
- 11.7.4. SWOT Analysis
- 11.7.5. Key Strategies and Developments
- 11.8. Parkdale Mills Incorporated
- 11.8.1. Company Overview
- 11.8.2. Financial Highlights
- 11.8.3. Product Portfolio
- 11.8.4. SWOT Analysis
- 11.8.5. Key Strategies and Developments
- 11.9. Hengli Group
- 11.9.1. Company Overview
- 11.9.2. Financial Highlights
- 11.9.3. Product Portfolio
- 11.9.4. SWOT Analysis
- 11.9.5. Key Strategies and Developments
- 11.10. Indorama Ventures Public Company Limited
- 11.10.1. Company Overview
- 11.10.2. Financial Highlights
- 11.10.3. Product Portfolio
- 11.10.4. SWOT Analysis
- 11.10.5. Key Strategies and Developments
- 11.11. Jaya Shree Textiles
- 11.11.1. Company Overview
- 11.11.2. Financial Highlights
- 11.11.3. Product Portfolio
- 11.11.4. SWOT Analysis
- 11.11.5. Key Strategies and Developments
- 11.12. Kairuide Holding Co., Ltd.
- 11.12.1. Company Overview
- 11.12.2. Financial Highlights
- 11.12.3. Product Portfolio
- 11.12.4. SWOT Analysis
- 11.12.5. Key Strategies and Developments
- 11.13.1. Company Overview
- 11.13.2. Financial Highlights
- 11.13.3. Product Portfolio
- 11.13.4. SWOT Analysis
- 11.13.5. Key Strategies and Developments
- 11.14. Shandong Demian Incorporated Company
- 11.14.1. Company Overview
- 11.14.2. Financial Highlights
- 11.14.3. Product Portfolio
- 11.14.4. SWOT Analysis
- 11.14.5. Key Strategies and Developments
- 11.15. Arvind Limited
- 11.15.1. Company Overview
- 11.15.2. Financial Highlights
- 11.15.3. Product Portfolio
- 11.15.4. SWOT Analysis
- 11.15.5. Key Strategies and Developments
- 11.16. RSWM Ltd.
- 11.16.1. Company Overview
- 11.16.2. Financial Highlights
- 11.16.3. Product Portfolio
- 11.16.4. SWOT Analysis
- 11.16.5. Key Strategies and Developments
- 11.17. PT. Indo-Rama Synthetics Tbk
- 11.17.1. Company Overview
- 11.17.2. Financial Highlights
- 11.17.3. Product Portfolio
- 11.17.4. SWOT Analysis
- 11.17.5. Key Strategies and Developments
- 12. Assumptions and Acronyms
- 13. Research Methodology
- 14. Contact
- List of Figures
- Figure 1: Global Textile Yarn Market Revenue (US$ Mn) Market Share by Source in 2022
- Figure 2: Global Textile Yarn Market Attractiveness Analysis by Source, 2016-2032
- Figure 3: Global Textile Yarn Market Revenue (US$ Mn) Market Share by Typein 2022
- Figure 4: Global Textile Yarn Market Attractiveness Analysis by Type, 2016-2032
- Figure 5: Global Textile Yarn Market Revenue (US$ Mn) Market Share by Applicationin 2022
- Figure 6: Global Textile Yarn Market Attractiveness Analysis by Application, 2016-2032
- Figure 7: Global Textile Yarn Market Revenue (US$ Mn) Market Share by Region in 2022
- Figure 8: Global Textile Yarn Market Attractiveness Analysis by Region, 2016-2032
- Figure 9: Global Textile Yarn Market Revenue (US$ Mn) (2016-2032)
- Figure 10: Global Textile Yarn Market Revenue (US$ Mn) Comparison by Region (2016-2032)
- Figure 11: Global Textile Yarn Market Revenue (US$ Mn) Comparison by Source (2016-2032)
- Figure 12: Global Textile Yarn Market Revenue (US$ Mn) Comparison by Type (2016-2032)
- Figure 13: Global Textile Yarn Market Revenue (US$ Mn) Comparison by Application (2016-2032)
- Figure 14: Global Textile Yarn Market Y-o-Y Growth Rate Comparison by Region (2016-2032)
- Figure 15: Global Textile Yarn Market Y-o-Y Growth Rate Comparison by Source (2016-2032)
- Figure 16: Global Textile Yarn Market Y-o-Y Growth Rate Comparison by Type (2016-2032)
- Figure 17: Global Textile Yarn Market Y-o-Y Growth Rate Comparison by Application (2016-2032)
- Figure 18: Global Textile Yarn Market Share Comparison by Region (2016-2032)
- Figure 19: Global Textile Yarn Market Share Comparison by Source (2016-2032)
- Figure 20: Global Textile Yarn Market Share Comparison by Type (2016-2032)
- Figure 21: Global Textile Yarn Market Share Comparison by Application (2016-2032)
- Figure 22: North America Textile Yarn Market Revenue (US$ Mn) Market Share by Sourcein 2022
- Figure 23: North America Textile Yarn Market Attractiveness Analysis by Source, 2016-2032
- Figure 24: North America Textile Yarn Market Revenue (US$ Mn) Market Share by Typein 2022
- Figure 25: North America Textile Yarn Market Attractiveness Analysis by Type, 2016-2032
- Figure 26: North America Textile Yarn Market Revenue (US$ Mn) Market Share by Applicationin 2022
- Figure 27: North America Textile Yarn Market Attractiveness Analysis by Application, 2016-2032
- Figure 28: North America Textile Yarn Market Revenue (US$ Mn) Market Share by Country in 2022
- Figure 29: North America Textile Yarn Market Attractiveness Analysis by Country, 2016-2032
- Figure 30: North America Textile Yarn Market Revenue (US$ Mn) (2016-2032)
- Figure 31: North America Textile Yarn Market Revenue (US$ Mn) Comparison by Country (2016-2032)
- Figure 32: North America Textile Yarn Market Revenue (US$ Mn) Comparison by Source (2016-2032)
- Figure 33: North America Textile Yarn Market Revenue (US$ Mn) Comparison by Type (2016-2032)
- Figure 34: North America Textile Yarn Market Revenue (US$ Mn) Comparison by Application (2016-2032)
- Figure 35: North America Textile Yarn Market Y-o-Y Growth Rate Comparison by Country (2016-2032)
- Figure 36: North America Textile Yarn Market Y-o-Y Growth Rate Comparison by Source (2016-2032)
- Figure 37: North America Textile Yarn Market Y-o-Y Growth Rate Comparison by Type (2016-2032)
- Figure 38: North America Textile Yarn Market Y-o-Y Growth Rate Comparison by Application (2016-2032)
- Figure 39: North America Textile Yarn Market Share Comparison by Country (2016-2032)
- Figure 40: North America Textile Yarn Market Share Comparison by Source (2016-2032)
- Figure 41: North America Textile Yarn Market Share Comparison by Type (2016-2032)
- Figure 42: North America Textile Yarn Market Share Comparison by Application (2016-2032)
- Figure 43: Western Europe Textile Yarn Market Revenue (US$ Mn) Market Share by Sourcein 2022
- Figure 44: Western Europe Textile Yarn Market Attractiveness Analysis by Source, 2016-2032
- Figure 45: Western Europe Textile Yarn Market Revenue (US$ Mn) Market Share by Typein 2022
- Figure 46: Western Europe Textile Yarn Market Attractiveness Analysis by Type, 2016-2032
- Figure 47: Western Europe Textile Yarn Market Revenue (US$ Mn) Market Share by Applicationin 2022
- Figure 48: Western Europe Textile Yarn Market Attractiveness Analysis by Application, 2016-2032
- Figure 49: Western Europe Textile Yarn Market Revenue (US$ Mn) Market Share by Country in 2022
- Figure 50: Western Europe Textile Yarn Market Attractiveness Analysis by Country, 2016-2032
- Figure 51: Western Europe Textile Yarn Market Revenue (US$ Mn) (2016-2032)
- Figure 52: Western Europe Textile Yarn Market Revenue (US$ Mn) Comparison by Country (2016-2032)
- Figure 53: Western Europe Textile Yarn Market Revenue (US$ Mn) Comparison by Source (2016-2032)
- Figure 54: Western Europe Textile Yarn Market Revenue (US$ Mn) Comparison by Type (2016-2032)
- Figure 55: Western Europe Textile Yarn Market Revenue (US$ Mn) Comparison by Application (2016-2032)
- Figure 56: Western Europe Textile Yarn Market Y-o-Y Growth Rate Comparison by Country (2016-2032)
- Figure 57: Western Europe Textile Yarn Market Y-o-Y Growth Rate Comparison by Source (2016-2032)
- Figure 58: Western Europe Textile Yarn Market Y-o-Y Growth Rate Comparison by Type (2016-2032)
- Figure 59: Western Europe Textile Yarn Market Y-o-Y Growth Rate Comparison by Application (2016-2032)
- Figure 60: Western Europe Textile Yarn Market Share Comparison by Country (2016-2032)
- Figure 61: Western Europe Textile Yarn Market Share Comparison by Source (2016-2032)
- Figure 62: Western Europe Textile Yarn Market Share Comparison by Type (2016-2032)
- Figure 63: Western Europe Textile Yarn Market Share Comparison by Application (2016-2032)
- Figure 64: Eastern Europe Textile Yarn Market Revenue (US$ Mn) Market Share by Sourcein 2022
- Figure 65: Eastern Europe Textile Yarn Market Attractiveness Analysis by Source, 2016-2032
- Figure 66: Eastern Europe Textile Yarn Market Revenue (US$ Mn) Market Share by Typein 2022
- Figure 67: Eastern Europe Textile Yarn Market Attractiveness Analysis by Type, 2016-2032
- Figure 68: Eastern Europe Textile Yarn Market Revenue (US$ Mn) Market Share by Applicationin 2022
- Figure 69: Eastern Europe Textile Yarn Market Attractiveness Analysis by Application, 2016-2032
- Figure 70: Eastern Europe Textile Yarn Market Revenue (US$ Mn) Market Share by Country in 2022
- Figure 71: Eastern Europe Textile Yarn Market Attractiveness Analysis by Country, 2016-2032
- Figure 72: Eastern Europe Textile Yarn Market Revenue (US$ Mn) (2016-2032)
- Figure 73: Eastern Europe Textile Yarn Market Revenue (US$ Mn) Comparison by Country (2016-2032)
- Figure 74: Eastern Europe Textile Yarn Market Revenue (US$ Mn) Comparison by Source (2016-2032)
- Figure 75: Eastern Europe Textile Yarn Market Revenue (US$ Mn) Comparison by Type (2016-2032)
- Figure 76: Eastern Europe Textile Yarn Market Revenue (US$ Mn) Comparison by Application (2016-2032)
- Figure 77: Eastern Europe Textile Yarn Market Y-o-Y Growth Rate Comparison by Country (2016-2032)
- Figure 78: Eastern Europe Textile Yarn Market Y-o-Y Growth Rate Comparison by Source (2016-2032)
- Figure 79: Eastern Europe Textile Yarn Market Y-o-Y Growth Rate Comparison by Type (2016-2032)
- Figure 80: Eastern Europe Textile Yarn Market Y-o-Y Growth Rate Comparison by Application (2016-2032)
- Figure 81: Eastern Europe Textile Yarn Market Share Comparison by Country (2016-2032)
- Figure 82: Eastern Europe Textile Yarn Market Share Comparison by Source (2016-2032)
- Figure 83: Eastern Europe Textile Yarn Market Share Comparison by Type (2016-2032)
- Figure 84: Eastern Europe Textile Yarn Market Share Comparison by Application (2016-2032)
- Figure 85: APAC Textile Yarn Market Revenue (US$ Mn) Market Share by Sourcein 2022
- Figure 86: APAC Textile Yarn Market Attractiveness Analysis by Source, 2016-2032
- Figure 87: APAC Textile Yarn Market Revenue (US$ Mn) Market Share by Typein 2022
- Figure 88: APAC Textile Yarn Market Attractiveness Analysis by Type, 2016-2032
- Figure 89: APAC Textile Yarn Market Revenue (US$ Mn) Market Share by Applicationin 2022
- Figure 90: APAC Textile Yarn Market Attractiveness Analysis by Application, 2016-2032
- Figure 91: APAC Textile Yarn Market Revenue (US$ Mn) Market Share by Country in 2022
- Figure 92: APAC Textile Yarn Market Attractiveness Analysis by Country, 2016-2032
- Figure 93: APAC Textile Yarn Market Revenue (US$ Mn) (2016-2032)
- Figure 94: APAC Textile Yarn Market Revenue (US$ Mn) Comparison by Country (2016-2032)
- Figure 95: APAC Textile Yarn Market Revenue (US$ Mn) Comparison by Source (2016-2032)
- Figure 96: APAC Textile Yarn Market Revenue (US$ Mn) Comparison by Type (2016-2032)
- Figure 97: APAC Textile Yarn Market Revenue (US$ Mn) Comparison by Application (2016-2032)
- Figure 98: APAC Textile Yarn Market Y-o-Y Growth Rate Comparison by Country (2016-2032)
- Figure 99: APAC Textile Yarn Market Y-o-Y Growth Rate Comparison by Source (2016-2032)
- Figure 100: APAC Textile Yarn Market Y-o-Y Growth Rate Comparison by Type (2016-2032)
- Figure 101: APAC Textile Yarn Market Y-o-Y Growth Rate Comparison by Application (2016-2032)
- Figure 102: APAC Textile Yarn Market Share Comparison by Country (2016-2032)
- Figure 103: APAC Textile Yarn Market Share Comparison by Source (2016-2032)
- Figure 104: APAC Textile Yarn Market Share Comparison by Type (2016-2032)
- Figure 105: APAC Textile Yarn Market Share Comparison by Application (2016-2032)
- Figure 106: Latin America Textile Yarn Market Revenue (US$ Mn) Market Share by Sourcein 2022
- Figure 107: Latin America Textile Yarn Market Attractiveness Analysis by Source, 2016-2032
- Figure 108: Latin America Textile Yarn Market Revenue (US$ Mn) Market Share by Typein 2022
- Figure 109: Latin America Textile Yarn Market Attractiveness Analysis by Type, 2016-2032
- Figure 110: Latin America Textile Yarn Market Revenue (US$ Mn) Market Share by Applicationin 2022
- Figure 111: Latin America Textile Yarn Market Attractiveness Analysis by Application, 2016-2032
- Figure 112: Latin America Textile Yarn Market Revenue (US$ Mn) Market Share by Country in 2022
- Figure 113: Latin America Textile Yarn Market Attractiveness Analysis by Country, 2016-2032
- Figure 114: Latin America Textile Yarn Market Revenue (US$ Mn) (2016-2032)
- Figure 115: Latin America Textile Yarn Market Revenue (US$ Mn) Comparison by Country (2016-2032)
- Figure 116: Latin America Textile Yarn Market Revenue (US$ Mn) Comparison by Source (2016-2032)
- Figure 117: Latin America Textile Yarn Market Revenue (US$ Mn) Comparison by Type (2016-2032)
- Figure 118: Latin America Textile Yarn Market Revenue (US$ Mn) Comparison by Application (2016-2032)
- Figure 119: Latin America Textile Yarn Market Y-o-Y Growth Rate Comparison by Country (2016-2032)
- Figure 120: Latin America Textile Yarn Market Y-o-Y Growth Rate Comparison by Source (2016-2032)
- Figure 121: Latin America Textile Yarn Market Y-o-Y Growth Rate Comparison by Type (2016-2032)
- Figure 122: Latin America Textile Yarn Market Y-o-Y Growth Rate Comparison by Application (2016-2032)
- Figure 123: Latin America Textile Yarn Market Share Comparison by Country (2016-2032)
- Figure 124: Latin America Textile Yarn Market Share Comparison by Source (2016-2032)
- Figure 125: Latin America Textile Yarn Market Share Comparison by Type (2016-2032)
- Figure 126: Latin America Textile Yarn Market Share Comparison by Application (2016-2032)
- Figure 127: Middle East & Africa Textile Yarn Market Revenue (US$ Mn) Market Share by Sourcein 2022
- Figure 128: Middle East & Africa Textile Yarn Market Attractiveness Analysis by Source, 2016-2032
- Figure 129: Middle East & Africa Textile Yarn Market Revenue (US$ Mn) Market Share by Typein 2022
- Figure 130: Middle East & Africa Textile Yarn Market Attractiveness Analysis by Type, 2016-2032
- Figure 131: Middle East & Africa Textile Yarn Market Revenue (US$ Mn) Market Share by Applicationin 2022
- Figure 132: Middle East & Africa Textile Yarn Market Attractiveness Analysis by Application, 2016-2032
- Figure 133: Middle East & Africa Textile Yarn Market Revenue (US$ Mn) Market Share by Country in 2022
- Figure 134: Middle East & Africa Textile Yarn Market Attractiveness Analysis by Country, 2016-2032
- Figure 135: Middle East & Africa Textile Yarn Market Revenue (US$ Mn) (2016-2032)
- Figure 136: Middle East & Africa Textile Yarn Market Revenue (US$ Mn) Comparison by Country (2016-2032)
- Figure 137: Middle East & Africa Textile Yarn Market Revenue (US$ Mn) Comparison by Source (2016-2032)
- Figure 138: Middle East & Africa Textile Yarn Market Revenue (US$ Mn) Comparison by Type (2016-2032)
- Figure 139: Middle East & Africa Textile Yarn Market Revenue (US$ Mn) Comparison by Application (2016-2032)
- Figure 140: Middle East & Africa Textile Yarn Market Y-o-Y Growth Rate Comparison by Country (2016-2032)
- Figure 141: Middle East & Africa Textile Yarn Market Y-o-Y Growth Rate Comparison by Source (2016-2032)
- Figure 142: Middle East & Africa Textile Yarn Market Y-o-Y Growth Rate Comparison by Type (2016-2032)
- Figure 143: Middle East & Africa Textile Yarn Market Y-o-Y Growth Rate Comparison by Application (2016-2032)
- Figure 144: Middle East & Africa Textile Yarn Market Share Comparison by Country (2016-2032)
- Figure 145: Middle East & Africa Textile Yarn Market Share Comparison by Source (2016-2032)
- Figure 146: Middle East & Africa Textile Yarn Market Share Comparison by Type (2016-2032)
- Figure 147: Middle East & Africa Textile Yarn Market Share Comparison by Application (2016-2032)
- List of Tables
- Table 1: Global Textile Yarn Market Comparison by Source (2016-2032)
- Table 2: Global Textile Yarn Market Comparison by Type (2016-2032)
- Table 3: Global Textile Yarn Market Comparison by Application (2016-2032)
- Table 4: Global Textile Yarn Market Revenue (US$ Mn) Comparison by Region (2016-2032)
- Table 5: Global Textile Yarn Market Revenue (US$ Mn) (2016-2032)
- Table 6: Global Textile Yarn Market Revenue (US$ Mn) Comparison by Region (2016-2032)
- Table 7: Global Textile Yarn Market Revenue (US$ Mn) Comparison by Source (2016-2032)
- Table 8: Global Textile Yarn Market Revenue (US$ Mn) Comparison by Type (2016-2032)
- Table 9: Global Textile Yarn Market Revenue (US$ Mn) Comparison by Application (2016-2032)
- Table 10: Global Textile Yarn Market Y-o-Y Growth Rate Comparison by Region (2016-2032)
- Table 11: Global Textile Yarn Market Y-o-Y Growth Rate Comparison by Source (2016-2032)
- Table 12: Global Textile Yarn Market Y-o-Y Growth Rate Comparison by Type (2016-2032)
- Table 13: Global Textile Yarn Market Y-o-Y Growth Rate Comparison by Application (2016-2032)
- Table 14: Global Textile Yarn Market Share Comparison by Region (2016-2032)
- Table 15: Global Textile Yarn Market Share Comparison by Source (2016-2032)
- Table 16: Global Textile Yarn Market Share Comparison by Type (2016-2032)
- Table 17: Global Textile Yarn Market Share Comparison by Application (2016-2032)
- Table 18: North America Textile Yarn Market Comparison by Type (2016-2032)
- Table 19: North America Textile Yarn Market Comparison by Application (2016-2032)
- Table 20: North America Textile Yarn Market Revenue (US$ Mn) Comparison by Country (2016-2032)
- Table 21: North America Textile Yarn Market Revenue (US$ Mn) (2016-2032)
- Table 22: North America Textile Yarn Market Revenue (US$ Mn) Comparison by Country (2016-2032)
- Table 23: North America Textile Yarn Market Revenue (US$ Mn) Comparison by Source (2016-2032)
- Table 24: North America Textile Yarn Market Revenue (US$ Mn) Comparison by Type (2016-2032)
- Table 25: North America Textile Yarn Market Revenue (US$ Mn) Comparison by Application (2016-2032)
- Table 26: North America Textile Yarn Market Y-o-Y Growth Rate Comparison by Country (2016-2032)
- Table 27: North America Textile Yarn Market Y-o-Y Growth Rate Comparison by Source (2016-2032)
- Table 28: North America Textile Yarn Market Y-o-Y Growth Rate Comparison by Type (2016-2032)
- Table 29: North America Textile Yarn Market Y-o-Y Growth Rate Comparison by Application (2016-2032)
- Table 30: North America Textile Yarn Market Share Comparison by Country (2016-2032)
- Table 31: North America Textile Yarn Market Share Comparison by Source (2016-2032)
- Table 32: North America Textile Yarn Market Share Comparison by Type (2016-2032)
- Table 33: North America Textile Yarn Market Share Comparison by Application (2016-2032)
- Table 34: Western Europe Textile Yarn Market Comparison by Source (2016-2032)
- Table 35: Western Europe Textile Yarn Market Comparison by Type (2016-2032)
- Table 36: Western Europe Textile Yarn Market Comparison by Application (2016-2032)
- Table 37: Western Europe Textile Yarn Market Revenue (US$ Mn) Comparison by Country (2016-2032)
- Table 38: Western Europe Textile Yarn Market Revenue (US$ Mn) (2016-2032)
- Table 39: Western Europe Textile Yarn Market Revenue (US$ Mn) Comparison by Country (2016-2032)
- Table 40: Western Europe Textile Yarn Market Revenue (US$ Mn) Comparison by Source (2016-2032)
- Table 41: Western Europe Textile Yarn Market Revenue (US$ Mn) Comparison by Type (2016-2032)
- Table 42: Western Europe Textile Yarn Market Revenue (US$ Mn) Comparison by Application (2016-2032)
- Table 43: Western Europe Textile Yarn Market Y-o-Y Growth Rate Comparison by Country (2016-2032)
- Table 44: Western Europe Textile Yarn Market Y-o-Y Growth Rate Comparison by Source (2016-2032)
- Table 45: Western Europe Textile Yarn Market Y-o-Y Growth Rate Comparison by Type (2016-2032)
- Table 46: Western Europe Textile Yarn Market Y-o-Y Growth Rate Comparison by Application (2016-2032)
- Table 47: Western Europe Textile Yarn Market Share Comparison by Country (2016-2032)
- Table 48: Western Europe Textile Yarn Market Share Comparison by Source (2016-2032)
- Table 49: Western Europe Textile Yarn Market Share Comparison by Type (2016-2032)
- Table 50: Western Europe Textile Yarn Market Share Comparison by Application (2016-2032)
- Table 51: Eastern Europe Textile Yarn Market Comparison by Source (2016-2032)
- Table 52: Eastern Europe Textile Yarn Market Comparison by Type (2016-2032)
- Table 53: Eastern Europe Textile Yarn Market Comparison by Application (2016-2032)
- Table 54: Eastern Europe Textile Yarn Market Revenue (US$ Mn) Comparison by Country (2016-2032)
- Table 55: Eastern Europe Textile Yarn Market Revenue (US$ Mn) (2016-2032)
- Table 56: Eastern Europe Textile Yarn Market Revenue (US$ Mn) Comparison by Country (2016-2032)
- Table 57: Eastern Europe Textile Yarn Market Revenue (US$ Mn) Comparison by Source (2016-2032)
- Table 58: Eastern Europe Textile Yarn Market Revenue (US$ Mn) Comparison by Type (2016-2032)
- Table 59: Eastern Europe Textile Yarn Market Revenue (US$ Mn) Comparison by Application (2016-2032)
- Table 60: Eastern Europe Textile Yarn Market Y-o-Y Growth Rate Comparison by Country (2016-2032)
- Table 61: Eastern Europe Textile Yarn Market Y-o-Y Growth Rate Comparison by Source (2016-2032)
- Table 62: Eastern Europe Textile Yarn Market Y-o-Y Growth Rate Comparison by Type (2016-2032)
- Table 63: Eastern Europe Textile Yarn Market Y-o-Y Growth Rate Comparison by Application (2016-2032)
- Table 64: Eastern Europe Textile Yarn Market Share Comparison by Country (2016-2032)
- Table 65: Eastern Europe Textile Yarn Market Share Comparison by Source (2016-2032)
- Table 66: Eastern Europe Textile Yarn Market Share Comparison by Type (2016-2032)
- Table 67: Eastern Europe Textile Yarn Market Share Comparison by Application (2016-2032)
- Table 68: APAC Textile Yarn Market Comparison by Source (2016-2032)
- Table 69: APAC Textile Yarn Market Comparison by Type (2016-2032)
- Table 70: APAC Textile Yarn Market Comparison by Application (2016-2032)
- Table 71: APAC Textile Yarn Market Revenue (US$ Mn) Comparison by Country (2016-2032)
- Table 72: APAC Textile Yarn Market Revenue (US$ Mn) (2016-2032)
- Table 73: APAC Textile Yarn Market Revenue (US$ Mn) Comparison by Country (2016-2032)
- Table 74: APAC Textile Yarn Market Revenue (US$ Mn) Comparison by Source (2016-2032)
- Table 75: APAC Textile Yarn Market Revenue (US$ Mn) Comparison by Type (2016-2032)
- Table 76: APAC Textile Yarn Market Revenue (US$ Mn) Comparison by Application (2016-2032)
- Table 77: APAC Textile Yarn Market Y-o-Y Growth Rate Comparison by Country (2016-2032)
- Table 78: APAC Textile Yarn Market Y-o-Y Growth Rate Comparison by Source (2016-2032)
- Table 79: APAC Textile Yarn Market Y-o-Y Growth Rate Comparison by Type (2016-2032)
- Table 80: APAC Textile Yarn Market Y-o-Y Growth Rate Comparison by Application (2016-2032)
- Table 81: APAC Textile Yarn Market Share Comparison by Country (2016-2032)
- Table 82: APAC Textile Yarn Market Share Comparison by Source (2016-2032)
- Table 83: APAC Textile Yarn Market Share Comparison by Type (2016-2032)
- Table 84: APAC Textile Yarn Market Share Comparison by Application (2016-2032)
- Table 85: Latin America Textile Yarn Market Comparison by Source (2016-2032)
- Table 86: Latin America Textile Yarn Market Comparison by Type (2016-2032)
- Table 87: Latin America Textile Yarn Market Comparison by Application (2016-2032)
- Table 88: Latin America Textile Yarn Market Revenue (US$ Mn) Comparison by Country (2016-2032)
- Table 89: Latin America Textile Yarn Market Revenue (US$ Mn) (2016-2032)
- Table 90: Latin America Textile Yarn Market Revenue (US$ Mn) Comparison by Country (2016-2032)
- Table 91: Latin America Textile Yarn Market Revenue (US$ Mn) Comparison by Source (2016-2032)
- Table 92: Latin America Textile Yarn Market Revenue (US$ Mn) Comparison by Type (2016-2032)
- Table 93: Latin America Textile Yarn Market Revenue (US$ Mn) Comparison by Application (2016-2032)
- Table 94: Latin America Textile Yarn Market Y-o-Y Growth Rate Comparison by Country (2016-2032)
- Table 95: Latin America Textile Yarn Market Y-o-Y Growth Rate Comparison by Source (2016-2032)
- Table 96: Latin America Textile Yarn Market Y-o-Y Growth Rate Comparison by Type (2016-2032)
- Table 97: Latin America Textile Yarn Market Y-o-Y Growth Rate Comparison by Application (2016-2032)
- Table 98: Latin America Textile Yarn Market Share Comparison by Country (2016-2032)
- Table 99: Latin America Textile Yarn Market Share Comparison by Source (2016-2032)
- Table 100: Latin America Textile Yarn Market Share Comparison by Type (2016-2032)
- Table 101: Latin America Textile Yarn Market Share Comparison by Application (2016-2032)
- Table 102: Middle East & Africa Textile Yarn Market Comparison by Source (2016-2032)
- Table 103: Middle East & Africa Textile Yarn Market Comparison by Type (2016-2032)
- Table 104: Middle East & Africa Textile Yarn Market Comparison by Application (2016-2032)
- Table 105: Middle East & Africa Textile Yarn Market Revenue (US$ Mn) Comparison by Country (2016-2032)
- Table 106: Middle East & Africa Textile Yarn Market Revenue (US$ Mn) (2016-2032)
- Table 107: Middle East & Africa Textile Yarn Market Revenue (US$ Mn) Comparison by Country (2016-2032)
- Table 108: Middle East & Africa Textile Yarn Market Revenue (US$ Mn) Comparison by Source (2016-2032)
- Table 109: Middle East & Africa Textile Yarn Market Revenue (US$ Mn) Comparison by Type (2016-2032)
- Table 110: Middle East & Africa Textile Yarn Market Revenue (US$ Mn) Comparison by Application (2016-2032)
- Table 111: Middle East & Africa Textile Yarn Market Y-o-Y Growth Rate Comparison by Country (2016-2032)
- Table 112: Middle East & Africa Textile Yarn Market Y-o-Y Growth Rate Comparison by Source (2016-2032)
- Table 113: Middle East & Africa Textile Yarn Market Y-o-Y Growth Rate Comparison by Type (2016-2032)
- Table 114: Middle East & Africa Textile Yarn Market Y-o-Y Growth Rate Comparison by Application (2016-2032)
- Table 115: Middle East & Africa Textile Yarn Market Share Comparison by Country (2016-2032)
- Table 116: Middle East & Africa Textile Yarn Market Share Comparison by Source (2016-2032)
- Table 117: Middle East & Africa Textile Yarn Market Share Comparison by Type (2016-2032)
- Table 118: Middle East & Africa Textile Yarn Market Share Comparison by Application (2016-2032)
- 1. Executive Summary
-
- Vardhman Textiles Ltd.
- Grasim Industries Limited
- Raymond Ltd.
- Weiqiao Textile Company Limited
- Huvis Corporation
- Parkdale Mills Incorporated
- Hengli Group
- Indorama Ventures Public Company Limited
- Jaya Shree Textiles
- Kairuide Holding Co., Ltd.
- Shandong Demian Incorporated Company
- Alok Industries Ltd.
- Arvind Limited
- RSWM Ltd.
- PT. Indo-Rama Synthetics Tbk
Our Clients


View Our Licence Options
