
Televisions Market By Product Type (LCD TVs, LED TVs, OLED TVs, QLED TVs, Plasma TVs), By Screen Size (Below 32 inches, 32-45 inches, 46-55 inches, 56-65 inches, Above 65 inches), By Resolution (HD, Full HD, 4K Ultra HD, 8K Ultra HD), By Distribution Channel (Online and Offline), By Region And Companies - Industry Segment Outlook, Market Assessment, Competition Scenario, Trends, And Forecast 2024-2033
-
49493
-
July 2024
-
300
-


-
This report was compiled by Vishwa Gaul Vishwa is an experienced market research and consulting professional with over 8 years of expertise in the ICT industry, contributing to over 700 reports across telecommunications, software, hardware, and digital solutions. Correspondence Team Lead- ICT Linkedin | Detailed Market research Methodology Our methodology involves a mix of primary research, including interviews with leading mental health experts, and secondary research from reputable medical journals and databases. View Detailed Methodology Page
-
Quick Navigation
Report Overview
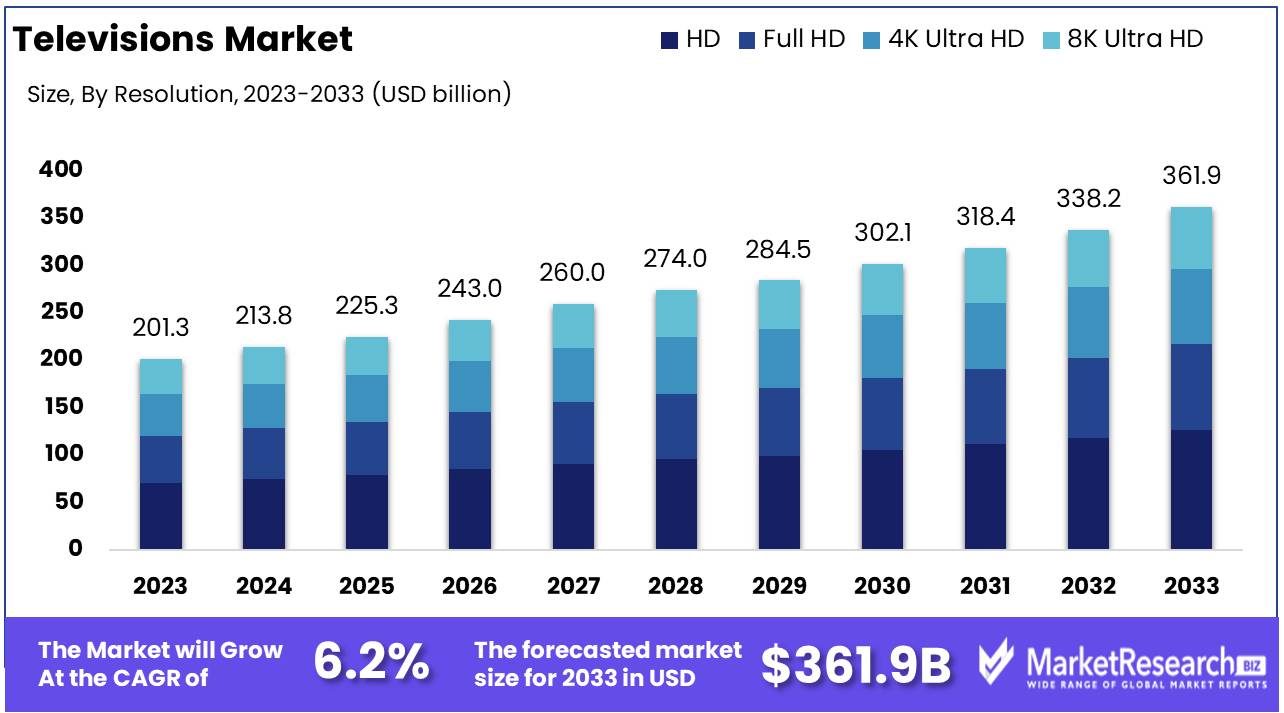
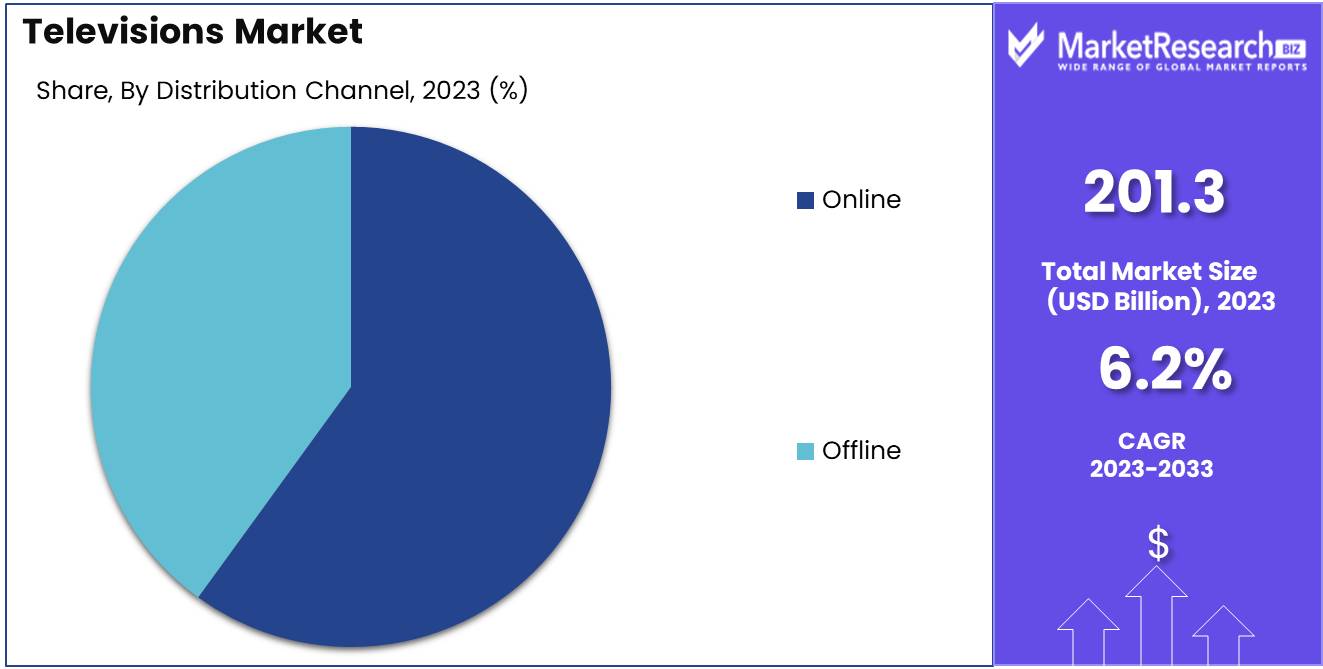
The television market was valued at USD 201.3 billion in 2023. It is expected to reach USD 361.9 billion by 2033, with a CAGR of 6.2% during the forecast period from 2024 to 2033.
The television market encompasses the global industry involved in the manufacturing, distributing, and selling of television sets, ranging from traditional CRT models to advanced smart TVs and OLED displays. This market is characterized by rapid technological advancements, shifting consumer preferences towards larger screens and higher resolutions, and the integration of smart features such as internet connectivity and streaming capabilities.
The television market is poised for substantial growth, driven by several key factors. Technological advancements are at the forefront, with innovations such as OLED and QLED screens, 8K resolution, and smart TV functionalities enhancing user experiences and driving consumer demand. These advancements are not limited to display quality but extend to integrated AI and IoT features, allowing seamless connectivity with other smart home devices. Additionally, the increasing disposable income across various demographics, particularly in emerging economies, is leading to higher spending on premium home entertainment systems. This trend is supported by a growing middle class that prioritizes quality and technological sophistication in their purchasing decisions.
However, the market is characterized by intense competition among major players like Samsung, LG, Sony, and emerging brands from China. This competition has led to rapid innovation cycles and price wars, benefiting consumers but squeezing profit margins for manufacturers. High manufacturing costs, particularly for cutting-edge technologies, further challenge profitability. Companies must navigate these costs while maintaining competitive pricing, making operational efficiency and scale crucial.
In conclusion, the television market presents a dynamic landscape where technological innovation and rising consumer affluence drive growth, yet high competition and manufacturing costs pose significant challenges. Market leaders must balance innovation with cost management to sustain profitability. The market's future will likely be shaped by continued advancements in display and smart technologies, consumer demand for premium products, and strategic maneuvers by key players to maintain their market positions amidst intensifying competition. Firms that successfully manage these factors will be well-positioned to capitalize on the expanding market opportunities.
Key Takeaways
- Market Growth: The television market was valued at USD 201.3 billion in 2023. It is expected to reach USD 361.9 billion by 2033, with a CAGR of 6.2% during the forecast period from 2024 to 2033.
- By Product Type: LCD TVs dominated the diverse and evolving television market.
- By Screen Size: "Below 32 inches" dominated the diverse screen size segments.
- By Resolution: HD dominated the Television Market's resolution segment.
- By Distribution Channel: The Online channel dominated the television market distribution.
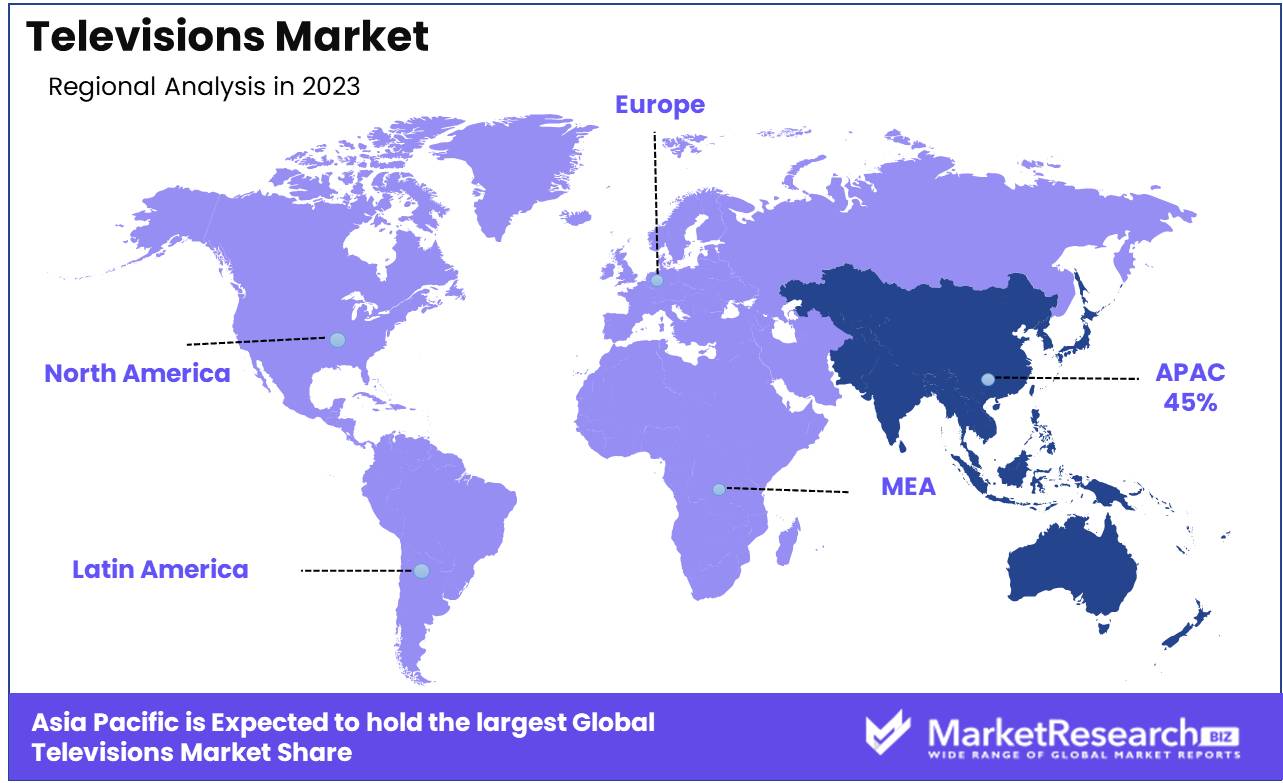
- Regional Dominance: Asia Pacific dominates the global TV market with a 45% largest share.
- Growth Opportunity: The global television market presents promising growth opportunities, particularly within the expanding 4K UHD TV segment and the increasing adoption of larger screen sizes.
Driving factors
Increasing Demand for Smart TVs
The growth of the television market is significantly driven by the increasing demand for smart TVs. Consumers are increasingly opting for smart TVs due to their enhanced functionality, including internet connectivity, streaming capabilities, and access to a variety of apps and services. According to recent market research, smart TVs accounted for over 70% of the total television sales in 2023, illustrating a clear shift in consumer preference. This demand is further bolstered by the growing trend of smart homes, where consumers seek integrated systems that provide convenience and advanced features. As more households embrace smart technology, the smart TV market is expected to continue its robust growth trajectory, contributing significantly to the overall expansion of the television market.
Technological Advancements
Technological advancements play a pivotal role in the expansion of the television market. Innovations such as OLED and QLED displays, 4K and 8K resolutions, and high dynamic range (HDR) imaging have substantially enhanced the viewing experience. These advancements not only improve picture quality but also increase the lifespan and energy efficiency of televisions. The introduction of AI and voice-controlled functionalities has also made televisions more user-friendly and interactive. For instance, the integration of AI in televisions allows for features such as personalized content recommendations and improved voice recognition capabilities. Such technological progress has driven consumers to upgrade their existing television sets, leading to increased sales and market growth.
Rise of Streaming Services
The rise of streaming services is another critical factor propelling the growth of the television market. The proliferation of platforms such as Netflix, Amazon Prime, Disney+, and others has transformed viewing habits, shifting from traditional cable TV to on-demand content. This shift has increased the demand for smart TVs that can easily access and stream these services.
In 2023, it was reported that over 80% of households in developed regions subscribed to at least one streaming service, highlighting the vast market potential for televisions capable of supporting these platforms. The continuous expansion and investment in exclusive content by streaming service providers further drive the need for advanced televisions, thus contributing to the market's growth.
Restraining Factors
Economic Barriers: Price Sensitivity Curbs Market Expansion
Price sensitivity is a significant barrier to the growth of the television market, particularly in economically diverse regions. Budget constraints often limit consumer choices to less expensive models, which may not offer the latest technologies such as OLED or 4K resolution. This price sensitivity not only affects consumer purchasing behavior but also impacts the overall revenue potential for premium models. For instance, a consumer survey might reveal that a significant percentage of potential buyers opt for models priced under $300, thereby skewing market demand towards lower-end television units. The influence of economic downturns or inflationary pressures can exacerbate this trend, as discretionary spending power diminishes.
Connectivity Constraints: Infrastructure Deficits Stunt Market Reach
In many rural areas, the lack of advanced infrastructure poses a critical challenge to the television market. These regions often suffer from inadequate electricity supplies, unreliable internet connections, and underdeveloped retail channels, which are essential for the adoption of modern, smart TVs that require internet connectivity for full functionality. The absence of these facilities can severely limit the market penetration of newer television technologies, confining the sales potential to urban and suburban settings where infrastructure is more developed. Statistics might show a stark contrast in market penetration rates, with urban areas having significantly higher adoption rates compared to rural regions, which lag due to these infrastructural deficits.
By Product Type Analysis
In 2023, LCD TVs dominated the diverse and evolving television market.
In 2023, LCD TVs held a dominant market position in the By Product Type segment of the television market. This dominance can be attributed to their widespread availability, cost-effectiveness, and continuous technological improvements. LCD TVs are known for their energy efficiency and slim design, making them a popular choice among consumers.
Following LCD TVs, LED TVs captured a significant market share due to their enhanced picture quality and lower power consumption. The market for LED TVs has benefited from the increasing consumer preference for high-definition content and smart TV features.
OLED TVs, though more expensive, have gained traction among high-end consumers seeking superior picture quality with deeper blacks and better color contrast. The growth in this segment is driven by advancements in OLED technology and a growing awareness of its benefits.
QLED TVs, which utilize quantum dot technology to improve brightness and color accuracy, have also seen a rise in popularity. This segment is expected to grow as manufacturers continue to market QLED TVs as a premium alternative to OLED TVs.
Plasma TVs, on the other hand, have seen a significant decline in market share due to their higher energy consumption and bulkier design compared to LCD and LED TVs. As a result, many manufacturers have discontinued production, leading to a reduced presence in the market.
By Screen Size Analysis
In 2023, "Below 32 inches" dominated the diverse screen size segments.
In 2023, the "Below 32 inches" category held a dominant market position in the "By Screen Size" segment of the television market. This segment is particularly favored for its affordability, space efficiency, and suitability for smaller rooms and secondary viewing areas such as kitchens and bedrooms. Consumers with limited budgets or space constraints often opt for televisions in this size range, driving substantial demand.
The "32-45 inches" segment also showcased significant market presence due to its balance of size, cost, and versatility, making it a popular choice for both primary and secondary viewing environments.
The "46-55 inches" segment emerged as a strong contender, appealing to consumers seeking larger screens without the space requirements or higher costs associated with even larger models. This segment benefited from the increasing popularity of streaming services and high-definition content, which enhanced the viewing experience on mid-sized screens.
The "56-65 inches" segment experienced notable growth, driven by consumers' desire for a more immersive home entertainment experience. This segment is particularly popular among home theater enthusiasts and those seeking to replicate the cinema experience at home.
Lastly, the "Above 65 inches" segment, while occupying a smaller market share, catered to a niche market of premium buyers seeking the ultimate viewing experience. These large-screen televisions are typically equipped with advanced features such as 4K or 8K resolution, HDR, and smart capabilities, appealing to consumers willing to invest in cutting-edge technology.
By Resolution Analysis
In 2023, HD dominated the Television Market's resolution segment.
In 2023, HD held a dominant market position in the By Resolution segment of the television market. The HD segment, known for its affordability and sufficient resolution for general viewing, maintained a significant share, appealing to budget-conscious consumers and those in regions with slower internet speeds where high-resolution content is less accessible. Despite the growing popularity of higher resolutions, HD televisions are favored for their cost-effectiveness and compatibility with various broadcasting standards.
The Full HD segment also saw considerable market penetration, driven by a balance of enhanced picture quality and reasonable pricing. Full HD televisions are widely used for streaming services, gaming, and other media consumption, offering a step up in clarity without the higher costs associated with ultra-high-definition models.
The 4K Ultra HD segment experienced substantial growth, supported by increasing consumer demand for superior picture quality, greater content availability, and declining prices of 4K panels. The segment attracts tech-savvy consumers and households seeking an immersive viewing experience, particularly for large screen sizes where the benefits of 4K resolution are more apparent.
Meanwhile, the 8K Ultra HD segment, though still nascent, exhibited significant potential. With advancements in technology and gradual content adoption, 8K televisions are positioned as premium products targeting early adopters and luxury markets. The segment's growth is anticipated to accelerate as prices decrease and more 8K content becomes available.
By Distribution Channel Analysis
In 2023, The Online channel dominated the television market distribution.
In 2023, The Online channel held a dominant market position in the By Distribution Channel segment of the television market. This dominance can be attributed to several key factors, including the increasing preference for online shopping among consumers, the convenience of home delivery, and the availability of a wide range of television models and brands online. Additionally, online platforms offer competitive pricing and frequent discounts, further driving consumer interest and purchases. The ease of comparing products and reading customer reviews online also plays a significant role in influencing purchasing decisions.
In contrast, the Offline channel, while still significant, has seen a relative decline due to the convenience and advantages offered by online shopping. Retail stores continue to attract customers who prefer physical product interactions before purchase, but the shift towards online channels is evident and growing. As a result, the Online distribution channel is expected to continue its dominance in the television market in the coming years.
Key Market Segments
By Product Type
- LCD TVs
- LED TVs
- OLED TVs
- QLED TVs
- Plasma TVs
By Screen Size
- Below 32 inches
- 32-45 inches
- 46-55 inches
- 56-65 inches
- Above 65 inches
By Resolution
- HD
- Full HD
- 4K Ultra HD
- 8K Ultra HD
By Distribution Channel
- Online
- Offline
Growth Opportunity
Expanding 4K UHD TV Segment
The global television market is poised for substantial growth, driven primarily by the expanding 4K Ultra High Definition (UHD) TV segment. The 4K UHD technology, offering superior picture quality with four times the resolution of traditional HD, is increasingly becoming the standard choice for consumers. According to recent market data, the 4K UHD TV segment is expected to witness a compound annual growth rate (CAGR) of 12.5% from 2023 to 2028. This growth is fueled by the rising availability of 4K content across streaming platforms, gaming consoles, and broadcast channels, enhancing the viewing experience and driving consumer demand. The affordability of 4K UHD TVs, due to advancements in manufacturing technology, has also made this segment more accessible to a broader audience, further contributing to market expansion.
Increasing Adoption of Larger Screen Sizes
Another significant opportunity in the television market lies in the increasing adoption of larger screen sizes. Consumers are increasingly preferring televisions with screen sizes of 55 inches and above, which offer a more immersive viewing experience. Market trends indicate that sales of large-screen TVs are expected to grow by 15% year-over-year. This shift is driven by various factors, including the growing popularity of home entertainment systems and the enhanced visual experience provided by larger displays.
Additionally, advancements in display technologies, such as OLED and QLED, have made larger screens more attractive by offering superior color accuracy and contrast. The rise in disposable income and the trend towards home-based leisure activities also play a crucial role in the increasing adoption of larger screen sizes.
Latest Trends
Increasing Importance of Smart Features
The Television market is expected to see a significant shift towards smart features. Consumers are increasingly valuing the integration of smart functionalities, such as voice assistants, internet connectivity, and compatibility with smart home ecosystems. This trend is driven by the growing demand for seamless and intuitive user experiences, enabling users to access streaming services, browse the internet, and control other smart devices directly from their TVs. Manufacturers are responding by enhancing the capabilities of smart TVs, incorporating advanced operating systems, and partnering with tech giants to offer a more comprehensive suite of applications and services. This evolution in smart features is set to become a key differentiator in the competitive landscape of the television market.
Competitive Prices and Good Selection Drive Purchases
Price competitiveness and product variety are anticipated to play a crucial role in influencing consumer purchasing decisions in the television market. The market is witnessing increased price competition among leading brands, which is resulting in more affordable options for consumers without compromising on quality and features. This trend is particularly evident in the mid-range segment, where buyers are finding a balance between cost and advanced features.
Additionally, the availability of a diverse selection of models, catering to various preferences in screen size, resolution, and technology (such as OLED, QLED, and 4K/8K), is further driving market growth. Retailers and manufacturers are also leveraging promotional strategies and financing options to attract price-sensitive customers, ensuring a wider consumer base can access the latest television innovations.
Regional Analysis
Asia Pacific dominates the global TV market with a 45% largest share.
The global television market exhibits significant regional disparities, with each region contributing uniquely to market dynamics. In North America, the market is driven by high consumer disposable income and a strong preference for advanced technology. The adoption of 4K and OLED TVs is particularly robust, with the region accounting for a notable share of high-end television sales. Europe showcases a similar trend, with a focus on smart TV adoption and increasing demand for larger screen sizes. The region benefits from technological advancements and high penetration rates, contributing to steady market growth.
The Asia Pacific region stands out as the dominant market, representing approximately 45% of the largest market share. This dominance is fueled by rapid urbanization, increasing disposable income, and the proliferation of affordable smart TVs. Countries such as China, India, and Japan are key contributors, with substantial growth in both production and consumption of televisions. In the Middle East & Africa, market growth is supported by rising urbanization and increasing demand for smart and connected TVs, though the market size remains smaller compared to other regions.
Latin America shows moderate growth, driven by economic improvements and increasing accessibility to advanced television technologies. Overall, the Asia Pacific region's leadership is underscored by its significant market share and dynamic growth trajectory.
Key Regions and Countries
North America
- The US
- Canada
- Rest of North America
Europe
- Germany
- France
- The UK
- Spain
- Netherlands
- Russia
- Italy
- Rest of Europe
Asia-Pacific
- China
- Japan
- Singapore
- Thailand
- South Korea
- Vietnam
- India
- New Zealand
- Rest of Asia Pacific
Latin America
- Mexico
- Brazil
- Rest of Latin America
Middle East & Africa
- Saudi Arabia
- South Africa
- UAE
- Rest of the Middle East & Africa
Key Players Analysis
The global television market is poised for continued growth, driven by advancements in technology, rising consumer demand for high-quality visual experiences, and increased adoption of smart home ecosystems. Key players such as Samsung Electronics Co. Ltd., LG Electronics Inc., and Sony Corporation are at the forefront of this evolution, leveraging their innovative capabilities and extensive R&D investments to introduce cutting-edge products. Samsung maintains its leadership position with its QLED and Neo QLED series, which offer superior picture quality and enhanced user interfaces.
LG Corporation continues to capture significant market share through its OLED technology, renowned for its vibrant color accuracy and deep blacks, appealing to premium segment consumers. Sony Corporation emphasizes its prowess in image processing and sound technology, integrating AI to enhance user experiences.
Emerging competitors like TCL Corporation and Hisense International Co., Ltd. are rapidly gaining ground with their cost-effective yet feature-rich offerings, catering to budget-conscious consumers without compromising on quality. Panasonic Holdings Holdings Corporation and Sharp Corporation, though facing stiff competition, remain relevant through niche markets and strategic alliances.
Vizio Inc. and Skyworth Digital Holdings Ltd. are strengthening their presence in the North American market, capitalizing on their strong value propositions. Philips (TPV Technology Limited) and Haier Smart Home Co., Ltd continue to innovate with Ambilight technology, appealing to a unique segment of the market. Overall, the competitive landscape of the television market is marked by innovation, strategic differentiation, and an unwavering focus on consumer preferences.
Market Key Players
- Samsung Electronics Co. Ltd.
- LG Corporation
- Sony Corporation
- TCL Corporation
- Panasonic Holdings Corporation
- Hisense International Co., Ltd.
- Sharp Corporation
- Vizio Inc.
- Skyworth Digital Holdings Ltd.
- Philips (TPV Technology Limited)
- Haier Smart Home Co., Ltd
Recent Development
- In January 2024, At the Consumer Electronics Show (CES) 2024, LG introduced a groundbreaking series of wireless OLED TVs, eliminating the need for traditional cable connections. This development enhances the aesthetic appeal and installation flexibility of home entertainment systems, appealing to design-conscious consumers and tech enthusiasts.
- In September 2023, TCL introduced a new series of Mini-LED 4K TVs, featuring thousands of individual LED backlights for improved contrast and brightness control. This launch underscores TCL's commitment to advancing TV technology and making high-quality viewing experiences more accessible to a broader range of consumers.
- In April 2023, Sony launched its updated Bravia XR TV line, powered by the Cognitive Processor XR. This processor mimics the way humans perceive and hear, resulting in more immersive and realistic viewing experiences. The enhanced cognitive intelligence capabilities set a new standard for smart TVs in delivering superior picture and sound quality.
Report Scope
Report Features Description Market Value (2023) USD 201.3 Billion Forecast Revenue (2033) USD 361.9 Billion CAGR (2024-2032) 6.2% Base Year for Estimation 2023 Historic Period 2016-2023 Forecast Period 2024-2033 Report Coverage Revenue Forecast, Market Dynamics, COVID-19 Impact, Competitive Landscape, Recent Developments Segments Covered By Product Type (LCD TVs, LED TVs, OLED TVs, QLED TVs, Plasma TVs), By Screen Size (Below 32 inches, 32-45 inches, 46-55 inches, 56-65 inches, Above 65 inches), By Resolution (HD, Full HD, 4K Ultra HD, 8K Ultra HD), By Distribution Channel (Online and Offline) Regional Analysis North America - The US, Canada, Rest of North America, Europe - Germany, France, The UK, Spain, Italy, Russia, Netherlands, Rest of Europe, Asia-Pacific - China, Japan, South Korea, India, New Zealand, Singapore, Thailand, Vietnam, Rest of Asia Pacific, Latin America - Brazil, Mexico, Rest of Latin America, Middle East & Africa - South Africa, Saudi Arabia, UAE, Rest of Middle East & Africa Competitive Landscape Samsung Electronics Co. Ltd., LG Corporation, Sony Corporation, TCL Corporation, Panasonic Holdings Corporation, Hisense International Co., Ltd., Sharp Corporation, Vizio Inc., Skyworth Digital Holdings Ltd., Philips (TPV Technology Limited), Haier Smart Home Co., Ltd Customization Scope Customization for segments at the regional/country level will be provided. Moreover, additional customization can be done based on the requirements. Purchase Options We have three licenses to opt for Single User License, Multi-User License (Up to 5 Users), Corporate Use License (Unlimited User and Printable PDF) -
- 1. Executive Summary
- 1.1. Definition
- 1.2. Taxonomy
- 1.3. Research Scope
- 1.4. Key Analysis
- 1.5. Key Findings by Major Segments
- 1.6. Top strategies by Major Players
- 2. Global Televisions Market Overview
- 2.1. Televisions Market Dynamics
- 2.1.1. Drivers
- 2.1.2. Opportunities
- 2.1.3. Restraints
- 2.1.4. Challenges
- 2.2. Macro-economic Factors
- 2.3. Regulatory Framework
- 2.4. Market Investment Feasibility Index
- 2.5. PEST Analysis
- 2.6. PORTER’S Five Force Analysis
- 2.7. Drivers & Restraints Impact Analysis
- 2.8. Industry Chain Analysis
- 2.9. Cost Structure Analysis
- 2.10. Marketing Strategy
- 2.11. Russia-Ukraine War Impact Analysis
- 2.12. Opportunity Map Analysis
- 2.13. Market Competition Scenario Analysis
- 2.14. Product Life Cycle Analysis
- 2.15. Opportunity Orbits
- 2.16. Manufacturer Intensity Map
- 2.17. Major Companies sales by Value & Volume
- 2.1. Televisions Market Dynamics
- 3. Global Televisions Market Analysis, Opportunity and Forecast, 2016-2032
- 3.1. Global Televisions Market Analysis, 2016-2021
- 3.2. Global Televisions Market Opportunity and Forecast, 2023-2032
- 3.3. Global Televisions Market Analysis, Opportunity and Forecast, By Product Type, 2016-2032
- 3.3.1. Global Televisions Market Analysis by Product Type: Introduction
- 3.3.2. Market Size Absolute $ Opportunity Analysis and Forecast, By Product Type, 2016-2032
- 3.3.3. LCD TVs
- 3.3.4. LED TVs
- 3.3.5. OLED TVs
- 3.3.6. QLED TVs
- 3.3.7. Plasma TVs
- 3.4. Global Televisions Market Analysis, Opportunity and Forecast, By Screen Size, 2016-2032
- 3.4.1. Global Televisions Market Analysis by Screen Size: Introduction
- 3.4.2. Market Size Absolute $ Opportunity Analysis and Forecast, By Screen Size, 2016-2032
- 3.4.3. Below 32 inches
- 3.4.4. 32-45 inches
- 3.4.5. 46-55 inches
- 3.4.6. 56-65 inches
- 3.4.7. Above 65 inches
- 3.5. Global Televisions Market Analysis, Opportunity and Forecast, By Resolution, 2016-2032
- 3.5.1. Global Televisions Market Analysis by Resolution: Introduction
- 3.5.2. Market Size Absolute $ Opportunity Analysis and Forecast, By Resolution, 2016-2032
- 3.5.3. HD
- 3.5.4. Full HD
- 3.5.5. 4K Ultra HD
- 3.5.6. 8K Ultra HD
- 3.6. Global Televisions Market Analysis, Opportunity and Forecast, By Distribution Channel, 2016-2032
- 3.6.1. Global Televisions Market Analysis by Distribution Channel: Introduction
- 3.6.2. Market Size Absolute $ Opportunity Analysis and Forecast, By Distribution Channel, 2016-2032
- 3.6.3. Online
- 3.6.4. Offline
- 4. North America Televisions Market Analysis, Opportunity and Forecast, 2016-2032
- 4.1. North America Televisions Market Analysis, 2016-2021
- 4.2. North America Televisions Market Opportunity and Forecast, 2023-2032
- 4.3. North America Televisions Market Analysis, Opportunity and Forecast, By Product Type, 2016-2032
- 4.3.1. North America Televisions Market Analysis by Product Type: Introduction
- 4.3.2. Market Size Absolute $ Opportunity Analysis and Forecast, By Product Type, 2016-2032
- 4.3.3. LCD TVs
- 4.3.4. LED TVs
- 4.3.5. OLED TVs
- 4.3.6. QLED TVs
- 4.3.7. Plasma TVs
- 4.4. North America Televisions Market Analysis, Opportunity and Forecast, By Screen Size, 2016-2032
- 4.4.1. North America Televisions Market Analysis by Screen Size: Introduction
- 4.4.2. Market Size Absolute $ Opportunity Analysis and Forecast, By Screen Size, 2016-2032
- 4.4.3. Below 32 inches
- 4.4.4. 32-45 inches
- 4.4.5. 46-55 inches
- 4.4.6. 56-65 inches
- 4.4.7. Above 65 inches
- 4.5. North America Televisions Market Analysis, Opportunity and Forecast, By Resolution, 2016-2032
- 4.5.1. North America Televisions Market Analysis by Resolution: Introduction
- 4.5.2. Market Size Absolute $ Opportunity Analysis and Forecast, By Resolution, 2016-2032
- 4.5.3. HD
- 4.5.4. Full HD
- 4.5.5. 4K Ultra HD
- 4.5.6. 8K Ultra HD
- 4.6. North America Televisions Market Analysis, Opportunity and Forecast, By Distribution Channel, 2016-2032
- 4.6.1. North America Televisions Market Analysis by Distribution Channel: Introduction
- 4.6.2. Market Size Absolute $ Opportunity Analysis and Forecast, By Distribution Channel, 2016-2032
- 4.6.3. Online
- 4.6.4. Offline
- 4.7. North America Televisions Market Analysis, Opportunity and Forecast, By Country , 2016-2032
- 4.7.1. North America Televisions Market Analysis by Country : Introduction
- 4.7.2. Market Size Absolute $ Opportunity Analysis and Forecast, Country , 2016-2032
- 4.7.2.1. The US
- 4.7.2.2. Canada
- 4.7.2.3. Mexico
- 5. Western Europe Televisions Market Analysis, Opportunity and Forecast, 2016-2032
- 5.1. Western Europe Televisions Market Analysis, 2016-2021
- 5.2. Western Europe Televisions Market Opportunity and Forecast, 2023-2032
- 5.3. Western Europe Televisions Market Analysis, Opportunity and Forecast, By Product Type, 2016-2032
- 5.3.1. Western Europe Televisions Market Analysis by Product Type: Introduction
- 5.3.2. Market Size Absolute $ Opportunity Analysis and Forecast, By Product Type, 2016-2032
- 5.3.3. LCD TVs
- 5.3.4. LED TVs
- 5.3.5. OLED TVs
- 5.3.6. QLED TVs
- 5.3.7. Plasma TVs
- 5.4. Western Europe Televisions Market Analysis, Opportunity and Forecast, By Screen Size, 2016-2032
- 5.4.1. Western Europe Televisions Market Analysis by Screen Size: Introduction
- 5.4.2. Market Size Absolute $ Opportunity Analysis and Forecast, By Screen Size, 2016-2032
- 5.4.3. Below 32 inches
- 5.4.4. 32-45 inches
- 5.4.5. 46-55 inches
- 5.4.6. 56-65 inches
- 5.4.7. Above 65 inches
- 5.5. Western Europe Televisions Market Analysis, Opportunity and Forecast, By Resolution, 2016-2032
- 5.5.1. Western Europe Televisions Market Analysis by Resolution: Introduction
- 5.5.2. Market Size Absolute $ Opportunity Analysis and Forecast, By Resolution, 2016-2032
- 5.5.3. HD
- 5.5.4. Full HD
- 5.5.5. 4K Ultra HD
- 5.5.6. 8K Ultra HD
- 5.6. Western Europe Televisions Market Analysis, Opportunity and Forecast, By Distribution Channel, 2016-2032
- 5.6.1. Western Europe Televisions Market Analysis by Distribution Channel: Introduction
- 5.6.2. Market Size Absolute $ Opportunity Analysis and Forecast, By Distribution Channel, 2016-2032
- 5.6.3. Online
- 5.6.4. Offline
- 5.7. Western Europe Televisions Market Analysis, Opportunity and Forecast, By Country , 2016-2032
- 5.7.1. Western Europe Televisions Market Analysis by Country : Introduction
- 5.7.2. Market Size Absolute $ Opportunity Analysis and Forecast, Country , 2016-2032
- 5.7.2.1. Germany
- 5.7.2.2. France
- 5.7.2.3. The UK
- 5.7.2.4. Spain
- 5.7.2.5. Italy
- 5.7.2.6. Portugal
- 5.7.2.7. Ireland
- 5.7.2.8. Austria
- 5.7.2.9. Switzerland
- 5.7.2.10. Benelux
- 5.7.2.11. Nordic
- 5.7.2.12. Rest of Western Europe
- 6. Eastern Europe Televisions Market Analysis, Opportunity and Forecast, 2016-2032
- 6.1. Eastern Europe Televisions Market Analysis, 2016-2021
- 6.2. Eastern Europe Televisions Market Opportunity and Forecast, 2023-2032
- 6.3. Eastern Europe Televisions Market Analysis, Opportunity and Forecast, By Product Type, 2016-2032
- 6.3.1. Eastern Europe Televisions Market Analysis by Product Type: Introduction
- 6.3.2. Market Size Absolute $ Opportunity Analysis and Forecast, By Product Type, 2016-2032
- 6.3.3. LCD TVs
- 6.3.4. LED TVs
- 6.3.5. OLED TVs
- 6.3.6. QLED TVs
- 6.3.7. Plasma TVs
- 6.4. Eastern Europe Televisions Market Analysis, Opportunity and Forecast, By Screen Size, 2016-2032
- 6.4.1. Eastern Europe Televisions Market Analysis by Screen Size: Introduction
- 6.4.2. Market Size Absolute $ Opportunity Analysis and Forecast, By Screen Size, 2016-2032
- 6.4.3. Below 32 inches
- 6.4.4. 32-45 inches
- 6.4.5. 46-55 inches
- 6.4.6. 56-65 inches
- 6.4.7. Above 65 inches
- 6.5. Eastern Europe Televisions Market Analysis, Opportunity and Forecast, By Resolution, 2016-2032
- 6.5.1. Eastern Europe Televisions Market Analysis by Resolution: Introduction
- 6.5.2. Market Size Absolute $ Opportunity Analysis and Forecast, By Resolution, 2016-2032
- 6.5.3. HD
- 6.5.4. Full HD
- 6.5.5. 4K Ultra HD
- 6.5.6. 8K Ultra HD
- 6.6. Eastern Europe Televisions Market Analysis, Opportunity and Forecast, By Distribution Channel, 2016-2032
- 6.6.1. Eastern Europe Televisions Market Analysis by Distribution Channel: Introduction
- 6.6.2. Market Size Absolute $ Opportunity Analysis and Forecast, By Distribution Channel, 2016-2032
- 6.6.3. Online
- 6.6.4. Offline
- 6.7. Eastern Europe Televisions Market Analysis, Opportunity and Forecast, By Country , 2016-2032
- 6.7.1. Eastern Europe Televisions Market Analysis by Country : Introduction
- 6.7.2. Market Size Absolute $ Opportunity Analysis and Forecast, Country , 2016-2032
- 6.7.2.1. Russia
- 6.7.2.2. Poland
- 6.7.2.3. The Czech Republic
- 6.7.2.4. Greece
- 6.7.2.5. Rest of Eastern Europe
- 7. APAC Televisions Market Analysis, Opportunity and Forecast, 2016-2032
- 7.1. APAC Televisions Market Analysis, 2016-2021
- 7.2. APAC Televisions Market Opportunity and Forecast, 2023-2032
- 7.3. APAC Televisions Market Analysis, Opportunity and Forecast, By Product Type, 2016-2032
- 7.3.1. APAC Televisions Market Analysis by Product Type: Introduction
- 7.3.2. Market Size Absolute $ Opportunity Analysis and Forecast, By Product Type, 2016-2032
- 7.3.3. LCD TVs
- 7.3.4. LED TVs
- 7.3.5. OLED TVs
- 7.3.6. QLED TVs
- 7.3.7. Plasma TVs
- 7.4. APAC Televisions Market Analysis, Opportunity and Forecast, By Screen Size, 2016-2032
- 7.4.1. APAC Televisions Market Analysis by Screen Size: Introduction
- 7.4.2. Market Size Absolute $ Opportunity Analysis and Forecast, By Screen Size, 2016-2032
- 7.4.3. Below 32 inches
- 7.4.4. 32-45 inches
- 7.4.5. 46-55 inches
- 7.4.6. 56-65 inches
- 7.4.7. Above 65 inches
- 7.5. APAC Televisions Market Analysis, Opportunity and Forecast, By Resolution, 2016-2032
- 7.5.1. APAC Televisions Market Analysis by Resolution: Introduction
- 7.5.2. Market Size Absolute $ Opportunity Analysis and Forecast, By Resolution, 2016-2032
- 7.5.3. HD
- 7.5.4. Full HD
- 7.5.5. 4K Ultra HD
- 7.5.6. 8K Ultra HD
- 7.6. APAC Televisions Market Analysis, Opportunity and Forecast, By Distribution Channel, 2016-2032
- 7.6.1. APAC Televisions Market Analysis by Distribution Channel: Introduction
- 7.6.2. Market Size Absolute $ Opportunity Analysis and Forecast, By Distribution Channel, 2016-2032
- 7.6.3. Online
- 7.6.4. Offline
- 7.7. APAC Televisions Market Analysis, Opportunity and Forecast, By Country , 2016-2032
- 7.7.1. APAC Televisions Market Analysis by Country : Introduction
- 7.7.2. Market Size Absolute $ Opportunity Analysis and Forecast, Country , 2016-2032
- 7.7.2.1. China
- 7.7.2.2. Japan
- 7.7.2.3. South Korea
- 7.7.2.4. India
- 7.7.2.5. Australia & New Zeland
- 7.7.2.6. Indonesia
- 7.7.2.7. Malaysia
- 7.7.2.8. Philippines
- 7.7.2.9. Singapore
- 7.7.2.10. Thailand
- 7.7.2.11. Vietnam
- 7.7.2.12. Rest of APAC
- 8. Latin America Televisions Market Analysis, Opportunity and Forecast, 2016-2032
- 8.1. Latin America Televisions Market Analysis, 2016-2021
- 8.2. Latin America Televisions Market Opportunity and Forecast, 2023-2032
- 8.3. Latin America Televisions Market Analysis, Opportunity and Forecast, By Product Type, 2016-2032
- 8.3.1. Latin America Televisions Market Analysis by Product Type: Introduction
- 8.3.2. Market Size Absolute $ Opportunity Analysis and Forecast, By Product Type, 2016-2032
- 8.3.3. LCD TVs
- 8.3.4. LED TVs
- 8.3.5. OLED TVs
- 8.3.6. QLED TVs
- 8.3.7. Plasma TVs
- 8.4. Latin America Televisions Market Analysis, Opportunity and Forecast, By Screen Size, 2016-2032
- 8.4.1. Latin America Televisions Market Analysis by Screen Size: Introduction
- 8.4.2. Market Size Absolute $ Opportunity Analysis and Forecast, By Screen Size, 2016-2032
- 8.4.3. Below 32 inches
- 8.4.4. 32-45 inches
- 8.4.5. 46-55 inches
- 8.4.6. 56-65 inches
- 8.4.7. Above 65 inches
- 8.5. Latin America Televisions Market Analysis, Opportunity and Forecast, By Resolution, 2016-2032
- 8.5.1. Latin America Televisions Market Analysis by Resolution: Introduction
- 8.5.2. Market Size Absolute $ Opportunity Analysis and Forecast, By Resolution, 2016-2032
- 8.5.3. HD
- 8.5.4. Full HD
- 8.5.5. 4K Ultra HD
- 8.5.6. 8K Ultra HD
- 8.6. Latin America Televisions Market Analysis, Opportunity and Forecast, By Distribution Channel, 2016-2032
- 8.6.1. Latin America Televisions Market Analysis by Distribution Channel: Introduction
- 8.6.2. Market Size Absolute $ Opportunity Analysis and Forecast, By Distribution Channel, 2016-2032
- 8.6.3. Online
- 8.6.4. Offline
- 8.7. Latin America Televisions Market Analysis, Opportunity and Forecast, By Country , 2016-2032
- 8.7.1. Latin America Televisions Market Analysis by Country : Introduction
- 8.7.2. Market Size Absolute $ Opportunity Analysis and Forecast, Country , 2016-2032
- 8.7.2.1. Brazil
- 8.7.2.2. Colombia
- 8.7.2.3. Chile
- 8.7.2.4. Argentina
- 8.7.2.5. Costa Rica
- 8.7.2.6. Rest of Latin America
- 9. Middle East & Africa Televisions Market Analysis, Opportunity and Forecast, 2016-2032
- 9.1. Middle East & Africa Televisions Market Analysis, 2016-2021
- 9.2. Middle East & Africa Televisions Market Opportunity and Forecast, 2023-2032
- 9.3. Middle East & Africa Televisions Market Analysis, Opportunity and Forecast, By Product Type, 2016-2032
- 9.3.1. Middle East & Africa Televisions Market Analysis by Product Type: Introduction
- 9.3.2. Market Size Absolute $ Opportunity Analysis and Forecast, By Product Type, 2016-2032
- 9.3.3. LCD TVs
- 9.3.4. LED TVs
- 9.3.5. OLED TVs
- 9.3.6. QLED TVs
- 9.3.7. Plasma TVs
- 9.4. Middle East & Africa Televisions Market Analysis, Opportunity and Forecast, By Screen Size, 2016-2032
- 9.4.1. Middle East & Africa Televisions Market Analysis by Screen Size: Introduction
- 9.4.2. Market Size Absolute $ Opportunity Analysis and Forecast, By Screen Size, 2016-2032
- 9.4.3. Below 32 inches
- 9.4.4. 32-45 inches
- 9.4.5. 46-55 inches
- 9.4.6. 56-65 inches
- 9.4.7. Above 65 inches
- 9.5. Middle East & Africa Televisions Market Analysis, Opportunity and Forecast, By Resolution, 2016-2032
- 9.5.1. Middle East & Africa Televisions Market Analysis by Resolution: Introduction
- 9.5.2. Market Size Absolute $ Opportunity Analysis and Forecast, By Resolution, 2016-2032
- 9.5.3. HD
- 9.5.4. Full HD
- 9.5.5. 4K Ultra HD
- 9.5.6. 8K Ultra HD
- 9.6. Middle East & Africa Televisions Market Analysis, Opportunity and Forecast, By Distribution Channel, 2016-2032
- 9.6.1. Middle East & Africa Televisions Market Analysis by Distribution Channel: Introduction
- 9.6.2. Market Size Absolute $ Opportunity Analysis and Forecast, By Distribution Channel, 2016-2032
- 9.6.3. Online
- 9.6.4. Offline
- 9.7. Middle East & Africa Televisions Market Analysis, Opportunity and Forecast, By Country , 2016-2032
- 9.7.1. Middle East & Africa Televisions Market Analysis by Country : Introduction
- 9.7.2. Market Size Absolute $ Opportunity Analysis and Forecast, Country , 2016-2032
- 9.7.2.1. Algeria
- 9.7.2.2. Egypt
- 9.7.2.3. Israel
- 9.7.2.4. Kuwait
- 9.7.2.5. Nigeria
- 9.7.2.6. Saudi Arabia
- 9.7.2.7. South Africa
- 9.7.2.8. Turkey
- 9.7.2.9. The UAE
- 9.7.2.10. Rest of MEA
- 10. Global Televisions Market Analysis, Opportunity and Forecast, By Region , 2016-2032
- 10.1. Global Televisions Market Analysis by Region : Introduction
- 10.2. Market Size Absolute $ Opportunity Analysis and Forecast, By Region , 2016-2032
- 10.2.1. North America
- 10.2.2. Western Europe
- 10.2.3. Eastern Europe
- 10.2.4. APAC
- 10.2.5. Latin America
- 10.2.6. Middle East & Africa
- 11. Global Televisions Market Competitive Landscape, Market Share Analysis, and Company Profiles
- 11.1. Market Share Analysis
- 11.2. Company Profiles
- 11.3. Samsung Electronics Co. Ltd.
- 11.3.1. Company Overview
- 11.3.2. Financial Highlights
- 11.3.3. Product Portfolio
- 11.3.4. SWOT Analysis
- 11.3.5. Key Strategies and Developments
- 11.4. LG Corporation
- 11.4.1. Company Overview
- 11.4.2. Financial Highlights
- 11.4.3. Product Portfolio
- 11.4.4. SWOT Analysis
- 11.4.5. Key Strategies and Developments
- 11.5. Sony Corporation
- 11.5.1. Company Overview
- 11.5.2. Financial Highlights
- 11.5.3. Product Portfolio
- 11.5.4. SWOT Analysis
- 11.5.5. Key Strategies and Developments
- 11.6. TCL Corporation
- 11.6.1. Company Overview
- 11.6.2. Financial Highlights
- 11.6.3. Product Portfolio
- 11.6.4. SWOT Analysis
- 11.6.5. Key Strategies and Developments
- 11.7. Panasonic Holdings Corporation
- 11.7.1. Company Overview
- 11.7.2. Financial Highlights
- 11.7.3. Product Portfolio
- 11.7.4. SWOT Analysis
- 11.7.5. Key Strategies and Developments
- 11.8. Hisense International Co., Ltd.
- 11.8.1. Company Overview
- 11.8.2. Financial Highlights
- 11.8.3. Product Portfolio
- 11.8.4. SWOT Analysis
- 11.8.5. Key Strategies and Developments
- 11.9. Sharp Corporation
- 11.9.1. Company Overview
- 11.9.2. Financial Highlights
- 11.9.3. Product Portfolio
- 11.9.4. SWOT Analysis
- 11.9.5. Key Strategies and Developments
- 11.10. Vizio Inc.
- 11.10.1. Company Overview
- 11.10.2. Financial Highlights
- 11.10.3. Product Portfolio
- 11.10.4. SWOT Analysis
- 11.10.5. Key Strategies and Developments
- 11.11. Skyworth Digital Holdings Ltd.
- 11.11.1. Company Overview
- 11.11.2. Financial Highlights
- 11.11.3. Product Portfolio
- 11.11.4. SWOT Analysis
- 11.11.5. Key Strategies and Developments
- 11.12. Philips (TPV Technology Limited)
- 11.12.1. Company Overview
- 11.12.2. Financial Highlights
- 11.12.3. Product Portfolio
- 11.12.4. SWOT Analysis
- 11.12.5. Key Strategies and Developments
- 11.13.1. Company Overview
- 11.13.2. Financial Highlights
- 11.13.3. Product Portfolio
- 11.13.4. SWOT Analysis
- 11.13.5. Key Strategies and Developments
- 11.14. Haier Smart Home Co., Ltd
- 11.14.1. Company Overview
- 11.14.2. Financial Highlights
- 11.14.3. Product Portfolio
- 11.14.4. SWOT Analysis
- 11.14.5. Key Strategies and Developments
- 12. Assumptions and Acronyms
- 13. Research Methodology
- 14. Contact
"
- List of Figures
- "
- Figure 1: Global Televisions Market Revenue (US$ Mn) Market Share by Product Type in 2022
- Figure 2: Global Televisions Market Market Attractiveness Analysis by Product Type, 2016-2032
- Figure 3: Global Televisions Market Revenue (US$ Mn) Market Share by Screen Sizein 2022
- Figure 4: Global Televisions Market Market Attractiveness Analysis by Screen Size, 2016-2032
- Figure 5: Global Televisions Market Revenue (US$ Mn) Market Share by Resolutionin 2022
- Figure 6: Global Televisions Market Market Attractiveness Analysis by Resolution, 2016-2032
- Figure 7: Global Televisions Market Revenue (US$ Mn) Market Share by Distribution Channelin 2022
- Figure 8: Global Televisions Market Market Attractiveness Analysis by Distribution Channel, 2016-2032
- Figure 9: Global Televisions Market Revenue (US$ Mn) Market Share by Region in 2022
- Figure 10: Global Televisions Market Market Attractiveness Analysis by Region, 2016-2032
- Figure 11: Global Televisions Market Market Revenue (US$ Mn) (2016-2032)
- Figure 12: Global Televisions Market Market Revenue (US$ Mn) Comparison by Region (2016-2032)
- Figure 13: Global Televisions Market Market Revenue (US$ Mn) Comparison by Product Type (2016-2032)
- Figure 14: Global Televisions Market Market Revenue (US$ Mn) Comparison by Screen Size (2016-2032)
- Figure 15: Global Televisions Market Market Revenue (US$ Mn) Comparison by Resolution (2016-2032)
- Figure 16: Global Televisions Market Market Revenue (US$ Mn) Comparison by Distribution Channel (2016-2032)
- Figure 17: Global Televisions Market Market Y-o-Y Growth Rate Comparison by Region (2016-2032)
- Figure 18: Global Televisions Market Market Y-o-Y Growth Rate Comparison by Product Type (2016-2032)
- Figure 19: Global Televisions Market Market Y-o-Y Growth Rate Comparison by Screen Size (2016-2032)
- Figure 20: Global Televisions Market Market Y-o-Y Growth Rate Comparison by Resolution (2016-2032)
- Figure 21: Global Televisions Market Market Y-o-Y Growth Rate Comparison by Distribution Channel (2016-2032)
- Figure 22: Global Televisions Market Market Share Comparison by Region (2016-2032)
- Figure 23: Global Televisions Market Market Share Comparison by Product Type (2016-2032)
- Figure 24: Global Televisions Market Market Share Comparison by Screen Size (2016-2032)
- Figure 25: Global Televisions Market Market Share Comparison by Resolution (2016-2032)
- Figure 26: Global Televisions Market Market Share Comparison by Distribution Channel (2016-2032)
- Figure 27: North America Televisions Market Revenue (US$ Mn) Market Share by Product Typein 2022
- Figure 28: North America Televisions Market Market Attractiveness Analysis by Product Type, 2016-2032
- Figure 29: North America Televisions Market Revenue (US$ Mn) Market Share by Screen Sizein 2022
- Figure 30: North America Televisions Market Market Attractiveness Analysis by Screen Size, 2016-2032
- Figure 31: North America Televisions Market Revenue (US$ Mn) Market Share by Resolutionin 2022
- Figure 32: North America Televisions Market Market Attractiveness Analysis by Resolution, 2016-2032
- Figure 33: North America Televisions Market Revenue (US$ Mn) Market Share by Distribution Channelin 2022
- Figure 34: North America Televisions Market Market Attractiveness Analysis by Distribution Channel, 2016-2032
- Figure 35: North America Televisions Market Revenue (US$ Mn) Market Share by Country in 2022
- Figure 36: North America Televisions Market Market Attractiveness Analysis by Country, 2016-2032
- Figure 37: North America Televisions Market Market Revenue (US$ Mn) (2016-2032)
- Figure 38: North America Televisions Market Market Revenue (US$ Mn) Comparison by Country (2016-2032)
- Figure 39: North America Televisions Market Market Revenue (US$ Mn) Comparison by Product Type (2016-2032)
- Figure 40: North America Televisions Market Market Revenue (US$ Mn) Comparison by Screen Size (2016-2032)
- Figure 41: North America Televisions Market Market Revenue (US$ Mn) Comparison by Resolution (2016-2032)
- Figure 42: North America Televisions Market Market Revenue (US$ Mn) Comparison by Distribution Channel (2016-2032)
- Figure 43: North America Televisions Market Market Y-o-Y Growth Rate Comparison by Country (2016-2032)
- Figure 44: North America Televisions Market Market Y-o-Y Growth Rate Comparison by Product Type (2016-2032)
- Figure 45: North America Televisions Market Market Y-o-Y Growth Rate Comparison by Screen Size (2016-2032)
- Figure 46: North America Televisions Market Market Y-o-Y Growth Rate Comparison by Resolution (2016-2032)
- Figure 47: North America Televisions Market Market Y-o-Y Growth Rate Comparison by Distribution Channel (2016-2032)
- Figure 48: North America Televisions Market Market Share Comparison by Country (2016-2032)
- Figure 49: North America Televisions Market Market Share Comparison by Product Type (2016-2032)
- Figure 50: North America Televisions Market Market Share Comparison by Screen Size (2016-2032)
- Figure 51: North America Televisions Market Market Share Comparison by Resolution (2016-2032)
- Figure 52: North America Televisions Market Market Share Comparison by Distribution Channel (2016-2032)
- Figure 53: Western Europe Televisions Market Revenue (US$ Mn) Market Share by Product Typein 2022
- Figure 54: Western Europe Televisions Market Market Attractiveness Analysis by Product Type, 2016-2032
- Figure 55: Western Europe Televisions Market Revenue (US$ Mn) Market Share by Screen Sizein 2022
- Figure 56: Western Europe Televisions Market Market Attractiveness Analysis by Screen Size, 2016-2032
- Figure 57: Western Europe Televisions Market Revenue (US$ Mn) Market Share by Resolutionin 2022
- Figure 58: Western Europe Televisions Market Market Attractiveness Analysis by Resolution, 2016-2032
- Figure 59: Western Europe Televisions Market Revenue (US$ Mn) Market Share by Distribution Channelin 2022
- Figure 60: Western Europe Televisions Market Market Attractiveness Analysis by Distribution Channel, 2016-2032
- Figure 61: Western Europe Televisions Market Revenue (US$ Mn) Market Share by Country in 2022
- Figure 62: Western Europe Televisions Market Market Attractiveness Analysis by Country, 2016-2032
- Figure 63: Western Europe Televisions Market Market Revenue (US$ Mn) (2016-2032)
- Figure 64: Western Europe Televisions Market Market Revenue (US$ Mn) Comparison by Country (2016-2032)
- Figure 65: Western Europe Televisions Market Market Revenue (US$ Mn) Comparison by Product Type (2016-2032)
- Figure 66: Western Europe Televisions Market Market Revenue (US$ Mn) Comparison by Screen Size (2016-2032)
- Figure 67: Western Europe Televisions Market Market Revenue (US$ Mn) Comparison by Resolution (2016-2032)
- Figure 68: Western Europe Televisions Market Market Revenue (US$ Mn) Comparison by Distribution Channel (2016-2032)
- Figure 69: Western Europe Televisions Market Market Y-o-Y Growth Rate Comparison by Country (2016-2032)
- Figure 70: Western Europe Televisions Market Market Y-o-Y Growth Rate Comparison by Product Type (2016-2032)
- Figure 71: Western Europe Televisions Market Market Y-o-Y Growth Rate Comparison by Screen Size (2016-2032)
- Figure 72: Western Europe Televisions Market Market Y-o-Y Growth Rate Comparison by Resolution (2016-2032)
- Figure 73: Western Europe Televisions Market Market Y-o-Y Growth Rate Comparison by Distribution Channel (2016-2032)
- Figure 74: Western Europe Televisions Market Market Share Comparison by Country (2016-2032)
- Figure 75: Western Europe Televisions Market Market Share Comparison by Product Type (2016-2032)
- Figure 76: Western Europe Televisions Market Market Share Comparison by Screen Size (2016-2032)
- Figure 77: Western Europe Televisions Market Market Share Comparison by Resolution (2016-2032)
- Figure 78: Western Europe Televisions Market Market Share Comparison by Distribution Channel (2016-2032)
- Figure 79: Eastern Europe Televisions Market Revenue (US$ Mn) Market Share by Product Typein 2022
- Figure 80: Eastern Europe Televisions Market Market Attractiveness Analysis by Product Type, 2016-2032
- Figure 81: Eastern Europe Televisions Market Revenue (US$ Mn) Market Share by Screen Sizein 2022
- Figure 82: Eastern Europe Televisions Market Market Attractiveness Analysis by Screen Size, 2016-2032
- Figure 83: Eastern Europe Televisions Market Revenue (US$ Mn) Market Share by Resolutionin 2022
- Figure 84: Eastern Europe Televisions Market Market Attractiveness Analysis by Resolution, 2016-2032
- Figure 85: Eastern Europe Televisions Market Revenue (US$ Mn) Market Share by Distribution Channelin 2022
- Figure 86: Eastern Europe Televisions Market Market Attractiveness Analysis by Distribution Channel, 2016-2032
- Figure 87: Eastern Europe Televisions Market Revenue (US$ Mn) Market Share by Country in 2022
- Figure 88: Eastern Europe Televisions Market Market Attractiveness Analysis by Country, 2016-2032
- Figure 89: Eastern Europe Televisions Market Market Revenue (US$ Mn) (2016-2032)
- Figure 90: Eastern Europe Televisions Market Market Revenue (US$ Mn) Comparison by Country (2016-2032)
- Figure 91: Eastern Europe Televisions Market Market Revenue (US$ Mn) Comparison by Product Type (2016-2032)
- Figure 92: Eastern Europe Televisions Market Market Revenue (US$ Mn) Comparison by Screen Size (2016-2032)
- Figure 93: Eastern Europe Televisions Market Market Revenue (US$ Mn) Comparison by Resolution (2016-2032)
- Figure 94: Eastern Europe Televisions Market Market Revenue (US$ Mn) Comparison by Distribution Channel (2016-2032)
- Figure 95: Eastern Europe Televisions Market Market Y-o-Y Growth Rate Comparison by Country (2016-2032)
- Figure 96: Eastern Europe Televisions Market Market Y-o-Y Growth Rate Comparison by Product Type (2016-2032)
- Figure 97: Eastern Europe Televisions Market Market Y-o-Y Growth Rate Comparison by Screen Size (2016-2032)
- Figure 98: Eastern Europe Televisions Market Market Y-o-Y Growth Rate Comparison by Resolution (2016-2032)
- Figure 99: Eastern Europe Televisions Market Market Y-o-Y Growth Rate Comparison by Distribution Channel (2016-2032)
- Figure 100: Eastern Europe Televisions Market Market Share Comparison by Country (2016-2032)
- Figure 101: Eastern Europe Televisions Market Market Share Comparison by Product Type (2016-2032)
- Figure 102: Eastern Europe Televisions Market Market Share Comparison by Screen Size (2016-2032)
- Figure 103: Eastern Europe Televisions Market Market Share Comparison by Resolution (2016-2032)
- Figure 104: Eastern Europe Televisions Market Market Share Comparison by Distribution Channel (2016-2032)
- Figure 105: APAC Televisions Market Revenue (US$ Mn) Market Share by Product Typein 2022
- Figure 106: APAC Televisions Market Market Attractiveness Analysis by Product Type, 2016-2032
- Figure 107: APAC Televisions Market Revenue (US$ Mn) Market Share by Screen Sizein 2022
- Figure 108: APAC Televisions Market Market Attractiveness Analysis by Screen Size, 2016-2032
- Figure 109: APAC Televisions Market Revenue (US$ Mn) Market Share by Resolutionin 2022
- Figure 110: APAC Televisions Market Market Attractiveness Analysis by Resolution, 2016-2032
- Figure 111: APAC Televisions Market Revenue (US$ Mn) Market Share by Distribution Channelin 2022
- Figure 112: APAC Televisions Market Market Attractiveness Analysis by Distribution Channel, 2016-2032
- Figure 113: APAC Televisions Market Revenue (US$ Mn) Market Share by Country in 2022
- Figure 114: APAC Televisions Market Market Attractiveness Analysis by Country, 2016-2032
- Figure 115: APAC Televisions Market Market Revenue (US$ Mn) (2016-2032)
- Figure 116: APAC Televisions Market Market Revenue (US$ Mn) Comparison by Country (2016-2032)
- Figure 117: APAC Televisions Market Market Revenue (US$ Mn) Comparison by Product Type (2016-2032)
- Figure 118: APAC Televisions Market Market Revenue (US$ Mn) Comparison by Screen Size (2016-2032)
- Figure 119: APAC Televisions Market Market Revenue (US$ Mn) Comparison by Resolution (2016-2032)
- Figure 120: APAC Televisions Market Market Revenue (US$ Mn) Comparison by Distribution Channel (2016-2032)
- Figure 121: APAC Televisions Market Market Y-o-Y Growth Rate Comparison by Country (2016-2032)
- Figure 122: APAC Televisions Market Market Y-o-Y Growth Rate Comparison by Product Type (2016-2032)
- Figure 123: APAC Televisions Market Market Y-o-Y Growth Rate Comparison by Screen Size (2016-2032)
- Figure 124: APAC Televisions Market Market Y-o-Y Growth Rate Comparison by Resolution (2016-2032)
- Figure 125: APAC Televisions Market Market Y-o-Y Growth Rate Comparison by Distribution Channel (2016-2032)
- Figure 126: APAC Televisions Market Market Share Comparison by Country (2016-2032)
- Figure 127: APAC Televisions Market Market Share Comparison by Product Type (2016-2032)
- Figure 128: APAC Televisions Market Market Share Comparison by Screen Size (2016-2032)
- Figure 129: APAC Televisions Market Market Share Comparison by Resolution (2016-2032)
- Figure 130: APAC Televisions Market Market Share Comparison by Distribution Channel (2016-2032)
- Figure 131: Latin America Televisions Market Revenue (US$ Mn) Market Share by Product Typein 2022
- Figure 132: Latin America Televisions Market Market Attractiveness Analysis by Product Type, 2016-2032
- Figure 133: Latin America Televisions Market Revenue (US$ Mn) Market Share by Screen Sizein 2022
- Figure 134: Latin America Televisions Market Market Attractiveness Analysis by Screen Size, 2016-2032
- Figure 135: Latin America Televisions Market Revenue (US$ Mn) Market Share by Resolutionin 2022
- Figure 136: Latin America Televisions Market Market Attractiveness Analysis by Resolution, 2016-2032
- Figure 137: Latin America Televisions Market Revenue (US$ Mn) Market Share by Distribution Channelin 2022
- Figure 138: Latin America Televisions Market Market Attractiveness Analysis by Distribution Channel, 2016-2032
- Figure 139: Latin America Televisions Market Revenue (US$ Mn) Market Share by Country in 2022
- Figure 140: Latin America Televisions Market Market Attractiveness Analysis by Country, 2016-2032
- Figure 141: Latin America Televisions Market Market Revenue (US$ Mn) (2016-2032)
- Figure 142: Latin America Televisions Market Market Revenue (US$ Mn) Comparison by Country (2016-2032)
- Figure 143: Latin America Televisions Market Market Revenue (US$ Mn) Comparison by Product Type (2016-2032)
- Figure 144: Latin America Televisions Market Market Revenue (US$ Mn) Comparison by Screen Size (2016-2032)
- Figure 145: Latin America Televisions Market Market Revenue (US$ Mn) Comparison by Resolution (2016-2032)
- Figure 146: Latin America Televisions Market Market Revenue (US$ Mn) Comparison by Distribution Channel (2016-2032)
- Figure 147: Latin America Televisions Market Market Y-o-Y Growth Rate Comparison by Country (2016-2032)
- Figure 148: Latin America Televisions Market Market Y-o-Y Growth Rate Comparison by Product Type (2016-2032)
- Figure 149: Latin America Televisions Market Market Y-o-Y Growth Rate Comparison by Screen Size (2016-2032)
- Figure 150: Latin America Televisions Market Market Y-o-Y Growth Rate Comparison by Resolution (2016-2032)
- Figure 151: Latin America Televisions Market Market Y-o-Y Growth Rate Comparison by Distribution Channel (2016-2032)
- Figure 152: Latin America Televisions Market Market Share Comparison by Country (2016-2032)
- Figure 153: Latin America Televisions Market Market Share Comparison by Product Type (2016-2032)
- Figure 154: Latin America Televisions Market Market Share Comparison by Screen Size (2016-2032)
- Figure 155: Latin America Televisions Market Market Share Comparison by Resolution (2016-2032)
- Figure 156: Latin America Televisions Market Market Share Comparison by Distribution Channel (2016-2032)
- Figure 157: Middle East & Africa Televisions Market Revenue (US$ Mn) Market Share by Product Typein 2022
- Figure 158: Middle East & Africa Televisions Market Market Attractiveness Analysis by Product Type, 2016-2032
- Figure 159: Middle East & Africa Televisions Market Revenue (US$ Mn) Market Share by Screen Sizein 2022
- Figure 160: Middle East & Africa Televisions Market Market Attractiveness Analysis by Screen Size, 2016-2032
- Figure 161: Middle East & Africa Televisions Market Revenue (US$ Mn) Market Share by Resolutionin 2022
- Figure 162: Middle East & Africa Televisions Market Market Attractiveness Analysis by Resolution, 2016-2032
- Figure 163: Middle East & Africa Televisions Market Revenue (US$ Mn) Market Share by Distribution Channelin 2022
- Figure 164: Middle East & Africa Televisions Market Market Attractiveness Analysis by Distribution Channel, 2016-2032
- Figure 165: Middle East & Africa Televisions Market Revenue (US$ Mn) Market Share by Country in 2022
- Figure 166: Middle East & Africa Televisions Market Market Attractiveness Analysis by Country, 2016-2032
- Figure 167: Middle East & Africa Televisions Market Market Revenue (US$ Mn) (2016-2032)
- Figure 168: Middle East & Africa Televisions Market Market Revenue (US$ Mn) Comparison by Country (2016-2032)
- Figure 169: Middle East & Africa Televisions Market Market Revenue (US$ Mn) Comparison by Product Type (2016-2032)
- Figure 170: Middle East & Africa Televisions Market Market Revenue (US$ Mn) Comparison by Screen Size (2016-2032)
- Figure 171: Middle East & Africa Televisions Market Market Revenue (US$ Mn) Comparison by Resolution (2016-2032)
- Figure 172: Middle East & Africa Televisions Market Market Revenue (US$ Mn) Comparison by Distribution Channel (2016-2032)
- Figure 173: Middle East & Africa Televisions Market Market Y-o-Y Growth Rate Comparison by Country (2016-2032)
- Figure 174: Middle East & Africa Televisions Market Market Y-o-Y Growth Rate Comparison by Product Type (2016-2032)
- Figure 175: Middle East & Africa Televisions Market Market Y-o-Y Growth Rate Comparison by Screen Size (2016-2032)
- Figure 176: Middle East & Africa Televisions Market Market Y-o-Y Growth Rate Comparison by Resolution (2016-2032)
- Figure 177: Middle East & Africa Televisions Market Market Y-o-Y Growth Rate Comparison by Distribution Channel (2016-2032)
- Figure 178: Middle East & Africa Televisions Market Market Share Comparison by Country (2016-2032)
- Figure 179: Middle East & Africa Televisions Market Market Share Comparison by Product Type (2016-2032)
- Figure 180: Middle East & Africa Televisions Market Market Share Comparison by Screen Size (2016-2032)
- Figure 181: Middle East & Africa Televisions Market Market Share Comparison by Resolution (2016-2032)
- Figure 182: Middle East & Africa Televisions Market Market Share Comparison by Distribution Channel (2016-2032)
"
- List of Tables
- "
- Table 1: Global Televisions Market Market Comparison by Product Type (2016-2032)
- Table 2: Global Televisions Market Market Comparison by Screen Size (2016-2032)
- Table 3: Global Televisions Market Market Comparison by Resolution (2016-2032)
- Table 4: Global Televisions Market Market Comparison by Distribution Channel (2016-2032)
- Table 5: Global Televisions Market Revenue (US$ Mn) Comparison by Region (2016-2032)
- Table 6: Global Televisions Market Market Revenue (US$ Mn) (2016-2032)
- Table 7: Global Televisions Market Market Revenue (US$ Mn) Comparison by Region (2016-2032)
- Table 8: Global Televisions Market Market Revenue (US$ Mn) Comparison by Product Type (2016-2032)
- Table 9: Global Televisions Market Market Revenue (US$ Mn) Comparison by Screen Size (2016-2032)
- Table 10: Global Televisions Market Market Revenue (US$ Mn) Comparison by Resolution (2016-2032)
- Table 11: Global Televisions Market Market Revenue (US$ Mn) Comparison by Distribution Channel (2016-2032)
- Table 12: Global Televisions Market Market Y-o-Y Growth Rate Comparison by Region (2016-2032)
- Table 13: Global Televisions Market Market Y-o-Y Growth Rate Comparison by Product Type (2016-2032)
- Table 14: Global Televisions Market Market Y-o-Y Growth Rate Comparison by Screen Size (2016-2032)
- Table 15: Global Televisions Market Market Y-o-Y Growth Rate Comparison by Resolution (2016-2032)
- Table 16: Global Televisions Market Market Y-o-Y Growth Rate Comparison by Distribution Channel (2016-2032)
- Table 17: Global Televisions Market Market Share Comparison by Region (2016-2032)
- Table 18: Global Televisions Market Market Share Comparison by Product Type (2016-2032)
- Table 19: Global Televisions Market Market Share Comparison by Screen Size (2016-2032)
- Table 20: Global Televisions Market Market Share Comparison by Resolution (2016-2032)
- Table 21: Global Televisions Market Market Share Comparison by Distribution Channel (2016-2032)
- Table 22: North America Televisions Market Market Comparison by Screen Size (2016-2032)
- Table 23: North America Televisions Market Market Comparison by Resolution (2016-2032)
- Table 24: North America Televisions Market Market Comparison by Distribution Channel (2016-2032)
- Table 25: North America Televisions Market Revenue (US$ Mn) Comparison by Country (2016-2032)
- Table 26: North America Televisions Market Market Revenue (US$ Mn) (2016-2032)
- Table 27: North America Televisions Market Market Revenue (US$ Mn) Comparison by Country (2016-2032)
- Table 28: North America Televisions Market Market Revenue (US$ Mn) Comparison by Product Type (2016-2032)
- Table 29: North America Televisions Market Market Revenue (US$ Mn) Comparison by Screen Size (2016-2032)
- Table 30: North America Televisions Market Market Revenue (US$ Mn) Comparison by Resolution (2016-2032)
- Table 31: North America Televisions Market Market Revenue (US$ Mn) Comparison by Distribution Channel (2016-2032)
- Table 32: North America Televisions Market Market Y-o-Y Growth Rate Comparison by Country (2016-2032)
- Table 33: North America Televisions Market Market Y-o-Y Growth Rate Comparison by Product Type (2016-2032)
- Table 34: North America Televisions Market Market Y-o-Y Growth Rate Comparison by Screen Size (2016-2032)
- Table 35: North America Televisions Market Market Y-o-Y Growth Rate Comparison by Resolution (2016-2032)
- Table 36: North America Televisions Market Market Y-o-Y Growth Rate Comparison by Distribution Channel (2016-2032)
- Table 37: North America Televisions Market Market Share Comparison by Country (2016-2032)
- Table 38: North America Televisions Market Market Share Comparison by Product Type (2016-2032)
- Table 39: North America Televisions Market Market Share Comparison by Screen Size (2016-2032)
- Table 40: North America Televisions Market Market Share Comparison by Resolution (2016-2032)
- Table 41: North America Televisions Market Market Share Comparison by Distribution Channel (2016-2032)
- Table 42: Western Europe Televisions Market Market Comparison by Product Type (2016-2032)
- Table 43: Western Europe Televisions Market Market Comparison by Screen Size (2016-2032)
- Table 44: Western Europe Televisions Market Market Comparison by Resolution (2016-2032)
- Table 45: Western Europe Televisions Market Market Comparison by Distribution Channel (2016-2032)
- Table 46: Western Europe Televisions Market Revenue (US$ Mn) Comparison by Country (2016-2032)
- Table 47: Western Europe Televisions Market Market Revenue (US$ Mn) (2016-2032)
- Table 48: Western Europe Televisions Market Market Revenue (US$ Mn) Comparison by Country (2016-2032)
- Table 49: Western Europe Televisions Market Market Revenue (US$ Mn) Comparison by Product Type (2016-2032)
- Table 50: Western Europe Televisions Market Market Revenue (US$ Mn) Comparison by Screen Size (2016-2032)
- Table 51: Western Europe Televisions Market Market Revenue (US$ Mn) Comparison by Resolution (2016-2032)
- Table 52: Western Europe Televisions Market Market Revenue (US$ Mn) Comparison by Distribution Channel (2016-2032)
- Table 53: Western Europe Televisions Market Market Y-o-Y Growth Rate Comparison by Country (2016-2032)
- Table 54: Western Europe Televisions Market Market Y-o-Y Growth Rate Comparison by Product Type (2016-2032)
- Table 55: Western Europe Televisions Market Market Y-o-Y Growth Rate Comparison by Screen Size (2016-2032)
- Table 56: Western Europe Televisions Market Market Y-o-Y Growth Rate Comparison by Resolution (2016-2032)
- Table 57: Western Europe Televisions Market Market Y-o-Y Growth Rate Comparison by Distribution Channel (2016-2032)
- Table 58: Western Europe Televisions Market Market Share Comparison by Country (2016-2032)
- Table 59: Western Europe Televisions Market Market Share Comparison by Product Type (2016-2032)
- Table 60: Western Europe Televisions Market Market Share Comparison by Screen Size (2016-2032)
- Table 61: Western Europe Televisions Market Market Share Comparison by Resolution (2016-2032)
- Table 62: Western Europe Televisions Market Market Share Comparison by Distribution Channel (2016-2032)
- Table 63: Eastern Europe Televisions Market Market Comparison by Product Type (2016-2032)
- Table 64: Eastern Europe Televisions Market Market Comparison by Screen Size (2016-2032)
- Table 65: Eastern Europe Televisions Market Market Comparison by Resolution (2016-2032)
- Table 66: Eastern Europe Televisions Market Market Comparison by Distribution Channel (2016-2032)
- Table 67: Eastern Europe Televisions Market Revenue (US$ Mn) Comparison by Country (2016-2032)
- Table 68: Eastern Europe Televisions Market Market Revenue (US$ Mn) (2016-2032)
- Table 69: Eastern Europe Televisions Market Market Revenue (US$ Mn) Comparison by Country (2016-2032)
- Table 70: Eastern Europe Televisions Market Market Revenue (US$ Mn) Comparison by Product Type (2016-2032)
- Table 71: Eastern Europe Televisions Market Market Revenue (US$ Mn) Comparison by Screen Size (2016-2032)
- Table 72: Eastern Europe Televisions Market Market Revenue (US$ Mn) Comparison by Resolution (2016-2032)
- Table 73: Eastern Europe Televisions Market Market Revenue (US$ Mn) Comparison by Distribution Channel (2016-2032)
- Table 74: Eastern Europe Televisions Market Market Y-o-Y Growth Rate Comparison by Country (2016-2032)
- Table 75: Eastern Europe Televisions Market Market Y-o-Y Growth Rate Comparison by Product Type (2016-2032)
- Table 76: Eastern Europe Televisions Market Market Y-o-Y Growth Rate Comparison by Screen Size (2016-2032)
- Table 77: Eastern Europe Televisions Market Market Y-o-Y Growth Rate Comparison by Resolution (2016-2032)
- Table 78: Eastern Europe Televisions Market Market Y-o-Y Growth Rate Comparison by Distribution Channel (2016-2032)
- Table 79: Eastern Europe Televisions Market Market Share Comparison by Country (2016-2032)
- Table 80: Eastern Europe Televisions Market Market Share Comparison by Product Type (2016-2032)
- Table 81: Eastern Europe Televisions Market Market Share Comparison by Screen Size (2016-2032)
- Table 82: Eastern Europe Televisions Market Market Share Comparison by Resolution (2016-2032)
- Table 83: Eastern Europe Televisions Market Market Share Comparison by Distribution Channel (2016-2032)
- Table 84: APAC Televisions Market Market Comparison by Product Type (2016-2032)
- Table 85: APAC Televisions Market Market Comparison by Screen Size (2016-2032)
- Table 86: APAC Televisions Market Market Comparison by Resolution (2016-2032)
- Table 87: APAC Televisions Market Market Comparison by Distribution Channel (2016-2032)
- Table 88: APAC Televisions Market Revenue (US$ Mn) Comparison by Country (2016-2032)
- Table 89: APAC Televisions Market Market Revenue (US$ Mn) (2016-2032)
- Table 90: APAC Televisions Market Market Revenue (US$ Mn) Comparison by Country (2016-2032)
- Table 91: APAC Televisions Market Market Revenue (US$ Mn) Comparison by Product Type (2016-2032)
- Table 92: APAC Televisions Market Market Revenue (US$ Mn) Comparison by Screen Size (2016-2032)
- Table 93: APAC Televisions Market Market Revenue (US$ Mn) Comparison by Resolution (2016-2032)
- Table 94: APAC Televisions Market Market Revenue (US$ Mn) Comparison by Distribution Channel (2016-2032)
- Table 95: APAC Televisions Market Market Y-o-Y Growth Rate Comparison by Country (2016-2032)
- Table 96: APAC Televisions Market Market Y-o-Y Growth Rate Comparison by Product Type (2016-2032)
- Table 97: APAC Televisions Market Market Y-o-Y Growth Rate Comparison by Screen Size (2016-2032)
- Table 98: APAC Televisions Market Market Y-o-Y Growth Rate Comparison by Resolution (2016-2032)
- Table 99: APAC Televisions Market Market Y-o-Y Growth Rate Comparison by Distribution Channel (2016-2032)
- Table 100: APAC Televisions Market Market Share Comparison by Country (2016-2032)
- Table 101: APAC Televisions Market Market Share Comparison by Product Type (2016-2032)
- Table 102: APAC Televisions Market Market Share Comparison by Screen Size (2016-2032)
- Table 103: APAC Televisions Market Market Share Comparison by Resolution (2016-2032)
- Table 104: APAC Televisions Market Market Share Comparison by Distribution Channel (2016-2032)
- Table 105: Latin America Televisions Market Market Comparison by Product Type (2016-2032)
- Table 106: Latin America Televisions Market Market Comparison by Screen Size (2016-2032)
- Table 107: Latin America Televisions Market Market Comparison by Resolution (2016-2032)
- Table 108: Latin America Televisions Market Market Comparison by Distribution Channel (2016-2032)
- Table 109: Latin America Televisions Market Revenue (US$ Mn) Comparison by Country (2016-2032)
- Table 110: Latin America Televisions Market Market Revenue (US$ Mn) (2016-2032)
- Table 111: Latin America Televisions Market Market Revenue (US$ Mn) Comparison by Country (2016-2032)
- Table 112: Latin America Televisions Market Market Revenue (US$ Mn) Comparison by Product Type (2016-2032)
- Table 113: Latin America Televisions Market Market Revenue (US$ Mn) Comparison by Screen Size (2016-2032)
- Table 114: Latin America Televisions Market Market Revenue (US$ Mn) Comparison by Resolution (2016-2032)
- Table 115: Latin America Televisions Market Market Revenue (US$ Mn) Comparison by Distribution Channel (2016-2032)
- Table 116: Latin America Televisions Market Market Y-o-Y Growth Rate Comparison by Country (2016-2032)
- Table 117: Latin America Televisions Market Market Y-o-Y Growth Rate Comparison by Product Type (2016-2032)
- Table 118: Latin America Televisions Market Market Y-o-Y Growth Rate Comparison by Screen Size (2016-2032)
- Table 119: Latin America Televisions Market Market Y-o-Y Growth Rate Comparison by Resolution (2016-2032)
- Table 120: Latin America Televisions Market Market Y-o-Y Growth Rate Comparison by Distribution Channel (2016-2032)
- Table 121: Latin America Televisions Market Market Share Comparison by Country (2016-2032)
- Table 122: Latin America Televisions Market Market Share Comparison by Product Type (2016-2032)
- Table 123: Latin America Televisions Market Market Share Comparison by Screen Size (2016-2032)
- Table 124: Latin America Televisions Market Market Share Comparison by Resolution (2016-2032)
- Table 125: Latin America Televisions Market Market Share Comparison by Distribution Channel (2016-2032)
- Table 126: Middle East & Africa Televisions Market Market Comparison by Product Type (2016-2032)
- Table 127: Middle East & Africa Televisions Market Market Comparison by Screen Size (2016-2032)
- Table 128: Middle East & Africa Televisions Market Market Comparison by Resolution (2016-2032)
- Table 129: Middle East & Africa Televisions Market Market Comparison by Distribution Channel (2016-2032)
- Table 130: Middle East & Africa Televisions Market Revenue (US$ Mn) Comparison by Country (2016-2032)
- Table 131: Middle East & Africa Televisions Market Market Revenue (US$ Mn) (2016-2032)
- Table 132: Middle East & Africa Televisions Market Market Revenue (US$ Mn) Comparison by Country (2016-2032)
- Table 133: Middle East & Africa Televisions Market Market Revenue (US$ Mn) Comparison by Product Type (2016-2032)
- Table 134: Middle East & Africa Televisions Market Market Revenue (US$ Mn) Comparison by Screen Size (2016-2032)
- Table 135: Middle East & Africa Televisions Market Market Revenue (US$ Mn) Comparison by Resolution (2016-2032)
- Table 136: Middle East & Africa Televisions Market Market Revenue (US$ Mn) Comparison by Distribution Channel (2016-2032)
- Table 137: Middle East & Africa Televisions Market Market Y-o-Y Growth Rate Comparison by Country (2016-2032)
- Table 138: Middle East & Africa Televisions Market Market Y-o-Y Growth Rate Comparison by Product Type (2016-2032)
- Table 139: Middle East & Africa Televisions Market Market Y-o-Y Growth Rate Comparison by Screen Size (2016-2032)
- Table 140: Middle East & Africa Televisions Market Market Y-o-Y Growth Rate Comparison by Resolution (2016-2032)
- Table 141: Middle East & Africa Televisions Market Market Y-o-Y Growth Rate Comparison by Distribution Channel (2016-2032)
- Table 142: Middle East & Africa Televisions Market Market Share Comparison by Country (2016-2032)
- Table 143: Middle East & Africa Televisions Market Market Share Comparison by Product Type (2016-2032)
- Table 144: Middle East & Africa Televisions Market Market Share Comparison by Screen Size (2016-2032)
- Table 145: Middle East & Africa Televisions Market Market Share Comparison by Resolution (2016-2032)
- Table 146: Middle East & Africa Televisions Market Market Share Comparison by Distribution Channel (2016-2032)
- 1. Executive Summary
-
- Samsung Electronics Co. Ltd.
- LG Corporation
- Sony Corporation
- TCL Corporation
- Panasonic Holdings Corporation
- Hisense International Co., Ltd.
- Sharp Corporation
- Vizio Inc.
- Skyworth Digital Holdings Ltd.
- Philips (TPV Technology Limited)
- Haier Smart Home Co., Ltd
Our Clients


View Our Licence Options
