
Technical Consumer Goods (TCG) Market By Product (Consumer Appliances, Home Equipment, Telecom, IT and Equipment), By IT (Gaming PC, Video Game Consoles, Loudspeakers, Consumables), By Region And Companies - Industry Segment Outlook, Market Assessment, Competition Scenario, Trends, And Forecast 2023-2032
-
39455
-
July 2023
-
137
-


-
This report was compiled by Research Team Research team of over 50 passionate professionals leverages advanced research methodologies and analytical expertise to deliver insightful, data-driven market intelligence that empowers businesses across diverse industries to make strategic, well-informed Correspondence Research Team Linkedin | Detailed Market research Methodology Our methodology involves a mix of primary research, including interviews with leading mental health experts, and secondary research from reputable medical journals and databases. View Detailed Methodology Page
-
Quick Navigation
Report Overview
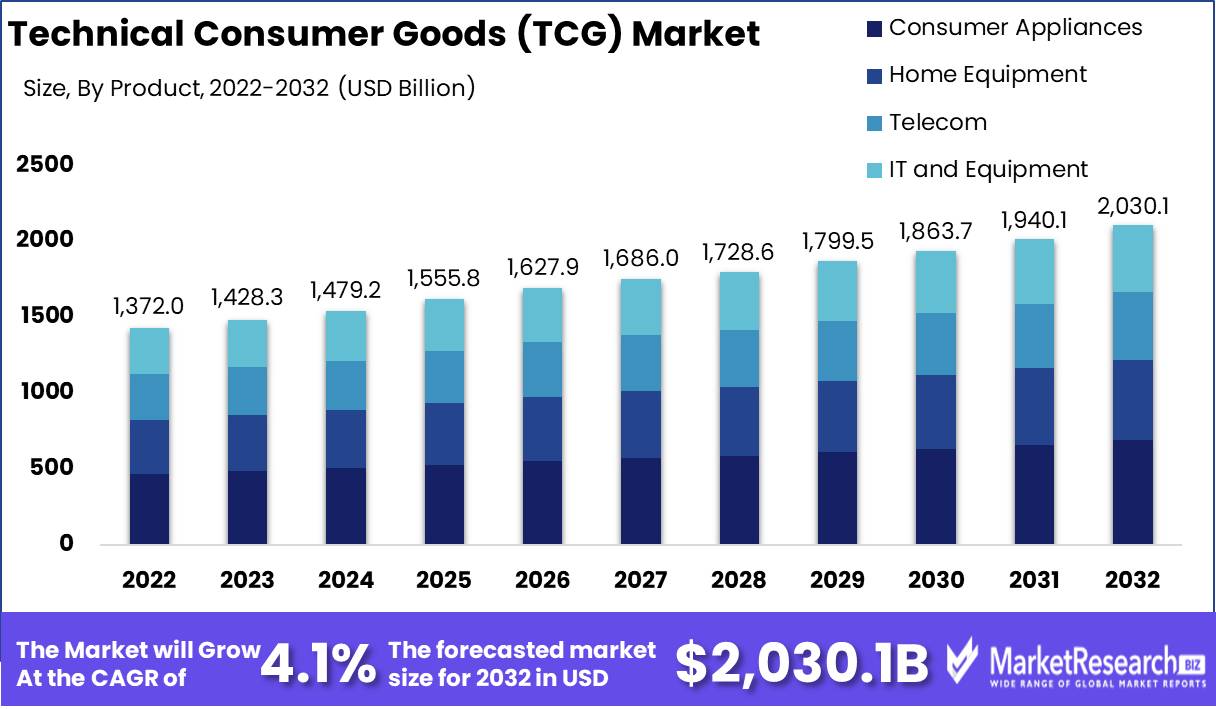
Technical Consumer Goods (TCG) Market size is expected to be worth around USD 2,030.1 Bn by 2032 from USD 1,372 Bn in 2022, growing at a CAGR of 4.1% during the forecast period from 2023 to 2032.
In the ever-changing world of technology, the market for Technical Consumer Goods (TCG) Market stands out as a major force. This article intends to provide a comprehensive overview of the TCG market, focusing on its definition, objectives, significance, benefits, innovations, investments, growth, applications, key drivers, ethical concerns, and business applications.
The primary objective of the TCG market is to offer consumers dependable, high-quality products that improve their daily lives. Companies in this market endeavor to satisfy the requirements and expectations of tech-savvy consumers by continuously innovating and enhancing existing technologies. This market also seeks to develop devices that are user-friendly, intuitive, and efficient.
The significance of the TCG market cannot be emphasized enough. As a result of technological advancements, consumers rely significantly on technical consumer goods in various aspects of their lives. From smartphones to smart home devices, these goods have become an integral part of contemporary life. In addition to providing entertainment and convenience, they enable us to remain connected, productive, and knowledgeable.
Innovation is at the heart of the TCG market, and companies endeavor ceaselessly to develop revolutionary products. Notable innovations in this market include the introduction of wearable technology, such as smartwatches and fitness monitors, and the incorporation of artificial intelligence (AI) and machine learning capabilities into consumer devices. These innovations have revolutionized the way consumers interact with technology and created new personalization and customization opportunities.
Multiple industries have invested significantly in the TCG market in an effort to implement these goods into their products and services. Incorporating sophisticated infotainment systems, sensor technology, and connectivity into vehicles, the automotive industry has embraced technical consumer goods. In a similar fashion, the healthcare industry has adopted wearable devices and connected medical equipment to enhance patient care and monitoring.
This market has experienced significant expansion as a result of rising consumer demand for updated and innovative technical consumer goods. The pervasive adoption of smart devices and the internet of things (IoT) has also contributed to the growth of the TCG market. Healthcare, retail, transportation, and entertainment are just a few of the industries that use these goods.
Driving factors
Relationship of Smartphones to Everyday Life
Our lifestyles, work routines, and entertainment experiences have been drastically altered by the rapid evolution of consumer electronics and appliances. Smartphones have rendered these small devices indispensable for daily life. They serve as our central communication center, seamlessly connecting us to the rest of the globe. As the prevalence of smartphones continues to rise, consumers rely on them for a variety of functions, including staying connected, accessing information, online purchasing, and even administering smart homes.
Redefining Consumer Purchasing Practices
The expansion of e-commerce and online retail platforms is another factor contributing to the rising demand for consumer electronics and home appliances. The rise of online purchasing has transformed the manner in which consumers acquire their desired goods. Consumers can compare prices, read reviews, and make informed decisions with just a few keystrokes. E-commerce platforms have made it immensely simple for consumers to purchase their preferred consumer electronics and home appliances from the comfort of their own residences.
A Trigger for Demand Explosion
Technology advancements and product innovation have played a crucial role in boosting the demand for consumer electronics and home appliances. Companies in the TCG market continually invest in R&D to introduce innovative products to market. These innovations range from streamlined designs and enhanced functionality to increased performance and energy efficiency. These technological advancements have captured the interest of consumers worldwide. The latest smartphones, tablets, and other tech-savvy devices are all available for purchase.
The Intelligent Home Revolution
In addition, the growing adoption of smart homes and connected devices has boosted demand for consumer electronics and appliances. Due to the proliferation of the Internet of Things (IoT), consumers can now control their devices via voice commands or smartphone applications. From intelligent lighting systems and thermostats to intelligent home security systems, these smart home devices provide consumers with greater convenience, energy efficiency, and peace of mind. As an increasing number of people embrace the concept of a connected home, the demand for compatible consumer electronics and appliances continues to rise.
Consumer Lifestyle Changes and TCG Market Trends
The ever-changing consumer lifestyles and preferences have had a substantial impact on the TCG market. Modern consumers desire convenience and seek products that incorporate seamlessly into their hectic lifestyles. They value devices that boost productivity, provide entertainment on the go, and streamline daily tasks. As consumers become more tech-savvy and adopt the digital age, their preferences and expectations for consumer electronics and appliances have changed. Manufacturers are responding to these shifting preferences by creating intuitive and user-friendly products that meet the requirements of contemporary consumers.
Restraining Factors
Concerns about price sensitivity and affordability
The market for Technical Consumer Goods (TCG) Market is unquestionably a prospering industry, offering a variety of innovative products to tech-savvy consumers around the globe. However, a number of factors can hinder its expansion and profitability. The potential price sensitivity and affordability concerns of consumers is one of the most significant obstacles manufacturers and retailers operating face. It is common knowledge that TCG products can be expensive. Whether they are purchasing smartphones, laptops, gaming consoles, or home appliances, consumers frequently consider cost, value for money, and long-term utility.
Market Saturation Potential in Mature Economies
The market for trading card games has experienced remarkable growth over the years, with product innovations continually capturing consumer interest. When it comes to market saturation, however, mature economies present a potential obstacle. In nations where TCG products have been widely available for an extended period of time, the market may become saturated, making it more difficult for new entrants or existing participants to acquire a significant market share.
Potential Compliance and Regulatory Requirements
Regulatory and compliance requirements play a crucial role in assuring consumer safety, product quality, and ethical business practices across all industries. The Technical Consumer Goods (TCG) Market is not an exception, as it must comply with numerous government and industry regulations. Failure to comply with these requirements may result in legal complications, reputational harm, and market share loss.
Possibile Difficulties in Supply Chain and Logistics
Supply chain and logistics efficiency are crucial to the success of any business, including those operating. Nonetheless, the complexity of the global supply chain and logistical operations may present obstacles that impede the smooth movement of goods from manufacturers to final consumers. Transportation costs, customs regulations, trade barriers, and inventory management can have a significant impact on the supply chain. Utilizing effective inventory management, strategic partnerships with logistics providers, and technology to expedite operations, businesses must optimize their supply chain.
Possible Rivalry from Counterfeit and Low-Quality Goods
Both manufacturers and consumers are perpetually threatened by the presence of counterfeit and low-quality alternatives. In addition to violating intellectual property rights, counterfeit products compromise consumer safety and satisfaction. In addition, the availability of alternatives of inferior quality can undermine the reputation and trust that reputable brands work so hard to establish. Companies operating in the Technical Consumer Goods (TCG) Market must combat this potential threat with proactive brand protection measures, stringent quality control procedures, and close collaboration with the appropriate authorities.
Product Analysis
The consumer appliances segment has emerged as a dominating force in the Technical Consumer Goods (TCG) market. With advances in technology and the increasing demand for convenience in everyday life, consumer appliances have become a necessity for households around the world. This analysis will delve into the factors that have contributed to the dominance of the consumer appliances segment in the TCG market, as well as the upcoming trends and growth prospects in this sector.
Consumer trends and behaviors also contribute to the dominance of the consumer appliances segment. With the hectic pace of modern life, consumers are constantly seeking ways to save time and make their lives easier. Consumer appliances, such as washing machines, refrigerators, and dishwashers, offer convenience and efficiency, allowing consumers to focus on other aspects of their lives. Additionally, rising environmental concerns have led to the adoption of energy-efficient appliances, further boosting the demand for consumer appliances.
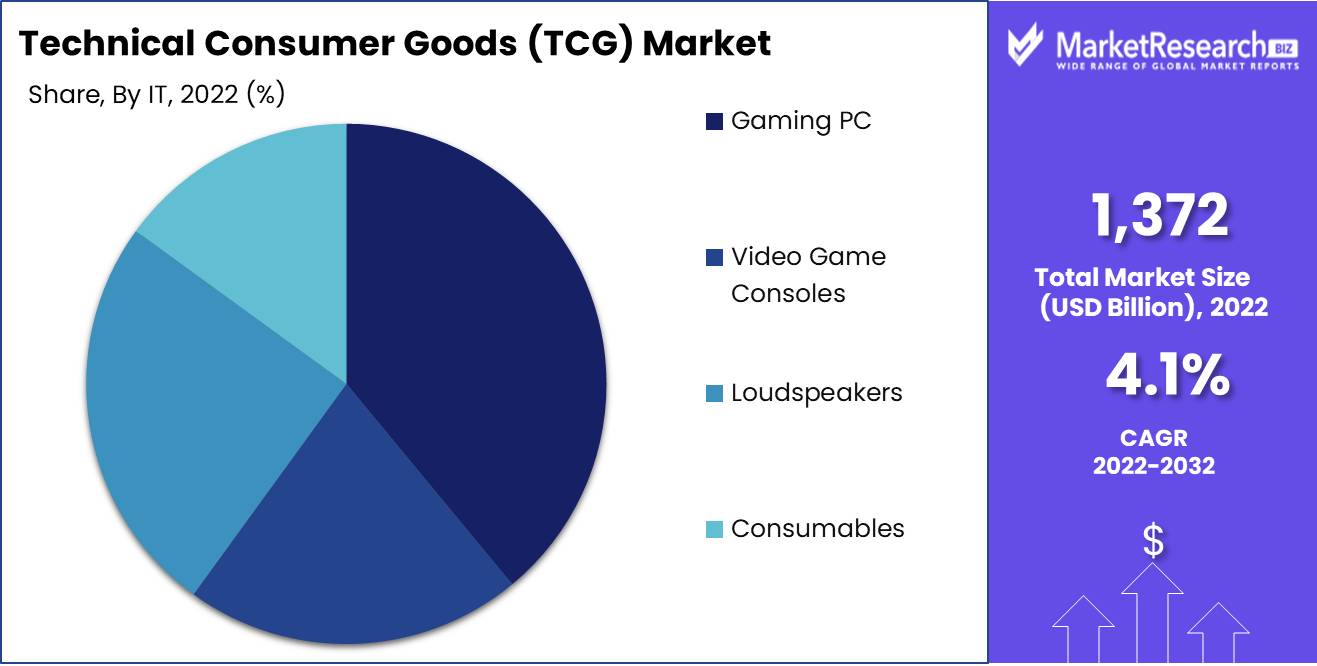
IT Analysis
The gaming PC segment has established its dominance in the Technical Consumer Goods (TCG) market. With the rise of the gaming industry and the increasing popularity of e-sports, gaming PCs have become essential for gamers and enthusiasts alike. This analysis will explore the factors that have led to the dominance of the gaming PC segment in Technical Consumer Goods (TCG) Market, as well as the emerging trends and growth prospects in this sector.
Consumer trends and behaviors play a significant role in the dominance of the gaming PC segment. The gaming community has grown exponentially, with gamers seeking immersive experiences and high-quality graphics. Gaming PCs offer the necessary hardware and specifications to meet these demands, making them an attractive choice for avid gamers. Additionally, the rise of streaming platforms and content creation has led to an increased demand for powerful gaming PCs that can handle resource-intensive tasks.
Key Market Segments
By Product
- Consumer Appliances
- Home Equipment
- Telecom
- IT and Equipment
By IT
- Gaming PC
- Video Game Consoles
- Loudspeakers
- Consumables
Growth Opportunity
Revolutionizing the Internet of Things (IoT)
Demand for smart devices and IoT-enabled TCG products increases in tandem with the rapid evolution of technology. The incorporation of Internet of Things (IoT) functionality into consumer goods opens the door to numerous new opportunities. TCG companies can revolutionize the market by emphasizing the development and integration of IoT features into their products. The ability to connect diverse devices and provide users with seamless control and monitoring capabilities paves the way for improved user experiences, personalized product recommendations, and the possibility of recurring revenue streams through service subscriptions.
Adoption of IoT makes data acquisition easier, allowing businesses to analyze consumer preferences and behavior patterns. This data-driven strategy permits TCG manufacturers to tailor and optimize their products to meet consumer demands, resulting in increased customer satisfaction and market share.
Increasing Digital Marketing Activities
Companies that fail to embrace the potential of Generative AI in digital marketing risk slipping behind in an increasingly digital world. TCG companies must maximize their digital presence and engagement strategies in light of the vast reach and potential of online marketing platforms. TCG companies can increase brand visibility, attract new consumers, and retain existing ones by utilizing search engine optimization (SEO) techniques, social media marketing, and influencer partnerships.
In addition, the creation of compelling and engaging content through premium copywriting contributes to the brand's position as a thought leader in the Technical Consumer Goods (TCG) Market. Consumers can be captivated by informative blog posts, product evaluations, and visually appealing videos, which can lead to higher organic search rankings and ultimately increase traffic to the business' website or e-commerce platform.
Utilizing Artificial Intelligence and Big Data Analytics
Globally, AI-powered technologies and advanced Generative AI in data analytics have revolutionized industries. Utilizing AI and big data analytics presents enormous growth potential in the Technical Consumer Goods (TCG) Market. TCG companies can obtain invaluable insights into market trends, consumer behavior, and demand patterns by leveraging these technologies.
Through AI-powered recommendation systems, TCG companies can offer individualized purchasing experiences catered to the preferences of each consumer. Not only does this increase customer satisfaction, but it also increases sales conversion rates. In addition, AI algorithms can be utilized to forecast future market trends and optimize supply chain management, thereby ensuring timely product availability and reducing expenses.
Latest Trends
Smartphones Have Revolutionized Connectivity
The exponential growth of smartphones has revolutionized consumers' access to and interaction with data. These potent devices, which facilitate communication, entertainment, and productivity, have become an indispensable part of people's lives. Smartphones have become the primary means of accessing digital content, such as social media, videos, and applications, due to their improved capabilities, processing speed, and seamless connectivity. Utilizing this pervasive device adoption, the proliferation of smartphones has created vast opportunities for businesses to target and interact with their audience.
Enhancing Multimedia Experiences
In tandem with smartphones, tablets have been acquiring traction in the Technical Consumer Goods (TCG) Market. These larger, more immersive devices have gained popularity among consumers who desire a portable, versatile option for web browsing, gaming, and media consumption. Tablets offer an enhanced multimedia experience with their larger displays and longer battery life, making them ideal for entertainment. In addition, professionals are increasingly using tablets for work-related duties, expanding their market share and utility.
Personalized Technology Relies on Wearable Devices
Wearable devices have emerged as a significant trend in Technical Consumer Goods (TCG) Market, providing consumers with a new method to incorporate technology into their daily activities. Wearables, such as fitness monitors and smartwatches, provide real-time data and personalized insights that empower individuals to take charge of their health, fitness, and well-being. Manufacturers are continuously integrating sophisticated features such as heart rate monitoring, sleep tracking, and GPS into these devices. As the demand for wearable technology continues to rise, the market is anticipated to be flooded with innovative devices that incorporate seamlessly into our daily lives.
Transforming the Connected Home
The proliferation of smart home appliances and Internet of Things (IoT)-enabled devices is transforming how we interact with our domestic environments. From voice-activated virtual assistants to smart thermostats, these interconnected devices offer convenience, automation, and increased energy efficiency. The Internet of Things (IoT) has enabled consumers to control their residences' lighting, temperature, security systems, and entertainment systems using their smartphones or vocal commands. This convergence of technologies has not only improved our daily lives but also paved the way for more eco-friendly and sustainable practices in the home.
Utilizing AI and Voice Assistants
In recent years, artificial intelligence (AI) and voice assistants have made remarkable progress, transforming how we interact with and control TCG products. With the incorporation of voice recognition technology enabled by AI, consumers can navigate their devices and access information using voice commands with ease. From voice-controlled devices to smart televisions, artificial intelligence and vocal assistants have become integral components of contemporary TCG products. This progressive integration not only improves the user experience, but also allows for seamless integration with other smart devices in the household, creating a genuinely interconnected ecosystem.
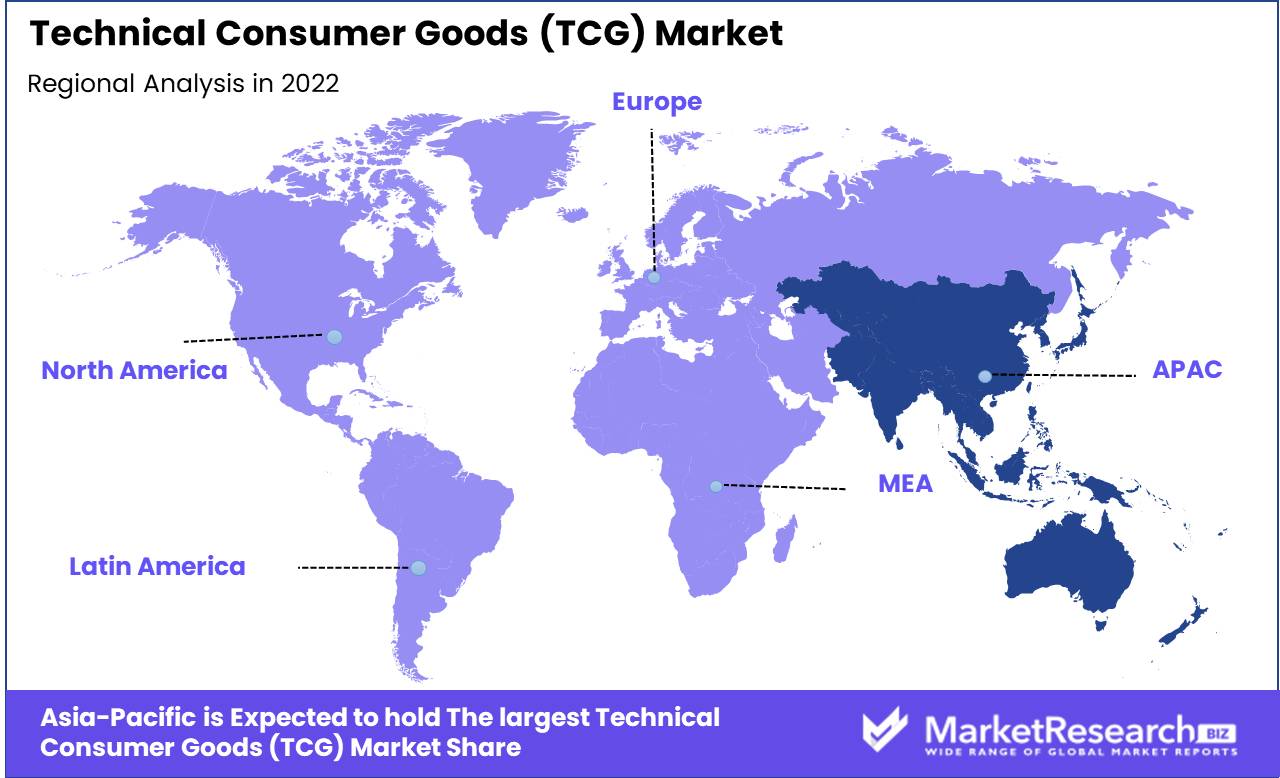
Regional Analysis
The Asia-Pacific region dominates the market for technical consumer goods. In today's fast-paced digital era, where technology is an integral part of our daily existence, the market for Technical Consumer Goods (TCG) Market has grown dramatically. The Asia-Pacific region has emerged as a dominant force in this industry, demonstrating its superiority in innovation, production, and consumer demand. With a swiftly transforming digital landscape and a growing middle class, the Asia-Pacific region has become a goldmine for TCG manufacturers and vendors.
Population density is one of the primary factors for the Asia-Pacific region's dominance in the TCG market. With a population of over 4.5 billion people, the region represents a vast consumer market eager for the most recent technological innovations. This population, in conjunction with rising disposable incomes and a growing predilection for a tech-savvy lifestyle, creates a perfect storm for TCG product demand.
In addition, the Asia-Pacific region is home to some of the world's largest emerging economies, including China and India. These economies have experienced rapid industrialization and substantial economic expansion. As a consequence, consumers in these nations are becoming increasingly early adopters of new TCG products, driving market growth.
The swiftly changing digital trends and e-commerce landscape in Asia-Pacific also contribute to the region's dominance in the Technical Consumer Goods (TCG) Market. Online marketplaces and retail platforms have acquired immense popularity, giving consumers simple access to a vast selection of goods. This digital transition has enabled TCG manufacturers to reach a larger audience and strengthen their brand presence throughout the region.
Asia-Pacific region's dedication to research and development (R&D) has played a significant role in its market dominance. Government initiatives and private sector investments in R&D have paved the way for ground-breaking innovations in various TCG sectors, including electronics, appliances, telecommunications, and personal devices. This dedication to innovation has positioned the region at the forefront of technological progress, making it a location for TCG manufacturers and garnering global attention.
Key Regions and Countries
North America
- US
- Canada
- Mexico
Western Europe
- Germany
- France
- The UK
- Spain
- Italy
- Portugal
- Ireland
- Austria
- Switzerland
- Benelux
- Nordic
- Rest of Western Europe
Eastern Europe
- Russia
- Poland
- The Czech Republic
- Greece
- Rest of Eastern Europe
APAC
- China
- Japan
- South Korea
- India
- Australia & New Zealand
- Indonesia
- Malaysia
- Philippines
- Singapore
- Thailand
- Vietnam
- Rest of APAC
Latin America
- Brazil
- Colombia
- Chile
- Argentina
- Costa Rica
- Rest of Latin America
Middle East & Africa
- Algeria
- Egypt
- Israel
- Kuwait
- Nigeria
- Saudi Arabia
- South Africa
- Turkey
- United Arab Emirates
- Rest of MEA
Key Players Analysis
Finnish IT startup Oura is known for its innovative sleep and health trackers. The Oura Ring, their main product, combines elegance and practicality to accurately track sleep quality, exercise, and well-being. Oura has become a major player in the TCG market by using innovative technology and AI-driven analytics to serve health-conscious consumers.
Neuro Metrix, Inc., a renowned US firm, is transforming the Technical Consumer Goods (TCG) Market with wearable neurotechnology solutions. Quell, an FDA-approved wearable gadget for chronic pain, is their main product. Quell targets pain at its source with modern sensor technology, improving quality of life for those in pain. Neuro Metrix, Inc. innovates TCG solutions that increase well-being.
US-based GlaxoSmithKline plc (GSK) has made great progress in linking healthcare and technology. GSK has developed digital health solutions that improve patient care and empower patients to manage their health through strategic partnerships and product development. GSK dominates the TCG market by using its pharmacological knowledge and cooperating with industry leaders.
Israel-based iPulse Medical advances telehealth and remote patient monitoring technologies. iPulse Medical's cutting-edge technology provide remote patient monitoring and real-time data analysis for healthcare professionals. iPulse Medical has established a niche in the Technical Consumer Goods (TCG) Market by increasing patient access and experience.
Through its revolutionary exercise and wellness solutions, US-based HEALBE has become a TCG market leader. GoBe3, the company's main gadget, measures calorie intake, hydration, and stress using patented technologies. HEALBE empowers people to make healthy living choices by giving them health and well-being information. HEALBE innovates to promote exercise and well-being.
These important firms are leading innovation in the TCG market, changing how customers use technology. Their drive to improving life and meeting individual demands in numerous sectors makes them industry leaders.
Top Key Players in Technical Consumer Goods (TCG) Market
- Oura (Finland)
- Neuro Metrix, Inc. (US)
- GlaxoSmithKline plc (US)
- iPulse Medical (Israel)
- HEALBE (US)
- VivoSense (US)
- VivaLNK (US)
- Findster Technologies (Portugal)
- FitBark (US)
- Reckitt Benckiser Group plc (UK)
- L’Oreal (France)
- La Roche Posay (France)
- Koninklijke Philips N.V. (Netherlands)
- Google (US)
- Apple Inc. (US)
- SAMSUNG. (South Korea)
Recent Development
- In 2023, Dyson announced its plans to launch a revolutionary range of TCG goods for domestic use. The company's continuous pursuit of improvement puts them at the forefront of technical advancements, but specifics are kept secret. Consumers anxiously anticipate the formal debut, which will deliver cutting-edge, user-friendly solutions to homes globally.
- In 2022, Samsung, a tech giant, surprised the market by expanding its Technical Consumer Goods production capacity in South Korea. The company's ambitious move shows its dedication to innovation and meeting client expectations as TCG demand rises. Samsung's TCG market dominance strengthens with this expansion, enabling it to provide cutting-edge products to tech-savvy consumers.
- In 2021, Apple and Google have collaborated on a groundbreaking TCG solution for enterprises. This innovative partnership improves company productivity, security, and efficiency. This alliance might change the business landscape with seamless integration and outstanding user experience by using both firms' capabilities.
- In 2020, Sony's acquisition of Dyson, a top TCG manufacturer, shook the market. Sony hopes to strengthen its position in the TCG market by leveraging Dyson's expertise and products. The firms hope to create a synergy that drives innovation and enriches consumers globally with cutting-edge experiences.
Report Scope
Report Features Description Market Value (2022) USD 1,372 Bn Forecast Revenue (2032) USD 2,030.1 Bn CAGR (2023-2032) 4.1% Base Year for Estimation 2022 Historic Period 2016-2022 Forecast Period 2023-2032 Report Coverage Revenue Forecast, Market Dynamics, COVID-19 Impact, Competitive Landscape, Recent Developments Segments Covered By Product (Consumer Appliances, Home Equipment, Telecom, IT and Equipment)
By IT (Gaming PC, Video Game Consoles, Loudspeakers, ConsumablesRegional Analysis North America – The US, Canada, & Mexico; Western Europe – Germany, France, The UK, Spain, Italy, Portugal, Ireland, Austria, Switzerland, Benelux, Nordic, & Rest of Western Europe; Eastern Europe – Russia, Poland, The Czech Republic, Greece, & Rest of Eastern Europe; APAC – China, Japan, South Korea, India, Australia & New Zealand, Indonesia, Malaysia, Philippines, Singapore, Thailand, Vietnam, & Rest of APAC; Latin America – Brazil, Colombia, Chile, Argentina, Costa Rica, & Rest of Latin America; Middle East & Africa – Algeria, Egypt, Israel, Kuwait, Nigeria, Saudi Arabia, South Africa, Turkey, United Arab Emirates, & Rest of MEA Competitive Landscape Oura (Finland), Neuro Metrix, Inc. (US), GlaxoSmithKline plc (US), iPulse Medical (Israel), HEALBE (US), VivoSense (US), VivaLNK (US), Findster Technologies (Portugal), FitBark (US), Reckitt Benckiser Group plc (UK), L’Oreal (France), La Roche Posay (France), Koninklijke Philips N.V. (Netherlands), Google (US), Apple Inc. (US), SAMSUNG. (South Korea) Customization Scope Customization for segments, region/country-level will be provided. Moreover, additional customization can be done based on the requirements. Purchase Options We have three licenses to opt for: Single User License, Multi-User License (Up to 5 Users), Corporate Use License (Unlimited User and Printable PDF) -
- 1. Executive Summary
- 1.1. Definition
- 1.2. Taxonomy
- 1.3. Research Scope
- 1.4. Key Analysis
- 1.5. Key Findings by Major Segments
- 1.6. Top strategies by Major Players
- 2. Global Technical Consumer Goods (TCG) Market Overview
- 2.1. Technical Consumer Goods (TCG) Market Dynamics
- 2.1.1. Drivers
- 2.1.2. Opportunities
- 2.1.3. Restraints
- 2.1.4. Challenges
- 2.2. Macro-economic Factors
- 2.3. Regulatory Framework
- 2.4. Market Investment Feasibility Index
- 2.5. PEST Analysis
- 2.6. PORTER’S Five Force Analysis
- 2.7. Drivers & Restraints Impact Analysis
- 2.8. Industry Chain Analysis
- 2.9. Cost Structure Analysis
- 2.10. Marketing Strategy
- 2.11. Russia-Ukraine War Impact Analysis
- 2.12. Opportunity Map Analysis
- 2.13. Market Competition Scenario Analysis
- 2.14. Product Life Cycle Analysis
- 2.15. Opportunity Orbits
- 2.16. Manufacturer Intensity Map
- 2.17. Major Companies sales by Value & Volume
- 2.1. Technical Consumer Goods (TCG) Market Dynamics
- 3. Global Technical Consumer Goods (TCG) Market Analysis, Opportunity and Forecast, 2016-2032
- 3.1. Global Technical Consumer Goods (TCG) Market Analysis, 2016-2021
- 3.2. Global Technical Consumer Goods (TCG) Market Opportunity and Forecast, 2023-2032
- 3.3. Global Technical Consumer Goods (TCG) Market Analysis, Opportunity and Forecast, By By Product, 2016-2032
- 3.3.1. Global Technical Consumer Goods (TCG) Market Analysis by By Product: Introduction
- 3.3.2. Market Size Absolute $ Opportunity Analysis and Forecast, By By Product, 2016-2032
- 3.3.3. Consumer Appliances
- 3.3.4. Home Equipment
- 3.3.5. Telecom
- 3.3.6. IT and Equipment
- 3.4. Global Technical Consumer Goods (TCG) Market Analysis, Opportunity and Forecast, By By IT, 2016-2032
- 3.4.1. Global Technical Consumer Goods (TCG) Market Analysis by By IT: Introduction
- 3.4.2. Market Size Absolute $ Opportunity Analysis and Forecast, By By IT, 2016-2032
- 3.4.3. Gaming PC
- 3.4.4. Video Game Consoles
- 3.4.5. Loudspeakers
- 3.4.6. Consumables
- 4. North America Technical Consumer Goods (TCG) Market Analysis, Opportunity and Forecast, 2016-2032
- 4.1. North America Technical Consumer Goods (TCG) Market Analysis, 2016-2021
- 4.2. North America Technical Consumer Goods (TCG) Market Opportunity and Forecast, 2023-2032
- 4.3. North America Technical Consumer Goods (TCG) Market Analysis, Opportunity and Forecast, By By Product, 2016-2032
- 4.3.1. North America Technical Consumer Goods (TCG) Market Analysis by By Product: Introduction
- 4.3.2. Market Size Absolute $ Opportunity Analysis and Forecast, By By Product, 2016-2032
- 4.3.3. Consumer Appliances
- 4.3.4. Home Equipment
- 4.3.5. Telecom
- 4.3.6. IT and Equipment
- 4.4. North America Technical Consumer Goods (TCG) Market Analysis, Opportunity and Forecast, By By IT, 2016-2032
- 4.4.1. North America Technical Consumer Goods (TCG) Market Analysis by By IT: Introduction
- 4.4.2. Market Size Absolute $ Opportunity Analysis and Forecast, By By IT, 2016-2032
- 4.4.3. Gaming PC
- 4.4.4. Video Game Consoles
- 4.4.5. Loudspeakers
- 4.4.6. Consumables
- 4.5. North America Technical Consumer Goods (TCG) Market Analysis, Opportunity and Forecast, By Country , 2016-2032
- 4.5.1. North America Technical Consumer Goods (TCG) Market Analysis by Country : Introduction
- 4.5.2. Market Size Absolute $ Opportunity Analysis and Forecast, Country , 2016-2032
- 4.5.2.1. The US
- 4.5.2.2. Canada
- 4.5.2.3. Mexico
- 5. Western Europe Technical Consumer Goods (TCG) Market Analysis, Opportunity and Forecast, 2016-2032
- 5.1. Western Europe Technical Consumer Goods (TCG) Market Analysis, 2016-2021
- 5.2. Western Europe Technical Consumer Goods (TCG) Market Opportunity and Forecast, 2023-2032
- 5.3. Western Europe Technical Consumer Goods (TCG) Market Analysis, Opportunity and Forecast, By By Product, 2016-2032
- 5.3.1. Western Europe Technical Consumer Goods (TCG) Market Analysis by By Product: Introduction
- 5.3.2. Market Size Absolute $ Opportunity Analysis and Forecast, By By Product, 2016-2032
- 5.3.3. Consumer Appliances
- 5.3.4. Home Equipment
- 5.3.5. Telecom
- 5.3.6. IT and Equipment
- 5.4. Western Europe Technical Consumer Goods (TCG) Market Analysis, Opportunity and Forecast, By By IT, 2016-2032
- 5.4.1. Western Europe Technical Consumer Goods (TCG) Market Analysis by By IT: Introduction
- 5.4.2. Market Size Absolute $ Opportunity Analysis and Forecast, By By IT, 2016-2032
- 5.4.3. Gaming PC
- 5.4.4. Video Game Consoles
- 5.4.5. Loudspeakers
- 5.4.6. Consumables
- 5.5. Western Europe Technical Consumer Goods (TCG) Market Analysis, Opportunity and Forecast, By Country , 2016-2032
- 5.5.1. Western Europe Technical Consumer Goods (TCG) Market Analysis by Country : Introduction
- 5.5.2. Market Size Absolute $ Opportunity Analysis and Forecast, Country , 2016-2032
- 5.5.2.1. Germany
- 5.5.2.2. France
- 5.5.2.3. The UK
- 5.5.2.4. Spain
- 5.5.2.5. Italy
- 5.5.2.6. Portugal
- 5.5.2.7. Ireland
- 5.5.2.8. Austria
- 5.5.2.9. Switzerland
- 5.5.2.10. Benelux
- 5.5.2.11. Nordic
- 5.5.2.12. Rest of Western Europe
- 6. Eastern Europe Technical Consumer Goods (TCG) Market Analysis, Opportunity and Forecast, 2016-2032
- 6.1. Eastern Europe Technical Consumer Goods (TCG) Market Analysis, 2016-2021
- 6.2. Eastern Europe Technical Consumer Goods (TCG) Market Opportunity and Forecast, 2023-2032
- 6.3. Eastern Europe Technical Consumer Goods (TCG) Market Analysis, Opportunity and Forecast, By By Product, 2016-2032
- 6.3.1. Eastern Europe Technical Consumer Goods (TCG) Market Analysis by By Product: Introduction
- 6.3.2. Market Size Absolute $ Opportunity Analysis and Forecast, By By Product, 2016-2032
- 6.3.3. Consumer Appliances
- 6.3.4. Home Equipment
- 6.3.5. Telecom
- 6.3.6. IT and Equipment
- 6.4. Eastern Europe Technical Consumer Goods (TCG) Market Analysis, Opportunity and Forecast, By By IT, 2016-2032
- 6.4.1. Eastern Europe Technical Consumer Goods (TCG) Market Analysis by By IT: Introduction
- 6.4.2. Market Size Absolute $ Opportunity Analysis and Forecast, By By IT, 2016-2032
- 6.4.3. Gaming PC
- 6.4.4. Video Game Consoles
- 6.4.5. Loudspeakers
- 6.4.6. Consumables
- 6.5. Eastern Europe Technical Consumer Goods (TCG) Market Analysis, Opportunity and Forecast, By Country , 2016-2032
- 6.5.1. Eastern Europe Technical Consumer Goods (TCG) Market Analysis by Country : Introduction
- 6.5.2. Market Size Absolute $ Opportunity Analysis and Forecast, Country , 2016-2032
- 6.5.2.1. Russia
- 6.5.2.2. Poland
- 6.5.2.3. The Czech Republic
- 6.5.2.4. Greece
- 6.5.2.5. Rest of Eastern Europe
- 7. APAC Technical Consumer Goods (TCG) Market Analysis, Opportunity and Forecast, 2016-2032
- 7.1. APAC Technical Consumer Goods (TCG) Market Analysis, 2016-2021
- 7.2. APAC Technical Consumer Goods (TCG) Market Opportunity and Forecast, 2023-2032
- 7.3. APAC Technical Consumer Goods (TCG) Market Analysis, Opportunity and Forecast, By By Product, 2016-2032
- 7.3.1. APAC Technical Consumer Goods (TCG) Market Analysis by By Product: Introduction
- 7.3.2. Market Size Absolute $ Opportunity Analysis and Forecast, By By Product, 2016-2032
- 7.3.3. Consumer Appliances
- 7.3.4. Home Equipment
- 7.3.5. Telecom
- 7.3.6. IT and Equipment
- 7.4. APAC Technical Consumer Goods (TCG) Market Analysis, Opportunity and Forecast, By By IT, 2016-2032
- 7.4.1. APAC Technical Consumer Goods (TCG) Market Analysis by By IT: Introduction
- 7.4.2. Market Size Absolute $ Opportunity Analysis and Forecast, By By IT, 2016-2032
- 7.4.3. Gaming PC
- 7.4.4. Video Game Consoles
- 7.4.5. Loudspeakers
- 7.4.6. Consumables
- 7.5. APAC Technical Consumer Goods (TCG) Market Analysis, Opportunity and Forecast, By Country , 2016-2032
- 7.5.1. APAC Technical Consumer Goods (TCG) Market Analysis by Country : Introduction
- 7.5.2. Market Size Absolute $ Opportunity Analysis and Forecast, Country , 2016-2032
- 7.5.2.1. China
- 7.5.2.2. Japan
- 7.5.2.3. South Korea
- 7.5.2.4. India
- 7.5.2.5. Australia & New Zeland
- 7.5.2.6. Indonesia
- 7.5.2.7. Malaysia
- 7.5.2.8. Philippines
- 7.5.2.9. Singapore
- 7.5.2.10. Thailand
- 7.5.2.11. Vietnam
- 7.5.2.12. Rest of APAC
- 8. Latin America Technical Consumer Goods (TCG) Market Analysis, Opportunity and Forecast, 2016-2032
- 8.1. Latin America Technical Consumer Goods (TCG) Market Analysis, 2016-2021
- 8.2. Latin America Technical Consumer Goods (TCG) Market Opportunity and Forecast, 2023-2032
- 8.3. Latin America Technical Consumer Goods (TCG) Market Analysis, Opportunity and Forecast, By By Product, 2016-2032
- 8.3.1. Latin America Technical Consumer Goods (TCG) Market Analysis by By Product: Introduction
- 8.3.2. Market Size Absolute $ Opportunity Analysis and Forecast, By By Product, 2016-2032
- 8.3.3. Consumer Appliances
- 8.3.4. Home Equipment
- 8.3.5. Telecom
- 8.3.6. IT and Equipment
- 8.4. Latin America Technical Consumer Goods (TCG) Market Analysis, Opportunity and Forecast, By By IT, 2016-2032
- 8.4.1. Latin America Technical Consumer Goods (TCG) Market Analysis by By IT: Introduction
- 8.4.2. Market Size Absolute $ Opportunity Analysis and Forecast, By By IT, 2016-2032
- 8.4.3. Gaming PC
- 8.4.4. Video Game Consoles
- 8.4.5. Loudspeakers
- 8.4.6. Consumables
- 8.5. Latin America Technical Consumer Goods (TCG) Market Analysis, Opportunity and Forecast, By Country , 2016-2032
- 8.5.1. Latin America Technical Consumer Goods (TCG) Market Analysis by Country : Introduction
- 8.5.2. Market Size Absolute $ Opportunity Analysis and Forecast, Country , 2016-2032
- 8.5.2.1. Brazil
- 8.5.2.2. Colombia
- 8.5.2.3. Chile
- 8.5.2.4. Argentina
- 8.5.2.5. Costa Rica
- 8.5.2.6. Rest of Latin America
- 9. Middle East & Africa Technical Consumer Goods (TCG) Market Analysis, Opportunity and Forecast, 2016-2032
- 9.1. Middle East & Africa Technical Consumer Goods (TCG) Market Analysis, 2016-2021
- 9.2. Middle East & Africa Technical Consumer Goods (TCG) Market Opportunity and Forecast, 2023-2032
- 9.3. Middle East & Africa Technical Consumer Goods (TCG) Market Analysis, Opportunity and Forecast, By By Product, 2016-2032
- 9.3.1. Middle East & Africa Technical Consumer Goods (TCG) Market Analysis by By Product: Introduction
- 9.3.2. Market Size Absolute $ Opportunity Analysis and Forecast, By By Product, 2016-2032
- 9.3.3. Consumer Appliances
- 9.3.4. Home Equipment
- 9.3.5. Telecom
- 9.3.6. IT and Equipment
- 9.4. Middle East & Africa Technical Consumer Goods (TCG) Market Analysis, Opportunity and Forecast, By By IT, 2016-2032
- 9.4.1. Middle East & Africa Technical Consumer Goods (TCG) Market Analysis by By IT: Introduction
- 9.4.2. Market Size Absolute $ Opportunity Analysis and Forecast, By By IT, 2016-2032
- 9.4.3. Gaming PC
- 9.4.4. Video Game Consoles
- 9.4.5. Loudspeakers
- 9.4.6. Consumables
- 9.5. Middle East & Africa Technical Consumer Goods (TCG) Market Analysis, Opportunity and Forecast, By Country , 2016-2032
- 9.5.1. Middle East & Africa Technical Consumer Goods (TCG) Market Analysis by Country : Introduction
- 9.5.2. Market Size Absolute $ Opportunity Analysis and Forecast, Country , 2016-2032
- 9.5.2.1. Algeria
- 9.5.2.2. Egypt
- 9.5.2.3. Israel
- 9.5.2.4. Kuwait
- 9.5.2.5. Nigeria
- 9.5.2.6. Saudi Arabia
- 9.5.2.7. South Africa
- 9.5.2.8. Turkey
- 9.5.2.9. The UAE
- 9.5.2.10. Rest of MEA
- 10. Global Technical Consumer Goods (TCG) Market Analysis, Opportunity and Forecast, By Region , 2016-2032
- 10.1. Global Technical Consumer Goods (TCG) Market Analysis by Region : Introduction
- 10.2. Market Size Absolute $ Opportunity Analysis and Forecast, By Region , 2016-2032
- 10.2.1. North America
- 10.2.2. Western Europe
- 10.2.3. Eastern Europe
- 10.2.4. APAC
- 10.2.5. Latin America
- 10.2.6. Middle East & Africa
- 11. Global Technical Consumer Goods (TCG) Market Competitive Landscape, Market Share Analysis, and Company Profiles
- 11.1. Market Share Analysis
- 11.2. Company Profiles
- 11.3. Oura (Finland)
- 11.3.1. Company Overview
- 11.3.2. Financial Highlights
- 11.3.3. Product Portfolio
- 11.3.4. SWOT Analysis
- 11.3.5. Key Strategies and Developments
- 11.4. Neuro Metrix, Inc. (US)
- 11.4.1. Company Overview
- 11.4.2. Financial Highlights
- 11.4.3. Product Portfolio
- 11.4.4. SWOT Analysis
- 11.4.5. Key Strategies and Developments
- 11.5. GlaxoSmithKline plc (US)
- 11.5.1. Company Overview
- 11.5.2. Financial Highlights
- 11.5.3. Product Portfolio
- 11.5.4. SWOT Analysis
- 11.5.5. Key Strategies and Developments
- 11.6. iPulse Medical (Israel)
- 11.6.1. Company Overview
- 11.6.2. Financial Highlights
- 11.6.3. Product Portfolio
- 11.6.4. SWOT Analysis
- 11.6.5. Key Strategies and Developments
- 11.7. HEALBE (US)
- 11.7.1. Company Overview
- 11.7.2. Financial Highlights
- 11.7.3. Product Portfolio
- 11.7.4. SWOT Analysis
- 11.7.5. Key Strategies and Developments
- 11.8. VivoSense (US)
- 11.8.1. Company Overview
- 11.8.2. Financial Highlights
- 11.8.3. Product Portfolio
- 11.8.4. SWOT Analysis
- 11.8.5. Key Strategies and Developments
- 11.9. VivaLNK (US)
- 11.9.1. Company Overview
- 11.9.2. Financial Highlights
- 11.9.3. Product Portfolio
- 11.9.4. SWOT Analysis
- 11.9.5. Key Strategies and Developments
- 11.10. Findster Technologies (Portugal)
- 11.10.1. Company Overview
- 11.10.2. Financial Highlights
- 11.10.3. Product Portfolio
- 11.10.4. SWOT Analysis
- 11.10.5. Key Strategies and Developments
- 11.11. FitBark (US)
- 11.11.1. Company Overview
- 11.11.2. Financial Highlights
- 11.11.3. Product Portfolio
- 11.11.4. SWOT Analysis
- 11.11.5. Key Strategies and Developments
- 11.12. Reckitt Benckiser Group plc (UK)
- 11.12.1. Company Overview
- 11.12.2. Financial Highlights
- 11.12.3. Product Portfolio
- 11.12.4. SWOT Analysis
- 11.12.5. Key Strategies and Developments
- 11.13. L’Oreal (France)
- 11.13.1. Company Overview
- 11.13.2. Financial Highlights
- 11.13.3. Product Portfolio
- 11.13.4. SWOT Analysis
- 11.13.5. Key Strategies and Developments
- 11.14. La Roche Posay (France)
- 11.14.1. Company Overview
- 11.14.2. Financial Highlights
- 11.14.3. Product Portfolio
- 11.14.4. SWOT Analysis
- 11.14.5. Key Strategies and Developments
- 11.15. Koninklijke Philips N.V. (Netherlands)
- 11.15.1. Company Overview
- 11.15.2. Financial Highlights
- 11.15.3. Product Portfolio
- 11.15.4. SWOT Analysis
- 11.15.5. Key Strategies and Developments
- 11.16. Google (US)
- 11.16.1. Company Overview
- 11.16.2. Financial Highlights
- 11.16.3. Product Portfolio
- 11.16.4. SWOT Analysis
- 11.16.5. Key Strategies and Developments
- 11.17. Apple Inc. (US)
- 11.17.1. Company Overview
- 11.17.2. Financial Highlights
- 11.17.3. Product Portfolio
- 11.17.4. SWOT Analysis
- 11.17.5. Key Strategies and Developments
- 11.18. SAMSUNG. (South Korea)
- 11.18.1. Company Overview
- 11.18.2. Financial Highlights
- 11.18.3. Product Portfolio
- 11.18.4. SWOT Analysis
- 11.18.5. Key Strategies and Developments
- 12. Assumptions and Acronyms
- 13. Research Methodology
- 14. Contact
- List of Figures
- Figure 1: Global Technical Consumer Goods (TCG) Market Revenue (US$ Mn) Market Share by By Product in 2022
- Figure 2: Global Technical Consumer Goods (TCG) Market Attractiveness Analysis by By Product, 2016-2032
- Figure 3: Global Technical Consumer Goods (TCG) Market Revenue (US$ Mn) Market Share by By ITin 2022
- Figure 4: Global Technical Consumer Goods (TCG) Market Attractiveness Analysis by By IT, 2016-2032
- Figure 5: Global Technical Consumer Goods (TCG) Market Revenue (US$ Mn) Market Share by Region in 2022
- Figure 6: Global Technical Consumer Goods (TCG) Market Attractiveness Analysis by Region, 2016-2032
- Figure 7: Global Technical Consumer Goods (TCG) Market Revenue (US$ Mn) (2016-2032)
- Figure 8: Global Technical Consumer Goods (TCG) Market Revenue (US$ Mn) Comparison by Region (2016-2032)
- Figure 9: Global Technical Consumer Goods (TCG) Market Revenue (US$ Mn) Comparison by By Product (2016-2032)
- Figure 10: Global Technical Consumer Goods (TCG) Market Revenue (US$ Mn) Comparison by By IT (2016-2032)
- Figure 11: Global Technical Consumer Goods (TCG) Market Y-o-Y Growth Rate Comparison by Region (2016-2032)
- Figure 12: Global Technical Consumer Goods (TCG) Market Y-o-Y Growth Rate Comparison by By Product (2016-2032)
- Figure 13: Global Technical Consumer Goods (TCG) Market Y-o-Y Growth Rate Comparison by By IT (2016-2032)
- Figure 14: Global Technical Consumer Goods (TCG) Market Share Comparison by Region (2016-2032)
- Figure 15: Global Technical Consumer Goods (TCG) Market Share Comparison by By Product (2016-2032)
- Figure 16: Global Technical Consumer Goods (TCG) Market Share Comparison by By IT (2016-2032)
- Figure 17: North America Technical Consumer Goods (TCG) Market Revenue (US$ Mn) Market Share by By Productin 2022
- Figure 18: North America Technical Consumer Goods (TCG) Market Attractiveness Analysis by By Product, 2016-2032
- Figure 19: North America Technical Consumer Goods (TCG) Market Revenue (US$ Mn) Market Share by By ITin 2022
- Figure 20: North America Technical Consumer Goods (TCG) Market Attractiveness Analysis by By IT, 2016-2032
- Figure 21: North America Technical Consumer Goods (TCG) Market Revenue (US$ Mn) Market Share by Country in 2022
- Figure 22: North America Technical Consumer Goods (TCG) Market Attractiveness Analysis by Country, 2016-2032
- Figure 23: North America Technical Consumer Goods (TCG) Market Revenue (US$ Mn) (2016-2032)
- Figure 24: North America Technical Consumer Goods (TCG) Market Revenue (US$ Mn) Comparison by Country (2016-2032)
- Figure 25: North America Technical Consumer Goods (TCG) Market Revenue (US$ Mn) Comparison by By Product (2016-2032)
- Figure 26: North America Technical Consumer Goods (TCG) Market Revenue (US$ Mn) Comparison by By IT (2016-2032)
- Figure 27: North America Technical Consumer Goods (TCG) Market Y-o-Y Growth Rate Comparison by Country (2016-2032)
- Figure 28: North America Technical Consumer Goods (TCG) Market Y-o-Y Growth Rate Comparison by By Product (2016-2032)
- Figure 29: North America Technical Consumer Goods (TCG) Market Y-o-Y Growth Rate Comparison by By IT (2016-2032)
- Figure 30: North America Technical Consumer Goods (TCG) Market Share Comparison by Country (2016-2032)
- Figure 31: North America Technical Consumer Goods (TCG) Market Share Comparison by By Product (2016-2032)
- Figure 32: North America Technical Consumer Goods (TCG) Market Share Comparison by By IT (2016-2032)
- Figure 33: Western Europe Technical Consumer Goods (TCG) Market Revenue (US$ Mn) Market Share by By Productin 2022
- Figure 34: Western Europe Technical Consumer Goods (TCG) Market Attractiveness Analysis by By Product, 2016-2032
- Figure 35: Western Europe Technical Consumer Goods (TCG) Market Revenue (US$ Mn) Market Share by By ITin 2022
- Figure 36: Western Europe Technical Consumer Goods (TCG) Market Attractiveness Analysis by By IT, 2016-2032
- Figure 37: Western Europe Technical Consumer Goods (TCG) Market Revenue (US$ Mn) Market Share by Country in 2022
- Figure 38: Western Europe Technical Consumer Goods (TCG) Market Attractiveness Analysis by Country, 2016-2032
- Figure 39: Western Europe Technical Consumer Goods (TCG) Market Revenue (US$ Mn) (2016-2032)
- Figure 40: Western Europe Technical Consumer Goods (TCG) Market Revenue (US$ Mn) Comparison by Country (2016-2032)
- Figure 41: Western Europe Technical Consumer Goods (TCG) Market Revenue (US$ Mn) Comparison by By Product (2016-2032)
- Figure 42: Western Europe Technical Consumer Goods (TCG) Market Revenue (US$ Mn) Comparison by By IT (2016-2032)
- Figure 43: Western Europe Technical Consumer Goods (TCG) Market Y-o-Y Growth Rate Comparison by Country (2016-2032)
- Figure 44: Western Europe Technical Consumer Goods (TCG) Market Y-o-Y Growth Rate Comparison by By Product (2016-2032)
- Figure 45: Western Europe Technical Consumer Goods (TCG) Market Y-o-Y Growth Rate Comparison by By IT (2016-2032)
- Figure 46: Western Europe Technical Consumer Goods (TCG) Market Share Comparison by Country (2016-2032)
- Figure 47: Western Europe Technical Consumer Goods (TCG) Market Share Comparison by By Product (2016-2032)
- Figure 48: Western Europe Technical Consumer Goods (TCG) Market Share Comparison by By IT (2016-2032)
- Figure 49: Eastern Europe Technical Consumer Goods (TCG) Market Revenue (US$ Mn) Market Share by By Productin 2022
- Figure 50: Eastern Europe Technical Consumer Goods (TCG) Market Attractiveness Analysis by By Product, 2016-2032
- Figure 51: Eastern Europe Technical Consumer Goods (TCG) Market Revenue (US$ Mn) Market Share by By ITin 2022
- Figure 52: Eastern Europe Technical Consumer Goods (TCG) Market Attractiveness Analysis by By IT, 2016-2032
- Figure 53: Eastern Europe Technical Consumer Goods (TCG) Market Revenue (US$ Mn) Market Share by Country in 2022
- Figure 54: Eastern Europe Technical Consumer Goods (TCG) Market Attractiveness Analysis by Country, 2016-2032
- Figure 55: Eastern Europe Technical Consumer Goods (TCG) Market Revenue (US$ Mn) (2016-2032)
- Figure 56: Eastern Europe Technical Consumer Goods (TCG) Market Revenue (US$ Mn) Comparison by Country (2016-2032)
- Figure 57: Eastern Europe Technical Consumer Goods (TCG) Market Revenue (US$ Mn) Comparison by By Product (2016-2032)
- Figure 58: Eastern Europe Technical Consumer Goods (TCG) Market Revenue (US$ Mn) Comparison by By IT (2016-2032)
- Figure 59: Eastern Europe Technical Consumer Goods (TCG) Market Y-o-Y Growth Rate Comparison by Country (2016-2032)
- Figure 60: Eastern Europe Technical Consumer Goods (TCG) Market Y-o-Y Growth Rate Comparison by By Product (2016-2032)
- Figure 61: Eastern Europe Technical Consumer Goods (TCG) Market Y-o-Y Growth Rate Comparison by By IT (2016-2032)
- Figure 62: Eastern Europe Technical Consumer Goods (TCG) Market Share Comparison by Country (2016-2032)
- Figure 63: Eastern Europe Technical Consumer Goods (TCG) Market Share Comparison by By Product (2016-2032)
- Figure 64: Eastern Europe Technical Consumer Goods (TCG) Market Share Comparison by By IT (2016-2032)
- Figure 65: APAC Technical Consumer Goods (TCG) Market Revenue (US$ Mn) Market Share by By Productin 2022
- Figure 66: APAC Technical Consumer Goods (TCG) Market Attractiveness Analysis by By Product, 2016-2032
- Figure 67: APAC Technical Consumer Goods (TCG) Market Revenue (US$ Mn) Market Share by By ITin 2022
- Figure 68: APAC Technical Consumer Goods (TCG) Market Attractiveness Analysis by By IT, 2016-2032
- Figure 69: APAC Technical Consumer Goods (TCG) Market Revenue (US$ Mn) Market Share by Country in 2022
- Figure 70: APAC Technical Consumer Goods (TCG) Market Attractiveness Analysis by Country, 2016-2032
- Figure 71: APAC Technical Consumer Goods (TCG) Market Revenue (US$ Mn) (2016-2032)
- Figure 72: APAC Technical Consumer Goods (TCG) Market Revenue (US$ Mn) Comparison by Country (2016-2032)
- Figure 73: APAC Technical Consumer Goods (TCG) Market Revenue (US$ Mn) Comparison by By Product (2016-2032)
- Figure 74: APAC Technical Consumer Goods (TCG) Market Revenue (US$ Mn) Comparison by By IT (2016-2032)
- Figure 75: APAC Technical Consumer Goods (TCG) Market Y-o-Y Growth Rate Comparison by Country (2016-2032)
- Figure 76: APAC Technical Consumer Goods (TCG) Market Y-o-Y Growth Rate Comparison by By Product (2016-2032)
- Figure 77: APAC Technical Consumer Goods (TCG) Market Y-o-Y Growth Rate Comparison by By IT (2016-2032)
- Figure 78: APAC Technical Consumer Goods (TCG) Market Share Comparison by Country (2016-2032)
- Figure 79: APAC Technical Consumer Goods (TCG) Market Share Comparison by By Product (2016-2032)
- Figure 80: APAC Technical Consumer Goods (TCG) Market Share Comparison by By IT (2016-2032)
- Figure 81: Latin America Technical Consumer Goods (TCG) Market Revenue (US$ Mn) Market Share by By Productin 2022
- Figure 82: Latin America Technical Consumer Goods (TCG) Market Attractiveness Analysis by By Product, 2016-2032
- Figure 83: Latin America Technical Consumer Goods (TCG) Market Revenue (US$ Mn) Market Share by By ITin 2022
- Figure 84: Latin America Technical Consumer Goods (TCG) Market Attractiveness Analysis by By IT, 2016-2032
- Figure 85: Latin America Technical Consumer Goods (TCG) Market Revenue (US$ Mn) Market Share by Country in 2022
- Figure 86: Latin America Technical Consumer Goods (TCG) Market Attractiveness Analysis by Country, 2016-2032
- Figure 87: Latin America Technical Consumer Goods (TCG) Market Revenue (US$ Mn) (2016-2032)
- Figure 88: Latin America Technical Consumer Goods (TCG) Market Revenue (US$ Mn) Comparison by Country (2016-2032)
- Figure 89: Latin America Technical Consumer Goods (TCG) Market Revenue (US$ Mn) Comparison by By Product (2016-2032)
- Figure 90: Latin America Technical Consumer Goods (TCG) Market Revenue (US$ Mn) Comparison by By IT (2016-2032)
- Figure 91: Latin America Technical Consumer Goods (TCG) Market Y-o-Y Growth Rate Comparison by Country (2016-2032)
- Figure 92: Latin America Technical Consumer Goods (TCG) Market Y-o-Y Growth Rate Comparison by By Product (2016-2032)
- Figure 93: Latin America Technical Consumer Goods (TCG) Market Y-o-Y Growth Rate Comparison by By IT (2016-2032)
- Figure 94: Latin America Technical Consumer Goods (TCG) Market Share Comparison by Country (2016-2032)
- Figure 95: Latin America Technical Consumer Goods (TCG) Market Share Comparison by By Product (2016-2032)
- Figure 96: Latin America Technical Consumer Goods (TCG) Market Share Comparison by By IT (2016-2032)
- Figure 97: Middle East & Africa Technical Consumer Goods (TCG) Market Revenue (US$ Mn) Market Share by By Productin 2022
- Figure 98: Middle East & Africa Technical Consumer Goods (TCG) Market Attractiveness Analysis by By Product, 2016-2032
- Figure 99: Middle East & Africa Technical Consumer Goods (TCG) Market Revenue (US$ Mn) Market Share by By ITin 2022
- Figure 100: Middle East & Africa Technical Consumer Goods (TCG) Market Attractiveness Analysis by By IT, 2016-2032
- Figure 101: Middle East & Africa Technical Consumer Goods (TCG) Market Revenue (US$ Mn) Market Share by Country in 2022
- Figure 102: Middle East & Africa Technical Consumer Goods (TCG) Market Attractiveness Analysis by Country, 2016-2032
- Figure 103: Middle East & Africa Technical Consumer Goods (TCG) Market Revenue (US$ Mn) (2016-2032)
- Figure 104: Middle East & Africa Technical Consumer Goods (TCG) Market Revenue (US$ Mn) Comparison by Country (2016-2032)
- Figure 105: Middle East & Africa Technical Consumer Goods (TCG) Market Revenue (US$ Mn) Comparison by By Product (2016-2032)
- Figure 106: Middle East & Africa Technical Consumer Goods (TCG) Market Revenue (US$ Mn) Comparison by By IT (2016-2032)
- Figure 107: Middle East & Africa Technical Consumer Goods (TCG) Market Y-o-Y Growth Rate Comparison by Country (2016-2032)
- Figure 108: Middle East & Africa Technical Consumer Goods (TCG) Market Y-o-Y Growth Rate Comparison by By Product (2016-2032)
- Figure 109: Middle East & Africa Technical Consumer Goods (TCG) Market Y-o-Y Growth Rate Comparison by By IT (2016-2032)
- Figure 110: Middle East & Africa Technical Consumer Goods (TCG) Market Share Comparison by Country (2016-2032)
- Figure 111: Middle East & Africa Technical Consumer Goods (TCG) Market Share Comparison by By Product (2016-2032)
- Figure 112: Middle East & Africa Technical Consumer Goods (TCG) Market Share Comparison by By IT (2016-2032)
- List of Tables
- Table 1: Global Technical Consumer Goods (TCG) Market Comparison by By Product (2016-2032)
- Table 2: Global Technical Consumer Goods (TCG) Market Comparison by By IT (2016-2032)
- Table 3: Global Technical Consumer Goods (TCG) Market Revenue (US$ Mn) Comparison by Region (2016-2032)
- Table 4: Global Technical Consumer Goods (TCG) Market Revenue (US$ Mn) (2016-2032)
- Table 5: Global Technical Consumer Goods (TCG) Market Revenue (US$ Mn) Comparison by Region (2016-2032)
- Table 6: Global Technical Consumer Goods (TCG) Market Revenue (US$ Mn) Comparison by By Product (2016-2032)
- Table 7: Global Technical Consumer Goods (TCG) Market Revenue (US$ Mn) Comparison by By IT (2016-2032)
- Table 8: Global Technical Consumer Goods (TCG) Market Y-o-Y Growth Rate Comparison by Region (2016-2032)
- Table 9: Global Technical Consumer Goods (TCG) Market Y-o-Y Growth Rate Comparison by By Product (2016-2032)
- Table 10: Global Technical Consumer Goods (TCG) Market Y-o-Y Growth Rate Comparison by By IT (2016-2032)
- Table 11: Global Technical Consumer Goods (TCG) Market Share Comparison by Region (2016-2032)
- Table 12: Global Technical Consumer Goods (TCG) Market Share Comparison by By Product (2016-2032)
- Table 13: Global Technical Consumer Goods (TCG) Market Share Comparison by By IT (2016-2032)
- Table 14: North America Technical Consumer Goods (TCG) Market Comparison by By IT (2016-2032)
- Table 15: North America Technical Consumer Goods (TCG) Market Revenue (US$ Mn) Comparison by Country (2016-2032)
- Table 16: North America Technical Consumer Goods (TCG) Market Revenue (US$ Mn) (2016-2032)
- Table 17: North America Technical Consumer Goods (TCG) Market Revenue (US$ Mn) Comparison by Country (2016-2032)
- Table 18: North America Technical Consumer Goods (TCG) Market Revenue (US$ Mn) Comparison by By Product (2016-2032)
- Table 19: North America Technical Consumer Goods (TCG) Market Revenue (US$ Mn) Comparison by By IT (2016-2032)
- Table 20: North America Technical Consumer Goods (TCG) Market Y-o-Y Growth Rate Comparison by Country (2016-2032)
- Table 21: North America Technical Consumer Goods (TCG) Market Y-o-Y Growth Rate Comparison by By Product (2016-2032)
- Table 22: North America Technical Consumer Goods (TCG) Market Y-o-Y Growth Rate Comparison by By IT (2016-2032)
- Table 23: North America Technical Consumer Goods (TCG) Market Share Comparison by Country (2016-2032)
- Table 24: North America Technical Consumer Goods (TCG) Market Share Comparison by By Product (2016-2032)
- Table 25: North America Technical Consumer Goods (TCG) Market Share Comparison by By IT (2016-2032)
- Table 26: Western Europe Technical Consumer Goods (TCG) Market Comparison by By Product (2016-2032)
- Table 27: Western Europe Technical Consumer Goods (TCG) Market Comparison by By IT (2016-2032)
- Table 28: Western Europe Technical Consumer Goods (TCG) Market Revenue (US$ Mn) Comparison by Country (2016-2032)
- Table 29: Western Europe Technical Consumer Goods (TCG) Market Revenue (US$ Mn) (2016-2032)
- Table 30: Western Europe Technical Consumer Goods (TCG) Market Revenue (US$ Mn) Comparison by Country (2016-2032)
- Table 31: Western Europe Technical Consumer Goods (TCG) Market Revenue (US$ Mn) Comparison by By Product (2016-2032)
- Table 32: Western Europe Technical Consumer Goods (TCG) Market Revenue (US$ Mn) Comparison by By IT (2016-2032)
- Table 33: Western Europe Technical Consumer Goods (TCG) Market Y-o-Y Growth Rate Comparison by Country (2016-2032)
- Table 34: Western Europe Technical Consumer Goods (TCG) Market Y-o-Y Growth Rate Comparison by By Product (2016-2032)
- Table 35: Western Europe Technical Consumer Goods (TCG) Market Y-o-Y Growth Rate Comparison by By IT (2016-2032)
- Table 36: Western Europe Technical Consumer Goods (TCG) Market Share Comparison by Country (2016-2032)
- Table 37: Western Europe Technical Consumer Goods (TCG) Market Share Comparison by By Product (2016-2032)
- Table 38: Western Europe Technical Consumer Goods (TCG) Market Share Comparison by By IT (2016-2032)
- Table 39: Eastern Europe Technical Consumer Goods (TCG) Market Comparison by By Product (2016-2032)
- Table 40: Eastern Europe Technical Consumer Goods (TCG) Market Comparison by By IT (2016-2032)
- Table 41: Eastern Europe Technical Consumer Goods (TCG) Market Revenue (US$ Mn) Comparison by Country (2016-2032)
- Table 42: Eastern Europe Technical Consumer Goods (TCG) Market Revenue (US$ Mn) (2016-2032)
- Table 43: Eastern Europe Technical Consumer Goods (TCG) Market Revenue (US$ Mn) Comparison by Country (2016-2032)
- Table 44: Eastern Europe Technical Consumer Goods (TCG) Market Revenue (US$ Mn) Comparison by By Product (2016-2032)
- Table 45: Eastern Europe Technical Consumer Goods (TCG) Market Revenue (US$ Mn) Comparison by By IT (2016-2032)
- Table 46: Eastern Europe Technical Consumer Goods (TCG) Market Y-o-Y Growth Rate Comparison by Country (2016-2032)
- Table 47: Eastern Europe Technical Consumer Goods (TCG) Market Y-o-Y Growth Rate Comparison by By Product (2016-2032)
- Table 48: Eastern Europe Technical Consumer Goods (TCG) Market Y-o-Y Growth Rate Comparison by By IT (2016-2032)
- Table 49: Eastern Europe Technical Consumer Goods (TCG) Market Share Comparison by Country (2016-2032)
- Table 50: Eastern Europe Technical Consumer Goods (TCG) Market Share Comparison by By Product (2016-2032)
- Table 51: Eastern Europe Technical Consumer Goods (TCG) Market Share Comparison by By IT (2016-2032)
- Table 52: APAC Technical Consumer Goods (TCG) Market Comparison by By Product (2016-2032)
- Table 53: APAC Technical Consumer Goods (TCG) Market Comparison by By IT (2016-2032)
- Table 54: APAC Technical Consumer Goods (TCG) Market Revenue (US$ Mn) Comparison by Country (2016-2032)
- Table 55: APAC Technical Consumer Goods (TCG) Market Revenue (US$ Mn) (2016-2032)
- Table 56: APAC Technical Consumer Goods (TCG) Market Revenue (US$ Mn) Comparison by Country (2016-2032)
- Table 57: APAC Technical Consumer Goods (TCG) Market Revenue (US$ Mn) Comparison by By Product (2016-2032)
- Table 58: APAC Technical Consumer Goods (TCG) Market Revenue (US$ Mn) Comparison by By IT (2016-2032)
- Table 59: APAC Technical Consumer Goods (TCG) Market Y-o-Y Growth Rate Comparison by Country (2016-2032)
- Table 60: APAC Technical Consumer Goods (TCG) Market Y-o-Y Growth Rate Comparison by By Product (2016-2032)
- Table 61: APAC Technical Consumer Goods (TCG) Market Y-o-Y Growth Rate Comparison by By IT (2016-2032)
- Table 62: APAC Technical Consumer Goods (TCG) Market Share Comparison by Country (2016-2032)
- Table 63: APAC Technical Consumer Goods (TCG) Market Share Comparison by By Product (2016-2032)
- Table 64: APAC Technical Consumer Goods (TCG) Market Share Comparison by By IT (2016-2032)
- Table 65: Latin America Technical Consumer Goods (TCG) Market Comparison by By Product (2016-2032)
- Table 66: Latin America Technical Consumer Goods (TCG) Market Comparison by By IT (2016-2032)
- Table 67: Latin America Technical Consumer Goods (TCG) Market Revenue (US$ Mn) Comparison by Country (2016-2032)
- Table 68: Latin America Technical Consumer Goods (TCG) Market Revenue (US$ Mn) (2016-2032)
- Table 69: Latin America Technical Consumer Goods (TCG) Market Revenue (US$ Mn) Comparison by Country (2016-2032)
- Table 70: Latin America Technical Consumer Goods (TCG) Market Revenue (US$ Mn) Comparison by By Product (2016-2032)
- Table 71: Latin America Technical Consumer Goods (TCG) Market Revenue (US$ Mn) Comparison by By IT (2016-2032)
- Table 72: Latin America Technical Consumer Goods (TCG) Market Y-o-Y Growth Rate Comparison by Country (2016-2032)
- Table 73: Latin America Technical Consumer Goods (TCG) Market Y-o-Y Growth Rate Comparison by By Product (2016-2032)
- Table 74: Latin America Technical Consumer Goods (TCG) Market Y-o-Y Growth Rate Comparison by By IT (2016-2032)
- Table 75: Latin America Technical Consumer Goods (TCG) Market Share Comparison by Country (2016-2032)
- Table 76: Latin America Technical Consumer Goods (TCG) Market Share Comparison by By Product (2016-2032)
- Table 77: Latin America Technical Consumer Goods (TCG) Market Share Comparison by By IT (2016-2032)
- Table 78: Middle East & Africa Technical Consumer Goods (TCG) Market Comparison by By Product (2016-2032)
- Table 79: Middle East & Africa Technical Consumer Goods (TCG) Market Comparison by By IT (2016-2032)
- Table 80: Middle East & Africa Technical Consumer Goods (TCG) Market Revenue (US$ Mn) Comparison by Country (2016-2032)
- Table 81: Middle East & Africa Technical Consumer Goods (TCG) Market Revenue (US$ Mn) (2016-2032)
- Table 82: Middle East & Africa Technical Consumer Goods (TCG) Market Revenue (US$ Mn) Comparison by Country (2016-2032)
- Table 83: Middle East & Africa Technical Consumer Goods (TCG) Market Revenue (US$ Mn) Comparison by By Product (2016-2032)
- Table 84: Middle East & Africa Technical Consumer Goods (TCG) Market Revenue (US$ Mn) Comparison by By IT (2016-2032)
- Table 85: Middle East & Africa Technical Consumer Goods (TCG) Market Y-o-Y Growth Rate Comparison by Country (2016-2032)
- Table 86: Middle East & Africa Technical Consumer Goods (TCG) Market Y-o-Y Growth Rate Comparison by By Product (2016-2032)
- Table 87: Middle East & Africa Technical Consumer Goods (TCG) Market Y-o-Y Growth Rate Comparison by By IT (2016-2032)
- Table 88: Middle East & Africa Technical Consumer Goods (TCG) Market Share Comparison by Country (2016-2032)
- Table 89: Middle East & Africa Technical Consumer Goods (TCG) Market Share Comparison by By Product (2016-2032)
- Table 90: Middle East & Africa Technical Consumer Goods (TCG) Market Share Comparison by By IT (2016-2032)
- 1. Executive Summary
-
- Oura (Finland)
- Neuro Metrix, Inc. (US)
- GlaxoSmithKline plc (US)
- iPulse Medical (Israel)
- HEALBE (US)
- VivoSense (US)
- VivaLNK (US)
- Findster Technologies (Portugal)
- FitBark (US)
- Reckitt Benckiser Group plc (UK)
- L’Oreal (France)
- La Roche Posay (France)
- Koninklijke Philips N.V. (Netherlands)
- Google (US)
- Apple Inc. (US)
- SAMSUNG. (South Korea)
Our Clients


View Our Licence Options
