Starch Derivatives Market Report By Type (Modified Starches, Sweeteners (e.g., High Fructose Corn Syrup, Glucose Syrup), Maltodextrins, Cyclodextrins, Starch Esters, Starch Ethers, Others), By Source (Corn, Wheat, Potato, Cassava, Rice, Others), By Application (Food and Beverage Industry, Pharmaceutical Industry, Paper Industry, Textile Industry, Personal Care and Cosmetics Industry, Animal Feed Industry, Others), By Functionality, By Region and Companies - Industry Segment Outlook, Market Assessment, Competition Scenario, Trends and Forecast 2024-2
-
46113
-
May 2024
-
322
-


-
This report was compiled by Shreyas Rokade Shreyas Rokade is a seasoned Research Analyst with CMFE, bringing extensive expertise in market research and consulting, with a strong background in Chemical Engineering. Correspondence Team Lead-CMFE Linkedin | Detailed Market research Methodology Our methodology involves a mix of primary research, including interviews with leading mental health experts, and secondary research from reputable medical journals and databases. View Detailed Methodology Page
-
Quick Navigation
Report Overview
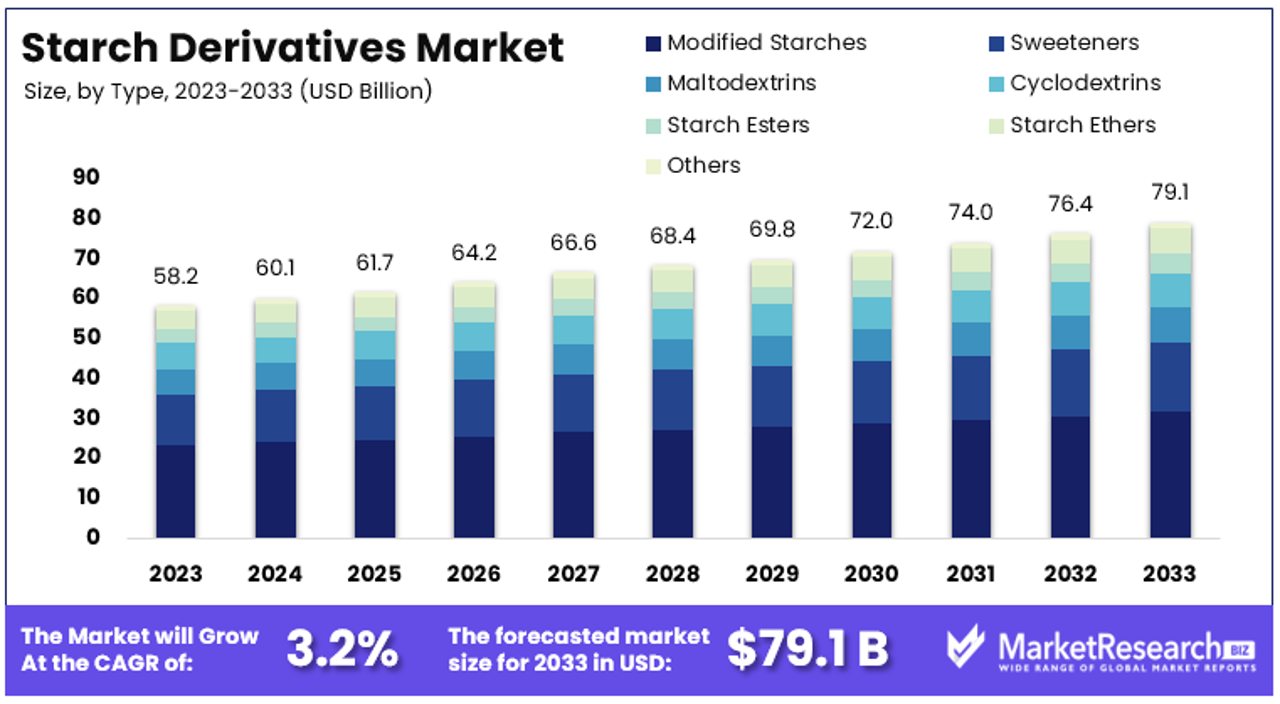
The Global Starch Derivatives Market size is expected to be worth around USD 79.1 Billion by 2033, from USD 58.2 Billion in 2023, growing at a CAGR of 3.2% during the forecast period from 2024 to 2033.
The Starch Derivatives Market involves the transformation of basic starch into various forms such as glucose, maltodextrin, and cyclodextrin. These derivatives are vital ingredients in industries ranging from food and beverage to pharmaceuticals, providing functionalities like thickening, binding, and stabilizing.
This market is driven by the growing demand for processed foods, biodegradable plastics, and biofuels, highlighting its dual role in enhancing product performance and sustainability. For executives, this market represents a significant opportunity to capitalize on the expanding applications of starch derivatives in both emerging and established markets.
The Starch Derivatives Market is witnessing substantial growth, driven by innovations in the food and pharmaceutical sectors. Starch derivatives, modified starches with enhanced properties, are increasingly used in various applications, including food, pharmaceuticals, and nutraceuticals.
In May 2024, Roquette, a global leader in plant-based ingredients, launched LycaGel Flex, a new hydroxypropyl pea starch premix. This product targets the pharmaceutical and nutraceutical industries, offering improved stability and functionality in drug formulations and dietary supplements. This innovation underscores the growing demand for advanced starch derivatives in enhancing product performance and meeting stringent industry standards.
Another significant development in May 2024 was Arcadia Biosciences' sale of its non-GMO Resistant Starch (RS) Durum Wheat trait to Corteva Agriscience for $4 million. Arcadia retains the right to use this trait in its GoodWheat product line, which includes pastas and mac & cheese. This strategic move highlights the increasing importance of resistant starches in the food industry, driven by rising consumer demand for healthier and functional food products.
The food industry remains a major driver of the starch derivatives market. Starch derivatives are widely used as thickeners, stabilizers, and emulsifiers in various food products. Their role in improving texture, shelf-life, and nutritional value aligns with current consumer preferences for high-quality and nutritious food options.
In the pharmaceutical industry, starch derivatives are essential in formulating excipients that enhance drug delivery and stability. The launch of innovative products like LycaGel Flex indicates a growing trend toward utilizing starch derivatives for advanced pharmaceutical applications.
Overall, the Starch Derivatives Market is poised for continued growth. The ongoing innovations and strategic partnerships in the industry underscore the expanding applications of starch derivatives, driven by increasing demand for functional and health-oriented products in both the food and pharmaceutical sectors.
Key Takeaways
- Market Value: The Global Starch Derivatives Market is expected to reach USD 79.1 Billion by 2033, growing at a CAGR of 3.2% from USD 58.2 Billion in 2023.
- Type Analysis: Maltodextrins dominate with 40% market share due to their versatile application in food, pharmaceuticals, and industrial products.
- Source Analysis: Corn leads as the primary source for starch derivatives, favored for its abundant availability and cost-effectiveness.
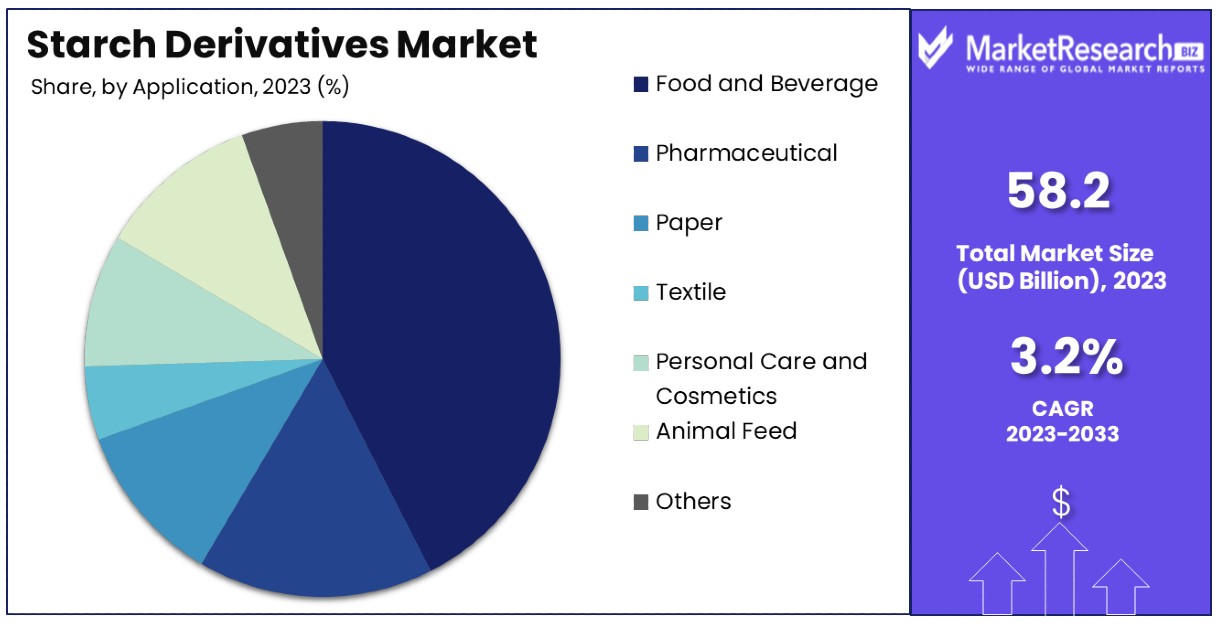
- Application Analysis: The Food and Beverage Industry dominates, driven by the increasing demand for processed and convenience foods.
- Functionality Analysis: Thickening agents lead in functionality due to their critical role in food production and industrial applications.
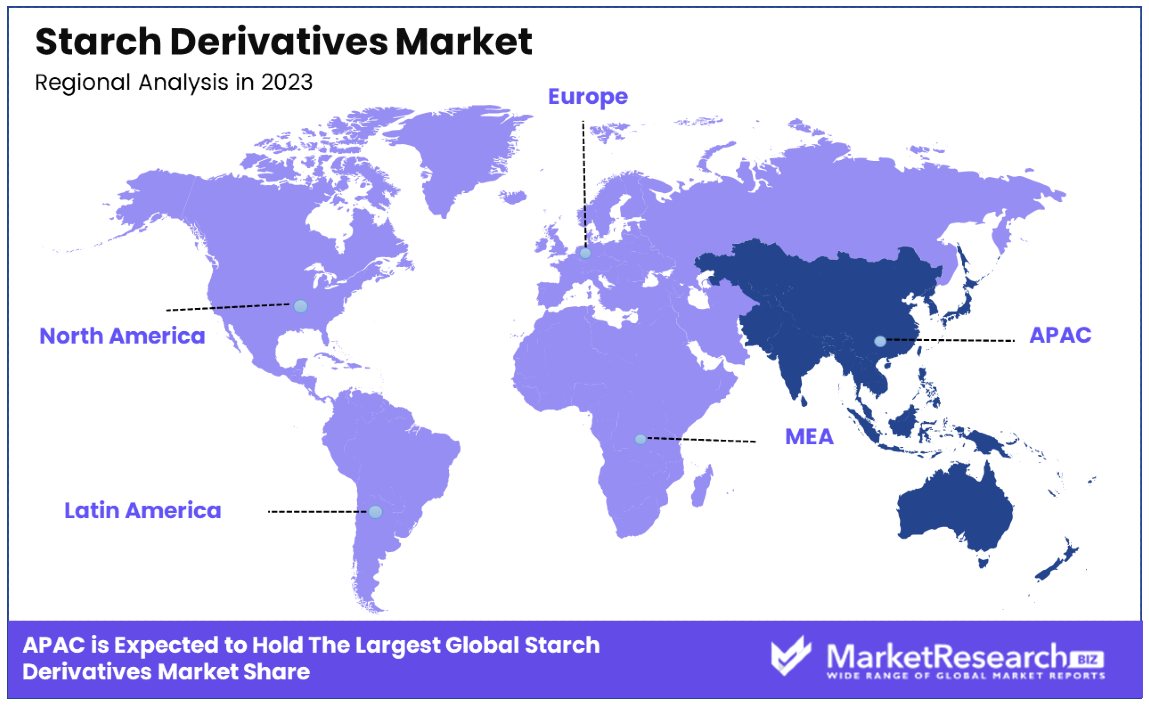
- APAC: Holds 39.5% market share, driven by increasing industrial applications and food consumption.
- Analyst Viewpoint: The market shows moderate growth with significant competition in the food and beverage sectors. Future growth will rely on innovation in product development and expanding applications.
Driving Factors
Increasing Demand from Food and Beverage Industry Drives Market Growth
The starch derivatives market is experiencing significant growth driven by the expanding food and beverage sector. Starch derivatives, such as modified starches, are essential in this industry due to their functionalities as thickeners, stabilizers, and texturizing agents. The surge in consumer preference for convenience foods further escalates this demand, as manufacturers seek ingredients that ensure product stability, texture, and extended shelf life.
Companies like Ingredion and Cargill are leading this trend by developing innovative starch derivatives tailored for dairy products and other food applications. This growth is largely fueled by the rising consumption of processed and packaged foods across various regions.
Expanding Application in Pharmaceutical and Cosmetic Industries Drives Market Growth
Starch derivatives are increasingly vital in the pharmaceutical and cosmetic industries, enhancing product functionality and consumer appeal. In pharmaceuticals, these compounds act as excipients, binders, and disintegrants in tablet formulations, supporting the development of sophisticated drug delivery systems. The cosmetic industry utilizes starch derivatives as thickeners, emulsifiers, and film formers, catering to consumer demands for high-quality personal care products.
Companies like Roquette are at the forefront, offering starch derivatives that facilitate controlled-release formulations and cosmetic enhancements. The market for starch derivatives in these sectors was estimated at $2.4 billion in 2021 and is expected to witness a growth of 7.2% CAGR over the next seven years, driven by innovations in drug formulation technologies and the increasing expenditure on personal care products globally.
Rise of Bio-based and Biodegradable Products Drives Market Growth
The shift towards sustainability has propelled the adoption of bio-based and biodegradable starch derivatives, marking a pivotal trend in the starch derivatives market. These eco-friendly alternatives are increasingly preferred in applications such as packaging, disposable products, and agricultural mulch films.
Companies like Gulshan Polyols Ltd. and Tate & Lyle are leading this transition by offering starch derivatives that not only meet environmental standards but also provide functional benefits comparable to conventional materials. The segment of bio-based starch derivatives has grown significantly, with the market expected to reach $1.5 billion by 2023, growing at a CAGR of 8.0%. This trend is driven by global environmental regulations and the growing consumer awareness and preference for sustainable products, highlighting the integral role of eco-friendly solutions in the market's expansion.
Restraining Factors
Fluctuating Raw Material Prices Restrains Market Growth
The instability in raw material costs is a major hurdle for the starch derivatives market. Key ingredients like corn, wheat, and potato are essential, but their prices are highly volatile, influenced by unpredictable weather, variable crop yields, and fluctuating supply-demand dynamics. For example, a drought in a major corn-producing region can significantly reduce supply, driving up prices and subsequently increasing production costs for companies such as Ingredion and Cargill.
This volatility not only affects the cost structure but also impacts the pricing strategy and profitability of starch derivative manufacturers. Market reports indicate that such fluctuations can lead to a 5-10% increase in production costs, potentially discouraging investment in the sector and slowing market growth.
Stringent Regulatory Norms Restrains Market Growth
Regulatory challenges significantly curb the growth prospects of the starch derivatives market. The food, pharmaceutical, and personal care industries face rigorous regulatory scrutiny over the use of additives, including starch derivatives. These regulations, which differ markedly across regions, govern product safety, labeling, and ingredient composition.
For instance, the European Union's tight regulations on modified starches in food products pose restrictions on market entry and limit the usage scope of certain starch derivatives. These stringent norms can delay product launches, increase compliance costs, and restrict market access, ultimately dampening market growth. Reports suggest that compliance with these regulations can increase operational costs by up to 15%, representing a significant barrier to market expansion.
Type Analysis
Maltodextrins dominate with 40% market share due to their versatile application in food, pharmaceuticals, and industrial products.
In the Starch Derivatives Market, the "Type" segment features various products, but Maltodextrins stand out as the dominant sub-segment. Accounting for approximately 40% of the market share, Maltodextrins are highly favored due to their excellent solubility, mild sweetness, and non-gritty mouthfeel, making them ideal for a wide range of applications. They are extensively used in food products as a bulking agent and flavor enhancer, in pharmaceuticals as a binding medium, and in industrial applications where high solubility is required. Their demand is driven by the growing food and beverage industry, particularly in convenience food and sports nutrition products, where maltodextrins serve as vital energy sources.
Other types such as Modified Starches, Sweeteners (like High Fructose Corn Syrup and Glucose Syrup), Cyclodextrins, Starch Esters, and Starch Ethers also play crucial roles in the market. Modified starches, for example, are widely used for their ability to withstand high temperatures and shear processes, making them suitable for canned foods and snacks. Sweeteners derived from starch, like glucose syrup and high fructose corn syrup, are pivotal in the beverage industry, owing to their ability to enhance flavor while providing cost-effective sweetness.
Source Analysis
Corn leads as the primary source for starch derivatives, favored for its abundant availability and cost-effectiveness.
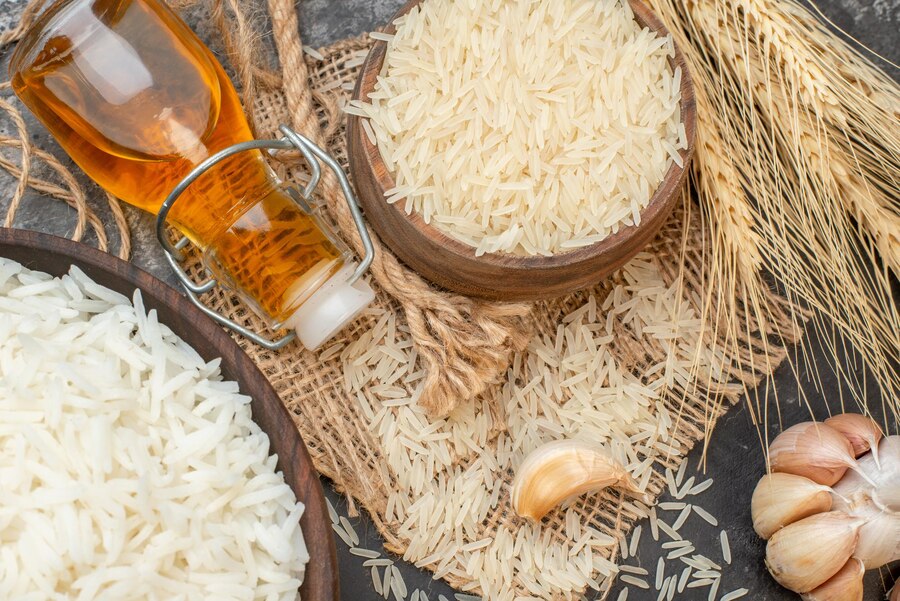
Corn is the leading source of starch derivatives, widely preferred for its abundant availability and relatively low cost, making it a staple in large-scale industrial applications. It is primarily used to produce a wide range of starch derivatives, including maltodextrins and high fructose corn syrup, which are integral to various industries. The versatility of corn starch in terms of modification capabilities also drives its dominance, allowing for the production of derivatives that meet specific industrial needs, such as increased thickening, adhesive properties, and texture enhancement.
Other sources like Wheat, Potato, Cassava, and Rice also contribute to the market, each offering unique characteristics that cater to specific industry requirements. Wheat starch is popular in the food industry for its viscoelastic properties, particularly in bakery products. Potato starch offers exceptional gelling and thickening properties, ideal for the food industry and certain pharmaceutical applications. Cassava and Rice starch are gaining traction in regions where they are more readily available, supporting local industries with cost-effective starch derivative solutions.
Application Analysis
The Food and Beverage Industry dominates the application segment, driven by the increasing demand for processed and convenience foods.
The Food and Beverage Industry emerges as the primary application segment for starch derivatives, primarily driven by the escalating demand for processed and convenience foods globally. This sector heavily relies on starch derivatives for various functionalities, including thickening, texturizing, and stabilizing agents, essential for maintaining the quality and stability of products during storage and handling. Maltodextrins, for instance, are extensively used in sports drinks and nutrition bars for their energy-releasing properties and minimal impact on taste.
While the Food and Beverage Industry holds the largest share, other applications like the Pharmaceutical Industry, Paper Industry, Textile Industry, Personal Care and Cosmetics Industry, and Animal Feed Industry also significantly contribute to the market's growth. In pharmaceuticals, starch derivatives are valued for their excipient properties, aiding in tablet formulation and drug delivery systems. The Paper and Textile industries utilize starch derivatives for their binding and adhesive properties, enhancing product quality and durability.
Functionality Analysis
Thickening agents lead in functionality due to their critical role in food production and industrial applications.
Thickening agents are paramount in the functionality segment of the Starch Derivatives Market, primarily due to their indispensable role across multiple industries, particularly in food production. These agents are crucial for improving the texture and consistency of a wide range of products, from sauces and soups to dairy products and desserts. Their ability to modify viscosity without altering other properties like color and flavor makes them particularly valuable in the food and beverage sector.
Other functionalities like stabilizing, gelling, binding, emulsifying, and film-forming also play vital roles in market dynamics. Stabilizers are essential in products that require a uniform dispersion of ingredients, particularly in cosmetic and pharmaceutical formulations. Gelling agents are critical in products needing a gel-like consistency, such as jellies and custards. Binders and emulsifiers are widely used in both food and industrial applications, where they aid in improving product integrity and consistency. Film-forming agents have seen increased usage in the pharmaceutical and cosmetic industries, where they contribute to the effectiveness and quality of coatings and films.
Key Market Segments
By Type
- Modified Starches
- Sweeteners (e.g., High Fructose Corn Syrup, Glucose Syrup)
- Maltodextrins
- Cyclodextrins
- Starch Esters
- Starch Ethers
- Others
By Source
- Corn
- Wheat
- Potato
- Cassava
- Rice
- Others
By Application
- Food and Beverage Industry
- Pharmaceutical Industry
- Paper Industry
- Textile Industry
- Personal Care and Cosmetics Industry
- Animal Feed Industry
- Others
By Functionality
- Thickening
- Stabilizing
- Gelling
- Binding
- Emulsifying
- Film-forming
- Others
Growth Opportunities
Development of Specialty Starch Derivatives Offers Growth Opportunity
The evolution of specialty starch derivatives provides significant growth prospects within the Starch Derivatives Market. As industries seek ingredients with specific characteristics, such as high temperature and pH resistance, the demand for customized starch derivatives is surging.
These specialized products find extensive applications across various sectors, notably in the food industry for creating extended-shelf-life bakery products and heat-resistant sauces. Ingredion, for example, has been at the forefront, developing starch derivatives that cater to the clean-label trend, emphasizing natural ingredients without compromising on functionality. The market for specialty starch derivatives is expected to grow at a CAGR of 6% over the next five years, driven by consumer demand for products that combine natural ingredients with enhanced performance features.
Adoption of Sustainable and Bio-based Starch Derivatives Offers Growth Opportunity
The shift towards sustainable and bio-based starch derivatives opens up expansive opportunities in the Starch Derivatives Market. With heightened environmental awareness, the demand for eco-friendly and renewable starch derivatives is increasing. These products are particularly appealing in sectors like packaging, agriculture, and disposables, where sustainability is progressively valued.
Roquette has capitalized on this trend by introducing bio-based starch derivatives used in compostable packaging and agricultural films, addressing both environmental concerns and market demand. This segment of the market is poised for robust growth, with projections indicating a surge in demand for bio-based products, expected to grow by 10% annually. Companies investing in sustainable solutions are likely to gain a competitive edge, appealing to the growing segment of eco-conscious consumers.
Trending Factors
Clean Label and Natural Ingredient Trends Are Trending Factors
The Clean Label and Natural Ingredient Trends are significant drivers shaping the Starch Derivatives Market. Consumers are increasingly opting for products with transparent labeling and natural ingredients, prompting manufacturers to develop starch derivatives derived from natural sources without synthetic additives.
This shift is particularly evident in the food and personal care industries, where companies like Ingredion are innovating to meet consumer preferences. The market for clean label starch derivatives is witnessing rapid growth, with an estimated CAGR of 8% over the next five years. This trend reflects changing consumer attitudes towards health and wellness, driving demand for cleaner, more natural alternatives in various product categories.
Personalized Nutrition and Functional Foods Are Trending Factors
The rise of Personalized Nutrition and Functional Foods is driving innovation in the Starch Derivatives Market. As consumers seek personalized health solutions, there is a growing demand for starch derivatives with specific functional properties tailored to meet individual dietary needs. Manufacturers are investing in research and development to create derivatives that offer benefits like improved digestibility, prebiotic effects, or controlled release of nutrients.
Avebe's development of resistant starch derivatives exemplifies this trend, offering consumers dietary fibers with prebiotic benefits. This market segment is poised for substantial growth, with projections indicating a CAGR of 9% in personalized nutrition products over the next five years. As personalized nutrition gains traction, starch derivative manufacturers stand to benefit from catering to this evolving consumer demand.
Regional Analysis
APAC Dominates with 39.5% Market Share
APAC's dominance in the Starch Derivatives Market can be attributed to several key factors. The region benefits from a robust manufacturing infrastructure, particularly in countries like China and India, which are major producers of starch derivatives. Additionally, the rising population and increasing disposable income levels in APAC countries drive demand for processed foods, pharmaceuticals, and personal care products, all of which utilize starch derivatives extensively. Moreover, favorable government policies and investments in agricultural production contribute to the region's strong market position.
APAC's market dominance is further influenced by its diverse and rapidly growing economies. China, as one of the largest consumers of starch derivatives globally, significantly shapes regional dynamics. The region's growing urbanization and changing consumer preferences towards convenience foods and functional products bolster the demand for starch derivatives. Furthermore, increasing investments in research and development activities aimed at enhancing product quality and functionality contribute to the region's competitive edge in the market.
Other Regions:
- North America: Holds 29.3% market share, driven by the mature food and beverage industry and increasing demand for clean label products.
- Europe: Accounts for 22.1% market share, influenced by stringent regulations promoting sustainable and bio-based products.
- Middle East & Africa: Represents 6.5% market share, characterized by growing industrialization and rising consumer awareness regarding health and wellness products.
- Latin America: Contributes 2.6% market share, with potential for growth driven by expanding food processing and pharmaceutical sectors.
Key Regions and Countries
- North America
- The US
- Canada
- Mexico
- Western Europe
- Germany
- France
- The UK
- Spain
- Italy
- Portugal
- Ireland
- Austria
- Switzerland
- Benelux
- Nordic
- Rest of Western Europe
- Eastern Europe
- Russia
- Poland
- The Czech Republic
- Greece
- Rest of Eastern Europe
- APAC
- China
- Japan
- South Korea
- India
- Australia & New Zealand
- Indonesia
- Malaysia
- Philippines
- Singapore
- Thailand
- Vietnam
- Rest of APAC
- Latin America
- Brazil
- Colombia
- Chile
- Argentina
- Costa Rica
- Rest of Latin America
- Middle East & Africa
- Algeria
- Egypt
- Israel
- Kuwait
- Nigeria
- Saudi Arabia
- South Africa
- Turkey
- United Arab Emirates
- Rest of MEA
Key Players Analysis
In the dynamic and competitive Starch Derivatives Market, several key players have carved out significant positions due to their strategic innovations, global reach, and specialized offerings. Archer Daniels Midland Company (ADM) and Cargill, Incorporated are at the forefront, operating extensive networks to source and process starches, which positions them effectively to meet global demand across various sectors, including food, beverages, and pharmaceuticals. Their comprehensive product portfolios and large-scale operations enable them to influence market trends significantly.
Ingredion Incorporated and Tate & Lyle PLC specialize in value-added starch derivatives, focusing on modified starches that cater to specific industry needs such as clean label products and functional food ingredients. Their commitment to R&D and customer-centric solutions allows them to maintain a competitive edge in innovation and application development.
European players like Roquette Frères and Agrana Beteiligungs-AG are pivotal in the market due to their focus on sustainability and high-quality products tailored for pharmaceuticals and nutrition. Roquette Frères, in particular, is recognized for its plant-based ingredients, which are crucial for meeting the rising demand for vegan and natural products.
Mid-sized companies such as Avebe U.A. and Emsland-Stärke GmbH emphasize niche markets, including textiles and paper, where specialized starch derivatives play critical roles. Their ability to cater to these specific sectors allows them to sustain strong positions in parts of the market less dominated by the largest conglomerates.
Emerging players like Global Bio-Chem Technology Group Company Limited and Tereos Group diversify the market landscape by focusing on bio-based chemicals and sustainable products, which appeal to environmentally conscious consumers and industries looking to reduce carbon footprints.
Together, these companies drive the starch derivatives market through a combination of broad-scale operations, specialization in high-value niches, and a strong emphasis on sustainability and innovation. This diverse approach not only caters to a wide array of industrial applications but also fosters robust competition and continuous advancement within the market.
Market Key Players
- Archer Daniels Midland Company (ADM)
- Cargill, Incorporated
- Ingredion Incorporated
- Tate & Lyle PLC
- Roquette Frères
- Agrana Beteiligungs-AG
- Avebe U.A.
- Grain Processing Corporation (GPC)
- Emsland-Stärke GmbH
- Südzucker AG
- Global Bio-Chem Technology Group Company Limited
- Tereos Group
- SPAC Starch Products (India) Ltd.
- Gulshan Polyols Ltd.
- Manildra Group
Recent Developments
- On May 2024, Roquette, a global leader in plant-based ingredients and a pioneer of plant proteins, announced the launch of LycaGel Flex, a new hydroxypropyl pea starch premix designed for the pharmaceutical and nutraceutical industries.
- On May 2024, Arcadia Biosciences, Inc. (Nasdaq: RKDA), a pioneering company in the production and marketing of plant-based health and wellness products, announced the sale of its non-GMO Resistant Starch (RS) Durum Wheat trait to its long-standing partner, Corteva Agriscience.
- On March 2024, Bio Plast Pom, a company based in Poland, announced the development of a new compostable and biodegradable packaging material derived from potato starch called NOPLA. This material is designed to comply with the EN 13432 composting standards and claims to degrade in 3 to 6 months under household composting conditions.
Report Scope
Report Features Description Market Value (2023) USD 58.2 Billion Forecast Revenue (2033) USD 79.1 Billion CAGR (2024-2033) 3.2% Base Year for Estimation 2023 Historic Period 2018-2023 Forecast Period 2024-2033 Report Coverage Revenue Forecast, Market Dynamics, Competitive Landscape, Recent Developments Segments Covered By Type (Modified Starches, Sweeteners (e.g., High Fructose Corn Syrup, Glucose Syrup), Maltodextrins, Cyclodextrins, Starch Esters, Starch Ethers, Others), By Source (Corn, Wheat, Potato, Cassava, Rice, Others), By Application (Food and Beverage Industry, Pharmaceutical Industry, Paper Industry, Textile Industry, Personal Care and Cosmetics Industry, Animal Feed Industry, Others), By Functionality (Thickening, Stabilizing, Gelling, Binding, Emulsifying, Film-forming, Others) Regional Analysis North America - The US, Canada, & Mexico; Western Europe - Germany, France, The UK, Spain, Italy, Portugal, Ireland, Austria, Switzerland, Benelux, Nordic, & Rest of Western Europe; Eastern Europe - Russia, Poland, The Czech Republic, Greece, & Rest of Eastern Europe; APAC - China, Japan, South Korea, India, Australia & New Zealand, Indonesia, Malaysia, Philippines, Singapore, Thailand, Vietnam, & Rest of APAC; Latin America - Brazil, Colombia, Chile, Argentina, Costa Rica, & Rest of Latin America; Middle East & Africa - Algeria, Egypt, Israel, Kuwait, Nigeria, Saudi Arabia, South Africa, Turkey, United Arab Emirates, & Rest of MEA Competitive Landscape Archer Daniels Midland Company (ADM), Cargill, Incorporated, Ingredion Incorporated, Tate & Lyle PLC, Roquette Frères, Agrana Beteiligungs-AG, Avebe U.A., Grain Processing Corporation (GPC), Emsland-Stärke GmbH, Südzucker AG, Global Bio-Chem Technology Group Company Limited, Tereos Group, SPAC Starch Products (India) Ltd., Gulshan Polyols Ltd., Manildra Group Customization Scope Customization for segments, region/country-level will be provided. Moreover, additional customization can be done based on the requirements. Purchase Options We have three licenses to opt for: Single User License, Multi-User License (Up to 5 Users), Corporate Use License (Unlimited User and Printable PDF) -
- 1. Executive Summary
- 1.1. Definition
- 1.2. Taxonomy
- 1.3. Research Scope
- 1.4. Key Analysis
- 1.5. Key Findings by Major Segments
- 1.6. Top strategies by Major Players
- 2. Global Starch Derivatives Market Overview
- 2.1. Starch Derivatives Market Dynamics
- 2.1.1. Drivers
- 2.1.2. Opportunities
- 2.1.3. Restraints
- 2.1.4. Challenges
- 2.2. Macro-economic Factors
- 2.3. Regulatory Framework
- 2.4. Market Investment Feasibility Index
- 2.5. PEST Analysis
- 2.6. PORTER’S Five Force Analysis
- 2.7. Drivers & Restraints Impact Analysis
- 2.8. Industry Chain Analysis
- 2.9. Cost Structure Analysis
- 2.10. Marketing Strategy
- 2.11. Russia-Ukraine War Impact Analysis
- 2.12. Opportunity Map Analysis
- 2.13. Market Competition Scenario Analysis
- 2.14. Product Life Cycle Analysis
- 2.15. Opportunity Orbits
- 2.16. Manufacturer Intensity Map
- 2.17. Major Companies sales by Value & Volume
- 2.1. Starch Derivatives Market Dynamics
- 3. Global Starch Derivatives Market Analysis, Opportunity and Forecast, 2016-2032
- 3.1. Global Starch Derivatives Market Analysis, 2016-2021
- 3.2. Global Starch Derivatives Market Opportunity and Forecast, 2023-2032
- 3.3. Global Starch Derivatives Market Analysis, Opportunity and Forecast, By Type, 2016-2032
- 3.3.1. Global Starch Derivatives Market Analysis by Type: Introduction
- 3.3.2. Market Size Absolute $ Opportunity Analysis and Forecast, By Type, 2016-2032
- 3.3.3. Modified Starches
- 3.3.4. Sweeteners
- 3.3.5. Maltodextrins
- 3.3.6. Cyclodextrins
- 3.3.7. Starch Esters
- 3.3.8. Starch Ethers
- 3.3.9. Others
- 3.4. Global Starch Derivatives Market Analysis, Opportunity and Forecast, By Source, 2016-2032
- 3.4.1. Global Starch Derivatives Market Analysis by Source: Introduction
- 3.4.2. Market Size Absolute $ Opportunity Analysis and Forecast, By Source, 2016-2032
- 3.4.3. Corn
- 3.4.4. Wheat
- 3.4.5. Potato
- 3.4.6. Cassava
- 3.4.7. Rice
- 3.4.8. Others
- 3.5. Global Starch Derivatives Market Analysis, Opportunity and Forecast, By Application, 2016-2032
- 3.5.1. Global Starch Derivatives Market Analysis by Application: Introduction
- 3.5.2. Market Size Absolute $ Opportunity Analysis and Forecast, By Application, 2016-2032
- 3.5.3. Food and Beverage Industry
- 3.5.4. Pharmaceutical Industry
- 3.5.5. Paper Industry
- 3.5.6. Textile Industry
- 3.5.7. Personal Care and Cosmetics Industry
- 3.5.8. Animal Feed Industry
- 3.5.9. Others
- 3.6. Global Starch Derivatives Market Analysis, Opportunity and Forecast, By Functionality, 2016-2032
- 3.6.1. Global Starch Derivatives Market Analysis by Functionality: Introduction
- 3.6.2. Market Size Absolute $ Opportunity Analysis and Forecast, By Functionality, 2016-2032
- 3.6.3. Thickening
- 3.6.4. Stabilizing
- 3.6.5. Gelling
- 3.6.6. Binding
- 3.6.7. Emulsifying
- 3.6.8. Film-forming
- 3.6.9. Others
- 4. North America Starch Derivatives Market Analysis, Opportunity and Forecast, 2016-2032
- 4.1. North America Starch Derivatives Market Analysis, 2016-2021
- 4.2. North America Starch Derivatives Market Opportunity and Forecast, 2023-2032
- 4.3. North America Starch Derivatives Market Analysis, Opportunity and Forecast, By Type, 2016-2032
- 4.3.1. North America Starch Derivatives Market Analysis by Type: Introduction
- 4.3.2. Market Size Absolute $ Opportunity Analysis and Forecast, By Type, 2016-2032
- 4.3.3. Modified Starches
- 4.3.4. Sweeteners
- 4.3.5. Maltodextrins
- 4.3.6. Cyclodextrins
- 4.3.7. Starch Esters
- 4.3.8. Starch Ethers
- 4.3.9. Others
- 4.4. North America Starch Derivatives Market Analysis, Opportunity and Forecast, By Source, 2016-2032
- 4.4.1. North America Starch Derivatives Market Analysis by Source: Introduction
- 4.4.2. Market Size Absolute $ Opportunity Analysis and Forecast, By Source, 2016-2032
- 4.4.3. Corn
- 4.4.4. Wheat
- 4.4.5. Potato
- 4.4.6. Cassava
- 4.4.7. Rice
- 4.4.8. Others
- 4.5. North America Starch Derivatives Market Analysis, Opportunity and Forecast, By Application, 2016-2032
- 4.5.1. North America Starch Derivatives Market Analysis by Application: Introduction
- 4.5.2. Market Size Absolute $ Opportunity Analysis and Forecast, By Application, 2016-2032
- 4.5.3. Food and Beverage Industry
- 4.5.4. Pharmaceutical Industry
- 4.5.5. Paper Industry
- 4.5.6. Textile Industry
- 4.5.7. Personal Care and Cosmetics Industry
- 4.5.8. Animal Feed Industry
- 4.5.9. Others
- 4.6. North America Starch Derivatives Market Analysis, Opportunity and Forecast, By Functionality, 2016-2032
- 4.6.1. North America Starch Derivatives Market Analysis by Functionality: Introduction
- 4.6.2. Market Size Absolute $ Opportunity Analysis and Forecast, By Functionality, 2016-2032
- 4.6.3. Thickening
- 4.6.4. Stabilizing
- 4.6.5. Gelling
- 4.6.6. Binding
- 4.6.7. Emulsifying
- 4.6.8. Film-forming
- 4.6.9. Others
- 4.7. North America Starch Derivatives Market Analysis, Opportunity and Forecast, By Country , 2016-2032
- 4.7.1. North America Starch Derivatives Market Analysis by Country : Introduction
- 4.7.2. Market Size Absolute $ Opportunity Analysis and Forecast, Country , 2016-2032
- 4.7.2.1. The US
- 4.7.2.2. Canada
- 4.7.2.3. Mexico
- 5. Western Europe Starch Derivatives Market Analysis, Opportunity and Forecast, 2016-2032
- 5.1. Western Europe Starch Derivatives Market Analysis, 2016-2021
- 5.2. Western Europe Starch Derivatives Market Opportunity and Forecast, 2023-2032
- 5.3. Western Europe Starch Derivatives Market Analysis, Opportunity and Forecast, By Type, 2016-2032
- 5.3.1. Western Europe Starch Derivatives Market Analysis by Type: Introduction
- 5.3.2. Market Size Absolute $ Opportunity Analysis and Forecast, By Type, 2016-2032
- 5.3.3. Modified Starches
- 5.3.4. Sweeteners
- 5.3.5. Maltodextrins
- 5.3.6. Cyclodextrins
- 5.3.7. Starch Esters
- 5.3.8. Starch Ethers
- 5.3.9. Others
- 5.4. Western Europe Starch Derivatives Market Analysis, Opportunity and Forecast, By Source, 2016-2032
- 5.4.1. Western Europe Starch Derivatives Market Analysis by Source: Introduction
- 5.4.2. Market Size Absolute $ Opportunity Analysis and Forecast, By Source, 2016-2032
- 5.4.3. Corn
- 5.4.4. Wheat
- 5.4.5. Potato
- 5.4.6. Cassava
- 5.4.7. Rice
- 5.4.8. Others
- 5.5. Western Europe Starch Derivatives Market Analysis, Opportunity and Forecast, By Application, 2016-2032
- 5.5.1. Western Europe Starch Derivatives Market Analysis by Application: Introduction
- 5.5.2. Market Size Absolute $ Opportunity Analysis and Forecast, By Application, 2016-2032
- 5.5.3. Food and Beverage Industry
- 5.5.4. Pharmaceutical Industry
- 5.5.5. Paper Industry
- 5.5.6. Textile Industry
- 5.5.7. Personal Care and Cosmetics Industry
- 5.5.8. Animal Feed Industry
- 5.5.9. Others
- 5.6. Western Europe Starch Derivatives Market Analysis, Opportunity and Forecast, By Functionality, 2016-2032
- 5.6.1. Western Europe Starch Derivatives Market Analysis by Functionality: Introduction
- 5.6.2. Market Size Absolute $ Opportunity Analysis and Forecast, By Functionality, 2016-2032
- 5.6.3. Thickening
- 5.6.4. Stabilizing
- 5.6.5. Gelling
- 5.6.6. Binding
- 5.6.7. Emulsifying
- 5.6.8. Film-forming
- 5.6.9. Others
- 5.7. Western Europe Starch Derivatives Market Analysis, Opportunity and Forecast, By Country , 2016-2032
- 5.7.1. Western Europe Starch Derivatives Market Analysis by Country : Introduction
- 5.7.2. Market Size Absolute $ Opportunity Analysis and Forecast, Country , 2016-2032
- 5.7.2.1. Germany
- 5.7.2.2. France
- 5.7.2.3. The UK
- 5.7.2.4. Spain
- 5.7.2.5. Italy
- 5.7.2.6. Portugal
- 5.7.2.7. Ireland
- 5.7.2.8. Austria
- 5.7.2.9. Switzerland
- 5.7.2.10. Benelux
- 5.7.2.11. Nordic
- 5.7.2.12. Rest of Western Europe
- 6. Eastern Europe Starch Derivatives Market Analysis, Opportunity and Forecast, 2016-2032
- 6.1. Eastern Europe Starch Derivatives Market Analysis, 2016-2021
- 6.2. Eastern Europe Starch Derivatives Market Opportunity and Forecast, 2023-2032
- 6.3. Eastern Europe Starch Derivatives Market Analysis, Opportunity and Forecast, By Type, 2016-2032
- 6.3.1. Eastern Europe Starch Derivatives Market Analysis by Type: Introduction
- 6.3.2. Market Size Absolute $ Opportunity Analysis and Forecast, By Type, 2016-2032
- 6.3.3. Modified Starches
- 6.3.4. Sweeteners
- 6.3.5. Maltodextrins
- 6.3.6. Cyclodextrins
- 6.3.7. Starch Esters
- 6.3.8. Starch Ethers
- 6.3.9. Others
- 6.4. Eastern Europe Starch Derivatives Market Analysis, Opportunity and Forecast, By Source, 2016-2032
- 6.4.1. Eastern Europe Starch Derivatives Market Analysis by Source: Introduction
- 6.4.2. Market Size Absolute $ Opportunity Analysis and Forecast, By Source, 2016-2032
- 6.4.3. Corn
- 6.4.4. Wheat
- 6.4.5. Potato
- 6.4.6. Cassava
- 6.4.7. Rice
- 6.4.8. Others
- 6.5. Eastern Europe Starch Derivatives Market Analysis, Opportunity and Forecast, By Application, 2016-2032
- 6.5.1. Eastern Europe Starch Derivatives Market Analysis by Application: Introduction
- 6.5.2. Market Size Absolute $ Opportunity Analysis and Forecast, By Application, 2016-2032
- 6.5.3. Food and Beverage Industry
- 6.5.4. Pharmaceutical Industry
- 6.5.5. Paper Industry
- 6.5.6. Textile Industry
- 6.5.7. Personal Care and Cosmetics Industry
- 6.5.8. Animal Feed Industry
- 6.5.9. Others
- 6.6. Eastern Europe Starch Derivatives Market Analysis, Opportunity and Forecast, By Functionality, 2016-2032
- 6.6.1. Eastern Europe Starch Derivatives Market Analysis by Functionality: Introduction
- 6.6.2. Market Size Absolute $ Opportunity Analysis and Forecast, By Functionality, 2016-2032
- 6.6.3. Thickening
- 6.6.4. Stabilizing
- 6.6.5. Gelling
- 6.6.6. Binding
- 6.6.7. Emulsifying
- 6.6.8. Film-forming
- 6.6.9. Others
- 6.7. Eastern Europe Starch Derivatives Market Analysis, Opportunity and Forecast, By Country , 2016-2032
- 6.7.1. Eastern Europe Starch Derivatives Market Analysis by Country : Introduction
- 6.7.2. Market Size Absolute $ Opportunity Analysis and Forecast, Country , 2016-2032
- 6.7.2.1. Russia
- 6.7.2.2. Poland
- 6.7.2.3. The Czech Republic
- 6.7.2.4. Greece
- 6.7.2.5. Rest of Eastern Europe
- 7. APAC Starch Derivatives Market Analysis, Opportunity and Forecast, 2016-2032
- 7.1. APAC Starch Derivatives Market Analysis, 2016-2021
- 7.2. APAC Starch Derivatives Market Opportunity and Forecast, 2023-2032
- 7.3. APAC Starch Derivatives Market Analysis, Opportunity and Forecast, By Type, 2016-2032
- 7.3.1. APAC Starch Derivatives Market Analysis by Type: Introduction
- 7.3.2. Market Size Absolute $ Opportunity Analysis and Forecast, By Type, 2016-2032
- 7.3.3. Modified Starches
- 7.3.4. Sweeteners
- 7.3.5. Maltodextrins
- 7.3.6. Cyclodextrins
- 7.3.7. Starch Esters
- 7.3.8. Starch Ethers
- 7.3.9. Others
- 7.4. APAC Starch Derivatives Market Analysis, Opportunity and Forecast, By Source, 2016-2032
- 7.4.1. APAC Starch Derivatives Market Analysis by Source: Introduction
- 7.4.2. Market Size Absolute $ Opportunity Analysis and Forecast, By Source, 2016-2032
- 7.4.3. Corn
- 7.4.4. Wheat
- 7.4.5. Potato
- 7.4.6. Cassava
- 7.4.7. Rice
- 7.4.8. Others
- 7.5. APAC Starch Derivatives Market Analysis, Opportunity and Forecast, By Application, 2016-2032
- 7.5.1. APAC Starch Derivatives Market Analysis by Application: Introduction
- 7.5.2. Market Size Absolute $ Opportunity Analysis and Forecast, By Application, 2016-2032
- 7.5.3. Food and Beverage Industry
- 7.5.4. Pharmaceutical Industry
- 7.5.5. Paper Industry
- 7.5.6. Textile Industry
- 7.5.7. Personal Care and Cosmetics Industry
- 7.5.8. Animal Feed Industry
- 7.5.9. Others
- 7.6. APAC Starch Derivatives Market Analysis, Opportunity and Forecast, By Functionality, 2016-2032
- 7.6.1. APAC Starch Derivatives Market Analysis by Functionality: Introduction
- 7.6.2. Market Size Absolute $ Opportunity Analysis and Forecast, By Functionality, 2016-2032
- 7.6.3. Thickening
- 7.6.4. Stabilizing
- 7.6.5. Gelling
- 7.6.6. Binding
- 7.6.7. Emulsifying
- 7.6.8. Film-forming
- 7.6.9. Others
- 7.7. APAC Starch Derivatives Market Analysis, Opportunity and Forecast, By Country , 2016-2032
- 7.7.1. APAC Starch Derivatives Market Analysis by Country : Introduction
- 7.7.2. Market Size Absolute $ Opportunity Analysis and Forecast, Country , 2016-2032
- 7.7.2.1. China
- 7.7.2.2. Japan
- 7.7.2.3. South Korea
- 7.7.2.4. India
- 7.7.2.5. Australia & New Zeland
- 7.7.2.6. Indonesia
- 7.7.2.7. Malaysia
- 7.7.2.8. Philippines
- 7.7.2.9. Singapore
- 7.7.2.10. Thailand
- 7.7.2.11. Vietnam
- 7.7.2.12. Rest of APAC
- 8. Latin America Starch Derivatives Market Analysis, Opportunity and Forecast, 2016-2032
- 8.1. Latin America Starch Derivatives Market Analysis, 2016-2021
- 8.2. Latin America Starch Derivatives Market Opportunity and Forecast, 2023-2032
- 8.3. Latin America Starch Derivatives Market Analysis, Opportunity and Forecast, By Type, 2016-2032
- 8.3.1. Latin America Starch Derivatives Market Analysis by Type: Introduction
- 8.3.2. Market Size Absolute $ Opportunity Analysis and Forecast, By Type, 2016-2032
- 8.3.3. Modified Starches
- 8.3.4. Sweeteners
- 8.3.5. Maltodextrins
- 8.3.6. Cyclodextrins
- 8.3.7. Starch Esters
- 8.3.8. Starch Ethers
- 8.3.9. Others
- 8.4. Latin America Starch Derivatives Market Analysis, Opportunity and Forecast, By Source, 2016-2032
- 8.4.1. Latin America Starch Derivatives Market Analysis by Source: Introduction
- 8.4.2. Market Size Absolute $ Opportunity Analysis and Forecast, By Source, 2016-2032
- 8.4.3. Corn
- 8.4.4. Wheat
- 8.4.5. Potato
- 8.4.6. Cassava
- 8.4.7. Rice
- 8.4.8. Others
- 8.5. Latin America Starch Derivatives Market Analysis, Opportunity and Forecast, By Application, 2016-2032
- 8.5.1. Latin America Starch Derivatives Market Analysis by Application: Introduction
- 8.5.2. Market Size Absolute $ Opportunity Analysis and Forecast, By Application, 2016-2032
- 8.5.3. Food and Beverage Industry
- 8.5.4. Pharmaceutical Industry
- 8.5.5. Paper Industry
- 8.5.6. Textile Industry
- 8.5.7. Personal Care and Cosmetics Industry
- 8.5.8. Animal Feed Industry
- 8.5.9. Others
- 8.6. Latin America Starch Derivatives Market Analysis, Opportunity and Forecast, By Functionality, 2016-2032
- 8.6.1. Latin America Starch Derivatives Market Analysis by Functionality: Introduction
- 8.6.2. Market Size Absolute $ Opportunity Analysis and Forecast, By Functionality, 2016-2032
- 8.6.3. Thickening
- 8.6.4. Stabilizing
- 8.6.5. Gelling
- 8.6.6. Binding
- 8.6.7. Emulsifying
- 8.6.8. Film-forming
- 8.6.9. Others
- 8.7. Latin America Starch Derivatives Market Analysis, Opportunity and Forecast, By Country , 2016-2032
- 8.7.1. Latin America Starch Derivatives Market Analysis by Country : Introduction
- 8.7.2. Market Size Absolute $ Opportunity Analysis and Forecast, Country , 2016-2032
- 8.7.2.1. Brazil
- 8.7.2.2. Colombia
- 8.7.2.3. Chile
- 8.7.2.4. Argentina
- 8.7.2.5. Costa Rica
- 8.7.2.6. Rest of Latin America
- 9. Middle East & Africa Starch Derivatives Market Analysis, Opportunity and Forecast, 2016-2032
- 9.1. Middle East & Africa Starch Derivatives Market Analysis, 2016-2021
- 9.2. Middle East & Africa Starch Derivatives Market Opportunity and Forecast, 2023-2032
- 9.3. Middle East & Africa Starch Derivatives Market Analysis, Opportunity and Forecast, By Type, 2016-2032
- 9.3.1. Middle East & Africa Starch Derivatives Market Analysis by Type: Introduction
- 9.3.2. Market Size Absolute $ Opportunity Analysis and Forecast, By Type, 2016-2032
- 9.3.3. Modified Starches
- 9.3.4. Sweeteners
- 9.3.5. Maltodextrins
- 9.3.6. Cyclodextrins
- 9.3.7. Starch Esters
- 9.3.8. Starch Ethers
- 9.3.9. Others
- 9.4. Middle East & Africa Starch Derivatives Market Analysis, Opportunity and Forecast, By Source, 2016-2032
- 9.4.1. Middle East & Africa Starch Derivatives Market Analysis by Source: Introduction
- 9.4.2. Market Size Absolute $ Opportunity Analysis and Forecast, By Source, 2016-2032
- 9.4.3. Corn
- 9.4.4. Wheat
- 9.4.5. Potato
- 9.4.6. Cassava
- 9.4.7. Rice
- 9.4.8. Others
- 9.5. Middle East & Africa Starch Derivatives Market Analysis, Opportunity and Forecast, By Application, 2016-2032
- 9.5.1. Middle East & Africa Starch Derivatives Market Analysis by Application: Introduction
- 9.5.2. Market Size Absolute $ Opportunity Analysis and Forecast, By Application, 2016-2032
- 9.5.3. Food and Beverage Industry
- 9.5.4. Pharmaceutical Industry
- 9.5.5. Paper Industry
- 9.5.6. Textile Industry
- 9.5.7. Personal Care and Cosmetics Industry
- 9.5.8. Animal Feed Industry
- 9.5.9. Others
- 9.6. Middle East & Africa Starch Derivatives Market Analysis, Opportunity and Forecast, By Functionality, 2016-2032
- 9.6.1. Middle East & Africa Starch Derivatives Market Analysis by Functionality: Introduction
- 9.6.2. Market Size Absolute $ Opportunity Analysis and Forecast, By Functionality, 2016-2032
- 9.6.3. Thickening
- 9.6.4. Stabilizing
- 9.6.5. Gelling
- 9.6.6. Binding
- 9.6.7. Emulsifying
- 9.6.8. Film-forming
- 9.6.9. Others
- 9.7. Middle East & Africa Starch Derivatives Market Analysis, Opportunity and Forecast, By Country , 2016-2032
- 9.7.1. Middle East & Africa Starch Derivatives Market Analysis by Country : Introduction
- 9.7.2. Market Size Absolute $ Opportunity Analysis and Forecast, Country , 2016-2032
- 9.7.2.1. Algeria
- 9.7.2.2. Egypt
- 9.7.2.3. Israel
- 9.7.2.4. Kuwait
- 9.7.2.5. Nigeria
- 9.7.2.6. Saudi Arabia
- 9.7.2.7. South Africa
- 9.7.2.8. Turkey
- 9.7.2.9. The UAE
- 9.7.2.10. Rest of MEA
- 10. Global Starch Derivatives Market Analysis, Opportunity and Forecast, By Region , 2016-2032
- 10.1. Global Starch Derivatives Market Analysis by Region : Introduction
- 10.2. Market Size Absolute $ Opportunity Analysis and Forecast, By Region , 2016-2032
- 10.2.1. North America
- 10.2.2. Western Europe
- 10.2.3. Eastern Europe
- 10.2.4. APAC
- 10.2.5. Latin America
- 10.2.6. Middle East & Africa
- 11. Global Starch Derivatives Market Competitive Landscape, Market Share Analysis, and Company Profiles
- 11.1. Market Share Analysis
- 11.2. Company Profiles
- 11.3. Archer Daniels Midland Company (ADM)
- 11.3.1. Company Overview
- 11.3.2. Financial Highlights
- 11.3.3. Product Portfolio
- 11.3.4. SWOT Analysis
- 11.3.5. Key Strategies and Developments
- 11.4. Cargill, Incorporated
- 11.4.1. Company Overview
- 11.4.2. Financial Highlights
- 11.4.3. Product Portfolio
- 11.4.4. SWOT Analysis
- 11.4.5. Key Strategies and Developments
- 11.5. Ingredion Incorporated
- 11.5.1. Company Overview
- 11.5.2. Financial Highlights
- 11.5.3. Product Portfolio
- 11.5.4. SWOT Analysis
- 11.5.5. Key Strategies and Developments
- 11.6. Tate & Lyle PLC
- 11.6.1. Company Overview
- 11.6.2. Financial Highlights
- 11.6.3. Product Portfolio
- 11.6.4. SWOT Analysis
- 11.6.5. Key Strategies and Developments
- 11.7. Roquette Frères
- 11.7.1. Company Overview
- 11.7.2. Financial Highlights
- 11.7.3. Product Portfolio
- 11.7.4. SWOT Analysis
- 11.7.5. Key Strategies and Developments
- 11.8. Agrana Beteiligungs-AG
- 11.8.1. Company Overview
- 11.8.2. Financial Highlights
- 11.8.3. Product Portfolio
- 11.8.4. SWOT Analysis
- 11.8.5. Key Strategies and Developments
- 11.9. Avebe U.A.
- 11.9.1. Company Overview
- 11.9.2. Financial Highlights
- 11.9.3. Product Portfolio
- 11.9.4. SWOT Analysis
- 11.9.5. Key Strategies and Developments
- 11.10. Grain Processing Corporation (GPC)
- 11.10.1. Company Overview
- 11.10.2. Financial Highlights
- 11.10.3. Product Portfolio
- 11.10.4. SWOT Analysis
- 11.10.5. Key Strategies and Developments
- 11.11. Emsland-Stärke GmbH
- 11.11.1. Company Overview
- 11.11.2. Financial Highlights
- 11.11.3. Product Portfolio
- 11.11.4. SWOT Analysis
- 11.11.5. Key Strategies and Developments
- 11.12. Südzucker AG
- 11.12.1. Company Overview
- 11.12.2. Financial Highlights
- 11.12.3. Product Portfolio
- 11.12.4. SWOT Analysis
- 11.12.5. Key Strategies and Developments
- 11.13.1. Company Overview
- 11.13.2. Financial Highlights
- 11.13.3. Product Portfolio
- 11.13.4. SWOT Analysis
- 11.13.5. Key Strategies and Developments
- 11.14. Global Bio-Chem Technology Group Company Limited
- 11.14.1. Company Overview
- 11.14.2. Financial Highlights
- 11.14.3. Product Portfolio
- 11.14.4. SWOT Analysis
- 11.14.5. Key Strategies and Developments
- 11.15. SPAC Starch Products (India) Ltd.
- 11.15.1. Company Overview
- 11.15.2. Financial Highlights
- 11.15.3. Product Portfolio
- 11.15.4. SWOT Analysis
- 11.15.5. Key Strategies and Developments
- 11.16. Gulshan Polyols Ltd.
- 11.16.1. Company Overview
- 11.16.2. Financial Highlights
- 11.16.3. Product Portfolio
- 11.16.4. SWOT Analysis
- 11.16.5. Key Strategies and Developments
- 11.17. Manildra Group
- 11.17.1. Company Overview
- 11.17.2. Financial Highlights
- 11.17.3. Product Portfolio
- 11.17.4. SWOT Analysis
- 11.17.5. Key Strategies and Developments
- 12. Assumptions and Acronyms
- 13. Research Methodology
- 14. Contact
- List of Figures
- Figure 1: Global Starch Derivatives Market Revenue (US$ Mn) Market Share by Type in 2022
- Figure 2: Global Starch Derivatives Market Attractiveness Analysis by Type, 2016-2032
- Figure 3: Global Starch Derivatives Market Revenue (US$ Mn) Market Share by Sourcein 2022
- Figure 4: Global Starch Derivatives Market Attractiveness Analysis by Source, 2016-2032
- Figure 5: Global Starch Derivatives Market Revenue (US$ Mn) Market Share by Applicationin 2022
- Figure 6: Global Starch Derivatives Market Attractiveness Analysis by Application, 2016-2032
- Figure 7: Global Starch Derivatives Market Revenue (US$ Mn) Market Share by Functionalityin 2022
- Figure 8: Global Starch Derivatives Market Attractiveness Analysis by Functionality, 2016-2032
- Figure 9: Global Starch Derivatives Market Revenue (US$ Mn) Market Share by Region in 2022
- Figure 10: Global Starch Derivatives Market Attractiveness Analysis by Region, 2016-2032
- Figure 11: Global Starch Derivatives Market Revenue (US$ Mn) (2016-2032)
- Figure 12: Global Starch Derivatives Market Revenue (US$ Mn) Comparison by Region (2016-2032)
- Figure 13: Global Starch Derivatives Market Revenue (US$ Mn) Comparison by Type (2016-2032)
- Figure 14: Global Starch Derivatives Market Revenue (US$ Mn) Comparison by Source (2016-2032)
- Figure 15: Global Starch Derivatives Market Revenue (US$ Mn) Comparison by Application (2016-2032)
- Figure 16: Global Starch Derivatives Market Revenue (US$ Mn) Comparison by Functionality (2016-2032)
- Figure 17: Global Starch Derivatives Market Y-o-Y Growth Rate Comparison by Region (2016-2032)
- Figure 18: Global Starch Derivatives Market Y-o-Y Growth Rate Comparison by Type (2016-2032)
- Figure 19: Global Starch Derivatives Market Y-o-Y Growth Rate Comparison by Source (2016-2032)
- Figure 20: Global Starch Derivatives Market Y-o-Y Growth Rate Comparison by Application (2016-2032)
- Figure 21: Global Starch Derivatives Market Y-o-Y Growth Rate Comparison by Functionality (2016-2032)
- Figure 22: Global Starch Derivatives Market Share Comparison by Region (2016-2032)
- Figure 23: Global Starch Derivatives Market Share Comparison by Type (2016-2032)
- Figure 24: Global Starch Derivatives Market Share Comparison by Source (2016-2032)
- Figure 25: Global Starch Derivatives Market Share Comparison by Application (2016-2032)
- Figure 26: Global Starch Derivatives Market Share Comparison by Functionality (2016-2032)
- Figure 27: North America Starch Derivatives Market Revenue (US$ Mn) Market Share by Typein 2022
- Figure 28: North America Starch Derivatives Market Attractiveness Analysis by Type, 2016-2032
- Figure 29: North America Starch Derivatives Market Revenue (US$ Mn) Market Share by Sourcein 2022
- Figure 30: North America Starch Derivatives Market Attractiveness Analysis by Source, 2016-2032
- Figure 31: North America Starch Derivatives Market Revenue (US$ Mn) Market Share by Applicationin 2022
- Figure 32: North America Starch Derivatives Market Attractiveness Analysis by Application, 2016-2032
- Figure 33: North America Starch Derivatives Market Revenue (US$ Mn) Market Share by Functionalityin 2022
- Figure 34: North America Starch Derivatives Market Attractiveness Analysis by Functionality, 2016-2032
- Figure 35: North America Starch Derivatives Market Revenue (US$ Mn) Market Share by Country in 2022
- Figure 36: North America Starch Derivatives Market Attractiveness Analysis by Country, 2016-2032
- Figure 37: North America Starch Derivatives Market Revenue (US$ Mn) (2016-2032)
- Figure 38: North America Starch Derivatives Market Revenue (US$ Mn) Comparison by Country (2016-2032)
- Figure 39: North America Starch Derivatives Market Revenue (US$ Mn) Comparison by Type (2016-2032)
- Figure 40: North America Starch Derivatives Market Revenue (US$ Mn) Comparison by Source (2016-2032)
- Figure 41: North America Starch Derivatives Market Revenue (US$ Mn) Comparison by Application (2016-2032)
- Figure 42: North America Starch Derivatives Market Revenue (US$ Mn) Comparison by Functionality (2016-2032)
- Figure 43: North America Starch Derivatives Market Y-o-Y Growth Rate Comparison by Country (2016-2032)
- Figure 44: North America Starch Derivatives Market Y-o-Y Growth Rate Comparison by Type (2016-2032)
- Figure 45: North America Starch Derivatives Market Y-o-Y Growth Rate Comparison by Source (2016-2032)
- Figure 46: North America Starch Derivatives Market Y-o-Y Growth Rate Comparison by Application (2016-2032)
- Figure 47: North America Starch Derivatives Market Y-o-Y Growth Rate Comparison by Functionality (2016-2032)
- Figure 48: North America Starch Derivatives Market Share Comparison by Country (2016-2032)
- Figure 49: North America Starch Derivatives Market Share Comparison by Type (2016-2032)
- Figure 50: North America Starch Derivatives Market Share Comparison by Source (2016-2032)
- Figure 51: North America Starch Derivatives Market Share Comparison by Application (2016-2032)
- Figure 52: North America Starch Derivatives Market Share Comparison by Functionality (2016-2032)
- Figure 53: Western Europe Starch Derivatives Market Revenue (US$ Mn) Market Share by Typein 2022
- Figure 54: Western Europe Starch Derivatives Market Attractiveness Analysis by Type, 2016-2032
- Figure 55: Western Europe Starch Derivatives Market Revenue (US$ Mn) Market Share by Sourcein 2022
- Figure 56: Western Europe Starch Derivatives Market Attractiveness Analysis by Source, 2016-2032
- Figure 57: Western Europe Starch Derivatives Market Revenue (US$ Mn) Market Share by Applicationin 2022
- Figure 58: Western Europe Starch Derivatives Market Attractiveness Analysis by Application, 2016-2032
- Figure 59: Western Europe Starch Derivatives Market Revenue (US$ Mn) Market Share by Functionalityin 2022
- Figure 60: Western Europe Starch Derivatives Market Attractiveness Analysis by Functionality, 2016-2032
- Figure 61: Western Europe Starch Derivatives Market Revenue (US$ Mn) Market Share by Country in 2022
- Figure 62: Western Europe Starch Derivatives Market Attractiveness Analysis by Country, 2016-2032
- Figure 63: Western Europe Starch Derivatives Market Revenue (US$ Mn) (2016-2032)
- Figure 64: Western Europe Starch Derivatives Market Revenue (US$ Mn) Comparison by Country (2016-2032)
- Figure 65: Western Europe Starch Derivatives Market Revenue (US$ Mn) Comparison by Type (2016-2032)
- Figure 66: Western Europe Starch Derivatives Market Revenue (US$ Mn) Comparison by Source (2016-2032)
- Figure 67: Western Europe Starch Derivatives Market Revenue (US$ Mn) Comparison by Application (2016-2032)
- Figure 68: Western Europe Starch Derivatives Market Revenue (US$ Mn) Comparison by Functionality (2016-2032)
- Figure 69: Western Europe Starch Derivatives Market Y-o-Y Growth Rate Comparison by Country (2016-2032)
- Figure 70: Western Europe Starch Derivatives Market Y-o-Y Growth Rate Comparison by Type (2016-2032)
- Figure 71: Western Europe Starch Derivatives Market Y-o-Y Growth Rate Comparison by Source (2016-2032)
- Figure 72: Western Europe Starch Derivatives Market Y-o-Y Growth Rate Comparison by Application (2016-2032)
- Figure 73: Western Europe Starch Derivatives Market Y-o-Y Growth Rate Comparison by Functionality (2016-2032)
- Figure 74: Western Europe Starch Derivatives Market Share Comparison by Country (2016-2032)
- Figure 75: Western Europe Starch Derivatives Market Share Comparison by Type (2016-2032)
- Figure 76: Western Europe Starch Derivatives Market Share Comparison by Source (2016-2032)
- Figure 77: Western Europe Starch Derivatives Market Share Comparison by Application (2016-2032)
- Figure 78: Western Europe Starch Derivatives Market Share Comparison by Functionality (2016-2032)
- Figure 79: Eastern Europe Starch Derivatives Market Revenue (US$ Mn) Market Share by Typein 2022
- Figure 80: Eastern Europe Starch Derivatives Market Attractiveness Analysis by Type, 2016-2032
- Figure 81: Eastern Europe Starch Derivatives Market Revenue (US$ Mn) Market Share by Sourcein 2022
- Figure 82: Eastern Europe Starch Derivatives Market Attractiveness Analysis by Source, 2016-2032
- Figure 83: Eastern Europe Starch Derivatives Market Revenue (US$ Mn) Market Share by Applicationin 2022
- Figure 84: Eastern Europe Starch Derivatives Market Attractiveness Analysis by Application, 2016-2032
- Figure 85: Eastern Europe Starch Derivatives Market Revenue (US$ Mn) Market Share by Functionalityin 2022
- Figure 86: Eastern Europe Starch Derivatives Market Attractiveness Analysis by Functionality, 2016-2032
- Figure 87: Eastern Europe Starch Derivatives Market Revenue (US$ Mn) Market Share by Country in 2022
- Figure 88: Eastern Europe Starch Derivatives Market Attractiveness Analysis by Country, 2016-2032
- Figure 89: Eastern Europe Starch Derivatives Market Revenue (US$ Mn) (2016-2032)
- Figure 90: Eastern Europe Starch Derivatives Market Revenue (US$ Mn) Comparison by Country (2016-2032)
- Figure 91: Eastern Europe Starch Derivatives Market Revenue (US$ Mn) Comparison by Type (2016-2032)
- Figure 92: Eastern Europe Starch Derivatives Market Revenue (US$ Mn) Comparison by Source (2016-2032)
- Figure 93: Eastern Europe Starch Derivatives Market Revenue (US$ Mn) Comparison by Application (2016-2032)
- Figure 94: Eastern Europe Starch Derivatives Market Revenue (US$ Mn) Comparison by Functionality (2016-2032)
- Figure 95: Eastern Europe Starch Derivatives Market Y-o-Y Growth Rate Comparison by Country (2016-2032)
- Figure 96: Eastern Europe Starch Derivatives Market Y-o-Y Growth Rate Comparison by Type (2016-2032)
- Figure 97: Eastern Europe Starch Derivatives Market Y-o-Y Growth Rate Comparison by Source (2016-2032)
- Figure 98: Eastern Europe Starch Derivatives Market Y-o-Y Growth Rate Comparison by Application (2016-2032)
- Figure 99: Eastern Europe Starch Derivatives Market Y-o-Y Growth Rate Comparison by Functionality (2016-2032)
- Figure 100: Eastern Europe Starch Derivatives Market Share Comparison by Country (2016-2032)
- Figure 101: Eastern Europe Starch Derivatives Market Share Comparison by Type (2016-2032)
- Figure 102: Eastern Europe Starch Derivatives Market Share Comparison by Source (2016-2032)
- Figure 103: Eastern Europe Starch Derivatives Market Share Comparison by Application (2016-2032)
- Figure 104: Eastern Europe Starch Derivatives Market Share Comparison by Functionality (2016-2032)
- Figure 105: APAC Starch Derivatives Market Revenue (US$ Mn) Market Share by Typein 2022
- Figure 106: APAC Starch Derivatives Market Attractiveness Analysis by Type, 2016-2032
- Figure 107: APAC Starch Derivatives Market Revenue (US$ Mn) Market Share by Sourcein 2022
- Figure 108: APAC Starch Derivatives Market Attractiveness Analysis by Source, 2016-2032
- Figure 109: APAC Starch Derivatives Market Revenue (US$ Mn) Market Share by Applicationin 2022
- Figure 110: APAC Starch Derivatives Market Attractiveness Analysis by Application, 2016-2032
- Figure 111: APAC Starch Derivatives Market Revenue (US$ Mn) Market Share by Functionalityin 2022
- Figure 112: APAC Starch Derivatives Market Attractiveness Analysis by Functionality, 2016-2032
- Figure 113: APAC Starch Derivatives Market Revenue (US$ Mn) Market Share by Country in 2022
- Figure 114: APAC Starch Derivatives Market Attractiveness Analysis by Country, 2016-2032
- Figure 115: APAC Starch Derivatives Market Revenue (US$ Mn) (2016-2032)
- Figure 116: APAC Starch Derivatives Market Revenue (US$ Mn) Comparison by Country (2016-2032)
- Figure 117: APAC Starch Derivatives Market Revenue (US$ Mn) Comparison by Type (2016-2032)
- Figure 118: APAC Starch Derivatives Market Revenue (US$ Mn) Comparison by Source (2016-2032)
- Figure 119: APAC Starch Derivatives Market Revenue (US$ Mn) Comparison by Application (2016-2032)
- Figure 120: APAC Starch Derivatives Market Revenue (US$ Mn) Comparison by Functionality (2016-2032)
- Figure 121: APAC Starch Derivatives Market Y-o-Y Growth Rate Comparison by Country (2016-2032)
- Figure 122: APAC Starch Derivatives Market Y-o-Y Growth Rate Comparison by Type (2016-2032)
- Figure 123: APAC Starch Derivatives Market Y-o-Y Growth Rate Comparison by Source (2016-2032)
- Figure 124: APAC Starch Derivatives Market Y-o-Y Growth Rate Comparison by Application (2016-2032)
- Figure 125: APAC Starch Derivatives Market Y-o-Y Growth Rate Comparison by Functionality (2016-2032)
- Figure 126: APAC Starch Derivatives Market Share Comparison by Country (2016-2032)
- Figure 127: APAC Starch Derivatives Market Share Comparison by Type (2016-2032)
- Figure 128: APAC Starch Derivatives Market Share Comparison by Source (2016-2032)
- Figure 129: APAC Starch Derivatives Market Share Comparison by Application (2016-2032)
- Figure 130: APAC Starch Derivatives Market Share Comparison by Functionality (2016-2032)
- Figure 131: Latin America Starch Derivatives Market Revenue (US$ Mn) Market Share by Typein 2022
- Figure 132: Latin America Starch Derivatives Market Attractiveness Analysis by Type, 2016-2032
- Figure 133: Latin America Starch Derivatives Market Revenue (US$ Mn) Market Share by Sourcein 2022
- Figure 134: Latin America Starch Derivatives Market Attractiveness Analysis by Source, 2016-2032
- Figure 135: Latin America Starch Derivatives Market Revenue (US$ Mn) Market Share by Applicationin 2022
- Figure 136: Latin America Starch Derivatives Market Attractiveness Analysis by Application, 2016-2032
- Figure 137: Latin America Starch Derivatives Market Revenue (US$ Mn) Market Share by Functionalityin 2022
- Figure 138: Latin America Starch Derivatives Market Attractiveness Analysis by Functionality, 2016-2032
- Figure 139: Latin America Starch Derivatives Market Revenue (US$ Mn) Market Share by Country in 2022
- Figure 140: Latin America Starch Derivatives Market Attractiveness Analysis by Country, 2016-2032
- Figure 141: Latin America Starch Derivatives Market Revenue (US$ Mn) (2016-2032)
- Figure 142: Latin America Starch Derivatives Market Revenue (US$ Mn) Comparison by Country (2016-2032)
- Figure 143: Latin America Starch Derivatives Market Revenue (US$ Mn) Comparison by Type (2016-2032)
- Figure 144: Latin America Starch Derivatives Market Revenue (US$ Mn) Comparison by Source (2016-2032)
- Figure 145: Latin America Starch Derivatives Market Revenue (US$ Mn) Comparison by Application (2016-2032)
- Figure 146: Latin America Starch Derivatives Market Revenue (US$ Mn) Comparison by Functionality (2016-2032)
- Figure 147: Latin America Starch Derivatives Market Y-o-Y Growth Rate Comparison by Country (2016-2032)
- Figure 148: Latin America Starch Derivatives Market Y-o-Y Growth Rate Comparison by Type (2016-2032)
- Figure 149: Latin America Starch Derivatives Market Y-o-Y Growth Rate Comparison by Source (2016-2032)
- Figure 150: Latin America Starch Derivatives Market Y-o-Y Growth Rate Comparison by Application (2016-2032)
- Figure 151: Latin America Starch Derivatives Market Y-o-Y Growth Rate Comparison by Functionality (2016-2032)
- Figure 152: Latin America Starch Derivatives Market Share Comparison by Country (2016-2032)
- Figure 153: Latin America Starch Derivatives Market Share Comparison by Type (2016-2032)
- Figure 154: Latin America Starch Derivatives Market Share Comparison by Source (2016-2032)
- Figure 155: Latin America Starch Derivatives Market Share Comparison by Application (2016-2032)
- Figure 156: Latin America Starch Derivatives Market Share Comparison by Functionality (2016-2032)
- Figure 157: Middle East & Africa Starch Derivatives Market Revenue (US$ Mn) Market Share by Typein 2022
- Figure 158: Middle East & Africa Starch Derivatives Market Attractiveness Analysis by Type, 2016-2032
- Figure 159: Middle East & Africa Starch Derivatives Market Revenue (US$ Mn) Market Share by Sourcein 2022
- Figure 160: Middle East & Africa Starch Derivatives Market Attractiveness Analysis by Source, 2016-2032
- Figure 161: Middle East & Africa Starch Derivatives Market Revenue (US$ Mn) Market Share by Applicationin 2022
- Figure 162: Middle East & Africa Starch Derivatives Market Attractiveness Analysis by Application, 2016-2032
- Figure 163: Middle East & Africa Starch Derivatives Market Revenue (US$ Mn) Market Share by Functionalityin 2022
- Figure 164: Middle East & Africa Starch Derivatives Market Attractiveness Analysis by Functionality, 2016-2032
- Figure 165: Middle East & Africa Starch Derivatives Market Revenue (US$ Mn) Market Share by Country in 2022
- Figure 166: Middle East & Africa Starch Derivatives Market Attractiveness Analysis by Country, 2016-2032
- Figure 167: Middle East & Africa Starch Derivatives Market Revenue (US$ Mn) (2016-2032)
- Figure 168: Middle East & Africa Starch Derivatives Market Revenue (US$ Mn) Comparison by Country (2016-2032)
- Figure 169: Middle East & Africa Starch Derivatives Market Revenue (US$ Mn) Comparison by Type (2016-2032)
- Figure 170: Middle East & Africa Starch Derivatives Market Revenue (US$ Mn) Comparison by Source (2016-2032)
- Figure 171: Middle East & Africa Starch Derivatives Market Revenue (US$ Mn) Comparison by Application (2016-2032)
- Figure 172: Middle East & Africa Starch Derivatives Market Revenue (US$ Mn) Comparison by Functionality (2016-2032)
- Figure 173: Middle East & Africa Starch Derivatives Market Y-o-Y Growth Rate Comparison by Country (2016-2032)
- Figure 174: Middle East & Africa Starch Derivatives Market Y-o-Y Growth Rate Comparison by Type (2016-2032)
- Figure 175: Middle East & Africa Starch Derivatives Market Y-o-Y Growth Rate Comparison by Source (2016-2032)
- Figure 176: Middle East & Africa Starch Derivatives Market Y-o-Y Growth Rate Comparison by Application (2016-2032)
- Figure 177: Middle East & Africa Starch Derivatives Market Y-o-Y Growth Rate Comparison by Functionality (2016-2032)
- Figure 178: Middle East & Africa Starch Derivatives Market Share Comparison by Country (2016-2032)
- Figure 179: Middle East & Africa Starch Derivatives Market Share Comparison by Type (2016-2032)
- Figure 180: Middle East & Africa Starch Derivatives Market Share Comparison by Source (2016-2032)
- Figure 181: Middle East & Africa Starch Derivatives Market Share Comparison by Application (2016-2032)
- Figure 182: Middle East & Africa Starch Derivatives Market Share Comparison by Functionality (2016-2032)
- List of Tables
- Table 1: Global Starch Derivatives Market Comparison by Type (2016-2032)
- Table 2: Global Starch Derivatives Market Comparison by Source (2016-2032)
- Table 3: Global Starch Derivatives Market Comparison by Application (2016-2032)
- Table 4: Global Starch Derivatives Market Comparison by Functionality (2016-2032)
- Table 5: Global Starch Derivatives Market Revenue (US$ Mn) Comparison by Region (2016-2032)
- Table 6: Global Starch Derivatives Market Revenue (US$ Mn) (2016-2032)
- Table 7: Global Starch Derivatives Market Revenue (US$ Mn) Comparison by Region (2016-2032)
- Table 8: Global Starch Derivatives Market Revenue (US$ Mn) Comparison by Type (2016-2032)
- Table 9: Global Starch Derivatives Market Revenue (US$ Mn) Comparison by Source (2016-2032)
- Table 10: Global Starch Derivatives Market Revenue (US$ Mn) Comparison by Application (2016-2032)
- Table 11: Global Starch Derivatives Market Revenue (US$ Mn) Comparison by Functionality (2016-2032)
- Table 12: Global Starch Derivatives Market Y-o-Y Growth Rate Comparison by Region (2016-2032)
- Table 13: Global Starch Derivatives Market Y-o-Y Growth Rate Comparison by Type (2016-2032)
- Table 14: Global Starch Derivatives Market Y-o-Y Growth Rate Comparison by Source (2016-2032)
- Table 15: Global Starch Derivatives Market Y-o-Y Growth Rate Comparison by Application (2016-2032)
- Table 16: Global Starch Derivatives Market Y-o-Y Growth Rate Comparison by Functionality (2016-2032)
- Table 17: Global Starch Derivatives Market Share Comparison by Region (2016-2032)
- Table 18: Global Starch Derivatives Market Share Comparison by Type (2016-2032)
- Table 19: Global Starch Derivatives Market Share Comparison by Source (2016-2032)
- Table 20: Global Starch Derivatives Market Share Comparison by Application (2016-2032)
- Table 21: Global Starch Derivatives Market Share Comparison by Functionality (2016-2032)
- Table 22: North America Starch Derivatives Market Comparison by Source (2016-2032)
- Table 23: North America Starch Derivatives Market Comparison by Application (2016-2032)
- Table 24: North America Starch Derivatives Market Comparison by Functionality (2016-2032)
- Table 25: North America Starch Derivatives Market Revenue (US$ Mn) Comparison by Country (2016-2032)
- Table 26: North America Starch Derivatives Market Revenue (US$ Mn) (2016-2032)
- Table 27: North America Starch Derivatives Market Revenue (US$ Mn) Comparison by Country (2016-2032)
- Table 28: North America Starch Derivatives Market Revenue (US$ Mn) Comparison by Type (2016-2032)
- Table 29: North America Starch Derivatives Market Revenue (US$ Mn) Comparison by Source (2016-2032)
- Table 30: North America Starch Derivatives Market Revenue (US$ Mn) Comparison by Application (2016-2032)
- Table 31: North America Starch Derivatives Market Revenue (US$ Mn) Comparison by Functionality (2016-2032)
- Table 32: North America Starch Derivatives Market Y-o-Y Growth Rate Comparison by Country (2016-2032)
- Table 33: North America Starch Derivatives Market Y-o-Y Growth Rate Comparison by Type (2016-2032)
- Table 34: North America Starch Derivatives Market Y-o-Y Growth Rate Comparison by Source (2016-2032)
- Table 35: North America Starch Derivatives Market Y-o-Y Growth Rate Comparison by Application (2016-2032)
- Table 36: North America Starch Derivatives Market Y-o-Y Growth Rate Comparison by Functionality (2016-2032)
- Table 37: North America Starch Derivatives Market Share Comparison by Country (2016-2032)
- Table 38: North America Starch Derivatives Market Share Comparison by Type (2016-2032)
- Table 39: North America Starch Derivatives Market Share Comparison by Source (2016-2032)
- Table 40: North America Starch Derivatives Market Share Comparison by Application (2016-2032)
- Table 41: North America Starch Derivatives Market Share Comparison by Functionality (2016-2032)
- Table 42: Western Europe Starch Derivatives Market Comparison by Type (2016-2032)
- Table 43: Western Europe Starch Derivatives Market Comparison by Source (2016-2032)
- Table 44: Western Europe Starch Derivatives Market Comparison by Application (2016-2032)
- Table 45: Western Europe Starch Derivatives Market Comparison by Functionality (2016-2032)
- Table 46: Western Europe Starch Derivatives Market Revenue (US$ Mn) Comparison by Country (2016-2032)
- Table 47: Western Europe Starch Derivatives Market Revenue (US$ Mn) (2016-2032)
- Table 48: Western Europe Starch Derivatives Market Revenue (US$ Mn) Comparison by Country (2016-2032)
- Table 49: Western Europe Starch Derivatives Market Revenue (US$ Mn) Comparison by Type (2016-2032)
- Table 50: Western Europe Starch Derivatives Market Revenue (US$ Mn) Comparison by Source (2016-2032)
- Table 51: Western Europe Starch Derivatives Market Revenue (US$ Mn) Comparison by Application (2016-2032)
- Table 52: Western Europe Starch Derivatives Market Revenue (US$ Mn) Comparison by Functionality (2016-2032)
- Table 53: Western Europe Starch Derivatives Market Y-o-Y Growth Rate Comparison by Country (2016-2032)
- Table 54: Western Europe Starch Derivatives Market Y-o-Y Growth Rate Comparison by Type (2016-2032)
- Table 55: Western Europe Starch Derivatives Market Y-o-Y Growth Rate Comparison by Source (2016-2032)
- Table 56: Western Europe Starch Derivatives Market Y-o-Y Growth Rate Comparison by Application (2016-2032)
- Table 57: Western Europe Starch Derivatives Market Y-o-Y Growth Rate Comparison by Functionality (2016-2032)
- Table 58: Western Europe Starch Derivatives Market Share Comparison by Country (2016-2032)
- Table 59: Western Europe Starch Derivatives Market Share Comparison by Type (2016-2032)
- Table 60: Western Europe Starch Derivatives Market Share Comparison by Source (2016-2032)
- Table 61: Western Europe Starch Derivatives Market Share Comparison by Application (2016-2032)
- Table 62: Western Europe Starch Derivatives Market Share Comparison by Functionality (2016-2032)
- Table 63: Eastern Europe Starch Derivatives Market Comparison by Type (2016-2032)
- Table 64: Eastern Europe Starch Derivatives Market Comparison by Source (2016-2032)
- Table 65: Eastern Europe Starch Derivatives Market Comparison by Application (2016-2032)
- Table 66: Eastern Europe Starch Derivatives Market Comparison by Functionality (2016-2032)
- Table 67: Eastern Europe Starch Derivatives Market Revenue (US$ Mn) Comparison by Country (2016-2032)
- Table 68: Eastern Europe Starch Derivatives Market Revenue (US$ Mn) (2016-2032)
- Table 69: Eastern Europe Starch Derivatives Market Revenue (US$ Mn) Comparison by Country (2016-2032)
- Table 70: Eastern Europe Starch Derivatives Market Revenue (US$ Mn) Comparison by Type (2016-2032)
- Table 71: Eastern Europe Starch Derivatives Market Revenue (US$ Mn) Comparison by Source (2016-2032)
- Table 72: Eastern Europe Starch Derivatives Market Revenue (US$ Mn) Comparison by Application (2016-2032)
- Table 73: Eastern Europe Starch Derivatives Market Revenue (US$ Mn) Comparison by Functionality (2016-2032)
- Table 74: Eastern Europe Starch Derivatives Market Y-o-Y Growth Rate Comparison by Country (2016-2032)
- Table 75: Eastern Europe Starch Derivatives Market Y-o-Y Growth Rate Comparison by Type (2016-2032)
- Table 76: Eastern Europe Starch Derivatives Market Y-o-Y Growth Rate Comparison by Source (2016-2032)
- Table 77: Eastern Europe Starch Derivatives Market Y-o-Y Growth Rate Comparison by Application (2016-2032)
- Table 78: Eastern Europe Starch Derivatives Market Y-o-Y Growth Rate Comparison by Functionality (2016-2032)
- Table 79: Eastern Europe Starch Derivatives Market Share Comparison by Country (2016-2032)
- Table 80: Eastern Europe Starch Derivatives Market Share Comparison by Type (2016-2032)
- Table 81: Eastern Europe Starch Derivatives Market Share Comparison by Source (2016-2032)
- Table 82: Eastern Europe Starch Derivatives Market Share Comparison by Application (2016-2032)
- Table 83: Eastern Europe Starch Derivatives Market Share Comparison by Functionality (2016-2032)
- Table 84: APAC Starch Derivatives Market Comparison by Type (2016-2032)
- Table 85: APAC Starch Derivatives Market Comparison by Source (2016-2032)
- Table 86: APAC Starch Derivatives Market Comparison by Application (2016-2032)
- Table 87: APAC Starch Derivatives Market Comparison by Functionality (2016-2032)
- Table 88: APAC Starch Derivatives Market Revenue (US$ Mn) Comparison by Country (2016-2032)
- Table 89: APAC Starch Derivatives Market Revenue (US$ Mn) (2016-2032)
- Table 90: APAC Starch Derivatives Market Revenue (US$ Mn) Comparison by Country (2016-2032)
- Table 91: APAC Starch Derivatives Market Revenue (US$ Mn) Comparison by Type (2016-2032)
- Table 92: APAC Starch Derivatives Market Revenue (US$ Mn) Comparison by Source (2016-2032)
- Table 93: APAC Starch Derivatives Market Revenue (US$ Mn) Comparison by Application (2016-2032)
- Table 94: APAC Starch Derivatives Market Revenue (US$ Mn) Comparison by Functionality (2016-2032)
- Table 95: APAC Starch Derivatives Market Y-o-Y Growth Rate Comparison by Country (2016-2032)
- Table 96: APAC Starch Derivatives Market Y-o-Y Growth Rate Comparison by Type (2016-2032)
- Table 97: APAC Starch Derivatives Market Y-o-Y Growth Rate Comparison by Source (2016-2032)
- Table 98: APAC Starch Derivatives Market Y-o-Y Growth Rate Comparison by Application (2016-2032)
- Table 99: APAC Starch Derivatives Market Y-o-Y Growth Rate Comparison by Functionality (2016-2032)
- Table 100: APAC Starch Derivatives Market Share Comparison by Country (2016-2032)
- Table 101: APAC Starch Derivatives Market Share Comparison by Type (2016-2032)
- Table 102: APAC Starch Derivatives Market Share Comparison by Source (2016-2032)
- Table 103: APAC Starch Derivatives Market Share Comparison by Application (2016-2032)
- Table 104: APAC Starch Derivatives Market Share Comparison by Functionality (2016-2032)
- Table 105: Latin America Starch Derivatives Market Comparison by Type (2016-2032)
- Table 106: Latin America Starch Derivatives Market Comparison by Source (2016-2032)
- Table 107: Latin America Starch Derivatives Market Comparison by Application (2016-2032)
- Table 108: Latin America Starch Derivatives Market Comparison by Functionality (2016-2032)
- Table 109: Latin America Starch Derivatives Market Revenue (US$ Mn) Comparison by Country (2016-2032)
- Table 110: Latin America Starch Derivatives Market Revenue (US$ Mn) (2016-2032)
- Table 111: Latin America Starch Derivatives Market Revenue (US$ Mn) Comparison by Country (2016-2032)
- Table 112: Latin America Starch Derivatives Market Revenue (US$ Mn) Comparison by Type (2016-2032)
- Table 113: Latin America Starch Derivatives Market Revenue (US$ Mn) Comparison by Source (2016-2032)
- Table 114: Latin America Starch Derivatives Market Revenue (US$ Mn) Comparison by Application (2016-2032)
- Table 115: Latin America Starch Derivatives Market Revenue (US$ Mn) Comparison by Functionality (2016-2032)
- Table 116: Latin America Starch Derivatives Market Y-o-Y Growth Rate Comparison by Country (2016-2032)
- Table 117: Latin America Starch Derivatives Market Y-o-Y Growth Rate Comparison by Type (2016-2032)
- Table 118: Latin America Starch Derivatives Market Y-o-Y Growth Rate Comparison by Source (2016-2032)
- Table 119: Latin America Starch Derivatives Market Y-o-Y Growth Rate Comparison by Application (2016-2032)
- Table 120: Latin America Starch Derivatives Market Y-o-Y Growth Rate Comparison by Functionality (2016-2032)
- Table 121: Latin America Starch Derivatives Market Share Comparison by Country (2016-2032)
- Table 122: Latin America Starch Derivatives Market Share Comparison by Type (2016-2032)
- Table 123: Latin America Starch Derivatives Market Share Comparison by Source (2016-2032)
- Table 124: Latin America Starch Derivatives Market Share Comparison by Application (2016-2032)
- Table 125: Latin America Starch Derivatives Market Share Comparison by Functionality (2016-2032)
- Table 126: Middle East & Africa Starch Derivatives Market Comparison by Type (2016-2032)
- Table 127: Middle East & Africa Starch Derivatives Market Comparison by Source (2016-2032)
- Table 128: Middle East & Africa Starch Derivatives Market Comparison by Application (2016-2032)
- Table 129: Middle East & Africa Starch Derivatives Market Comparison by Functionality (2016-2032)
- Table 130: Middle East & Africa Starch Derivatives Market Revenue (US$ Mn) Comparison by Country (2016-2032)
- Table 131: Middle East & Africa Starch Derivatives Market Revenue (US$ Mn) (2016-2032)
- Table 132: Middle East & Africa Starch Derivatives Market Revenue (US$ Mn) Comparison by Country (2016-2032)
- Table 133: Middle East & Africa Starch Derivatives Market Revenue (US$ Mn) Comparison by Type (2016-2032)
- Table 134: Middle East & Africa Starch Derivatives Market Revenue (US$ Mn) Comparison by Source (2016-2032)
- Table 135: Middle East & Africa Starch Derivatives Market Revenue (US$ Mn) Comparison by Application (2016-2032)
- Table 136: Middle East & Africa Starch Derivatives Market Revenue (US$ Mn) Comparison by Functionality (2016-2032)
- Table 137: Middle East & Africa Starch Derivatives Market Y-o-Y Growth Rate Comparison by Country (2016-2032)
- Table 138: Middle East & Africa Starch Derivatives Market Y-o-Y Growth Rate Comparison by Type (2016-2032)
- Table 139: Middle East & Africa Starch Derivatives Market Y-o-Y Growth Rate Comparison by Source (2016-2032)
- Table 140: Middle East & Africa Starch Derivatives Market Y-o-Y Growth Rate Comparison by Application (2016-2032)
- Table 141: Middle East & Africa Starch Derivatives Market Y-o-Y Growth Rate Comparison by Functionality (2016-2032)
- Table 142: Middle East & Africa Starch Derivatives Market Share Comparison by Country (2016-2032)
- Table 143: Middle East & Africa Starch Derivatives Market Share Comparison by Type (2016-2032)
- Table 144: Middle East & Africa Starch Derivatives Market Share Comparison by Source (2016-2032)
- Table 145: Middle East & Africa Starch Derivatives Market Share Comparison by Application (2016-2032)
- Table 146: Middle East & Africa Starch Derivatives Market Share Comparison by Functionality (2016-2032)
- 1. Executive Summary
-
- Archer Daniels Midland Company (ADM)
- Cargill, Incorporated
- Ingredion Incorporated
- Tate & Lyle PLC
- Roquette Frères
- Agrana Beteiligungs-AG
- Avebe U.A.
- Grain Processing Corporation (GPC)
- Emsland-Stärke GmbH
- Südzucker AG
- Global Bio-Chem Technology Group Company Limited
- Tereos Group
- SPAC Starch Products (India) Ltd.
- Gulshan Polyols Ltd.
- Manildra Group
Our Clients


View Our Licence Options
