
Spirometer Market Application Analysis (Asthma, COPD, Cystic Fibrosis, Pulmonary Fibrosis, Others), Technology Analysis (Volume Measurement, Flow Measurement, Peak Flow Measurement), By Region And Companies - Industry Segment Outlook, Market Assessment, Competition Scenario, Trends, And Forecast 2023-2032
-
5596
-
May 2023
-
174
-


-
This report was compiled by Trishita Deb Trishita Deb is an experienced market research and consulting professional with over 7 years of expertise across healthcare, consumer goods, and materials, contributing to over 400 healthcare-related reports. Correspondence Team Lead- Healthcare Linkedin | Detailed Market research Methodology Our methodology involves a mix of primary research, including interviews with leading mental health experts, and secondary research from reputable medical journals and databases. View Detailed Methodology Page
-
Quick Navigation
Report Overview
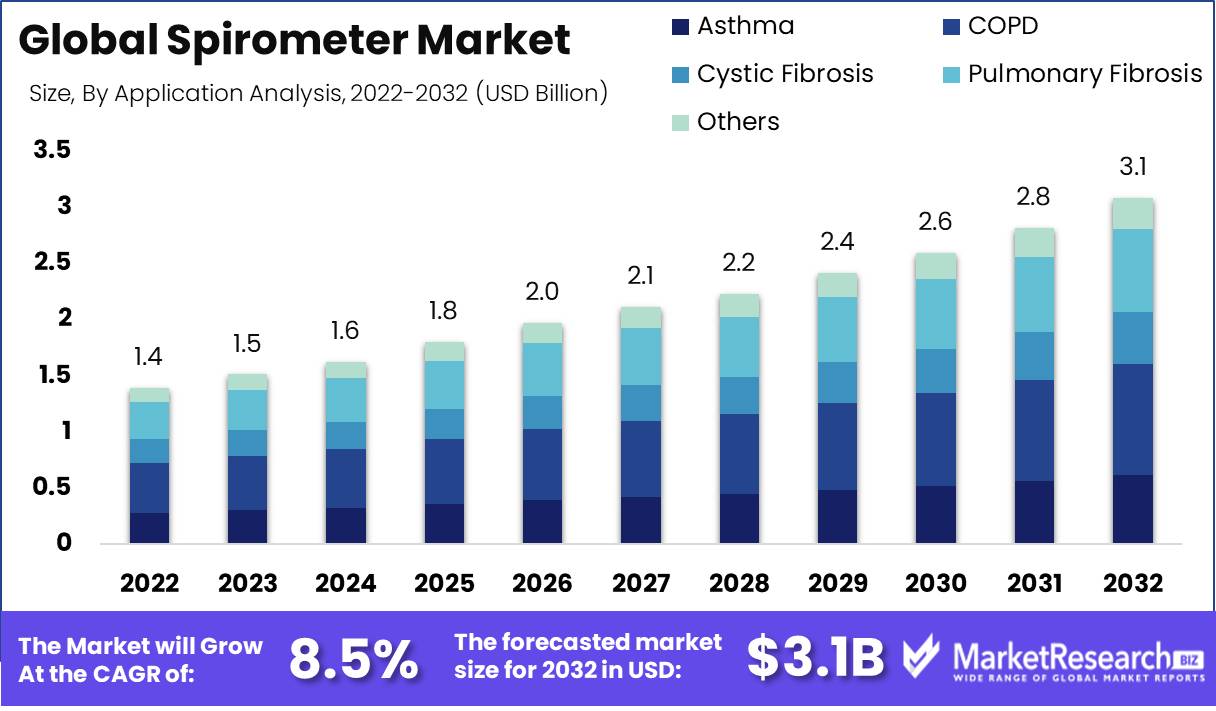
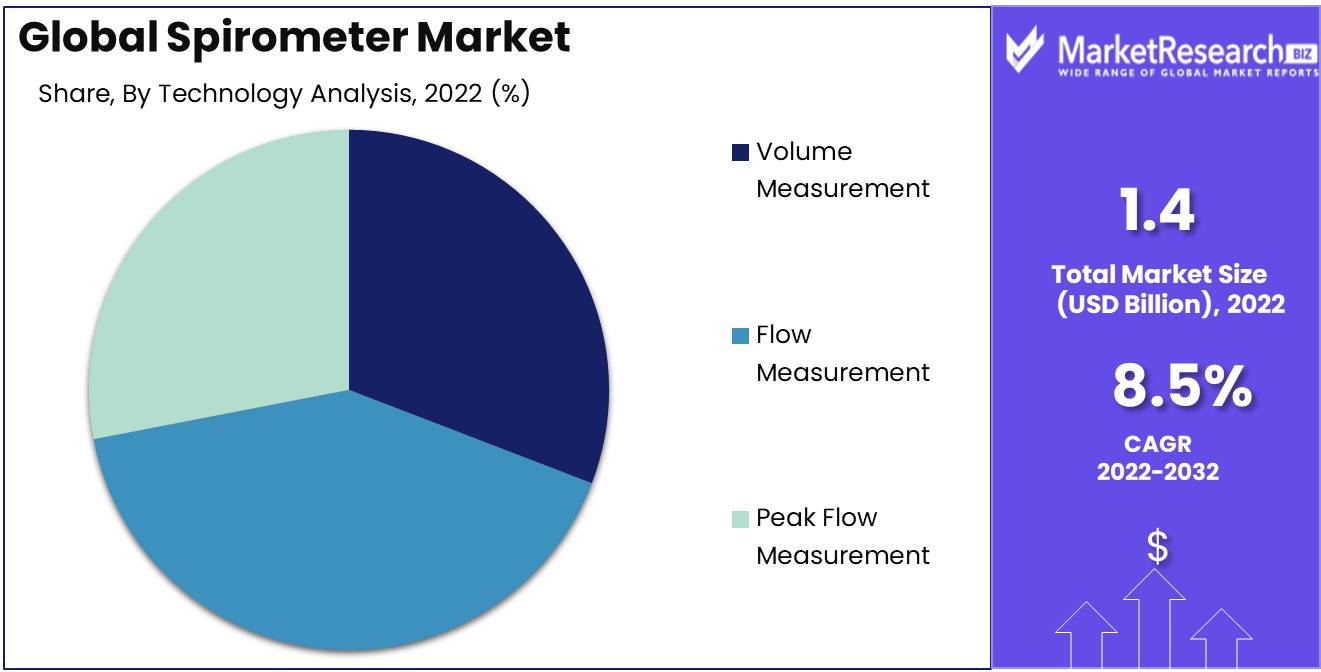
The Spirometer Market size is expected to be worth around USD 3.1 Bn by 2032 from USD 1.4 Bn in 2022, growing at a CAGR of 8.5% during the forecast period from 2023 to 2032.
The spirometer market is exploding, proliferating at a rapid rate, and making significant advancements in the medical field. Spirometers, which are inventive devices that measure lung function, have gained widespread recognition for their diagnostic prowess in identifying and evaluating respiratory disorders, such as chronic obstructive pulmonary disease (COPD), asthma, and emphysema.
A spirometer, a medical marvel, demonstrates its proficiency by precisely measuring lung function, making spirometry an indispensable diagnostic tool in the realm of respiratory health. Spirometry provides valuable information about pulmonary conditions by quantifying an individual's forced expiratory volume in one second (FEV1) and forced vital capacity (FVC). Moreover, the prevalence of spirometers in hospitals, clinics, and even homes demonstrates their versatility, establishing them as the unrivaled diagnostic instrument of choice.
One of the greatest benefits of spirometry is its non-invasiveness. This unrivaled technique detects the presence of respiratory disorders quickly and painlessly, ensuring prompt diagnoses. In addition, the ability to measure longitudinal changes in lung function facilitates the development of individualized treatment plans for each patient by allowing healthcare professionals to closely monitor the development of their pulmonary capacities over time.
The spirometer market has recently undergone a paradigm shift as a result of ground-breaking innovations, most notably the advent of portable handheld devices that make lung function monitoring possible in the convenience of one's own home. This revolutionary innovation enables patients to proactively monitor their respiratory health, thereby expediting the detection of potential ailments and facilitating prompt, effective interventions.
The healthcare industry is unquestionably the driving force behind the spirometer market's growth trajectory. Utilizing spirometry devices to improve patient care, hospitals, clinics, and diagnostic laboratories comprise the vanguard of healthcare providers. In addition, significant investments by medical device manufacturers in cutting-edge products and technologies have further propelled the sector's development and evolution.
As with any industry, the spirometer market faces ethical issues of the utmost importance. Protecting the confidentiality of patient information and ensuring the accuracy of diagnostic results are central concerns in this realm. Healthcare providers are responsible for safeguarding patient privacy and ensuring the accuracy of spirometry tests through stringent quality control procedures. To ensure that spirometry tests are conducted with the uttermost responsibility and ethical rigor, promoting transparency, explainability, and accountability remains crucial.
Driving factors
Exponential Expansion Due to Respiratory Diseases, the Spirometer Market is Growing.
Due to a number of driving factors, the spirometer market is anticipated to experience exponential growth in the future years. The growing prevalence of respiratory diseases such as COPD, asthma, and lung cancer is one of the most important factors. This has increased the demand for devices that accurately measure lung function and diagnose respiratory diseases. In addition, increasing awareness of the significance of lung health and the advantages of early diagnosis has boosted the demand for spirometers.
Technological Developments Drive the Expansion of the Spirometer Market
The development of portable and wireless devices, home-based healthcare monitoring, and self-diagnosis tools have also contributed to the growth of the spirometer market. These devices provide patients with the ability to monitor their lung function from the comfort of their own residences.
Aging Population Increases Spirometer Demand
The growing geriatric population and the resulting rise in the number of patients have further fueled the demand for spirometers. Additionally, government initiatives to promote respiratory health, rising healthcare costs and increased funding, and the increasing adoption of electronic health records (EHRs) and telemedicine have all had a positive impact on the spirometer market. The increasing emphasis on preventive care and early detection, as well as the growing demand for point-of-care testing and rapid diagnostics, present promising opportunities for the spirometer market.
Regulatory Changes and New Technologies Influence the Spirometer Market
In the immediate future, however, current or potential regulatory changes may have an impact on the spirometer market. In addition, emergent technologies such as virtual reality and artificial intelligence may have an impact on the market for spirometers. New entrants and market consolidation are two potential factors that could impact the competitive landscape.
Restraining Factors
Spirometer Market Challenges
Medical technology continues to help diagnose and treat many health disorders. A spirometer has achieved significant popularity. It is commonly used to measure lung capacity and detect respiratory diseases like asthma and COPD. Despite its usefulness in identifying respiratory disorders, the spirometer market still faces significant obstacles due to several restraining factors that limit its growth and potential.
Affordability and Reimbursement
For new healthcare practices, spirometry devices are pricey. The lack of funding for several spirometry procedures compounds the issue. Many clinics and small hospitals cannot afford these devices because healthcare providers cannot invest in them without proper compensation. We need to raise awareness and explain the importance of early detection and accurate diagnosis of respiratory infections using spirometry to solve this problem. This could raise awareness and policymaker support.
Spirometry Access
Another significant barrier for the spirometer market is the lack of spirometry testing specialists. These devices are often operated by skilled experts like pulmonologists and respiratory therapists, which restricts spirometry to a small number of patients. Referring patients for spirometry testing to specialists is time-consuming and costly. Improving spirometry testing medical professionals' training and education is the best strategy to alleviate this scarcity of qualified healthcare workers.
Infection Prevention
After the COVID-19 pandemic, the risk of infection and cross-contamination is a significant worry for spirometry devices and medical equipment. Spirometry devices are risky because they touch patients' faces and body fluids. Healthcare practices need to design and maintain stringent infection control measures to reduce the risk of infection and cross-contamination. These practices should include spirometry equipment cleaning and disinfection before and after usage.
Spirometry Awareness
Despite the widespread usage of spirometry testing devices in recent years, many patients and healthcare practitioners are ignorant of its benefits. This lack of awareness affects both the demand and supply of devices. We need to invest in public advertising and clinical education to raise awareness of spirometry testing to solve this problem. Targeted teaching materials, webinars, and seminars can emphasize the importance of early detection, correct diagnosis, and better respiratory ailment management.
Regulatory Gap
Finally, government rules challenge the spirometer market. New devices are typically delayed by strict regulatory constraints. The need for FDA authorization affects the speed and expense of releasing innovative devices. We need to work toward a more streamlined and consistent regulatory approval process to minimize this backlog. Policymakers, healthcare professionals, and patients need to work together to integrate new technologies.
Application Analysis
The spirometer market is also segmented by application, including COPD. COPD, a progressive lung disease, obstructs airflow. The COPD segment of the spirometer market will be discussed here.
COPD is a major spirometer market segment. Spirometers are critical for COPD management and the most common test for COPD. Lung function is measured by spirometers to determine COPD severity, progression, and therapy efficacy.
Air pollution and tobacco smoke make COPD more common in low- and middle-income nations. Healthcare spending has surged in emerging economies, driving spirometer demand. These countries' healthcare practitioners prioritize COPD diagnosis and management with spirometry.
To control symptoms, COPD patients need lung function monitoring. Spirometry is already routine practice for COPD care, and patients are becoming more aware of its value. COPD patients are also adopting portable spirometers at home to actively manage their symptoms.
COPD will rise fastest in the spirometer market. Due to rising COPD rates, home-based care, and better spirometers. Remote COPD patient monitoring enabled by wireless connectivity and cloud technology is also growing in this industry.
Technology Analysis
The flow measurement spirometer market is also segmented by technology. This section discusses the flow measurement spirometer market segment.
The most popular type of spirometer used in clinical settings is the flow measurement spirometer. Spirometers monitor airflow during inhalation and exhalation. Flow measurement spirometers help diagnose and monitor respiratory diseases.
As indicated, growing economies have driven spirometer demand, including flow-measuring spirometers. Spirometers are vital for detecting and monitoring respiratory problems, and the rise in respiratory ailments in these locations has increased their use.
Lung function is increasingly monitored with flow measurement spirometers in respiratory patients. These spirometers accurately evaluate lung function for respiratory management. Patients are learning the necessity of lung function monitoring and using flow-measuring spirometers at home.
In the spirometer market, flow measurement spirometers are expected to increase steadily. This segment will develop due to the need for appropriate lung function measurement. This segment will rise as flow-measuring spirometers include wireless connectivity and cloud technology.
Key Market Segments
Application Analysis
- Asthma
- COPD
- Cystic Fibrosis
- Pulmonary Fibrosis
- Others
Technology Analysis
- Volume Measurement
- Flow Measurement
- Peak Flow Measurement
Growth Opportunity
Rapid Spirometer Market Growth
Due to the development of sophisticated spirometry devices, growing demand for wireless and portable devices, and increased acceptance of telemedicine and virtual healthcare solutions, the spirometer market is likely to rise substantially in the coming years. The ease of the respiratory market in growing economies with large populations and a high frequency of respiratory disorders is also driving the growth of the market.
Advanced Devises Drive Spirometer Market
One of the primary reasons driving the growth of the spirometer market is the development of new spirometry devices with enhanced accuracy and ease of use. The development of novel spirometry devices that deliver precise and dependable readings with ease has been made possible by technological breakthroughs. The development of computerized spirometry devices has made instant results possible.
Portable Spirometry Devices Surge
Another key factor driving the growth of the spirometer market is the increased demand for wireless and portable spirometry devices for remote patient monitoring. These devices let patients monitor their respiratory health at home and let healthcare providers follow them remotely. Patients with chronic respiratory disorders like asthma and COPD benefit especially from wireless and portable spirometry devices.
Emerging Economies Expand Spirometry Market
The ease of the respiratory market in growing economies with big populations and a high frequency of respiratory disorders is also fueling the market growth. The rise in respiratory disorders like asthma and COPD has led to an increase in demand for spirometry devices. The increased healthcare infrastructure in these countries has made spirometry testing easier for patients.
Telemedicine Grows Spirometer Market
Spirometer market growth is driven by telemedicine and virtual healthcare solutions. Telemedicine and virtual healthcare solutions have made it possible for patients to consult with providers remotely, which has led to increased use of spirometry devices for remote monitoring. These devices also relieve hospitals and clinics, saving patients and healthcare providers money.
AI Transforms Spirometry Diagnosis
One of the biggest spirometer market developments is the development of AI-powered spirometry devices for automated diagnosis and decision-making. AI-powered spirometry devices deliver precise findings. These devices can assist healthcare providers make informed patient care decisions, and improving patient outcomes.
Latest Trends
Patient-Centered Care and Personalized Medicine
Patient-Centric Care and Personalized Medicine, Value-Based Care and Outcomes-Based Reimbursement, Integration of Spirometry Devices with Electronic Health Records (EHRs) and Other Healthcare IT Systems, Increasing Use of Spirometry as a Diagnostic Tool for COVID-19 and Other Respiratory Infections, and Rising Popularity of Home-Based Spirometry Testing and Self-Monitoring Tools are shaping the Spirometer Market.
Value-Based Care and Outcomes-Based Reimbursement are Growing
As healthcare systems evolve, so do market trends that shape the industry. The Spirometer Market has changed significantly in response to global market trends. The Spirometer Market has adjusted its focus to match patient-centric care and customized medicine trends in healthcare systems. Clinicians and patients are increasingly interested in condition-specific therapies that focus on the individual rather than a one-size-fits-all strategy.
Spirometry Device Integration with Healthcare IT
Spirometry evaluates lung function and diagnoses respiratory disorders including asthma and COPD. The Spirometer Market has responded to this trend by adding devices that meet the needs of different patient populations.
Spirometry for Respiratory Infections Growing
Another care trend that has influenced the Spirometer Market is the focus on value-based care and outcomes-based reimbursement. Healthcare providers want to reduce expenses and improve quality. Spirometry is cost-effective for respiratory disease diagnosis, monitoring, and management.
Rising Home-Based Spirometry Testing
The integration of spirometry devices with EHRs and other healthcare IT systems is shaping the market. This integration improves productivity and patient record coverage. Medical experts can assess lung function over time and discover trends to better manage respiratory disorders and identify early warning symptoms.
COVID-19 Spirometry
The COVID-19 pandemic has enhanced spirometry's diagnostic use. Spirometry is an ideal technique for diagnosing and monitoring the severity of COVID-19, a respiratory condition that compromises lung function. The Spirometer Market responded to this trend by creating spirometry devices for COVID-19 patients.
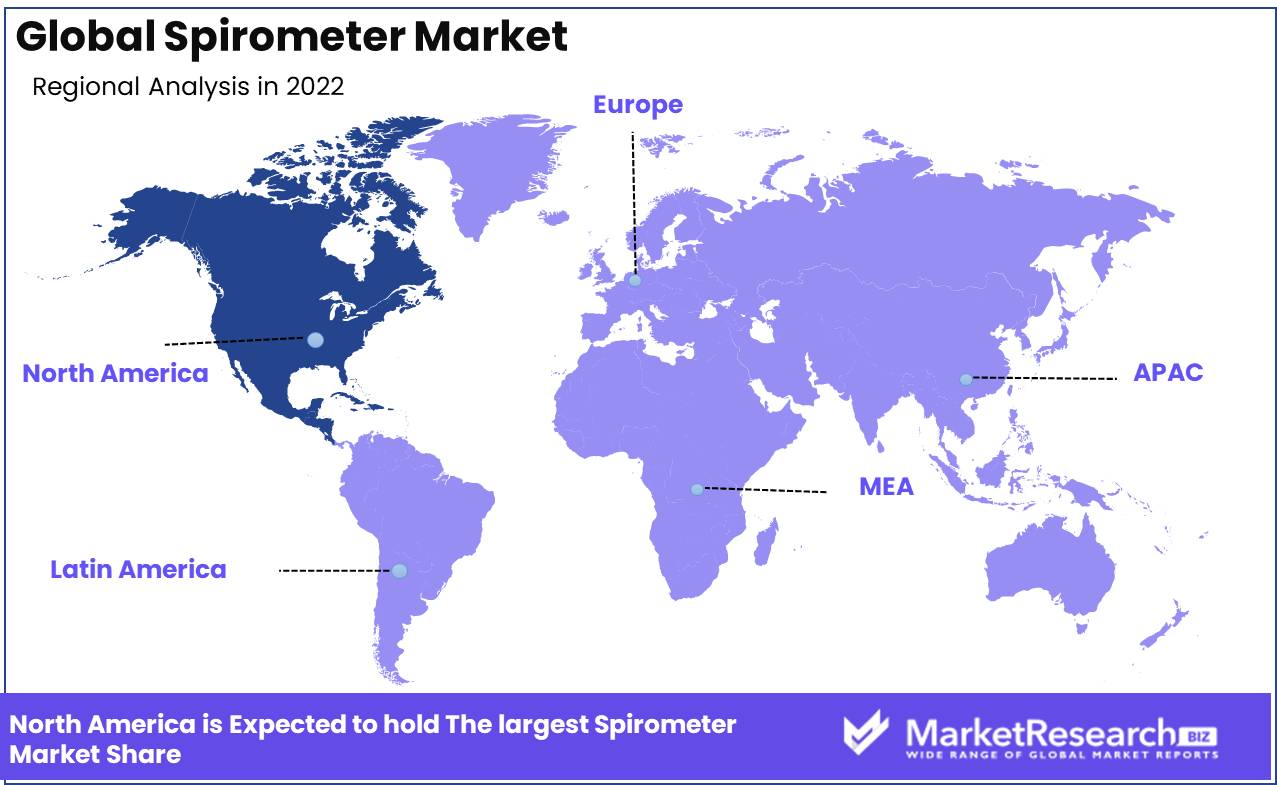
Regional Analysis
Telemedicine and North America's Respiratory Diseases. As time passes, people's daily lives, especially health, change. North American respiratory disease cases have skyrocketed in the past decade. We need to avoid and identify respiratory diseases as we work toward a healthier lifestyle. Telehealth services, also known as telemedicine, have made healthcare more convenient and accessible for patients and doctors.
Americans suffer from respiratory diseases most often. Asthma, COPD, and SARS-CoV-2, the virus that causes COVID-19, are common respiratory diseases. The healthcare sector is extremely concerned about the rising prevalence of these respiratory diseases.
In North America, air pollution is the main cause of respiratory diseases. Respiratory diseases are caused by air pollution. Pollution makes breathing harder. Modern autos and factories emit carbon monoxide, nitrogen oxides, and particulate matter. The air quality index is low, putting inhabitants at risk.
Smoking and poor diets also raise the prevalence of respiratory diseases among Americans. Millions of COVID-19 cases in North America increased respiratory illness.
North American telemedicine has grown exponentially in recent years. Telemedicine connects healthcare providers and patients via technology. Telemedicine has transformed healthcare by allowing patients to get services from home or work.
Telemedicine has various advantages over traditional healthcare services. It lowers healthcare expenditures and makes it easier for patients. It reduces wait times and lets patients consult with doctors remotely. Telemedicine enhances preventive care for respiratory diseases. Patients can now detect and treat respiratory diseases early, improving health outcomes.
During the COVID-19 pandemic, telemedicine helped patients get medical services remotely. Telemedicine services let patients be safe at home with social distancing. It has also helped healthcare providers decrease their virus exposure while offering patient services.
Key Regions and Countries
North America
- US
- Canada
- Mexico
Western Europe
- Germany
- France
- The UK
- Spain
- Italy
- Portugal
- Ireland
- Austria
- Switzerland
- Benelux
- Nordic
- Rest of Western Europe
Eastern Europe
- Russia
- Poland
- The Czech Republic
- Greece
- Rest of Eastern Europe
APAC
- China
- Japan
- South Korea
- India
- Australia & New Zealand
- Indonesia
- Malaysia
- Philippines
- Singapore
- Thailand
- Vietnam
- Rest of APAC
Latin America
- Brazil
- Colombia
- Chile
- Argentina
- Costa Rica
- Rest of Latin America
Middle East & Africa
- Algeria
- Egypt
- Israel
- Kuwait
- Nigeria
- Saudi Arabia
- South Africa
- Turkey
- United Arab Emirates
- Rest of MEA
Key Players Analysis
In the coming years, the spirometer market is anticipated to expand considerably, with key players expanding their market presence and maintaining competitiveness through product differentiation and acquisitions. Hill-Rom Holdings, Inc., Koninklijke Philips N.V., Schiller AG, Smiths Group plc, and Fukuda Sangyo Co., Ltd. are among the leading manufacturers of spirometers in the world.
The growing prevalence of respiratory diseases such as chronic obstructive pulmonary disease (COPD), asthma, and cystic fibrosis is driving the spirometer market. As the geriatric population grows, so does the demand for spirometry testing, as senior adults are more susceptible to respiratory disorders.
Technological advancements are creating new opportunities for spirometer manufacturers. A new iteration of handheld spirometers with wireless capabilities and mobile applications, for instance, provides physicians with an efficient and accurate method of diagnosing and monitoring patients.
In this market, acquisitions and strategic partnerships are also prevalent trends. Mortara Instrument, a leading provider of cardiology and vital signs monitoring devices, was recently acquired by Hill-Rom Holdings, Inc. in order to expand its respiratory monitoring and diagnostic capabilities. To enhance its respiratory care portfolio, Philips acquired RespirTech, the market leader in high-frequency chest wall oscillation.
Top Key Players in Spirometer Market
- Philips Healthcare
- Welch Allyn, Inc.
- Geratherm Respiratory GmbH
- Medisoft Group
- Midmark Corp.
- Cosmed srl
- MGC Diagnostics Corporation
- Vyaire Medical Inc.
- Hill-Rom Holdings, Inc.
- Koninklijke Philips N.V.
- Smiths Group plc
- Fukuda Sangyo Co. Ltd.
- Medical International Research
- Vitalograph
- ndd Medizintechnik AG
- Schiller Ag
- Jones Medical Instrument Company
Recent Development
- In May 2021, Hillrom acquired Breathe Technologies, a company that specializes in portable spirometry and non-invasive ventilation technology.
- In February 2021, Vitalograph introduced the Vitalograph micro, a portable, wireless spirometer designed for rapid testing in any environment.
- In September 2020, MGC Diagnostics acquired the New Leaf Health and Wellness division of Axcelis Technologies, which offers spirometry solutions.
- In August 2020, For the NuvoAir Home, a remote monitoring spirometer for patients with respiratory diseases, NuvoAir received FDA approval.
- In July 2020, Medtronic acquired SmartLung, a company that developed respiratory simulation technology for testing spirometers and other respiratory devices.
Report Scope:
Report Features Description Market Value (2022) USD 1.39 Bn Forecast Revenue (2032) USD 3.15 Bn CAGR (2023-2032) 8.5% Base Year for Estimation 2022 Historic Period 2016-2022 Forecast Period 2023-2032 Report Coverage Revenue Forecast, Market Dynamics, COVID-19 Impact, Competitive Landscape, Recent Developments Segments Covered Application Analysis(Asthma, COPD, Cystic Fibrosis, Pulmonary Fibrosis, Others), Technology Analysis (Volume Measurement, Flow Measurement, Peak Flow Measurement) Regional Analysis North America – The US, Canada, & Mexico; Western Europe – Germany, France, The UK, Spain, Italy, Portugal, Ireland, Austria, Switzerland, Benelux, Nordic, & Rest of Western Europe; Eastern Europe – Russia, Poland, The Czech Republic, Greece, & Rest of Eastern Europe; APAC – China, Japan, South Korea, India, Australia & New Zealand, Indonesia, Malaysia, Philippines, Singapore, Thailand, Vietnam, & Rest of APAC; Latin America – Brazil, Colombia, Chile, Argentina, Costa Rica, & Rest of Latin America; Middle East & Africa – Algeria, Egypt, Israel, Kuwait, Nigeria, Saudi Arabia, South Africa, Turkey, United Arab Emirates, & Rest of MEA Competitive Landscape Philips Healthcare, Welch Allyn, Inc., Geratherm Respiratory GmbH, Medisoft Group, Midmark Corp., Cosmed srl, MGC Diagnostics Corporation, Vyaire Medical Inc., Hill-Rom Holdings, Inc., Koninklijke Philips N.V., Smiths Group plc, Fukuda Sangyo Co. Ltd., Medical International Research, Vitalograph, ndd Medizintechnik AG, Schiller Ag, Jones Medical Instrument Company Customization Scope Customization for segments, region/country-level will be provided. Moreover, additional customization can be done based on the requirements. Purchase Options We have three licenses to opt for: Single User License, Multi-User License (Up to 5 Users), Corporate Use License (Unlimited User and Printable PDF) -
- 1. Executive Summary
- 1.1. Definition
- 1.2. Taxonomy
- 1.3. Research Scope
- 1.4. Key Analysis
- 1.5. Key Findings by Major Segments
- 1.6. Top strategies by Major Players
- 2. Global Thermoelectric Generators Market Overview
- 2.1. Thermoelectric Generators Market Dynamics
- 2.1.1. Drivers
- 2.1.2. Opportunities
- 2.1.3. Restraints
- 2.1.4. Challenges
- 2.2. Macro-economic Factors
- 2.3. Regulatory Framework
- 2.4. Market Investment Feasibility Index
- 2.5. PEST Analysis
- 2.6. PORTER’S Five Force Analysis
- 2.7. Drivers & Restraints Impact Analysis
- 2.8. Industry Chain Analysis
- 2.9. Cost Structure Analysis
- 2.10. Marketing Strategy
- 2.11. Russia-Ukraine War Impact Analysis
- 2.12. Opportunity Map Analysis
- 2.13. Market Competition Scenario Analysis
- 2.14. Product Life Cycle Analysis
- 2.15. Opportunity Orbits
- 2.16. Manufacturer Intensity Map
- 2.17. Major Companies sales by Value & Volume
- 2.1. Thermoelectric Generators Market Dynamics
- 3. Global Thermoelectric Generators Market Analysis, Opportunity and Forecast, 2016-2032
- 3.1. Global Thermoelectric Generators Market Analysis, 2016-2021
- 3.2. Global Thermoelectric Generators Market Opportunity and Forecast, 2023-2032
- 3.3. Global Thermoelectric Generators Market Analysis, Opportunity and Forecast, By Application Analysis, 2016-2032
- 3.3.1. Global Thermoelectric Generators Market Analysis by Application Analysis: Introduction
- 3.3.2. Market Size Absolute $ Opportunity Analysis and Forecast, By Application Analysis, 2016-2032
- 3.3.3. Asthma
- 3.3.4. COPD
- 3.3.5. Cystic Fibrosis
- 3.3.6. Pulmonary Fibrosis
- 3.3.7. Others
- 3.4. Global Thermoelectric Generators Market Analysis, Opportunity and Forecast, By Technology Analysis, 2016-2032
- 3.4.1. Global Thermoelectric Generators Market Analysis by Technology Analysis: Introduction
- 3.4.2. Market Size Absolute $ Opportunity Analysis and Forecast, By Technology Analysis, 2016-2032
- 3.4.3. Volume Measurement
- 3.4.4. Flow Measurement
- 3.4.5. Peak Flow Measurement
- 4. North America Thermoelectric Generators Market Analysis, Opportunity and Forecast, 2016-2032
- 4.1. North America Thermoelectric Generators Market Analysis, 2016-2021
- 4.2. North America Thermoelectric Generators Market Opportunity and Forecast, 2023-2032
- 4.3. North America Thermoelectric Generators Market Analysis, Opportunity and Forecast, By Application Analysis, 2016-2032
- 4.3.1. North America Thermoelectric Generators Market Analysis by Application Analysis: Introduction
- 4.3.2. Market Size Absolute $ Opportunity Analysis and Forecast, By Application Analysis, 2016-2032
- 4.3.3. Asthma
- 4.3.4. COPD
- 4.3.5. Cystic Fibrosis
- 4.3.6. Pulmonary Fibrosis
- 4.3.7. Others
- 4.4. North America Thermoelectric Generators Market Analysis, Opportunity and Forecast, By Technology Analysis, 2016-2032
- 4.4.1. North America Thermoelectric Generators Market Analysis by Technology Analysis: Introduction
- 4.4.2. Market Size Absolute $ Opportunity Analysis and Forecast, By Technology Analysis, 2016-2032
- 4.4.3. Volume Measurement
- 4.4.4. Flow Measurement
- 4.4.5. Peak Flow Measurement
- 4.5. North America Thermoelectric Generators Market Analysis, Opportunity and Forecast, By Country , 2016-2032
- 4.5.1. North America Thermoelectric Generators Market Analysis by Country : Introduction
- 4.5.2. Market Size Absolute $ Opportunity Analysis and Forecast, Country , 2016-2032
- 4.5.2.1. The US
- 4.5.2.2. Canada
- 4.5.2.3. Mexico
- 5. Western Europe Thermoelectric Generators Market Analysis, Opportunity and Forecast, 2016-2032
- 5.1. Western Europe Thermoelectric Generators Market Analysis, 2016-2021
- 5.2. Western Europe Thermoelectric Generators Market Opportunity and Forecast, 2023-2032
- 5.3. Western Europe Thermoelectric Generators Market Analysis, Opportunity and Forecast, By Application Analysis, 2016-2032
- 5.3.1. Western Europe Thermoelectric Generators Market Analysis by Application Analysis: Introduction
- 5.3.2. Market Size Absolute $ Opportunity Analysis and Forecast, By Application Analysis, 2016-2032
- 5.3.3. Asthma
- 5.3.4. COPD
- 5.3.5. Cystic Fibrosis
- 5.3.6. Pulmonary Fibrosis
- 5.3.7. Others
- 5.4. Western Europe Thermoelectric Generators Market Analysis, Opportunity and Forecast, By Technology Analysis, 2016-2032
- 5.4.1. Western Europe Thermoelectric Generators Market Analysis by Technology Analysis: Introduction
- 5.4.2. Market Size Absolute $ Opportunity Analysis and Forecast, By Technology Analysis, 2016-2032
- 5.4.3. Volume Measurement
- 5.4.4. Flow Measurement
- 5.4.5. Peak Flow Measurement
- 5.5. Western Europe Thermoelectric Generators Market Analysis, Opportunity and Forecast, By Country , 2016-2032
- 5.5.1. Western Europe Thermoelectric Generators Market Analysis by Country : Introduction
- 5.5.2. Market Size Absolute $ Opportunity Analysis and Forecast, Country , 2016-2032
- 5.5.2.1. Germany
- 5.5.2.2. France
- 5.5.2.3. The UK
- 5.5.2.4. Spain
- 5.5.2.5. Italy
- 5.5.2.6. Portugal
- 5.5.2.7. Ireland
- 5.5.2.8. Austria
- 5.5.2.9. Switzerland
- 5.5.2.10. Benelux
- 5.5.2.11. Nordic
- 5.5.2.12. Rest of Western Europe
- 6. Eastern Europe Thermoelectric Generators Market Analysis, Opportunity and Forecast, 2016-2032
- 6.1. Eastern Europe Thermoelectric Generators Market Analysis, 2016-2021
- 6.2. Eastern Europe Thermoelectric Generators Market Opportunity and Forecast, 2023-2032
- 6.3. Eastern Europe Thermoelectric Generators Market Analysis, Opportunity and Forecast, By Application Analysis, 2016-2032
- 6.3.1. Eastern Europe Thermoelectric Generators Market Analysis by Application Analysis: Introduction
- 6.3.2. Market Size Absolute $ Opportunity Analysis and Forecast, By Application Analysis, 2016-2032
- 6.3.3. Asthma
- 6.3.4. COPD
- 6.3.5. Cystic Fibrosis
- 6.3.6. Pulmonary Fibrosis
- 6.3.7. Others
- 6.4. Eastern Europe Thermoelectric Generators Market Analysis, Opportunity and Forecast, By Technology Analysis, 2016-2032
- 6.4.1. Eastern Europe Thermoelectric Generators Market Analysis by Technology Analysis: Introduction
- 6.4.2. Market Size Absolute $ Opportunity Analysis and Forecast, By Technology Analysis, 2016-2032
- 6.4.3. Volume Measurement
- 6.4.4. Flow Measurement
- 6.4.5. Peak Flow Measurement
- 6.5. Eastern Europe Thermoelectric Generators Market Analysis, Opportunity and Forecast, By Country , 2016-2032
- 6.5.1. Eastern Europe Thermoelectric Generators Market Analysis by Country : Introduction
- 6.5.2. Market Size Absolute $ Opportunity Analysis and Forecast, Country , 2016-2032
- 6.5.2.1. Russia
- 6.5.2.2. Poland
- 6.5.2.3. The Czech Republic
- 6.5.2.4. Greece
- 6.5.2.5. Rest of Eastern Europe
- 7. APAC Thermoelectric Generators Market Analysis, Opportunity and Forecast, 2016-2032
- 7.1. APAC Thermoelectric Generators Market Analysis, 2016-2021
- 7.2. APAC Thermoelectric Generators Market Opportunity and Forecast, 2023-2032
- 7.3. APAC Thermoelectric Generators Market Analysis, Opportunity and Forecast, By Application Analysis, 2016-2032
- 7.3.1. APAC Thermoelectric Generators Market Analysis by Application Analysis: Introduction
- 7.3.2. Market Size Absolute $ Opportunity Analysis and Forecast, By Application Analysis, 2016-2032
- 7.3.3. Asthma
- 7.3.4. COPD
- 7.3.5. Cystic Fibrosis
- 7.3.6. Pulmonary Fibrosis
- 7.3.7. Others
- 7.4. APAC Thermoelectric Generators Market Analysis, Opportunity and Forecast, By Technology Analysis, 2016-2032
- 7.4.1. APAC Thermoelectric Generators Market Analysis by Technology Analysis: Introduction
- 7.4.2. Market Size Absolute $ Opportunity Analysis and Forecast, By Technology Analysis, 2016-2032
- 7.4.3. Volume Measurement
- 7.4.4. Flow Measurement
- 7.4.5. Peak Flow Measurement
- 7.5. APAC Thermoelectric Generators Market Analysis, Opportunity and Forecast, By Country , 2016-2032
- 7.5.1. APAC Thermoelectric Generators Market Analysis by Country : Introduction
- 7.5.2. Market Size Absolute $ Opportunity Analysis and Forecast, Country , 2016-2032
- 7.5.2.1. China
- 7.5.2.2. Japan
- 7.5.2.3. South Korea
- 7.5.2.4. India
- 7.5.2.5. Australia & New Zeland
- 7.5.2.6. Indonesia
- 7.5.2.7. Malaysia
- 7.5.2.8. Philippines
- 7.5.2.9. Singapore
- 7.5.2.10. Thailand
- 7.5.2.11. Vietnam
- 7.5.2.12. Rest of APAC
- 8. Latin America Thermoelectric Generators Market Analysis, Opportunity and Forecast, 2016-2032
- 8.1. Latin America Thermoelectric Generators Market Analysis, 2016-2021
- 8.2. Latin America Thermoelectric Generators Market Opportunity and Forecast, 2023-2032
- 8.3. Latin America Thermoelectric Generators Market Analysis, Opportunity and Forecast, By Application Analysis, 2016-2032
- 8.3.1. Latin America Thermoelectric Generators Market Analysis by Application Analysis: Introduction
- 8.3.2. Market Size Absolute $ Opportunity Analysis and Forecast, By Application Analysis, 2016-2032
- 8.3.3. Asthma
- 8.3.4. COPD
- 8.3.5. Cystic Fibrosis
- 8.3.6. Pulmonary Fibrosis
- 8.3.7. Others
- 8.4. Latin America Thermoelectric Generators Market Analysis, Opportunity and Forecast, By Technology Analysis, 2016-2032
- 8.4.1. Latin America Thermoelectric Generators Market Analysis by Technology Analysis: Introduction
- 8.4.2. Market Size Absolute $ Opportunity Analysis and Forecast, By Technology Analysis, 2016-2032
- 8.4.3. Volume Measurement
- 8.4.4. Flow Measurement
- 8.4.5. Peak Flow Measurement
- 8.5. Latin America Thermoelectric Generators Market Analysis, Opportunity and Forecast, By Country , 2016-2032
- 8.5.1. Latin America Thermoelectric Generators Market Analysis by Country : Introduction
- 8.5.2. Market Size Absolute $ Opportunity Analysis and Forecast, Country , 2016-2032
- 8.5.2.1. Brazil
- 8.5.2.2. Colombia
- 8.5.2.3. Chile
- 8.5.2.4. Argentina
- 8.5.2.5. Costa Rica
- 8.5.2.6. Rest of Latin America
- 9. Middle East & Africa Thermoelectric Generators Market Analysis, Opportunity and Forecast, 2016-2032
- 9.1. Middle East & Africa Thermoelectric Generators Market Analysis, 2016-2021
- 9.2. Middle East & Africa Thermoelectric Generators Market Opportunity and Forecast, 2023-2032
- 9.3. Middle East & Africa Thermoelectric Generators Market Analysis, Opportunity and Forecast, By Application Analysis, 2016-2032
- 9.3.1. Middle East & Africa Thermoelectric Generators Market Analysis by Application Analysis: Introduction
- 9.3.2. Market Size Absolute $ Opportunity Analysis and Forecast, By Application Analysis, 2016-2032
- 9.3.3. Asthma
- 9.3.4. COPD
- 9.3.5. Cystic Fibrosis
- 9.3.6. Pulmonary Fibrosis
- 9.3.7. Others
- 9.4. Middle East & Africa Thermoelectric Generators Market Analysis, Opportunity and Forecast, By Technology Analysis, 2016-2032
- 9.4.1. Middle East & Africa Thermoelectric Generators Market Analysis by Technology Analysis: Introduction
- 9.4.2. Market Size Absolute $ Opportunity Analysis and Forecast, By Technology Analysis, 2016-2032
- 9.4.3. Volume Measurement
- 9.4.4. Flow Measurement
- 9.4.5. Peak Flow Measurement
- 9.5. Middle East & Africa Thermoelectric Generators Market Analysis, Opportunity and Forecast, By Country , 2016-2032
- 9.5.1. Middle East & Africa Thermoelectric Generators Market Analysis by Country : Introduction
- 9.5.2. Market Size Absolute $ Opportunity Analysis and Forecast, Country , 2016-2032
- 9.5.2.1. Algeria
- 9.5.2.2. Egypt
- 9.5.2.3. Israel
- 9.5.2.4. Kuwait
- 9.5.2.5. Nigeria
- 9.5.2.6. Saudi Arabia
- 9.5.2.7. South Africa
- 9.5.2.8. Turkey
- 9.5.2.9. The UAE
- 9.5.2.10. Rest of MEA
- 10. Global Thermoelectric Generators Market Analysis, Opportunity and Forecast, By Region , 2016-2032
- 10.1. Global Thermoelectric Generators Market Analysis by Region : Introduction
- 10.2. Market Size Absolute $ Opportunity Analysis and Forecast, By Region , 2016-2032
- 10.2.1. North America
- 10.2.2. Western Europe
- 10.2.3. Eastern Europe
- 10.2.4. APAC
- 10.2.5. Latin America
- 10.2.6. Middle East & Africa
- 11. Global Thermoelectric Generators Market Competitive Landscape, Market Share Analysis, and Company Profiles
- 11.1. Market Share Analysis
- 11.2. Company Profiles
- 11.3. Philips Healthcare
- 11.3.1. Company Overview
- 11.3.2. Financial Highlights
- 11.3.3. Product Portfolio
- 11.3.4. SWOT Analysis
- 11.3.5. Key Strategies and Developments
- 11.4. Welch Allyn, Inc.
- 11.4.1. Company Overview
- 11.4.2. Financial Highlights
- 11.4.3. Product Portfolio
- 11.4.4. SWOT Analysis
- 11.4.5. Key Strategies and Developments
- 11.5. Geratherm Respiratory GmbH
- 11.5.1. Company Overview
- 11.5.2. Financial Highlights
- 11.5.3. Product Portfolio
- 11.5.4. SWOT Analysis
- 11.5.5. Key Strategies and Developments
- 11.6. Medisoft Group
- 11.6.1. Company Overview
- 11.6.2. Financial Highlights
- 11.6.3. Product Portfolio
- 11.6.4. SWOT Analysis
- 11.6.5. Key Strategies and Developments
- 11.7. Midmark Corp.
- 11.7.1. Company Overview
- 11.7.2. Financial Highlights
- 11.7.3. Product Portfolio
- 11.7.4. SWOT Analysis
- 11.7.5. Key Strategies and Developments
- 11.8. Cosmed srl
- 11.8.1. Company Overview
- 11.8.2. Financial Highlights
- 11.8.3. Product Portfolio
- 11.8.4. SWOT Analysis
- 11.8.5. Key Strategies and Developments
- 11.9. MGC Diagnostics Corporation
- 11.9.1. Company Overview
- 11.9.2. Financial Highlights
- 11.9.3. Product Portfolio
- 11.9.4. SWOT Analysis
- 11.9.5. Key Strategies and Developments
- 11.10. Vyaire Medical Inc.
- 11.10.1. Company Overview
- 11.10.2. Financial Highlights
- 11.10.3. Product Portfolio
- 11.10.4. SWOT Analysis
- 11.10.5. Key Strategies and Developments
- 11.11. Hill-Rom Holdings, Inc.
- 11.11.1. Company Overview
- 11.11.2. Financial Highlights
- 11.11.3. Product Portfolio
- 11.11.4. SWOT Analysis
- 11.11.5. Key Strategies and Developments
- 11.12. Koninklijke Philips N.V.
- 11.12.1. Company Overview
- 11.12.2. Financial Highlights
- 11.12.3. Product Portfolio
- 11.12.4. SWOT Analysis
- 11.12.5. Key Strategies and Developments
- 11.13. Smiths Group plc
- 11.13.1. Company Overview
- 11.13.2. Financial Highlights
- 11.13.3. Product Portfolio
- 11.13.4. SWOT Analysis
- 11.13.5. Key Strategies and Developments
- 11.14. Fukuda Sangyo Co. Ltd.
- 11.14.1. Company Overview
- 11.14.2. Financial Highlights
- 11.14.3. Product Portfolio
- 11.14.4. SWOT Analysis
- 11.14.5. Key Strategies and Developments
- 11.15. Medical International Research
- 11.15.1. Company Overview
- 11.15.2. Financial Highlights
- 11.15.3. Product Portfolio
- 11.15.4. SWOT Analysis
- 11.15.5. Key Strategies and Developments
- 11.16. Vitalograph
- 11.16.1. Company Overview
- 11.16.2. Financial Highlights
- 11.16.3. Product Portfolio
- 11.16.4. SWOT Analysis
- 11.16.5. Key Strategies and Developments
- 11.17. ndd Medizintechnik AG
- 11.17.1. Company Overview
- 11.17.2. Financial Highlights
- 11.17.3. Product Portfolio
- 11.17.4. SWOT Analysis
- 11.17.5. Key Strategies and Developments
- 11.18. Schiller Ag
- 11.18.1. Company Overview
- 11.18.2. Financial Highlights
- 11.18.3. Product Portfolio
- 11.18.4. SWOT Analysis
- 11.18.5. Key Strategies and Developments
- 11.19. Jones Medical Instrument Company
- 11.19.1. Company Overview
- 11.19.2. Financial Highlights
- 11.19.3. Product Portfolio
- 11.19.4. SWOT Analysis
- 11.19.5. Key Strategies and Developments
- 12. Assumptions and Acronyms
- 13. Research Methodology
- 14. Contact
List of Figures
-
- Figure 1: Global Thermoelectric Generators Market Revenue (US$ Mn) Market Share by Application Analysis in 2022
- Figure 2: Global Thermoelectric Generators Market Attractiveness Analysis by Application Analysis, 2016-2032
- Figure 3: Global Thermoelectric Generators Market Revenue (US$ Mn) Market Share by Technology Analysisin 2022
- Figure 4: Global Thermoelectric Generators Market Attractiveness Analysis by Technology Analysis, 2016-2032
- Figure 5: Global Thermoelectric Generators Market Revenue (US$ Mn) Market Share by Region in 2022
- Figure 6: Global Thermoelectric Generators Market Attractiveness Analysis by Region, 2016-2032
- Figure 7: Global Thermoelectric Generators Market Revenue (US$ Mn) (2016-2032)
- Figure 8: Global Thermoelectric Generators Market Revenue (US$ Mn) Comparison by Region (2016-2032)
- Figure 9: Global Thermoelectric Generators Market Revenue (US$ Mn) Comparison by Application Analysis (2016-2032)
- Figure 10: Global Thermoelectric Generators Market Revenue (US$ Mn) Comparison by Technology Analysis (2016-2032)
- Figure 11: Global Thermoelectric Generators Market Y-o-Y Growth Rate Comparison by Region (2016-2032)
- Figure 12: Global Thermoelectric Generators Market Y-o-Y Growth Rate Comparison by Application Analysis (2016-2032)
- Figure 13: Global Thermoelectric Generators Market Y-o-Y Growth Rate Comparison by Technology Analysis (2016-2032)
- Figure 14: Global Thermoelectric Generators Market Share Comparison by Region (2016-2032)
- Figure 15: Global Thermoelectric Generators Market Share Comparison by Application Analysis (2016-2032)
- Figure 16: Global Thermoelectric Generators Market Share Comparison by Technology Analysis (2016-2032)
- Figure 17: North America Thermoelectric Generators Market Revenue (US$ Mn) Market Share by Application Analysisin 2022
- Figure 18: North America Thermoelectric Generators Market Attractiveness Analysis by Application Analysis, 2016-2032
- Figure 19: North America Thermoelectric Generators Market Revenue (US$ Mn) Market Share by Technology Analysisin 2022
- Figure 20: North America Thermoelectric Generators Market Attractiveness Analysis by Technology Analysis, 2016-2032
- Figure 21: North America Thermoelectric Generators Market Revenue (US$ Mn) Market Share by Country in 2022
- Figure 22: North America Thermoelectric Generators Market Attractiveness Analysis by Country, 2016-2032
- Figure 23: North America Thermoelectric Generators Market Revenue (US$ Mn) (2016-2032)
- Figure 24: North America Thermoelectric Generators Market Revenue (US$ Mn) Comparison by Country (2016-2032)
- Figure 25: North America Thermoelectric Generators Market Revenue (US$ Mn) Comparison by Application Analysis (2016-2032)
- Figure 26: North America Thermoelectric Generators Market Revenue (US$ Mn) Comparison by Technology Analysis (2016-2032)
- Figure 27: North America Thermoelectric Generators Market Y-o-Y Growth Rate Comparison by Country (2016-2032)
- Figure 28: North America Thermoelectric Generators Market Y-o-Y Growth Rate Comparison by Application Analysis (2016-2032)
- Figure 29: North America Thermoelectric Generators Market Y-o-Y Growth Rate Comparison by Technology Analysis (2016-2032)
- Figure 30: North America Thermoelectric Generators Market Share Comparison by Country (2016-2032)
- Figure 31: North America Thermoelectric Generators Market Share Comparison by Application Analysis (2016-2032)
- Figure 32: North America Thermoelectric Generators Market Share Comparison by Technology Analysis (2016-2032)
- Figure 33: Western Europe Thermoelectric Generators Market Revenue (US$ Mn) Market Share by Application Analysisin 2022
- Figure 34: Western Europe Thermoelectric Generators Market Attractiveness Analysis by Application Analysis, 2016-2032
- Figure 35: Western Europe Thermoelectric Generators Market Revenue (US$ Mn) Market Share by Technology Analysisin 2022
- Figure 36: Western Europe Thermoelectric Generators Market Attractiveness Analysis by Technology Analysis, 2016-2032
- Figure 37: Western Europe Thermoelectric Generators Market Revenue (US$ Mn) Market Share by Country in 2022
- Figure 38: Western Europe Thermoelectric Generators Market Attractiveness Analysis by Country, 2016-2032
- Figure 39: Western Europe Thermoelectric Generators Market Revenue (US$ Mn) (2016-2032)
- Figure 40: Western Europe Thermoelectric Generators Market Revenue (US$ Mn) Comparison by Country (2016-2032)
- Figure 41: Western Europe Thermoelectric Generators Market Revenue (US$ Mn) Comparison by Application Analysis (2016-2032)
- Figure 42: Western Europe Thermoelectric Generators Market Revenue (US$ Mn) Comparison by Technology Analysis (2016-2032)
- Figure 43: Western Europe Thermoelectric Generators Market Y-o-Y Growth Rate Comparison by Country (2016-2032)
- Figure 44: Western Europe Thermoelectric Generators Market Y-o-Y Growth Rate Comparison by Application Analysis (2016-2032)
- Figure 45: Western Europe Thermoelectric Generators Market Y-o-Y Growth Rate Comparison by Technology Analysis (2016-2032)
- Figure 46: Western Europe Thermoelectric Generators Market Share Comparison by Country (2016-2032)
- Figure 47: Western Europe Thermoelectric Generators Market Share Comparison by Application Analysis (2016-2032)
- Figure 48: Western Europe Thermoelectric Generators Market Share Comparison by Technology Analysis (2016-2032)
- Figure 49: Eastern Europe Thermoelectric Generators Market Revenue (US$ Mn) Market Share by Application Analysisin 2022
- Figure 50: Eastern Europe Thermoelectric Generators Market Attractiveness Analysis by Application Analysis, 2016-2032
- Figure 51: Eastern Europe Thermoelectric Generators Market Revenue (US$ Mn) Market Share by Technology Analysisin 2022
- Figure 52: Eastern Europe Thermoelectric Generators Market Attractiveness Analysis by Technology Analysis, 2016-2032
- Figure 53: Eastern Europe Thermoelectric Generators Market Revenue (US$ Mn) Market Share by Country in 2022
- Figure 54: Eastern Europe Thermoelectric Generators Market Attractiveness Analysis by Country, 2016-2032
- Figure 55: Eastern Europe Thermoelectric Generators Market Revenue (US$ Mn) (2016-2032)
- Figure 56: Eastern Europe Thermoelectric Generators Market Revenue (US$ Mn) Comparison by Country (2016-2032)
- Figure 57: Eastern Europe Thermoelectric Generators Market Revenue (US$ Mn) Comparison by Application Analysis (2016-2032)
- Figure 58: Eastern Europe Thermoelectric Generators Market Revenue (US$ Mn) Comparison by Technology Analysis (2016-2032)
- Figure 59: Eastern Europe Thermoelectric Generators Market Y-o-Y Growth Rate Comparison by Country (2016-2032)
- Figure 60: Eastern Europe Thermoelectric Generators Market Y-o-Y Growth Rate Comparison by Application Analysis (2016-2032)
- Figure 61: Eastern Europe Thermoelectric Generators Market Y-o-Y Growth Rate Comparison by Technology Analysis (2016-2032)
- Figure 62: Eastern Europe Thermoelectric Generators Market Share Comparison by Country (2016-2032)
- Figure 63: Eastern Europe Thermoelectric Generators Market Share Comparison by Application Analysis (2016-2032)
- Figure 64: Eastern Europe Thermoelectric Generators Market Share Comparison by Technology Analysis (2016-2032)
- Figure 65: APAC Thermoelectric Generators Market Revenue (US$ Mn) Market Share by Application Analysisin 2022
- Figure 66: APAC Thermoelectric Generators Market Attractiveness Analysis by Application Analysis, 2016-2032
- Figure 67: APAC Thermoelectric Generators Market Revenue (US$ Mn) Market Share by Technology Analysisin 2022
- Figure 68: APAC Thermoelectric Generators Market Attractiveness Analysis by Technology Analysis, 2016-2032
- Figure 69: APAC Thermoelectric Generators Market Revenue (US$ Mn) Market Share by Country in 2022
- Figure 70: APAC Thermoelectric Generators Market Attractiveness Analysis by Country, 2016-2032
- Figure 71: APAC Thermoelectric Generators Market Revenue (US$ Mn) (2016-2032)
- Figure 72: APAC Thermoelectric Generators Market Revenue (US$ Mn) Comparison by Country (2016-2032)
- Figure 73: APAC Thermoelectric Generators Market Revenue (US$ Mn) Comparison by Application Analysis (2016-2032)
- Figure 74: APAC Thermoelectric Generators Market Revenue (US$ Mn) Comparison by Technology Analysis (2016-2032)
- Figure 75: APAC Thermoelectric Generators Market Y-o-Y Growth Rate Comparison by Country (2016-2032)
- Figure 76: APAC Thermoelectric Generators Market Y-o-Y Growth Rate Comparison by Application Analysis (2016-2032)
- Figure 77: APAC Thermoelectric Generators Market Y-o-Y Growth Rate Comparison by Technology Analysis (2016-2032)
- Figure 78: APAC Thermoelectric Generators Market Share Comparison by Country (2016-2032)
- Figure 79: APAC Thermoelectric Generators Market Share Comparison by Application Analysis (2016-2032)
- Figure 80: APAC Thermoelectric Generators Market Share Comparison by Technology Analysis (2016-2032)
- Figure 81: Latin America Thermoelectric Generators Market Revenue (US$ Mn) Market Share by Application Analysisin 2022
- Figure 82: Latin America Thermoelectric Generators Market Attractiveness Analysis by Application Analysis, 2016-2032
- Figure 83: Latin America Thermoelectric Generators Market Revenue (US$ Mn) Market Share by Technology Analysisin 2022
- Figure 84: Latin America Thermoelectric Generators Market Attractiveness Analysis by Technology Analysis, 2016-2032
- Figure 85: Latin America Thermoelectric Generators Market Revenue (US$ Mn) Market Share by Country in 2022
- Figure 86: Latin America Thermoelectric Generators Market Attractiveness Analysis by Country, 2016-2032
- Figure 87: Latin America Thermoelectric Generators Market Revenue (US$ Mn) (2016-2032)
- Figure 88: Latin America Thermoelectric Generators Market Revenue (US$ Mn) Comparison by Country (2016-2032)
- Figure 89: Latin America Thermoelectric Generators Market Revenue (US$ Mn) Comparison by Application Analysis (2016-2032)
- Figure 90: Latin America Thermoelectric Generators Market Revenue (US$ Mn) Comparison by Technology Analysis (2016-2032)
- Figure 91: Latin America Thermoelectric Generators Market Y-o-Y Growth Rate Comparison by Country (2016-2032)
- Figure 92: Latin America Thermoelectric Generators Market Y-o-Y Growth Rate Comparison by Application Analysis (2016-2032)
- Figure 93: Latin America Thermoelectric Generators Market Y-o-Y Growth Rate Comparison by Technology Analysis (2016-2032)
- Figure 94: Latin America Thermoelectric Generators Market Share Comparison by Country (2016-2032)
- Figure 95: Latin America Thermoelectric Generators Market Share Comparison by Application Analysis (2016-2032)
- Figure 96: Latin America Thermoelectric Generators Market Share Comparison by Technology Analysis (2016-2032)
- Figure 97: Middle East & Africa Thermoelectric Generators Market Revenue (US$ Mn) Market Share by Application Analysisin 2022
- Figure 98: Middle East & Africa Thermoelectric Generators Market Attractiveness Analysis by Application Analysis, 2016-2032
- Figure 99: Middle East & Africa Thermoelectric Generators Market Revenue (US$ Mn) Market Share by Technology Analysisin 2022
- Figure 100: Middle East & Africa Thermoelectric Generators Market Attractiveness Analysis by Technology Analysis, 2016-2032
- Figure 101: Middle East & Africa Thermoelectric Generators Market Revenue (US$ Mn) Market Share by Country in 2022
- Figure 102: Middle East & Africa Thermoelectric Generators Market Attractiveness Analysis by Country, 2016-2032
- Figure 103: Middle East & Africa Thermoelectric Generators Market Revenue (US$ Mn) (2016-2032)
- Figure 104: Middle East & Africa Thermoelectric Generators Market Revenue (US$ Mn) Comparison by Country (2016-2032)
- Figure 105: Middle East & Africa Thermoelectric Generators Market Revenue (US$ Mn) Comparison by Application Analysis (2016-2032)
- Figure 106: Middle East & Africa Thermoelectric Generators Market Revenue (US$ Mn) Comparison by Technology Analysis (2016-2032)
- Figure 107: Middle East & Africa Thermoelectric Generators Market Y-o-Y Growth Rate Comparison by Country (2016-2032)
- Figure 108: Middle East & Africa Thermoelectric Generators Market Y-o-Y Growth Rate Comparison by Application Analysis (2016-2032)
- Figure 109: Middle East & Africa Thermoelectric Generators Market Y-o-Y Growth Rate Comparison by Technology Analysis (2016-2032)
- Figure 110: Middle East & Africa Thermoelectric Generators Market Share Comparison by Country (2016-2032)
- Figure 111: Middle East & Africa Thermoelectric Generators Market Share Comparison by Application Analysis (2016-2032)
- Figure 112: Middle East & Africa Thermoelectric Generators Market Share Comparison by Technology Analysis (2016-2032)
List of Tables
- Table 1: Global Thermoelectric Generators Market Comparison by Application Analysis (2016-2032)
- Table 2: Global Thermoelectric Generators Market Comparison by Technology Analysis (2016-2032)
- Table 3: Global Thermoelectric Generators Market Revenue (US$ Mn) Comparison by Region (2016-2032)
- Table 4: Global Thermoelectric Generators Market Revenue (US$ Mn) (2016-2032)
- Table 5: Global Thermoelectric Generators Market Revenue (US$ Mn) Comparison by Region (2016-2032)
- Table 6: Global Thermoelectric Generators Market Revenue (US$ Mn) Comparison by Application Analysis (2016-2032)
- Table 7: Global Thermoelectric Generators Market Revenue (US$ Mn) Comparison by Technology Analysis (2016-2032)
- Table 8: Global Thermoelectric Generators Market Y-o-Y Growth Rate Comparison by Region (2016-2032)
- Table 9: Global Thermoelectric Generators Market Y-o-Y Growth Rate Comparison by Application Analysis (2016-2032)
- Table 10: Global Thermoelectric Generators Market Y-o-Y Growth Rate Comparison by Technology Analysis (2016-2032)
- Table 11: Global Thermoelectric Generators Market Share Comparison by Region (2016-2032)
- Table 12: Global Thermoelectric Generators Market Share Comparison by Application Analysis (2016-2032)
- Table 13: Global Thermoelectric Generators Market Share Comparison by Technology Analysis (2016-2032)
- Table 14: North America Thermoelectric Generators Market Comparison by Technology Analysis (2016-2032)
- Table 15: North America Thermoelectric Generators Market Revenue (US$ Mn) Comparison by Country (2016-2032)
- Table 16: North America Thermoelectric Generators Market Revenue (US$ Mn) (2016-2032)
- Table 17: North America Thermoelectric Generators Market Revenue (US$ Mn) Comparison by Country (2016-2032)
- Table 18: North America Thermoelectric Generators Market Revenue (US$ Mn) Comparison by Application Analysis (2016-2032)
- Table 19: North America Thermoelectric Generators Market Revenue (US$ Mn) Comparison by Technology Analysis (2016-2032)
- Table 20: North America Thermoelectric Generators Market Y-o-Y Growth Rate Comparison by Country (2016-2032)
- Table 21: North America Thermoelectric Generators Market Y-o-Y Growth Rate Comparison by Application Analysis (2016-2032)
- Table 22: North America Thermoelectric Generators Market Y-o-Y Growth Rate Comparison by Technology Analysis (2016-2032)
- Table 23: North America Thermoelectric Generators Market Share Comparison by Country (2016-2032)
- Table 24: North America Thermoelectric Generators Market Share Comparison by Application Analysis (2016-2032)
- Table 25: North America Thermoelectric Generators Market Share Comparison by Technology Analysis (2016-2032)
- Table 26: Western Europe Thermoelectric Generators Market Comparison by Application Analysis (2016-2032)
- Table 27: Western Europe Thermoelectric Generators Market Comparison by Technology Analysis (2016-2032)
- Table 28: Western Europe Thermoelectric Generators Market Revenue (US$ Mn) Comparison by Country (2016-2032)
- Table 29: Western Europe Thermoelectric Generators Market Revenue (US$ Mn) (2016-2032)
- Table 30: Western Europe Thermoelectric Generators Market Revenue (US$ Mn) Comparison by Country (2016-2032)
- Table 31: Western Europe Thermoelectric Generators Market Revenue (US$ Mn) Comparison by Application Analysis (2016-2032)
- Table 32: Western Europe Thermoelectric Generators Market Revenue (US$ Mn) Comparison by Technology Analysis (2016-2032)
- Table 33: Western Europe Thermoelectric Generators Market Y-o-Y Growth Rate Comparison by Country (2016-2032)
- Table 34: Western Europe Thermoelectric Generators Market Y-o-Y Growth Rate Comparison by Application Analysis (2016-2032)
- Table 35: Western Europe Thermoelectric Generators Market Y-o-Y Growth Rate Comparison by Technology Analysis (2016-2032)
- Table 36: Western Europe Thermoelectric Generators Market Share Comparison by Country (2016-2032)
- Table 37: Western Europe Thermoelectric Generators Market Share Comparison by Application Analysis (2016-2032)
- Table 38: Western Europe Thermoelectric Generators Market Share Comparison by Technology Analysis (2016-2032)
- Table 39: Eastern Europe Thermoelectric Generators Market Comparison by Application Analysis (2016-2032)
- Table 40: Eastern Europe Thermoelectric Generators Market Comparison by Technology Analysis (2016-2032)
- Table 41: Eastern Europe Thermoelectric Generators Market Revenue (US$ Mn) Comparison by Country (2016-2032)
- Table 42: Eastern Europe Thermoelectric Generators Market Revenue (US$ Mn) (2016-2032)
- Table 43: Eastern Europe Thermoelectric Generators Market Revenue (US$ Mn) Comparison by Country (2016-2032)
- Table 44: Eastern Europe Thermoelectric Generators Market Revenue (US$ Mn) Comparison by Application Analysis (2016-2032)
- Table 45: Eastern Europe Thermoelectric Generators Market Revenue (US$ Mn) Comparison by Technology Analysis (2016-2032)
- Table 46: Eastern Europe Thermoelectric Generators Market Y-o-Y Growth Rate Comparison by Country (2016-2032)
- Table 47: Eastern Europe Thermoelectric Generators Market Y-o-Y Growth Rate Comparison by Application Analysis (2016-2032)
- Table 48: Eastern Europe Thermoelectric Generators Market Y-o-Y Growth Rate Comparison by Technology Analysis (2016-2032)
- Table 49: Eastern Europe Thermoelectric Generators Market Share Comparison by Country (2016-2032)
- Table 50: Eastern Europe Thermoelectric Generators Market Share Comparison by Application Analysis (2016-2032)
- Table 51: Eastern Europe Thermoelectric Generators Market Share Comparison by Technology Analysis (2016-2032)
- Table 52: APAC Thermoelectric Generators Market Comparison by Application Analysis (2016-2032)
- Table 53: APAC Thermoelectric Generators Market Comparison by Technology Analysis (2016-2032)
- Table 54: APAC Thermoelectric Generators Market Revenue (US$ Mn) Comparison by Country (2016-2032)
- Table 55: APAC Thermoelectric Generators Market Revenue (US$ Mn) (2016-2032)
- Table 56: APAC Thermoelectric Generators Market Revenue (US$ Mn) Comparison by Country (2016-2032)
- Table 57: APAC Thermoelectric Generators Market Revenue (US$ Mn) Comparison by Application Analysis (2016-2032)
- Table 58: APAC Thermoelectric Generators Market Revenue (US$ Mn) Comparison by Technology Analysis (2016-2032)
- Table 59: APAC Thermoelectric Generators Market Y-o-Y Growth Rate Comparison by Country (2016-2032)
- Table 60: APAC Thermoelectric Generators Market Y-o-Y Growth Rate Comparison by Application Analysis (2016-2032)
- Table 61: APAC Thermoelectric Generators Market Y-o-Y Growth Rate Comparison by Technology Analysis (2016-2032)
- Table 62: APAC Thermoelectric Generators Market Share Comparison by Country (2016-2032)
- Table 63: APAC Thermoelectric Generators Market Share Comparison by Application Analysis (2016-2032)
- Table 64: APAC Thermoelectric Generators Market Share Comparison by Technology Analysis (2016-2032)
- Table 65: Latin America Thermoelectric Generators Market Comparison by Application Analysis (2016-2032)
- Table 66: Latin America Thermoelectric Generators Market Comparison by Technology Analysis (2016-2032)
- Table 67: Latin America Thermoelectric Generators Market Revenue (US$ Mn) Comparison by Country (2016-2032)
- Table 68: Latin America Thermoelectric Generators Market Revenue (US$ Mn) (2016-2032)
- Table 69: Latin America Thermoelectric Generators Market Revenue (US$ Mn) Comparison by Country (2016-2032)
- Table 70: Latin America Thermoelectric Generators Market Revenue (US$ Mn) Comparison by Application Analysis (2016-2032)
- Table 71: Latin America Thermoelectric Generators Market Revenue (US$ Mn) Comparison by Technology Analysis (2016-2032)
- Table 72: Latin America Thermoelectric Generators Market Y-o-Y Growth Rate Comparison by Country (2016-2032)
- Table 73: Latin America Thermoelectric Generators Market Y-o-Y Growth Rate Comparison by Application Analysis (2016-2032)
- Table 74: Latin America Thermoelectric Generators Market Y-o-Y Growth Rate Comparison by Technology Analysis (2016-2032)
- Table 75: Latin America Thermoelectric Generators Market Share Comparison by Country (2016-2032)
- Table 76: Latin America Thermoelectric Generators Market Share Comparison by Application Analysis (2016-2032)
- Table 77: Latin America Thermoelectric Generators Market Share Comparison by Technology Analysis (2016-2032)
- Table 78: Middle East & Africa Thermoelectric Generators Market Comparison by Application Analysis (2016-2032)
- Table 79: Middle East & Africa Thermoelectric Generators Market Comparison by Technology Analysis (2016-2032)
- Table 80: Middle East & Africa Thermoelectric Generators Market Revenue (US$ Mn) Comparison by Country (2016-2032)
- Table 81: Middle East & Africa Thermoelectric Generators Market Revenue (US$ Mn) (2016-2032)
- Table 82: Middle East & Africa Thermoelectric Generators Market Revenue (US$ Mn) Comparison by Country (2016-2032)
- Table 83: Middle East & Africa Thermoelectric Generators Market Revenue (US$ Mn) Comparison by Application Analysis (2016-2032)
- Table 84: Middle East & Africa Thermoelectric Generators Market Revenue (US$ Mn) Comparison by Technology Analysis (2016-2032)
- Table 85: Middle East & Africa Thermoelectric Generators Market Y-o-Y Growth Rate Comparison by Country (2016-2032)
- Table 86: Middle East & Africa Thermoelectric Generators Market Y-o-Y Growth Rate Comparison by Application Analysis (2016-2032)
- Table 87: Middle East & Africa Thermoelectric Generators Market Y-o-Y Growth Rate Comparison by Technology Analysis (2016-2032)
- Table 88: Middle East & Africa Thermoelectric Generators Market Share Comparison by Country (2016-2032)
- Table 89: Middle East & Africa Thermoelectric Generators Market Share Comparison by Application Analysis (2016-2032)
- Table 90: Middle East & Africa Thermoelectric Generators Market Share Comparison by Technology Analysis (2016-2032)
- 1. Executive Summary
-
- Philips Healthcare
- Welch Allyn, Inc.
- Geratherm Respiratory GmbH
- Medisoft Group
- Midmark Corp.
- Cosmed srl
- MGC Diagnostics Corporation
- Vyaire Medical Inc.
- Hill-Rom Holdings, Inc.
- Koninklijke Philips N.V.
- Smiths Group plc
- Fukuda Sangyo Co. Ltd.
- Medical International Research
- Vitalograph
- ndd Medizintechnik AG
- Schiller Ag
- Jones Medical Instrument Company
Our Clients


View Our Licence Options
