
Soup Market Type Analysis (Instant, Canned, Dehydrated, Chilled, Others), Distribution Channel Analysis (Hypermarket/Supermarket, Convenience Stores, Online Retail, Others), Packaging Analysis (Canned, Pouched, Other Packaging), By Region And Companies - Industry Segment Outlook, Market Assessment, Competition Scenario, Trends, And Forecast 2023-2032
-
41283
-
Sept 2023
-
160
-


-
This report was compiled by Shreyas Rokade Shreyas Rokade is a seasoned Research Analyst with CMFE, bringing extensive expertise in market research and consulting, with a strong background in Chemical Engineering. Correspondence Team Lead-CMFE Linkedin | Detailed Market research Methodology Our methodology involves a mix of primary research, including interviews with leading mental health experts, and secondary research from reputable medical journals and databases. View Detailed Methodology Page
-
Quick Navigation
Report Overview
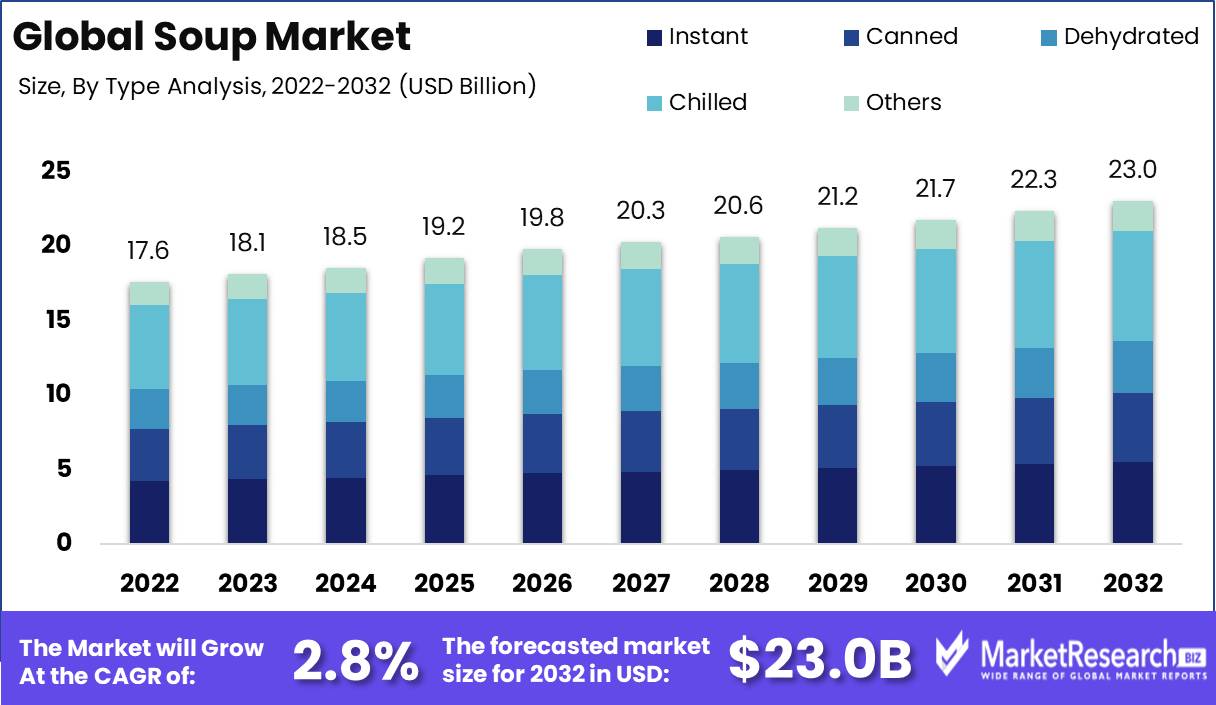
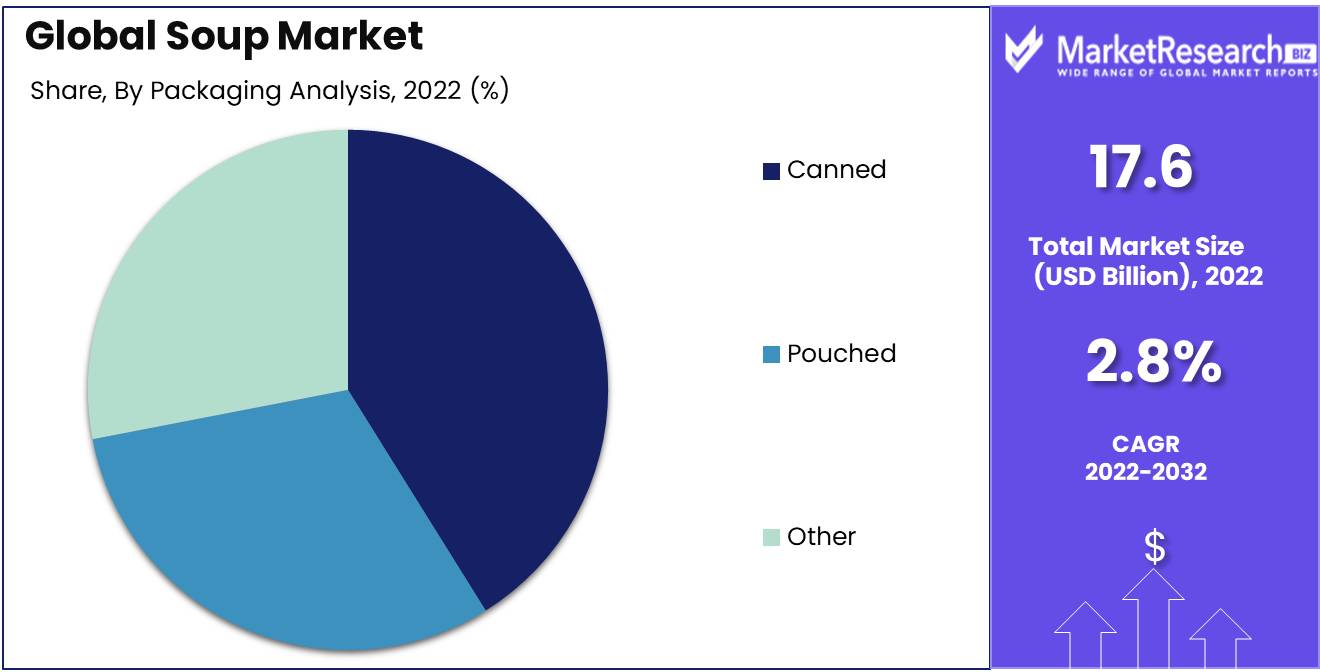
Soup Market size is expected to be worth around USD 23.0 Bn by 2032 from USD 17.6 Bn in 2022, growing at a CAGR of 2.8% during the forecast period from 2023 to 2032.
The Soup market is a thriving industry that caters to the taste buds and nutritional needs of people across the globe. Soups have long been a popular choice for a quick and nutritious meal, and the market for these savory delights continues to grow. With their versatility and wide range of flavors, soups offer a wide array of options for consumers.
In recent years, the Soup market has witnessed notable innovations that have revolutionized the industry. From innovative packaging designs to new flavors and ingredients, soup manufacturers are constantly pushing the boundaries to cater to the changing tastes and preferences of consumers. These innovations have not only enhanced the overall dining experience but also increased the shelf life and convenience of soups.
Major investments have been made in the Soup market, leading to the incorporation of soups into various products and services. Restaurants, cafes, and even food delivery apps have realized the potential of soups and have included them in their menus. This has not only diversified their offerings but also increased their customer base by catering to health-conscious individuals and those seeking a warm and comforting meal option.
The Soup market also holds immense potential for business applications. Soup manufacturers are partnering with various industries to provide customized products and solutions. For example, companies are collaborating with medical institutions to develop soups that cater to specific dietary requirements for patients with unique health conditions. Similarly, they are working with fitness centers and nutritionists to create soups that align with specific fitness goals. These collaborations and applications demonstrate the versatility and adaptability of soups in various business settings.
Driving factors
Increased Demand for Convenient Meal and Snack Options
With the hustle and bustle of modern life, people are constantly on the go, juggling various responsibilities and commitments. This busy lifestyle has led to an increased demand for convenient meal and snack options that can be easily consumed on the move or at the office. Soups have effortlessly adapted to this demand, providing a convenient and wholesome solution for those seeking a quick and satisfying meal.
The soup market has responded to this demand by offering a wide variety of options that cater to different dietary preferences and restrictions. Whether you follow a vegan, vegetarian, or gluten-free diet, there is a soup out there to suit your needs. Additionally, the availability of single-serving cups or pouches has further enhanced the convenience factor, making it easier for individuals to enjoy a hot and nourishing soup wherever they may be.
New Product Development and Flavor Innovations
To stay ahead of the competition and cater to the ever-evolving tastes of consumers, the soup market has seen a surge in new product development and flavor innovations. Gone are the days when soup was limited to classic flavors such as tomato or chicken noodle. Today, consumers can indulge in an exciting array of flavors, ranging from exotic blends like Thai curry to unique combinations like butternut squash and apple.
The introduction of innovative flavors and ingredients has not only expanded the options available to consumers but has also breathed new life into the soup market. By offering bold and adventurous flavors, soup brands have successfully captured the attention of consumers and piqued their curiosity. This constant innovation ensures that the soup market remains relevant and enticing in an increasingly crowded food landscape.
Popularity During Cold Weather Months
The appeal of soups extends beyond their convenience and flavor profiles. A significant driving factor behind the soup market's success is its popularity during cold weather months. When temperatures drop and the wind howls, nothing is quite as satisfying as a steaming bowl of hearty soup. It warms not only the body but also the soul, providing comfort and solace during chilly winter days.
The association of soups with cold weather months has been ingrained in our culinary culture for generations. Whether it's a classic chicken noodle soup or a rich and creamy chowder, these comforting dishes have become a staple in many households during the colder seasons. The appeal of a cozy and nourishing soup on a frosty evening is simply irresistible to many, making the soup market thrive during this time. Canned food plays a pivotal role in the Soup Market, serving as a convenient and long-lasting ingredient for various soup recipes, making it an essential pantry item for home cooks and food service establishments alike.
Restraining Factors
Seasonal Demand Fluctuations
Seasonal demand fluctuations pose a significant challenge for the soup market. As the temperature rises, consumers tend to opt for lighter meal options, preferring salads and sandwiches over hot soups. Conversely, during the colder months, the demand for soup surges. This fluctuation in consumer preferences creates a challenge for soup manufacturers who need to accommodate the seasonal variation in demand.
To overcome this obstacle, soup companies can embrace innovative marketing strategies to promote soup consumption throughout the year. By highlighting the versatility of soups and their ability to be enjoyed in various ways, such as chilled in summer or heated as a comforting winter meal, manufacturers can encourage consumers to include soup in their regular menu regardless of the season.
Short Shelf Life Once Opened Compared to Shelf-Stable Soup
Another restraining factor faced by the soup market is the short shelf life of opened canned soups. Once a can of soup is opened, it needs to be consumed within a few days to avoid spoilage. This limitation can be a deterrent for consumers, as they may worry about wasting food if they aren't able to consume the entire can within a short period.
In contrast, shelf-stable soups, such as those in powdered or liquid concentrate forms, can be stored for much longer periods without the risk of spoiling. These shelf-stable options offer convenience and flexibility to consumers, making them an attractive alternative to traditional canned soups.
Private Label Competition from Grocery Chains
The soup market faces tough competition from private label brands offered by grocery chains. These store-branded soups often provide cheaper alternatives to branded products, attracting price-conscious consumers. Additionally, grocery chains have the advantage of shelf space and prime positioning within their stores, making it challenging for branded soup manufacturers to stand out.
To overcome this competition, soup companies should focus on differentiating their products through unique flavors, high-quality ingredients, and superior packaging. To effectively promote their brand presence, collaboration with retailers to secure prominent shelf space and create appealing in-store displays can significantly impact consumer purchasing decisions. Engaging in effective marketing campaigns that highlight the uniqueness and benefits of their products can also help branded soup manufacturers consolidate their position in the market.
Type Analysis
The chilled segment dominates the soup market. When it comes to soups, consumers are increasingly preferring chilled alternatives over traditional options. With the growing emphasis on health and wellness, people are looking for fresh and natural products, and chilled soups provide just that. Chilled soups are made with fresh ingredients and are not subjected to high heat processing, preserving the flavors and nutrients.
The economic development in emerging economies is driving the adoption of the chilled segment in the soup market. As these economies experience growth and an increase in disposable income, consumers are becoming more health-conscious and are willing to spend on premium products like chilled soups. The rising urbanization and changing lifestyles in these economies are also contributing to the growing demand for convenience foods, including chilled soups.
Consumers are increasingly embracing the chilled segment in the soup market due to various reasons. The convenience factor plays a significant role, as chilled soups are ready-to-eat and require no additional preparation. They are also perceived as healthier options, as they are made with fresh ingredients and are free from preservatives and artificial additives. The availability of a wide variety of flavors and textures is another factor that attracts consumers to the chilled segment.
Distribution Channel Analysis
The hypermarket and supermarket segment dominate the soup market. These large-format retail stores provide consumers with a wide variety of soup options and allow for easy access to products. The convenience of one-stop shopping attracts consumers to these distribution channels.
The economic development in emerging economies is driving the adoption of hypermarket and supermarket segments in the soup market. As these economies experience growth and an increase in disposable income, consumers have more purchasing power and are able to shop in large-format retail stores. The expansion of hypermarkets and supermarkets in these economies further facilitates the availability of soup products to a larger consumer base.
Consumers prefer the hypermarket and supermarket segment in the soup market for several reasons. Firstly, these retail stores provide a wide range of soup brands, flavors, and packaging options, allowing consumers to choose according to their preferences. Secondly, the convenience factor is crucial, as consumers can find all their grocery needs in one place. Lastly, the competitive pricing offered by these large-format retail stores makes them an attractive option for cost-conscious consumers.
Packaging Analysis
The canned segment dominates the soup market. Canned soups have been a popular choice among consumers for their convenience and longer shelf life. The canning process preserves the soups and allows them to be stored for an extended period without compromising on taste or quality.
The economic development in emerging economies is driving the adoption of the canned segment in the soup market. As these economies witness growth and an increase in urbanization, consumers are looking for convenient and easy-to-prepare food options. Canned soups provide a solution as they are readily available, require minimal preparation, and can be stored for a longer duration.
Consumers are drawn to the canned segment in the soup market for various reasons. Firstly, the convenience offered by canned soups is a significant factor, as they can be quickly heated and consumed. They provide a hassle-free meal option for busy individuals. Secondly, the longer shelf life of canned soups appeals to consumers who want to stock up on convenient meal solutions. Lastly, the wide variety of flavors and options available in canned soups cater to different consumer preferences.
Key Market Segments
Type Analysis
- Instant
- Canned
- Dehydrated
- Chilled
- Others
Distribution Channel Analysis
- Hypermarket/Supermarket
- Convenience Stores
- Online Retail
- Others
Packaging Analysis
- Canned
- Pouched
- Other Packaging
Growth Opportunity
Premiumization in the Fresh Soup Segment
With an increasing number of consumers seeking healthier and more nutritious food options, the demand for fresh and premium soups has surged. The fresh soup segment provides an excellent opportunity for companies to cater to the evolving tastes and preferences of health-conscious individuals. By using high-quality ingredients, unique flavor profiles, and innovative packaging, soup manufacturers can capture the premium market and gain a competitive edge. Investing in research and development to create new and exciting fresh soup recipes can further enhance the growth potential in this segment.
Distribution through New Channels like Meal Kits and Foodservice
In today's fast-paced world, convenience plays a pivotal role in consumer decision-making. This has led to the emergence of new distribution channels like meal kits and foodservice, creating additional avenues for soup manufacturers to reach their target audience. Collaborating with meal kit providers allows soup brands to showcase their products to a broader customer base, offering convenient and pre-portioned soup options that can be easily prepared at home.
Marketing for Lunchboxes, Snacking, and Healthy Eating
With the increasing emphasis on health and wellness, marketing strategies that focus on lunchboxes, snacking, and healthy eating habits can significantly contribute to the growth of the soup market. Lunchboxes and on-the-go meals have become an integral part of modern lifestyles, where consumers are seeking convenient and nutritious options. Soup manufacturers can develop portion-controlled packaging, promoting soup as a wholesome, satisfying, and convenient meal option for individuals looking for a quick and healthy lunch or snack. Collaborations with nutritionists and wellness influencers can also help to position soups as a guilt-free indulgence, showcasing the nutritional benefits and versatility of different soup varieties.
Latest Trends
Fresh-Locked and Chilled Soup: A Growing Preference
In recent years, consumers have demonstrated an increased preference for fresh-locked and chilled soups over their canned alternatives. The allure lies in the fact that these soups are prepared using high-quality ingredients, often sourced locally, and undergo minimal processing. The result is a flavor that truly captures the essence of homemade soup, resonating with health-conscious consumers who prioritize freshness and nutrition. As a result, the market is witnessing a significant surge in demand for fresh-locked and chilled soup options, positioning them for sustained growth in the coming years.
Creative Flavor Fusions and Exotic Recipes: Igniting Culinary Exploration
The soup industry is undergoing a culinary revolution, with a strong emphasis on creative flavor fusions and the incorporation of international recipes. Gone are the days of basic tomato or chicken noodle soups dominating the shelves. Consumers are now seeking bold and unique flavor combinations that tantalize their taste buds and transport them to distant lands. With a plethora of options ranging from Thai coconut curry soups to Mexican tortilla soups, this trend is driving increased consumer interest and establishing a new era of adventurous soup consumption.
Natural, Vegetarian, and Limited Ingredient Recipes: Meeting Evolving Dietary Preferences
In response to a growing focus on healthy eating and dietary restrictions, the soup market is witnessing a surge in natural, vegetarian, and limited ingredient recipes. Consumers are becoming more conscious of the additives and preservatives present in their food and are demanding cleaner, more transparent options. Soup manufacturers are stepping up to the plate, offering a wide array of plant-based, organic, and clean-label soups to cater to these evolving dietary preferences. By ensuring ingredient integrity and transparency, manufacturers are instilling consumer confidence and elevating the reputation of their soup brands.
Regional Analysis
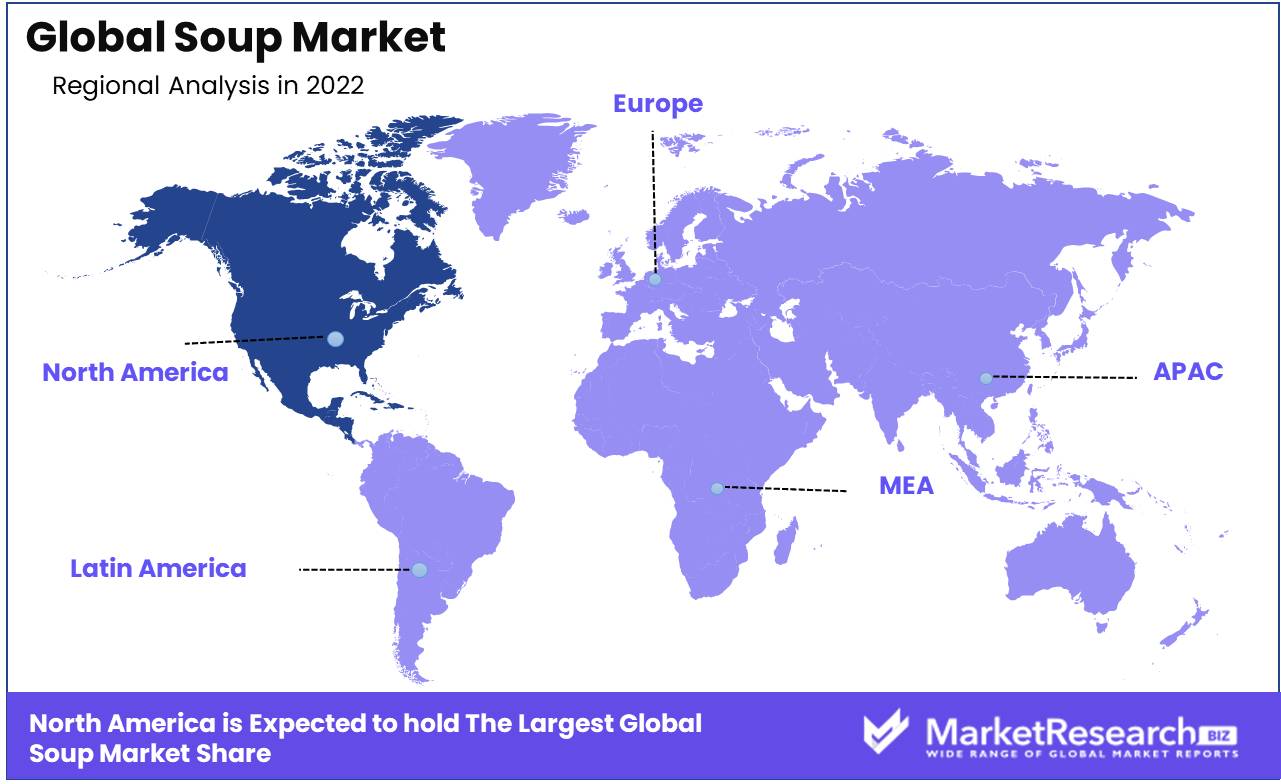
North America is the dominant region
North American consumers have increasingly embraced healthier and more nutritious food options, and the soup market is no exception. With a growing emphasis on wellbeing and mindful eating, individuals are gravitating towards soup varieties that are low in sodium, free from artificial additives, and rich in natural ingredients.
The dynamic nature of the North American soup market can be attributed, in part, to continuous innovation and product development efforts by key industry players. To meet the ever-changing demands of consumers, manufacturers have invested heavily in research and development, resulting in an array of innovative soup products being introduced to the market. From exotic flavors inspired by different cuisines to unique packaging formats for convenience, these product advancements have played a pivotal role in driving consumer interest and enticing new soup enthusiasts.
The extensive distribution networks in North America have greatly contributed to the market's dominance. With well-established retail chains, online platforms, and foodservice providers, soup manufacturers have been able to reach a wide range of consumers across the region. The ease of access to soup products through various channels has not only bolstered sales but also enabled consumers to enjoy a diverse range of soups from the comfort of their homes, workplaces, or while dining out.
Key Regions and Countries
North America
- US
- Canada
- Mexico
Western Europe
- Germany
- France
- The UK
- Spain
- Italy
- Portugal
- Ireland
- Austria
- Switzerland
- Benelux
- Nordic
- Rest of Western Europe
Eastern Europe
- Russia
- Poland
- The Czech Republic
- Greece
- Rest of Eastern Europe
APAC
- China
- Japan
- South Korea
- India
- Australia & New Zealand
- Indonesia
- Malaysia
- Philippines
- Singapore
- Thailand
- Vietnam
- Rest of APAC
Latin America
- Brazil
- Colombia
- Chile
- Argentina
- Costa Rica
- Rest of Latin America
Middle East & Africa
- Algeria
- Egypt
- Israel
- Kuwait
- Nigeria
- Saudi Arabia
- South Africa
- Turkey
- United Arab Emirates
- Rest of MEA
Key Players Analysis
The soup market is a highly competitive industry, with several key players vying for market dominance
The Campbell Soup Company, founded in 1869, is an American multinational food company known for its iconic Campbell's brand of canned soups. With a rich history and deep-rooted brand loyalty, the Campbell Soup Company has managed to remain a key player in the soup market.
Despite being a traditional giant, the company has adapted well to changing consumer preferences. Offering a wide variety of soup flavors, including vegetarian and gluten-free options, Campbell's caters to diverse dietary needs. They have also ventured into ready-to-eat soups and innovative packaging solutions, making their products convenient and appealing to consumers on the go.
Nestlé SA, a Swiss multinational food and beverage company, is renowned for its commitment to nutrition and wellness. With an extensive product portfolio that includes soups, among many other offerings, Nestlé has become a dominant player in the soup market.
Baxters Food Group Limited, a Scottish family-owned company, has carved a niche for itself by producing premium soups with exceptional quality. With a strong emphasis on using locally sourced ingredients, Baxters prides itself on delivering a taste that is truly authentic.
Top Key Players in Soup Market
- The Campbell Soup Company
- Nestlé S.A
- Baxters Food Group Limited
- General Mills, Inc
- Conagra Brands, Inc.
- Premier Foods Group Limited
- The Kraft Heinz Company
- Hindustan Unilever Limited
- Ottogi Co., Ltd
- Associated British Foods plc
Recent Development
- In 2021, global consumer goods giant Unilever acquired Soupologie, an esteemed premium soup brand based in the United Kingdom, in an effort to diversify its portfolio. This acquisition marked the beginning of a new chapter for both Unilever and Soupologie. By combining Unilever's vast resources and Soupologie's exceptional range of soups, the company aimed to capture unique market segments and appeal to a wider audience.
- In 2022, Campbell's Soup, renowned for its rich heritage and flavorful varieties, demonstrated its commitment to meeting the escalating demand for its products. The company invested a hefty $40 million to expand its production capacity at its North Carolina facility. This strategic move was expected to bolster Campbell's Soup's position as a market leader, ensuring a seamless supply chain and enhanced customer satisfaction.
- In 2022, Amy's Kitchen, the renowned manufacturer of nutritious and organic food products, received a substantial funding injection of $70 million. This gesture underscored the market's recognition of Amy's Kitchen's commitment to expansion and supporting its soup manufacturing capabilities. The newfound resources were expected to streamline production processes and empower the brand to meet the increasing demand for its delightful soups.
- In 2023, emphasizing health-conscious consumers, Progresso Soup delivered a remarkable innovation. The brand proudly launched a line of organic soups certified by the USDA, catering to the growing demand for natural, sustainable food choices. With this forward-thinking approach, Progresso Soup continued to position itself as a brand focused on meeting evolving dietary preferences and consumer expectations for high-quality ingredients.
Report Scope
Report Features Description Market Value (2022) USD 17.6 Bn Forecast Revenue (2032) USD 23.0 Bn CAGR (2023-2032) 2.8% Base Year for Estimation 2022 Historic Period 2016-2022 Forecast Period 2023-2032 Report Coverage Revenue Forecast, Market Dynamics, COVID-19 Impact, Competitive Landscape, Recent Developments Segments Covered Type Analysis (Instant, Canned, Dehydrated, Chilled, Others), Distribution Channel Analysis (Hypermarket/Supermarket, Convenience Stores, Online Retail, Others), Packaging Analysis (Canned, Pouched, Other Packaging) Regional Analysis North America – The US, Canada, & Mexico; Western Europe – Germany, France, The UK, Spain, Italy, Portugal, Ireland, Austria, Switzerland, Benelux, Nordic, & Rest of Western Europe; Eastern Europe – Russia, Poland, The Czech Republic, Greece, & Rest of Eastern Europe; APAC – China, Japan, South Korea, India, Australia & New Zealand, Indonesia, Malaysia, Philippines, Singapore, Thailand, Vietnam, & Rest of APAC; Latin America – Brazil, Colombia, Chile, Argentina, Costa Rica, & Rest of Latin America; Middle East & Africa – Algeria, Egypt, Israel, Kuwait, Nigeria, Saudi Arabia, South Africa, Turkey, United Arab Emirates, & Rest of MEA Competitive Landscape The Campbell Soup Company, Nestlé S.A, Baxters Food Group Limited, General Mills, Inc, Conagra Brands, Inc., Premier Foods Group Limited, The Kraft Heinz Company, Hindustan Unilever Limited, Ottogi Co., Ltd, Associated British Foods plc Customization Scope Customization for segments, region/country-level will be provided. Moreover, additional customization can be done based on the requirements. Purchase Options We have three licenses to opt for: Single User License, Multi-User License (Up to 5 Users), Corporate Use License (Unlimited User and Printable PDF) -
- 1. Executive Summary
- 1.1. Definition
- 1.2. Taxonomy
- 1.3. Research Scope
- 1.4. Key Analysis
- 1.5. Key Findings by Major Segments
- 1.6. Top strategies by Major Players
- 2. Global Soup Market Overview
- 2.1. Soup Market Dynamics
- 2.1.1. Drivers
- 2.1.2. Opportunities
- 2.1.3. Restraints
- 2.1.4. Challenges
- 2.2. Macro-economic Factors
- 2.3. Regulatory Framework
- 2.4. Market Investment Feasibility Index
- 2.5. PEST Analysis
- 2.6. PORTER’S Five Force Analysis
- 2.7. Drivers & Restraints Impact Analysis
- 2.8. Industry Chain Analysis
- 2.9. Cost Structure Analysis
- 2.10. Marketing Strategy
- 2.11. Russia-Ukraine War Impact Analysis
- 2.12. Opportunity Map Analysis
- 2.13. Market Competition Scenario Analysis
- 2.14. Product Life Cycle Analysis
- 2.15. Opportunity Orbits
- 2.16. Manufacturer Intensity Map
- 2.17. Major Companies sales by Value & Volume
- 2.1. Soup Market Dynamics
- 3. Global Soup Market Analysis, Opportunity and Forecast, 2016-2032
- 3.1. Global Soup Market Analysis, 2016-2021
- 3.2. Global Soup Market Opportunity and Forecast, 2023-2032
- 3.3. Global Soup Market Analysis, Opportunity and Forecast, By Type Analysis, 2016-2032
- 3.3.1. Global Soup Market Analysis by Type Analysis: Introduction
- 3.3.2. Market Size Absolute $ Opportunity Analysis and Forecast, By Type Analysis, 2016-2032
- 3.3.3. Instant
- 3.3.4. Canned
- 3.3.5. Dehydrated
- 3.3.6. Chilled
- 3.3.7. Others
- 3.4. Global Soup Market Analysis, Opportunity and Forecast, By Distribution Channel Analysis, 2016-2032
- 3.4.1. Global Soup Market Analysis by Distribution Channel Analysis: Introduction
- 3.4.2. Market Size Absolute $ Opportunity Analysis and Forecast, By Distribution Channel Analysis, 2016-2032
- 3.4.3. Hypermarket/Supermarket
- 3.4.4. Convenience Stores
- 3.4.5. Online Retail
- 3.4.6. Others
- 3.5. Global Soup Market Analysis, Opportunity and Forecast, By Packaging Analysis, 2016-2032
- 3.5.1. Global Soup Market Analysis by Packaging Analysis: Introduction
- 3.5.2. Market Size Absolute $ Opportunity Analysis and Forecast, By Packaging Analysis, 2016-2032
- 3.5.3. Canned
- 3.5.4. Pouched
- 3.5.5. Other Packaging
- 4. North America Soup Market Analysis, Opportunity and Forecast, 2016-2032
- 4.1. North America Soup Market Analysis, 2016-2021
- 4.2. North America Soup Market Opportunity and Forecast, 2023-2032
- 4.3. North America Soup Market Analysis, Opportunity and Forecast, By Type Analysis, 2016-2032
- 4.3.1. North America Soup Market Analysis by Type Analysis: Introduction
- 4.3.2. Market Size Absolute $ Opportunity Analysis and Forecast, By Type Analysis, 2016-2032
- 4.3.3. Instant
- 4.3.4. Canned
- 4.3.5. Dehydrated
- 4.3.6. Chilled
- 4.3.7. Others
- 4.4. North America Soup Market Analysis, Opportunity and Forecast, By Distribution Channel Analysis, 2016-2032
- 4.4.1. North America Soup Market Analysis by Distribution Channel Analysis: Introduction
- 4.4.2. Market Size Absolute $ Opportunity Analysis and Forecast, By Distribution Channel Analysis, 2016-2032
- 4.4.3. Hypermarket/Supermarket
- 4.4.4. Convenience Stores
- 4.4.5. Online Retail
- 4.4.6. Others
- 4.5. North America Soup Market Analysis, Opportunity and Forecast, By Packaging Analysis, 2016-2032
- 4.5.1. North America Soup Market Analysis by Packaging Analysis: Introduction
- 4.5.2. Market Size Absolute $ Opportunity Analysis and Forecast, By Packaging Analysis, 2016-2032
- 4.5.3. Canned
- 4.5.4. Pouched
- 4.5.5. Other Packaging
- 4.6. North America Soup Market Analysis, Opportunity and Forecast, By Country , 2016-2032
- 4.6.1. North America Soup Market Analysis by Country : Introduction
- 4.6.2. Market Size Absolute $ Opportunity Analysis and Forecast, Country , 2016-2032
- 4.6.2.1. The US
- 4.6.2.2. Canada
- 4.6.2.3. Mexico
- 5. Western Europe Soup Market Analysis, Opportunity and Forecast, 2016-2032
- 5.1. Western Europe Soup Market Analysis, 2016-2021
- 5.2. Western Europe Soup Market Opportunity and Forecast, 2023-2032
- 5.3. Western Europe Soup Market Analysis, Opportunity and Forecast, By Type Analysis, 2016-2032
- 5.3.1. Western Europe Soup Market Analysis by Type Analysis: Introduction
- 5.3.2. Market Size Absolute $ Opportunity Analysis and Forecast, By Type Analysis, 2016-2032
- 5.3.3. Instant
- 5.3.4. Canned
- 5.3.5. Dehydrated
- 5.3.6. Chilled
- 5.3.7. Others
- 5.4. Western Europe Soup Market Analysis, Opportunity and Forecast, By Distribution Channel Analysis, 2016-2032
- 5.4.1. Western Europe Soup Market Analysis by Distribution Channel Analysis: Introduction
- 5.4.2. Market Size Absolute $ Opportunity Analysis and Forecast, By Distribution Channel Analysis, 2016-2032
- 5.4.3. Hypermarket/Supermarket
- 5.4.4. Convenience Stores
- 5.4.5. Online Retail
- 5.4.6. Others
- 5.5. Western Europe Soup Market Analysis, Opportunity and Forecast, By Packaging Analysis, 2016-2032
- 5.5.1. Western Europe Soup Market Analysis by Packaging Analysis: Introduction
- 5.5.2. Market Size Absolute $ Opportunity Analysis and Forecast, By Packaging Analysis, 2016-2032
- 5.5.3. Canned
- 5.5.4. Pouched
- 5.5.5. Other Packaging
- 5.6. Western Europe Soup Market Analysis, Opportunity and Forecast, By Country , 2016-2032
- 5.6.1. Western Europe Soup Market Analysis by Country : Introduction
- 5.6.2. Market Size Absolute $ Opportunity Analysis and Forecast, Country , 2016-2032
- 5.6.2.1. Germany
- 5.6.2.2. France
- 5.6.2.3. The UK
- 5.6.2.4. Spain
- 5.6.2.5. Italy
- 5.6.2.6. Portugal
- 5.6.2.7. Ireland
- 5.6.2.8. Austria
- 5.6.2.9. Switzerland
- 5.6.2.10. Benelux
- 5.6.2.11. Nordic
- 5.6.2.12. Rest of Western Europe
- 6. Eastern Europe Soup Market Analysis, Opportunity and Forecast, 2016-2032
- 6.1. Eastern Europe Soup Market Analysis, 2016-2021
- 6.2. Eastern Europe Soup Market Opportunity and Forecast, 2023-2032
- 6.3. Eastern Europe Soup Market Analysis, Opportunity and Forecast, By Type Analysis, 2016-2032
- 6.3.1. Eastern Europe Soup Market Analysis by Type Analysis: Introduction
- 6.3.2. Market Size Absolute $ Opportunity Analysis and Forecast, By Type Analysis, 2016-2032
- 6.3.3. Instant
- 6.3.4. Canned
- 6.3.5. Dehydrated
- 6.3.6. Chilled
- 6.3.7. Others
- 6.4. Eastern Europe Soup Market Analysis, Opportunity and Forecast, By Distribution Channel Analysis, 2016-2032
- 6.4.1. Eastern Europe Soup Market Analysis by Distribution Channel Analysis: Introduction
- 6.4.2. Market Size Absolute $ Opportunity Analysis and Forecast, By Distribution Channel Analysis, 2016-2032
- 6.4.3. Hypermarket/Supermarket
- 6.4.4. Convenience Stores
- 6.4.5. Online Retail
- 6.4.6. Others
- 6.5. Eastern Europe Soup Market Analysis, Opportunity and Forecast, By Packaging Analysis, 2016-2032
- 6.5.1. Eastern Europe Soup Market Analysis by Packaging Analysis: Introduction
- 6.5.2. Market Size Absolute $ Opportunity Analysis and Forecast, By Packaging Analysis, 2016-2032
- 6.5.3. Canned
- 6.5.4. Pouched
- 6.5.5. Other Packaging
- 6.6. Eastern Europe Soup Market Analysis, Opportunity and Forecast, By Country , 2016-2032
- 6.6.1. Eastern Europe Soup Market Analysis by Country : Introduction
- 6.6.2. Market Size Absolute $ Opportunity Analysis and Forecast, Country , 2016-2032
- 6.6.2.1. Russia
- 6.6.2.2. Poland
- 6.6.2.3. The Czech Republic
- 6.6.2.4. Greece
- 6.6.2.5. Rest of Eastern Europe
- 7. APAC Soup Market Analysis, Opportunity and Forecast, 2016-2032
- 7.1. APAC Soup Market Analysis, 2016-2021
- 7.2. APAC Soup Market Opportunity and Forecast, 2023-2032
- 7.3. APAC Soup Market Analysis, Opportunity and Forecast, By Type Analysis, 2016-2032
- 7.3.1. APAC Soup Market Analysis by Type Analysis: Introduction
- 7.3.2. Market Size Absolute $ Opportunity Analysis and Forecast, By Type Analysis, 2016-2032
- 7.3.3. Instant
- 7.3.4. Canned
- 7.3.5. Dehydrated
- 7.3.6. Chilled
- 7.3.7. Others
- 7.4. APAC Soup Market Analysis, Opportunity and Forecast, By Distribution Channel Analysis, 2016-2032
- 7.4.1. APAC Soup Market Analysis by Distribution Channel Analysis: Introduction
- 7.4.2. Market Size Absolute $ Opportunity Analysis and Forecast, By Distribution Channel Analysis, 2016-2032
- 7.4.3. Hypermarket/Supermarket
- 7.4.4. Convenience Stores
- 7.4.5. Online Retail
- 7.4.6. Others
- 7.5. APAC Soup Market Analysis, Opportunity and Forecast, By Packaging Analysis, 2016-2032
- 7.5.1. APAC Soup Market Analysis by Packaging Analysis: Introduction
- 7.5.2. Market Size Absolute $ Opportunity Analysis and Forecast, By Packaging Analysis, 2016-2032
- 7.5.3. Canned
- 7.5.4. Pouched
- 7.5.5. Other Packaging
- 7.6. APAC Soup Market Analysis, Opportunity and Forecast, By Country , 2016-2032
- 7.6.1. APAC Soup Market Analysis by Country : Introduction
- 7.6.2. Market Size Absolute $ Opportunity Analysis and Forecast, Country , 2016-2032
- 7.6.2.1. China
- 7.6.2.2. Japan
- 7.6.2.3. South Korea
- 7.6.2.4. India
- 7.6.2.5. Australia & New Zeland
- 7.6.2.6. Indonesia
- 7.6.2.7. Malaysia
- 7.6.2.8. Philippines
- 7.6.2.9. Singapore
- 7.6.2.10. Thailand
- 7.6.2.11. Vietnam
- 7.6.2.12. Rest of APAC
- 8. Latin America Soup Market Analysis, Opportunity and Forecast, 2016-2032
- 8.1. Latin America Soup Market Analysis, 2016-2021
- 8.2. Latin America Soup Market Opportunity and Forecast, 2023-2032
- 8.3. Latin America Soup Market Analysis, Opportunity and Forecast, By Type Analysis, 2016-2032
- 8.3.1. Latin America Soup Market Analysis by Type Analysis: Introduction
- 8.3.2. Market Size Absolute $ Opportunity Analysis and Forecast, By Type Analysis, 2016-2032
- 8.3.3. Instant
- 8.3.4. Canned
- 8.3.5. Dehydrated
- 8.3.6. Chilled
- 8.3.7. Others
- 8.4. Latin America Soup Market Analysis, Opportunity and Forecast, By Distribution Channel Analysis, 2016-2032
- 8.4.1. Latin America Soup Market Analysis by Distribution Channel Analysis: Introduction
- 8.4.2. Market Size Absolute $ Opportunity Analysis and Forecast, By Distribution Channel Analysis, 2016-2032
- 8.4.3. Hypermarket/Supermarket
- 8.4.4. Convenience Stores
- 8.4.5. Online Retail
- 8.4.6. Others
- 8.5. Latin America Soup Market Analysis, Opportunity and Forecast, By Packaging Analysis, 2016-2032
- 8.5.1. Latin America Soup Market Analysis by Packaging Analysis: Introduction
- 8.5.2. Market Size Absolute $ Opportunity Analysis and Forecast, By Packaging Analysis, 2016-2032
- 8.5.3. Canned
- 8.5.4. Pouched
- 8.5.5. Other Packaging
- 8.6. Latin America Soup Market Analysis, Opportunity and Forecast, By Country , 2016-2032
- 8.6.1. Latin America Soup Market Analysis by Country : Introduction
- 8.6.2. Market Size Absolute $ Opportunity Analysis and Forecast, Country , 2016-2032
- 8.6.2.1. Brazil
- 8.6.2.2. Colombia
- 8.6.2.3. Chile
- 8.6.2.4. Argentina
- 8.6.2.5. Costa Rica
- 8.6.2.6. Rest of Latin America
- 9. Middle East & Africa Soup Market Analysis, Opportunity and Forecast, 2016-2032
- 9.1. Middle East & Africa Soup Market Analysis, 2016-2021
- 9.2. Middle East & Africa Soup Market Opportunity and Forecast, 2023-2032
- 9.3. Middle East & Africa Soup Market Analysis, Opportunity and Forecast, By Type Analysis, 2016-2032
- 9.3.1. Middle East & Africa Soup Market Analysis by Type Analysis: Introduction
- 9.3.2. Market Size Absolute $ Opportunity Analysis and Forecast, By Type Analysis, 2016-2032
- 9.3.3. Instant
- 9.3.4. Canned
- 9.3.5. Dehydrated
- 9.3.6. Chilled
- 9.3.7. Others
- 9.4. Middle East & Africa Soup Market Analysis, Opportunity and Forecast, By Distribution Channel Analysis, 2016-2032
- 9.4.1. Middle East & Africa Soup Market Analysis by Distribution Channel Analysis: Introduction
- 9.4.2. Market Size Absolute $ Opportunity Analysis and Forecast, By Distribution Channel Analysis, 2016-2032
- 9.4.3. Hypermarket/Supermarket
- 9.4.4. Convenience Stores
- 9.4.5. Online Retail
- 9.4.6. Others
- 9.5. Middle East & Africa Soup Market Analysis, Opportunity and Forecast, By Packaging Analysis, 2016-2032
- 9.5.1. Middle East & Africa Soup Market Analysis by Packaging Analysis: Introduction
- 9.5.2. Market Size Absolute $ Opportunity Analysis and Forecast, By Packaging Analysis, 2016-2032
- 9.5.3. Canned
- 9.5.4. Pouched
- 9.5.5. Other Packaging
- 9.6. Middle East & Africa Soup Market Analysis, Opportunity and Forecast, By Country , 2016-2032
- 9.6.1. Middle East & Africa Soup Market Analysis by Country : Introduction
- 9.6.2. Market Size Absolute $ Opportunity Analysis and Forecast, Country , 2016-2032
- 9.6.2.1. Algeria
- 9.6.2.2. Egypt
- 9.6.2.3. Israel
- 9.6.2.4. Kuwait
- 9.6.2.5. Nigeria
- 9.6.2.6. Saudi Arabia
- 9.6.2.7. South Africa
- 9.6.2.8. Turkey
- 9.6.2.9. The UAE
- 9.6.2.10. Rest of MEA
- 10. Global Soup Market Analysis, Opportunity and Forecast, By Region , 2016-2032
- 10.1. Global Soup Market Analysis by Region : Introduction
- 10.2. Market Size Absolute $ Opportunity Analysis and Forecast, By Region , 2016-2032
- 10.2.1. North America
- 10.2.2. Western Europe
- 10.2.3. Eastern Europe
- 10.2.4. APAC
- 10.2.5. Latin America
- 10.2.6. Middle East & Africa
- 11. Global Soup Market Competitive Landscape, Market Share Analysis, and Company Profiles
- 11.1. Market Share Analysis
- 11.2. Company Profiles
- 11.3. The Campbell Soup Company
- 11.3.1. Company Overview
- 11.3.2. Financial Highlights
- 11.3.3. Product Portfolio
- 11.3.4. SWOT Analysis
- 11.3.5. Key Strategies and Developments
- 11.4. Nestlé S.A
- 11.4.1. Company Overview
- 11.4.2. Financial Highlights
- 11.4.3. Product Portfolio
- 11.4.4. SWOT Analysis
- 11.4.5. Key Strategies and Developments
- 11.5. Baxters Food Group Limited
- 11.5.1. Company Overview
- 11.5.2. Financial Highlights
- 11.5.3. Product Portfolio
- 11.5.4. SWOT Analysis
- 11.5.5. Key Strategies and Developments
- 11.6. General Mills, Inc
- 11.6.1. Company Overview
- 11.6.2. Financial Highlights
- 11.6.3. Product Portfolio
- 11.6.4. SWOT Analysis
- 11.6.5. Key Strategies and Developments
- 11.7. Conagra Brands, Inc.
- 11.7.1. Company Overview
- 11.7.2. Financial Highlights
- 11.7.3. Product Portfolio
- 11.7.4. SWOT Analysis
- 11.7.5. Key Strategies and Developments
- 11.8. Premier Foods Group Limited
- 11.8.1. Company Overview
- 11.8.2. Financial Highlights
- 11.8.3. Product Portfolio
- 11.8.4. SWOT Analysis
- 11.8.5. Key Strategies and Developments
- 11.9. The Kraft Heinz Company
- 11.9.1. Company Overview
- 11.9.2. Financial Highlights
- 11.9.3. Product Portfolio
- 11.9.4. SWOT Analysis
- 11.9.5. Key Strategies and Developments
- 11.10. Hindustan Unilever Limited
- 11.10.1. Company Overview
- 11.10.2. Financial Highlights
- 11.10.3. Product Portfolio
- 11.10.4. SWOT Analysis
- 11.10.5. Key Strategies and Developments
- 11.11. Ottogi Co., Ltd
- 11.11.1. Company Overview
- 11.11.2. Financial Highlights
- 11.11.3. Product Portfolio
- 11.11.4. SWOT Analysis
- 11.11.5. Key Strategies and Developments
- 11.12. Associated British Foods plc
- 11.12.1. Company Overview
- 11.12.2. Financial Highlights
- 11.12.3. Product Portfolio
- 11.12.4. SWOT Analysis
- 11.12.5. Key Strategies and Developments
- 12. Assumptions and Acronyms
- 13. Research Methodology
- 14. Contact
- List of Figures
- Figure 1: Global Soup Market Revenue (US$ Mn) Market Share by Type Analysis in 2022
- Figure 2: Global Soup Market Attractiveness Analysis by Type Analysis, 2016-2032
- Figure 3: Global Soup Market Revenue (US$ Mn) Market Share by Distribution Channel Analysisin 2022
- Figure 4: Global Soup Market Attractiveness Analysis by Distribution Channel Analysis, 2016-2032
- Figure 5: Global Soup Market Revenue (US$ Mn) Market Share by Packaging Analysisin 2022
- Figure 6: Global Soup Market Attractiveness Analysis by Packaging Analysis, 2016-2032
- Figure 7: Global Soup Market Revenue (US$ Mn) Market Share by Region in 2022
- Figure 8: Global Soup Market Attractiveness Analysis by Region, 2016-2032
- Figure 9: Global Soup Market Revenue (US$ Mn) (2016-2032)
- Figure 10: Global Soup Market Revenue (US$ Mn) Comparison by Region (2016-2032)
- Figure 11: Global Soup Market Revenue (US$ Mn) Comparison by Type Analysis (2016-2032)
- Figure 12: Global Soup Market Revenue (US$ Mn) Comparison by Distribution Channel Analysis (2016-2032)
- Figure 13: Global Soup Market Revenue (US$ Mn) Comparison by Packaging Analysis (2016-2032)
- Figure 14: Global Soup Market Y-o-Y Growth Rate Comparison by Region (2016-2032)
- Figure 15: Global Soup Market Y-o-Y Growth Rate Comparison by Type Analysis (2016-2032)
- Figure 16: Global Soup Market Y-o-Y Growth Rate Comparison by Distribution Channel Analysis (2016-2032)
- Figure 17: Global Soup Market Y-o-Y Growth Rate Comparison by Packaging Analysis (2016-2032)
- Figure 18: Global Soup Market Share Comparison by Region (2016-2032)
- Figure 19: Global Soup Market Share Comparison by Type Analysis (2016-2032)
- Figure 20: Global Soup Market Share Comparison by Distribution Channel Analysis (2016-2032)
- Figure 21: Global Soup Market Share Comparison by Packaging Analysis (2016-2032)
- Figure 22: North America Soup Market Revenue (US$ Mn) Market Share by Type Analysisin 2022
- Figure 23: North America Soup Market Attractiveness Analysis by Type Analysis, 2016-2032
- Figure 24: North America Soup Market Revenue (US$ Mn) Market Share by Distribution Channel Analysisin 2022
- Figure 25: North America Soup Market Attractiveness Analysis by Distribution Channel Analysis, 2016-2032
- Figure 26: North America Soup Market Revenue (US$ Mn) Market Share by Packaging Analysisin 2022
- Figure 27: North America Soup Market Attractiveness Analysis by Packaging Analysis, 2016-2032
- Figure 28: North America Soup Market Revenue (US$ Mn) Market Share by Country in 2022
- Figure 29: North America Soup Market Attractiveness Analysis by Country, 2016-2032
- Figure 30: North America Soup Market Revenue (US$ Mn) (2016-2032)
- Figure 31: North America Soup Market Revenue (US$ Mn) Comparison by Country (2016-2032)
- Figure 32: North America Soup Market Revenue (US$ Mn) Comparison by Type Analysis (2016-2032)
- Figure 33: North America Soup Market Revenue (US$ Mn) Comparison by Distribution Channel Analysis (2016-2032)
- Figure 34: North America Soup Market Revenue (US$ Mn) Comparison by Packaging Analysis (2016-2032)
- Figure 35: North America Soup Market Y-o-Y Growth Rate Comparison by Country (2016-2032)
- Figure 36: North America Soup Market Y-o-Y Growth Rate Comparison by Type Analysis (2016-2032)
- Figure 37: North America Soup Market Y-o-Y Growth Rate Comparison by Distribution Channel Analysis (2016-2032)
- Figure 38: North America Soup Market Y-o-Y Growth Rate Comparison by Packaging Analysis (2016-2032)
- Figure 39: North America Soup Market Share Comparison by Country (2016-2032)
- Figure 40: North America Soup Market Share Comparison by Type Analysis (2016-2032)
- Figure 41: North America Soup Market Share Comparison by Distribution Channel Analysis (2016-2032)
- Figure 42: North America Soup Market Share Comparison by Packaging Analysis (2016-2032)
- Figure 43: Western Europe Soup Market Revenue (US$ Mn) Market Share by Type Analysisin 2022
- Figure 44: Western Europe Soup Market Attractiveness Analysis by Type Analysis, 2016-2032
- Figure 45: Western Europe Soup Market Revenue (US$ Mn) Market Share by Distribution Channel Analysisin 2022
- Figure 46: Western Europe Soup Market Attractiveness Analysis by Distribution Channel Analysis, 2016-2032
- Figure 47: Western Europe Soup Market Revenue (US$ Mn) Market Share by Packaging Analysisin 2022
- Figure 48: Western Europe Soup Market Attractiveness Analysis by Packaging Analysis, 2016-2032
- Figure 49: Western Europe Soup Market Revenue (US$ Mn) Market Share by Country in 2022
- Figure 50: Western Europe Soup Market Attractiveness Analysis by Country, 2016-2032
- Figure 51: Western Europe Soup Market Revenue (US$ Mn) (2016-2032)
- Figure 52: Western Europe Soup Market Revenue (US$ Mn) Comparison by Country (2016-2032)
- Figure 53: Western Europe Soup Market Revenue (US$ Mn) Comparison by Type Analysis (2016-2032)
- Figure 54: Western Europe Soup Market Revenue (US$ Mn) Comparison by Distribution Channel Analysis (2016-2032)
- Figure 55: Western Europe Soup Market Revenue (US$ Mn) Comparison by Packaging Analysis (2016-2032)
- Figure 56: Western Europe Soup Market Y-o-Y Growth Rate Comparison by Country (2016-2032)
- Figure 57: Western Europe Soup Market Y-o-Y Growth Rate Comparison by Type Analysis (2016-2032)
- Figure 58: Western Europe Soup Market Y-o-Y Growth Rate Comparison by Distribution Channel Analysis (2016-2032)
- Figure 59: Western Europe Soup Market Y-o-Y Growth Rate Comparison by Packaging Analysis (2016-2032)
- Figure 60: Western Europe Soup Market Share Comparison by Country (2016-2032)
- Figure 61: Western Europe Soup Market Share Comparison by Type Analysis (2016-2032)
- Figure 62: Western Europe Soup Market Share Comparison by Distribution Channel Analysis (2016-2032)
- Figure 63: Western Europe Soup Market Share Comparison by Packaging Analysis (2016-2032)
- Figure 64: Eastern Europe Soup Market Revenue (US$ Mn) Market Share by Type Analysisin 2022
- Figure 65: Eastern Europe Soup Market Attractiveness Analysis by Type Analysis, 2016-2032
- Figure 66: Eastern Europe Soup Market Revenue (US$ Mn) Market Share by Distribution Channel Analysisin 2022
- Figure 67: Eastern Europe Soup Market Attractiveness Analysis by Distribution Channel Analysis, 2016-2032
- Figure 68: Eastern Europe Soup Market Revenue (US$ Mn) Market Share by Packaging Analysisin 2022
- Figure 69: Eastern Europe Soup Market Attractiveness Analysis by Packaging Analysis, 2016-2032
- Figure 70: Eastern Europe Soup Market Revenue (US$ Mn) Market Share by Country in 2022
- Figure 71: Eastern Europe Soup Market Attractiveness Analysis by Country, 2016-2032
- Figure 72: Eastern Europe Soup Market Revenue (US$ Mn) (2016-2032)
- Figure 73: Eastern Europe Soup Market Revenue (US$ Mn) Comparison by Country (2016-2032)
- Figure 74: Eastern Europe Soup Market Revenue (US$ Mn) Comparison by Type Analysis (2016-2032)
- Figure 75: Eastern Europe Soup Market Revenue (US$ Mn) Comparison by Distribution Channel Analysis (2016-2032)
- Figure 76: Eastern Europe Soup Market Revenue (US$ Mn) Comparison by Packaging Analysis (2016-2032)
- Figure 77: Eastern Europe Soup Market Y-o-Y Growth Rate Comparison by Country (2016-2032)
- Figure 78: Eastern Europe Soup Market Y-o-Y Growth Rate Comparison by Type Analysis (2016-2032)
- Figure 79: Eastern Europe Soup Market Y-o-Y Growth Rate Comparison by Distribution Channel Analysis (2016-2032)
- Figure 80: Eastern Europe Soup Market Y-o-Y Growth Rate Comparison by Packaging Analysis (2016-2032)
- Figure 81: Eastern Europe Soup Market Share Comparison by Country (2016-2032)
- Figure 82: Eastern Europe Soup Market Share Comparison by Type Analysis (2016-2032)
- Figure 83: Eastern Europe Soup Market Share Comparison by Distribution Channel Analysis (2016-2032)
- Figure 84: Eastern Europe Soup Market Share Comparison by Packaging Analysis (2016-2032)
- Figure 85: APAC Soup Market Revenue (US$ Mn) Market Share by Type Analysisin 2022
- Figure 86: APAC Soup Market Attractiveness Analysis by Type Analysis, 2016-2032
- Figure 87: APAC Soup Market Revenue (US$ Mn) Market Share by Distribution Channel Analysisin 2022
- Figure 88: APAC Soup Market Attractiveness Analysis by Distribution Channel Analysis, 2016-2032
- Figure 89: APAC Soup Market Revenue (US$ Mn) Market Share by Packaging Analysisin 2022
- Figure 90: APAC Soup Market Attractiveness Analysis by Packaging Analysis, 2016-2032
- Figure 91: APAC Soup Market Revenue (US$ Mn) Market Share by Country in 2022
- Figure 92: APAC Soup Market Attractiveness Analysis by Country, 2016-2032
- Figure 93: APAC Soup Market Revenue (US$ Mn) (2016-2032)
- Figure 94: APAC Soup Market Revenue (US$ Mn) Comparison by Country (2016-2032)
- Figure 95: APAC Soup Market Revenue (US$ Mn) Comparison by Type Analysis (2016-2032)
- Figure 96: APAC Soup Market Revenue (US$ Mn) Comparison by Distribution Channel Analysis (2016-2032)
- Figure 97: APAC Soup Market Revenue (US$ Mn) Comparison by Packaging Analysis (2016-2032)
- Figure 98: APAC Soup Market Y-o-Y Growth Rate Comparison by Country (2016-2032)
- Figure 99: APAC Soup Market Y-o-Y Growth Rate Comparison by Type Analysis (2016-2032)
- Figure 100: APAC Soup Market Y-o-Y Growth Rate Comparison by Distribution Channel Analysis (2016-2032)
- Figure 101: APAC Soup Market Y-o-Y Growth Rate Comparison by Packaging Analysis (2016-2032)
- Figure 102: APAC Soup Market Share Comparison by Country (2016-2032)
- Figure 103: APAC Soup Market Share Comparison by Type Analysis (2016-2032)
- Figure 104: APAC Soup Market Share Comparison by Distribution Channel Analysis (2016-2032)
- Figure 105: APAC Soup Market Share Comparison by Packaging Analysis (2016-2032)
- Figure 106: Latin America Soup Market Revenue (US$ Mn) Market Share by Type Analysisin 2022
- Figure 107: Latin America Soup Market Attractiveness Analysis by Type Analysis, 2016-2032
- Figure 108: Latin America Soup Market Revenue (US$ Mn) Market Share by Distribution Channel Analysisin 2022
- Figure 109: Latin America Soup Market Attractiveness Analysis by Distribution Channel Analysis, 2016-2032
- Figure 110: Latin America Soup Market Revenue (US$ Mn) Market Share by Packaging Analysisin 2022
- Figure 111: Latin America Soup Market Attractiveness Analysis by Packaging Analysis, 2016-2032
- Figure 112: Latin America Soup Market Revenue (US$ Mn) Market Share by Country in 2022
- Figure 113: Latin America Soup Market Attractiveness Analysis by Country, 2016-2032
- Figure 114: Latin America Soup Market Revenue (US$ Mn) (2016-2032)
- Figure 115: Latin America Soup Market Revenue (US$ Mn) Comparison by Country (2016-2032)
- Figure 116: Latin America Soup Market Revenue (US$ Mn) Comparison by Type Analysis (2016-2032)
- Figure 117: Latin America Soup Market Revenue (US$ Mn) Comparison by Distribution Channel Analysis (2016-2032)
- Figure 118: Latin America Soup Market Revenue (US$ Mn) Comparison by Packaging Analysis (2016-2032)
- Figure 119: Latin America Soup Market Y-o-Y Growth Rate Comparison by Country (2016-2032)
- Figure 120: Latin America Soup Market Y-o-Y Growth Rate Comparison by Type Analysis (2016-2032)
- Figure 121: Latin America Soup Market Y-o-Y Growth Rate Comparison by Distribution Channel Analysis (2016-2032)
- Figure 122: Latin America Soup Market Y-o-Y Growth Rate Comparison by Packaging Analysis (2016-2032)
- Figure 123: Latin America Soup Market Share Comparison by Country (2016-2032)
- Figure 124: Latin America Soup Market Share Comparison by Type Analysis (2016-2032)
- Figure 125: Latin America Soup Market Share Comparison by Distribution Channel Analysis (2016-2032)
- Figure 126: Latin America Soup Market Share Comparison by Packaging Analysis (2016-2032)
- Figure 127: Middle East & Africa Soup Market Revenue (US$ Mn) Market Share by Type Analysisin 2022
- Figure 128: Middle East & Africa Soup Market Attractiveness Analysis by Type Analysis, 2016-2032
- Figure 129: Middle East & Africa Soup Market Revenue (US$ Mn) Market Share by Distribution Channel Analysisin 2022
- Figure 130: Middle East & Africa Soup Market Attractiveness Analysis by Distribution Channel Analysis, 2016-2032
- Figure 131: Middle East & Africa Soup Market Revenue (US$ Mn) Market Share by Packaging Analysisin 2022
- Figure 132: Middle East & Africa Soup Market Attractiveness Analysis by Packaging Analysis, 2016-2032
- Figure 133: Middle East & Africa Soup Market Revenue (US$ Mn) Market Share by Country in 2022
- Figure 134: Middle East & Africa Soup Market Attractiveness Analysis by Country, 2016-2032
- Figure 135: Middle East & Africa Soup Market Revenue (US$ Mn) (2016-2032)
- Figure 136: Middle East & Africa Soup Market Revenue (US$ Mn) Comparison by Country (2016-2032)
- Figure 137: Middle East & Africa Soup Market Revenue (US$ Mn) Comparison by Type Analysis (2016-2032)
- Figure 138: Middle East & Africa Soup Market Revenue (US$ Mn) Comparison by Distribution Channel Analysis (2016-2032)
- Figure 139: Middle East & Africa Soup Market Revenue (US$ Mn) Comparison by Packaging Analysis (2016-2032)
- Figure 140: Middle East & Africa Soup Market Y-o-Y Growth Rate Comparison by Country (2016-2032)
- Figure 141: Middle East & Africa Soup Market Y-o-Y Growth Rate Comparison by Type Analysis (2016-2032)
- Figure 142: Middle East & Africa Soup Market Y-o-Y Growth Rate Comparison by Distribution Channel Analysis (2016-2032)
- Figure 143: Middle East & Africa Soup Market Y-o-Y Growth Rate Comparison by Packaging Analysis (2016-2032)
- Figure 144: Middle East & Africa Soup Market Share Comparison by Country (2016-2032)
- Figure 145: Middle East & Africa Soup Market Share Comparison by Type Analysis (2016-2032)
- Figure 146: Middle East & Africa Soup Market Share Comparison by Distribution Channel Analysis (2016-2032)
- Figure 147: Middle East & Africa Soup Market Share Comparison by Packaging Analysis (2016-2032)
- List of Tables
- Table 1: Global Soup Market Comparison by Type Analysis (2016-2032)
- Table 2: Global Soup Market Comparison by Distribution Channel Analysis (2016-2032)
- Table 3: Global Soup Market Comparison by Packaging Analysis (2016-2032)
- Table 4: Global Soup Market Revenue (US$ Mn) Comparison by Region (2016-2032)
- Table 5: Global Soup Market Revenue (US$ Mn) (2016-2032)
- Table 6: Global Soup Market Revenue (US$ Mn) Comparison by Region (2016-2032)
- Table 7: Global Soup Market Revenue (US$ Mn) Comparison by Type Analysis (2016-2032)
- Table 8: Global Soup Market Revenue (US$ Mn) Comparison by Distribution Channel Analysis (2016-2032)
- Table 9: Global Soup Market Revenue (US$ Mn) Comparison by Packaging Analysis (2016-2032)
- Table 10: Global Soup Market Y-o-Y Growth Rate Comparison by Region (2016-2032)
- Table 11: Global Soup Market Y-o-Y Growth Rate Comparison by Type Analysis (2016-2032)
- Table 12: Global Soup Market Y-o-Y Growth Rate Comparison by Distribution Channel Analysis (2016-2032)
- Table 13: Global Soup Market Y-o-Y Growth Rate Comparison by Packaging Analysis (2016-2032)
- Table 14: Global Soup Market Share Comparison by Region (2016-2032)
- Table 15: Global Soup Market Share Comparison by Type Analysis (2016-2032)
- Table 16: Global Soup Market Share Comparison by Distribution Channel Analysis (2016-2032)
- Table 17: Global Soup Market Share Comparison by Packaging Analysis (2016-2032)
- Table 18: North America Soup Market Comparison by Distribution Channel Analysis (2016-2032)
- Table 19: North America Soup Market Comparison by Packaging Analysis (2016-2032)
- Table 20: North America Soup Market Revenue (US$ Mn) Comparison by Country (2016-2032)
- Table 21: North America Soup Market Revenue (US$ Mn) (2016-2032)
- Table 22: North America Soup Market Revenue (US$ Mn) Comparison by Country (2016-2032)
- Table 23: North America Soup Market Revenue (US$ Mn) Comparison by Type Analysis (2016-2032)
- Table 24: North America Soup Market Revenue (US$ Mn) Comparison by Distribution Channel Analysis (2016-2032)
- Table 25: North America Soup Market Revenue (US$ Mn) Comparison by Packaging Analysis (2016-2032)
- Table 26: North America Soup Market Y-o-Y Growth Rate Comparison by Country (2016-2032)
- Table 27: North America Soup Market Y-o-Y Growth Rate Comparison by Type Analysis (2016-2032)
- Table 28: North America Soup Market Y-o-Y Growth Rate Comparison by Distribution Channel Analysis (2016-2032)
- Table 29: North America Soup Market Y-o-Y Growth Rate Comparison by Packaging Analysis (2016-2032)
- Table 30: North America Soup Market Share Comparison by Country (2016-2032)
- Table 31: North America Soup Market Share Comparison by Type Analysis (2016-2032)
- Table 32: North America Soup Market Share Comparison by Distribution Channel Analysis (2016-2032)
- Table 33: North America Soup Market Share Comparison by Packaging Analysis (2016-2032)
- Table 34: Western Europe Soup Market Comparison by Type Analysis (2016-2032)
- Table 35: Western Europe Soup Market Comparison by Distribution Channel Analysis (2016-2032)
- Table 36: Western Europe Soup Market Comparison by Packaging Analysis (2016-2032)
- Table 37: Western Europe Soup Market Revenue (US$ Mn) Comparison by Country (2016-2032)
- Table 38: Western Europe Soup Market Revenue (US$ Mn) (2016-2032)
- Table 39: Western Europe Soup Market Revenue (US$ Mn) Comparison by Country (2016-2032)
- Table 40: Western Europe Soup Market Revenue (US$ Mn) Comparison by Type Analysis (2016-2032)
- Table 41: Western Europe Soup Market Revenue (US$ Mn) Comparison by Distribution Channel Analysis (2016-2032)
- Table 42: Western Europe Soup Market Revenue (US$ Mn) Comparison by Packaging Analysis (2016-2032)
- Table 43: Western Europe Soup Market Y-o-Y Growth Rate Comparison by Country (2016-2032)
- Table 44: Western Europe Soup Market Y-o-Y Growth Rate Comparison by Type Analysis (2016-2032)
- Table 45: Western Europe Soup Market Y-o-Y Growth Rate Comparison by Distribution Channel Analysis (2016-2032)
- Table 46: Western Europe Soup Market Y-o-Y Growth Rate Comparison by Packaging Analysis (2016-2032)
- Table 47: Western Europe Soup Market Share Comparison by Country (2016-2032)
- Table 48: Western Europe Soup Market Share Comparison by Type Analysis (2016-2032)
- Table 49: Western Europe Soup Market Share Comparison by Distribution Channel Analysis (2016-2032)
- Table 50: Western Europe Soup Market Share Comparison by Packaging Analysis (2016-2032)
- Table 51: Eastern Europe Soup Market Comparison by Type Analysis (2016-2032)
- Table 52: Eastern Europe Soup Market Comparison by Distribution Channel Analysis (2016-2032)
- Table 53: Eastern Europe Soup Market Comparison by Packaging Analysis (2016-2032)
- Table 54: Eastern Europe Soup Market Revenue (US$ Mn) Comparison by Country (2016-2032)
- Table 55: Eastern Europe Soup Market Revenue (US$ Mn) (2016-2032)
- Table 56: Eastern Europe Soup Market Revenue (US$ Mn) Comparison by Country (2016-2032)
- Table 57: Eastern Europe Soup Market Revenue (US$ Mn) Comparison by Type Analysis (2016-2032)
- Table 58: Eastern Europe Soup Market Revenue (US$ Mn) Comparison by Distribution Channel Analysis (2016-2032)
- Table 59: Eastern Europe Soup Market Revenue (US$ Mn) Comparison by Packaging Analysis (2016-2032)
- Table 60: Eastern Europe Soup Market Y-o-Y Growth Rate Comparison by Country (2016-2032)
- Table 61: Eastern Europe Soup Market Y-o-Y Growth Rate Comparison by Type Analysis (2016-2032)
- Table 62: Eastern Europe Soup Market Y-o-Y Growth Rate Comparison by Distribution Channel Analysis (2016-2032)
- Table 63: Eastern Europe Soup Market Y-o-Y Growth Rate Comparison by Packaging Analysis (2016-2032)
- Table 64: Eastern Europe Soup Market Share Comparison by Country (2016-2032)
- Table 65: Eastern Europe Soup Market Share Comparison by Type Analysis (2016-2032)
- Table 66: Eastern Europe Soup Market Share Comparison by Distribution Channel Analysis (2016-2032)
- Table 67: Eastern Europe Soup Market Share Comparison by Packaging Analysis (2016-2032)
- Table 68: APAC Soup Market Comparison by Type Analysis (2016-2032)
- Table 69: APAC Soup Market Comparison by Distribution Channel Analysis (2016-2032)
- Table 70: APAC Soup Market Comparison by Packaging Analysis (2016-2032)
- Table 71: APAC Soup Market Revenue (US$ Mn) Comparison by Country (2016-2032)
- Table 72: APAC Soup Market Revenue (US$ Mn) (2016-2032)
- Table 73: APAC Soup Market Revenue (US$ Mn) Comparison by Country (2016-2032)
- Table 74: APAC Soup Market Revenue (US$ Mn) Comparison by Type Analysis (2016-2032)
- Table 75: APAC Soup Market Revenue (US$ Mn) Comparison by Distribution Channel Analysis (2016-2032)
- Table 76: APAC Soup Market Revenue (US$ Mn) Comparison by Packaging Analysis (2016-2032)
- Table 77: APAC Soup Market Y-o-Y Growth Rate Comparison by Country (2016-2032)
- Table 78: APAC Soup Market Y-o-Y Growth Rate Comparison by Type Analysis (2016-2032)
- Table 79: APAC Soup Market Y-o-Y Growth Rate Comparison by Distribution Channel Analysis (2016-2032)
- Table 80: APAC Soup Market Y-o-Y Growth Rate Comparison by Packaging Analysis (2016-2032)
- Table 81: APAC Soup Market Share Comparison by Country (2016-2032)
- Table 82: APAC Soup Market Share Comparison by Type Analysis (2016-2032)
- Table 83: APAC Soup Market Share Comparison by Distribution Channel Analysis (2016-2032)
- Table 84: APAC Soup Market Share Comparison by Packaging Analysis (2016-2032)
- Table 85: Latin America Soup Market Comparison by Type Analysis (2016-2032)
- Table 86: Latin America Soup Market Comparison by Distribution Channel Analysis (2016-2032)
- Table 87: Latin America Soup Market Comparison by Packaging Analysis (2016-2032)
- Table 88: Latin America Soup Market Revenue (US$ Mn) Comparison by Country (2016-2032)
- Table 89: Latin America Soup Market Revenue (US$ Mn) (2016-2032)
- Table 90: Latin America Soup Market Revenue (US$ Mn) Comparison by Country (2016-2032)
- Table 91: Latin America Soup Market Revenue (US$ Mn) Comparison by Type Analysis (2016-2032)
- Table 92: Latin America Soup Market Revenue (US$ Mn) Comparison by Distribution Channel Analysis (2016-2032)
- Table 93: Latin America Soup Market Revenue (US$ Mn) Comparison by Packaging Analysis (2016-2032)
- Table 94: Latin America Soup Market Y-o-Y Growth Rate Comparison by Country (2016-2032)
- Table 95: Latin America Soup Market Y-o-Y Growth Rate Comparison by Type Analysis (2016-2032)
- Table 96: Latin America Soup Market Y-o-Y Growth Rate Comparison by Distribution Channel Analysis (2016-2032)
- Table 97: Latin America Soup Market Y-o-Y Growth Rate Comparison by Packaging Analysis (2016-2032)
- Table 98: Latin America Soup Market Share Comparison by Country (2016-2032)
- Table 99: Latin America Soup Market Share Comparison by Type Analysis (2016-2032)
- Table 100: Latin America Soup Market Share Comparison by Distribution Channel Analysis (2016-2032)
- Table 101: Latin America Soup Market Share Comparison by Packaging Analysis (2016-2032)
- Table 102: Middle East & Africa Soup Market Comparison by Type Analysis (2016-2032)
- Table 103: Middle East & Africa Soup Market Comparison by Distribution Channel Analysis (2016-2032)
- Table 104: Middle East & Africa Soup Market Comparison by Packaging Analysis (2016-2032)
- Table 105: Middle East & Africa Soup Market Revenue (US$ Mn) Comparison by Country (2016-2032)
- Table 106: Middle East & Africa Soup Market Revenue (US$ Mn) (2016-2032)
- Table 107: Middle East & Africa Soup Market Revenue (US$ Mn) Comparison by Country (2016-2032)
- Table 108: Middle East & Africa Soup Market Revenue (US$ Mn) Comparison by Type Analysis (2016-2032)
- Table 109: Middle East & Africa Soup Market Revenue (US$ Mn) Comparison by Distribution Channel Analysis (2016-2032)
- Table 110: Middle East & Africa Soup Market Revenue (US$ Mn) Comparison by Packaging Analysis (2016-2032)
- Table 111: Middle East & Africa Soup Market Y-o-Y Growth Rate Comparison by Country (2016-2032)
- Table 112: Middle East & Africa Soup Market Y-o-Y Growth Rate Comparison by Type Analysis (2016-2032)
- Table 113: Middle East & Africa Soup Market Y-o-Y Growth Rate Comparison by Distribution Channel Analysis (2016-2032)
- Table 114: Middle East & Africa Soup Market Y-o-Y Growth Rate Comparison by Packaging Analysis (2016-2032)
- Table 115: Middle East & Africa Soup Market Share Comparison by Country (2016-2032)
- Table 116: Middle East & Africa Soup Market Share Comparison by Type Analysis (2016-2032)
- Table 117: Middle East & Africa Soup Market Share Comparison by Distribution Channel Analysis (2016-2032)
- Table 118: Middle East & Africa Soup Market Share Comparison by Packaging Analysis (2016-2032)
- 1. Executive Summary
-
- The Campbell Soup Company
- Nestlé S.A
- Baxters Food Group Limited
- General Mills, Inc
- Conagra Brands, Inc.
- Premier Foods Group Limited
- The Kraft Heinz Company
- Hindustan Unilever Limited
- Ottogi Co., Ltd
- Associated British Foods plc
Our Clients


View Our Licence Options
