Soda Ash Market By Type(Synthetic, Natural), By Application(Glass, Soap & Detergents, Chemicals, Pulp & Paper, Metal Processing, Water Treatment), By Region And Companies - Industry Segment Outlook, Market Assessment, Competition Scenario, Trends, And Forecast 2024-2033
-
3605
-
April 2024
-
173
-


-
This report was compiled by Shreyas Rokade Shreyas Rokade is a seasoned Research Analyst with CMFE, bringing extensive expertise in market research and consulting, with a strong background in Chemical Engineering. Correspondence Team Lead-CMFE Linkedin | Detailed Market research Methodology Our methodology involves a mix of primary research, including interviews with leading mental health experts, and secondary research from reputable medical journals and databases. View Detailed Methodology Page
-
Quick Navigation
Report Overview
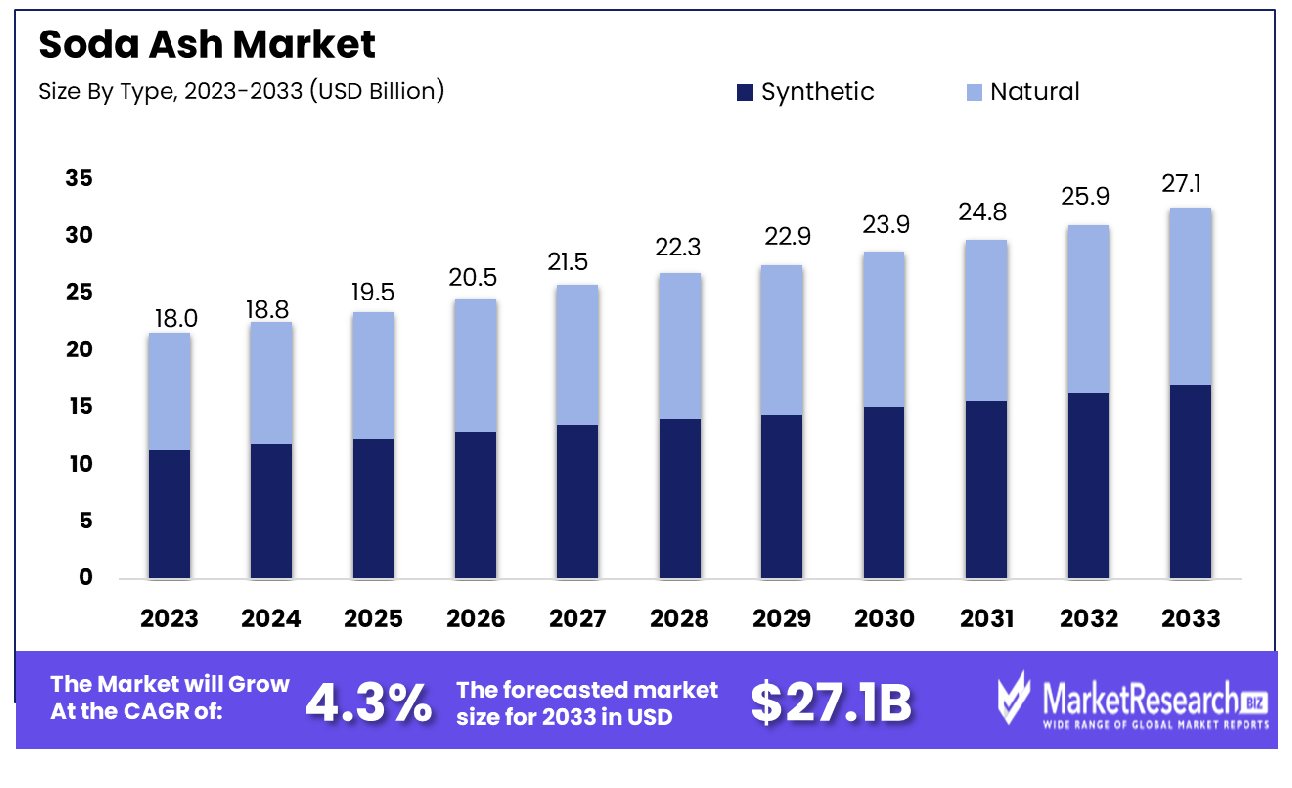
The Global Soda Ash Market was valued at USD 18.0 billion in 2023. It is expected to reach USD 27.1 billion by 2033, with a CAGR of 4.3% during the forecast period from 2024 to 2033. The surge in demand for the soap and detergent sectors, the rise in the usage of paper, and growing awareness regarding environmental concerns are some of the main key driving factors for soda ash.
Soda Ash also called sodium carbonate (Na2CO3) is defined as a white, odorless powder with different industrial uses. It is mainly manufactured through the Solvay method which comprises the reaction of sodium chloride, ammonia, carbon dioxide, and limestone. Soda ash acts as a main raw element in the manufacturing of glass, where it serves as a flux to diminution the melting point of silica, simplifying glass formation.
It is generally used in the production of detergents and soaps, where it functions as a water softener and pH regulator. Soda ash finds application in the textile sector for dyeing and textile methods, as well as in the manufacturing of paper industry and pulp. The alkaline properties make it suitable for water treatment methods, like pH adjustment and removal of heavy metals. With its multiple range of uses, soda ash plays an important role in several industrial and commercial industries worldwide.
According to Solvay in September 2022, highlights that Solvay marched forward towards its 2050 carbon neutrality target by funding at its Dombasle site to test an innovation, breakthrough, and more sustainable soda ash production methods. Earlier, Solvay invested €40 million to create proprietary technology first patented in 2014.
The researchers and engineers have invented a new process to generate soda ash, getting three new transforming improvements in the methods by emitting 50% less CO2, minimizing water, brine, and limestone consumption, and eliminating limestone residues. Moreover, according to Solvay in October 2023, highlights that Solvay’s innovation was so successful that it was used to generate 95% of the soda ash consumed globally. Glass manufacturing today accounts for more than 50% of the world’s total soda ash production.
Soda ash provides a new advantage as a sustainable solution for carbon capture and storage technologies by supporting mitigating greenhouse gas emissions. It has alkaline features that make it effective in absorbing and neutralizing carbon dioxide, thereby contributing to efforts focused on fighting climate change and promoting environmental sustainability. The demand for soda ash will increase due to its requirement in textiles and other sectors that will help in market expansion in the coming years.
Key Takeaways
- Market Growth: The Global Soda Ash Market was valued at USD 18.0 billion in 2023. It is expected to reach USD 27.1 billion by 2033, with a CAGR of 4.3% during the forecast period from 2024 to 2033.
- By Type: Synthetic glass finds extensive use in architectural projects, offering durability and versatility in design applications.
- By Application: In industrial settings, synthetic glass serves as a crucial material for manufacturing precision instruments and equipment.
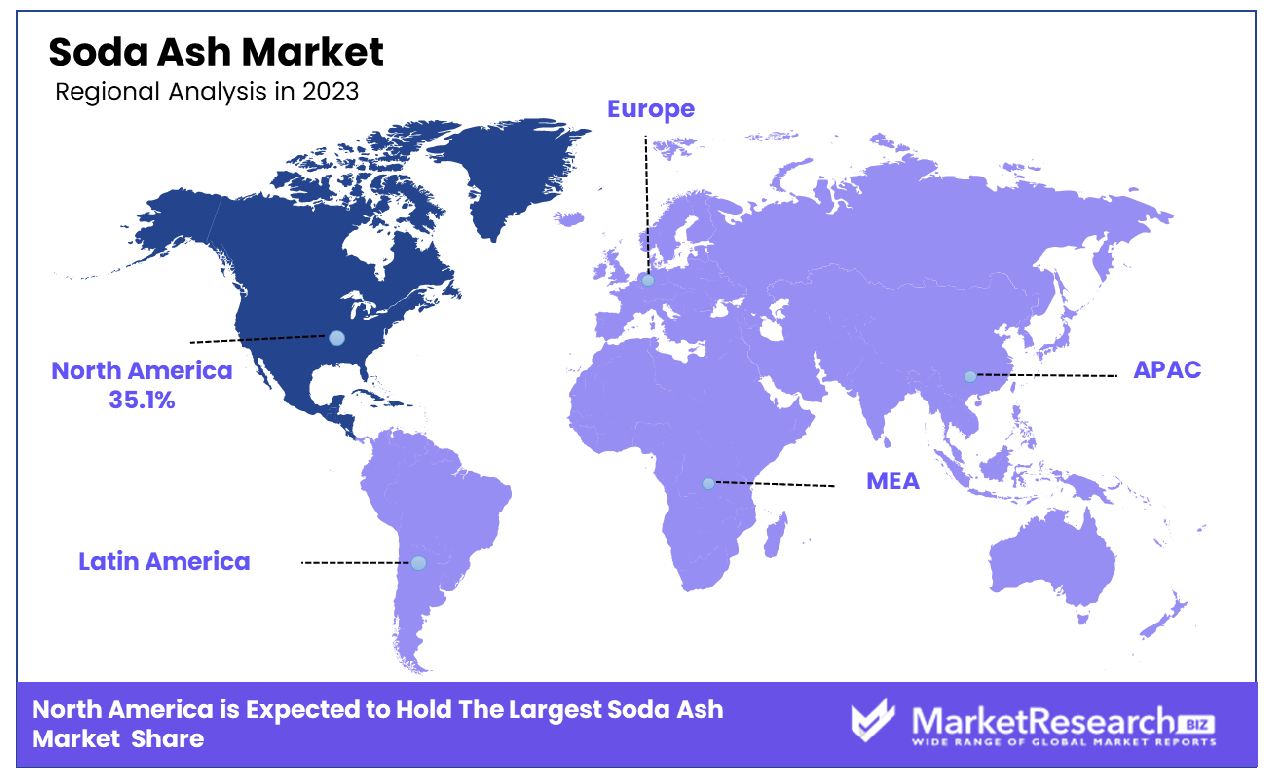
- Regional Dominance: In North America, the soda ash market accounts for a significant 35.1%.
- Growth Opportunity: The global soda ash market in 2023 offers growth prospects driven by increased demand from glass manufacturing, detergents, cleaning products, water treatment, and chemical manufacturing sectors.
Driving factors
Growing Need within the Glass Sector for Soda Ash
The demand for soda ash within the glass sector continues to surge, primarily fueled by the thriving construction and automotive industries. With the global construction market projected to reach $8 trillion by 2030, the need for glass products, such as windows, doors, and facades, is escalating. Additionally, the automotive industry's shift towards lightweight, fuel-efficient vehicles is amplifying the demand for glass industry components, including windshields and windows, further boosting soda ash consumption.
Increasing Population and Urbanization Driving Demand for Cleaning Products
As the global population burgeons, especially in urban areas, the demand for cleaning products, such as detergents and soaps, is witnessing a significant upsurge. Urbanization is synonymous with higher standards of hygiene and cleanliness, propelling the need for household and industrial cleaning solutions. The United Nations estimates that 68% of the world's population will reside in urban areas by 2050, underscoring the sustained growth rate potential for the cleaning products market. Consequently, the soda ash market, a key ingredient in many cleaning formulations, stands to benefit from this demographic trend.
Rising Demand for Container Glasses in Various Industries
The escalating demand for container glasses across diverse industries, including food and beverage, pharmaceuticals, and cosmetics, is a pivotal driver augmenting the soda ash market. Container glasses serve as primary packaging solutions, preserving and protecting a wide array of products. The food and beverage sector, in particular, is experiencing a robust growth rate, driven by changing consumer preferences and the emergence of new product categories. Furthermore, stringent regulations about packaging materials' recyclability and sustainability are fostering the adoption of glass industry containers, further bolstering soda ash consumption.
Restraining Factors
Fluctuating Prices of Natural Resources Used in Production
The soda ash market grapples with the inherent challenge of fluctuating prices of natural resources, particularly trona and sodium carbonate, which are essential inputs in soda ash production. Trona, a key raw material, is subject to price volatility due to key factors such as geological conditions, transportation costs, and supply-demand dynamics.
Similarly, the price of sodium carbonate, derived from various chemical processes, is susceptible to fluctuations influenced by energy costs and market forces. These price instabilities can significantly impact production costs, thereby affecting the overall profitability and competitiveness of soda ash industry manufacturers.
Environmental Concerns Regarding Production Processes
Environmental apprehensions surrounding the soda ash industry production processes pose a notable restraint on market growth. Traditional methods of soda ash production, such as the Solvay process, emit greenhouse gases and generate significant quantities of waste, contributing to environmental degradation and climate change concerns.
Regulatory agencies and environmental advocacy groups are increasingly pressuring manufacturers to adopt cleaner, more sustainable production technologies to mitigate these adverse effects. Transitioning to eco-friendly processes, such as the use of brine pools or carbon capture technologies, entails substantial investments and operational adjustments, posing challenges for existing manufacturing facilities.
By Type Analysis
Synthetic materials dominate glass manufacturing, offering durability and versatility in applications.
2023 marked Synthetic as the leader in the By Type segment of the Soda Ash Market, accounting for most sales across multiple industries such as glass, detergents, and chemicals. Its widespread applications included glass production, detergent use, and chemicals manufacturing - thus maintaining its dominant market share due to consistent quality, cost-efficiency, and easy production scalability.
The Synthetic segment's dominance is further fueled by its versatility and adaptability to meet diverse industry demands. Industries, particularly glass manufacturing, heavily rely on the synthetic soda ash industry for its crucial role in enhancing glass properties such as clarity, strength, and chemical process stability. Moreover, the stringent quality standards and regulatory requirements in end-user industries have propelled the preference for synthetic soda ash over natural alternatives.
On the other hand, the Natural segment, while maintaining a presence in the market, faces constraints such as limited availability, higher production costs, and variations in quality. Despite the growing trend towards sustainability and natural products, the Synthetic segment continues to maintain its stronghold due to its consistent supply chain, reliability, and superior performance characteristics.
Looking ahead, the Synthetic segment is poised to witness sustained growth driven by increasing demand from emerging economies, ongoing advancements in manufacturing technologies, and the rising adoption of synthetic materials across various industries. However, factors such as raw material prices, regulatory changes, and environmental concerns may pose challenges to the segment's growth trajectory.
By Application Analysis
Glass products benefit from synthetic additives, enhancing strength and optical properties.
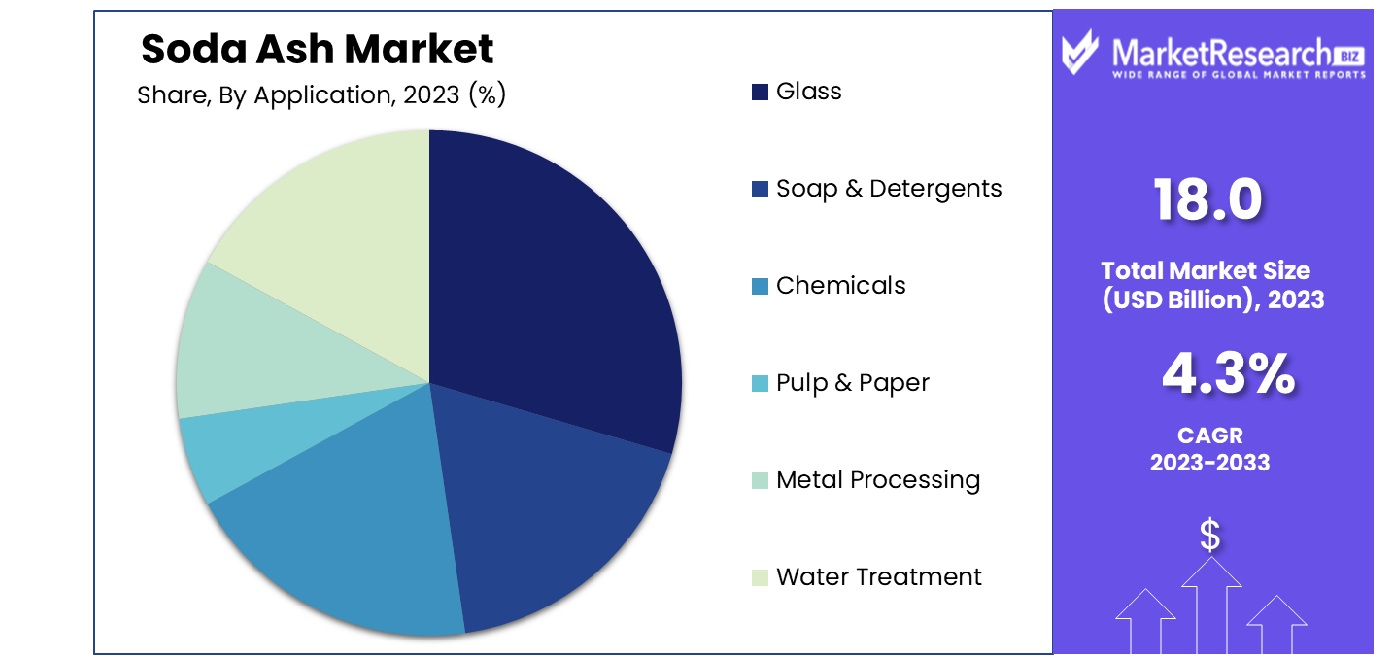
2023 saw Glass emerge as the market leader for the By Application soda ash market segment. It dominated due to the extensive use of soda ash as a raw material in glass manufacturing processes; as well as being indispensable in producing various forms of glass including flat, container, and specialty glasses that secured its position as leader of this subcategory.
Within the Glass application segment, soda ash is crucial for enhancing the optical clarity, chemical stability, and melting properties of glass products. Construction, automotive, and packaging industries are key consumers of glass, fueling the demand for soda ash in these sectors. Furthermore, the increasing interest in eco-friendly packaging solutions has increased the consumption of soda ash used for glass production even further.
While the Glass segment maintains its leading position, other applications such as Soap & Detergent industry chemicals, Pulp & Paper, Metal Processing, and Water Treatment also contribute to the overall demand for soda ash. These industries utilize soda ash for various purposes including pH regulation, chemical synthesis, and water treatment processes. However, their combined market share is comparatively smaller than that of the Glass segment.
Looking ahead, the Glass segment is anticipated to continue its dominance in the By Application segment of the Soda Ash Market, driven by ongoing innovations in glass technologies, growing urbanization, and infrastructural development activities worldwide. Nevertheless, fluctuations in raw material prices, environmental regulations, and competition from alternative materials pose challenges to the sustained growth of this segment.
Key Market Segments
By Type
- Synthetic
- Natural
By Application
- Glass
- Soap & Detergents
- Chemicals
- Pulp & Paper
- Metal Processing
- Water Treatment
Growth Opportunity
Growth in Glass Manufacturing Industries
In 2023, the global soda ash market promises promising opportunities, particularly due to the expansion of the glass manufacturing sector. Soda ash production - an essential element in glass making - should increase as the construction and automotive industries experience exponential growth.
With rising urbanization and infrastructure development worldwide, the demand for glass products for architectural purposes and automotive applications is on the rise. Consequently, manufacturers are ramping up production, which directly translates to increased demand for soda ash. This trend is projected to persist, driving substantial growth in the global soda ash market throughout 2023.
Increasing Demand for Detergents and Cleaning Products
Another significant opportunity lies in the escalating demand for detergents and cleaning products. Soda ash is an integral component of detergent manufacturing, helping remove stains and grease effectively from surfaces. As consumer awareness regarding hygiene and cleanliness grows, the demand for household and industrial cleaning agents is on the rise.
Additionally, the flourishing e-commerce sector has facilitated easy access to cleaning products, further propelling market growth. This surge in demand for detergents and cleaning products is anticipated to positively impact the global soda ash market, presenting lucrative opportunities for manufacturers and suppliers alike.
Expansion of Applications in Water Treatment and Chemical Manufacturing
Furthermore, soda ash's increasing use in water treatment and chemical manufacturing sectors demonstrates another growth driver for its global market. Soda ash plays an integral part in water treatment processes by helping adjust pH levels and remove impurities. Additionally, it serves as a vital raw material in various chemical manufacturing processes, including the production of sodium silicate and sodium bicarbonate.
With increasing investments in water infrastructure and chemical manufacturing facilities globally, the demand for soda ash is expected to witness a steady uptick. As a result, market players can capitalize on this opportunity to diversify their product offerings and expand their market presence in 2023 and beyond.
Latest Trends
Expanding Applications in Glass Manufacturing, Detergents, and Chemicals Industries
In 2023, the global soda ash market is poised for significant expansion due to increased applications across various industries, including glass manufacturing, detergents, and chemicals production. Soda ash remains an indispensable ingredient for creating quality glass, contributing to its clarity, strength, and durability; and with construction industries expanding and demand for glass products increasing significantly, so will soda ash's demand rise accordingly.
Additionally, the detergent and cleaning product industries rely heavily on soda ash for its effectiveness in removing stains and grease, further propelling market growth. Moreover, soda ash finds widespread use in various chemical manufacturing processes, including the production of sodium bicarbonate and sodium silicate. The versatility of soda ash across these industries underscores its indispensable role in driving market expansion.
Growing Demand from Construction and Automotive Sectors
Furthermore, the global soda ash market is experiencing an upward surge in demand from the construction and automotive industries due to its increasing use in water treatment processes. Soda ash is utilized in water treatment to adjust pH levels and remove impurities, ensuring water quality and safety. With rapid urbanization and infrastructure development worldwide, the construction sector is witnessing robust growth, consequently driving demand for soda ash.
Similarly, the automotive industry's increasing emphasis on sustainability and environmental compliance is boosting the adoption of soda ash for water treatment in manufacturing processes. As such, demand for soda ash from these sectors should continue to be strong, fuelling global market expansion until 2023 and beyond.
Regional Analysis
In North America, the soda ash market holds a significant share of 35.1%, indicating a robust industry presence.
The global soda ash market exhibits a diversified landscape across regions, with North America, Europe, Asia Pacific, Middle East & Africa, and Latin America each contributing distinct dynamics to the industry. North America emerges as a prominent player, commanding a significant market share of 35.1%. The region's dominance is underpinned by several factors, including robust industrial infrastructure, technological advancements, and a steady demand from various end-use sectors.
North American soda ash market has experienced consistent and sustained growth, driven by its essential role as raw material for glass manufacturing companies that rely heavily on soda ash as raw material. Additionally, stringent environmental regulations and sustainability initiatives have spurred the adoption of eco-friendly soda ash alternatives, further propelling market growth.
Meanwhile, Europe presents a mature soda ash market landscape, driven primarily by well-established manufacturing and construction sectors. This region enjoys a steady demand for soda ash due to the widespread use of glass in architecture and automotive manufacturing applications. However, market growth in Europe is tempered by regulatory pressures aimed at reducing carbon emissions and promoting sustainable practices within the manufacturing sector.
In contrast, the Asia Pacific region emerges as a burgeoning market for soda ash, fueled by rapid industrialization, urbanization, and infrastructure development. Countries like China, India, and Japan are key contributors to the region's growth, driven by increasing investments in construction, automotive, and consumer goods industries. As emerging economies increase their populations and disposable incomes, their demand for glass products increases and so does the consumption of soda ash in that region.
In the Middle East & Africa and Latin America, the soda ash market exhibits moderate growth prospects, influenced by factors such as infrastructural developments, urbanization trends, and investments in key end-user industries. While these regions present untapped potential for market expansion, challenges related to regulatory frameworks and economic uncertainties may hinder growth to some extent.
Key Regions and Countries
North America
- The US
- Canada
- Rest of North America
Europe
- Germany
- France
- The UK
- Spain
- Netherlands
- Russia
- Italy
- Rest of Europe
Asia-Pacific
- China
- Japan
- Singapore
- Thailand
- South Korea
- Vietnam
- India
- New Zealand
- Rest of Asia Pacific
Latin America
- Mexico
- Brazil
- Rest of Latin America
Middle East & Africa
- Saudi Arabia
- South Africa
- UAE
- Rest of the Middle East & Africa
Key Players Analysis
In 2023, the global soda ash market showcased dynamic growth, propelled by key players such as Tata Chemicals Ltd, Shandong Haihua Group, and GHCL Limited. These industry giants, alongside other notable contenders like Sisecam Group and Searles Valley Minerals, played pivotal roles in shaping market trends and driving innovation.
Tata Chemicals Ltd, headquartered in India, emerged as a frontrunner in the soda ash landscape, leveraging its extensive production capabilities and robust distribution network to meet global demand. With a strategic focus on sustainability and technological advancements, Tata Chemicals continued to reinforce its position as a market leader, setting industry benchmarks for efficiency and environmental stewardship.
Meanwhile, Shandong Haihua Group from China capitalized on its formidable manufacturing prowess and strategic alliances to expand its market reach. The company's relentless pursuit of operational excellence and commitment to customer satisfaction underscored its significance as a key player in the global soda ash sector.
GHCL Limited, another Indian conglomerate, distinguished itself through its innovative product offerings and customer-centric approach. By investing in research and development, GHCL maintained a competitive edge, catering to diverse market segments and driving market penetration.
Market Key Players
- Tata Chemicals Ltd (India)
- Shandong Haihua Bunch (China)
- GHCL Constrained (India)
- Sisecam Bunch (Turkey)
- Searles Valley Minerals (US)
- Ciner Assets Organization (US)
- Beginning Vitality LP (US)
- Ciech SA (Poland)
- Nirma Constrained (India)
- OCI COMPANY Ltd (South Korea), among others
Recent Development
- In February 2024, the Max Planck Institute for Dynamics of Complex Technical Systems (MPI-DCTS) is leading the CODA project to develop a sustainable, carbon-negative process for soda ash production using direct air capture of CO2.
- In January 2024, Tata Chemicals Magadi Ltd allocates Sh2.4 billion for expansion, aiming to enhance operations and technology at Lake Magadi, boosting economic growth and safeguarding local livelihoods.
- In October 2023, Şişecam CEO Görkem Elverici unveils US growth plans at the World Soda Ash Conference. The company aims to become a global leader with investments in natural soda ash production and logistics infrastructure.
Report Scope
Report Features Description Market Value (2023) USD 18.0 Billion Forecast Revenue (2033) USD 27.1 Billion CAGR (2024-2032) 4.3% Base Year for Estimation 2023 Historic Period 2016-2023 Forecast Period 2024-2033 Report Coverage Revenue Forecast, Market Dynamics, COVID-19 Impact, Competitive Landscape, Recent Developments Segments Covered By Type(Synthetic, Natural), By Application(Glass, Soap & Detergents, Chemicals, Pulp & Paper, Metal Processing, Water Treatment) Regional Analysis North America - The US, Canada, Rest of North America, Europe - Germany, France, The UK, Spain, Italy, Russia, Netherlands, Rest of Europe, Asia-Pacific - China, Japan, South Korea, India, New Zealand, Singapore, Thailand, Vietnam, Rest of Asia Pacific, Latin America - Brazil, Mexico, Rest of Latin America, Middle East & Africa - South Africa, Saudi Arabia, UAE, Rest of Middle East & Africa Competitive Landscape Tata Chemicals Ltd (India), Shandong Haihua Bunch (China), GHCL Constrained (India), Sisecam Bunch (Turkey), Searles Valley Minerals (US), Ciner Assets Organization (US), Beginning Vitality LP (US), Ciech SA (Poland), Nirma Constrained (India), OCI COMPANY Ltd (South Korea), among others Customization Scope Customization for segments, region/country-level will be provided. Moreover, additional customization can be done based on the requirements. Purchase Options We have three licenses to opt for Single User License, Multi-User License (Up to 5 Users), Corporate Use License (Unlimited User and Printable PDF) -
- 1. Executive Summary
- 1.1. Definition
- 1.2. Taxonomy
- 1.3. Research Scope
- 1.4. Key Analysis
- 1.5. Key Findings by Major Segments
- 1.6. Top strategies by Major Players
- 2. Global Soda Ash Market Overview
- 2.1. Soda Ash Market Dynamics
- 2.1.1. Drivers
- 2.1.2. Opportunities
- 2.1.3. Restraints
- 2.1.4. Challenges
- 2.2. Macro-economic Factors
- 2.3. Regulatory Framework
- 2.4. Market Investment Feasibility Index
- 2.5. PEST Analysis
- 2.6. PORTER’S Five Force Analysis
- 2.7. Drivers & Restraints Impact Analysis
- 2.8. Industry Chain Analysis
- 2.9. Cost Structure Analysis
- 2.10. Marketing Strategy
- 2.11. Russia-Ukraine War Impact Analysis
- 2.12. Opportunity Map Analysis
- 2.13. Market Competition Scenario Analysis
- 2.14. Product Life Cycle Analysis
- 2.15. Opportunity Orbits
- 2.16. Manufacturer Intensity Map
- 2.17. Major Companies sales by Value & Volume
- 2.1. Soda Ash Market Dynamics
- 3. Global Soda Ash Market Analysis, Opportunity and Forecast, 2016-2032
- 3.1. Global Soda Ash Market Analysis, 2016-2021
- 3.2. Global Soda Ash Market Opportunity and Forecast, 2023-2032
- 3.3. Global Soda Ash Market Analysis, Opportunity and Forecast, By By Type, 2016-2032
- 3.3.1. Global Soda Ash Market Analysis by By Type: Introduction
- 3.3.2. Market Size Absolute $ Opportunity Analysis and Forecast, By By Type, 2016-2032
- 3.3.3. Synthetic
- 3.3.4. Natural
- 3.4. Global Soda Ash Market Analysis, Opportunity and Forecast, By By Application, 2016-2032
- 3.4.1. Global Soda Ash Market Analysis by By Application: Introduction
- 3.4.2. Market Size Absolute $ Opportunity Analysis and Forecast, By By Application, 2016-2032
- 3.4.3. Glass
- 3.4.4. Soap & Detergents
- 3.4.5. Chemicals
- 3.4.6. Pulp & Paper
- 3.4.7. Metal Processing
- 3.4.8. Water Treatment
- 4. North America Soda Ash Market Analysis, Opportunity and Forecast, 2016-2032
- 4.1. North America Soda Ash Market Analysis, 2016-2021
- 4.2. North America Soda Ash Market Opportunity and Forecast, 2023-2032
- 4.3. North America Soda Ash Market Analysis, Opportunity and Forecast, By By Type, 2016-2032
- 4.3.1. North America Soda Ash Market Analysis by By Type: Introduction
- 4.3.2. Market Size Absolute $ Opportunity Analysis and Forecast, By By Type, 2016-2032
- 4.3.3. Synthetic
- 4.3.4. Natural
- 4.4. North America Soda Ash Market Analysis, Opportunity and Forecast, By By Application, 2016-2032
- 4.4.1. North America Soda Ash Market Analysis by By Application: Introduction
- 4.4.2. Market Size Absolute $ Opportunity Analysis and Forecast, By By Application, 2016-2032
- 4.4.3. Glass
- 4.4.4. Soap & Detergents
- 4.4.5. Chemicals
- 4.4.6. Pulp & Paper
- 4.4.7. Metal Processing
- 4.4.8. Water Treatment
- 4.5. North America Soda Ash Market Analysis, Opportunity and Forecast, By Country , 2016-2032
- 4.5.1. North America Soda Ash Market Analysis by Country : Introduction
- 4.5.2. Market Size Absolute $ Opportunity Analysis and Forecast, Country , 2016-2032
- 4.5.2.1. The US
- 4.5.2.2. Canada
- 4.5.2.3. Mexico
- 5. Western Europe Soda Ash Market Analysis, Opportunity and Forecast, 2016-2032
- 5.1. Western Europe Soda Ash Market Analysis, 2016-2021
- 5.2. Western Europe Soda Ash Market Opportunity and Forecast, 2023-2032
- 5.3. Western Europe Soda Ash Market Analysis, Opportunity and Forecast, By By Type, 2016-2032
- 5.3.1. Western Europe Soda Ash Market Analysis by By Type: Introduction
- 5.3.2. Market Size Absolute $ Opportunity Analysis and Forecast, By By Type, 2016-2032
- 5.3.3. Synthetic
- 5.3.4. Natural
- 5.4. Western Europe Soda Ash Market Analysis, Opportunity and Forecast, By By Application, 2016-2032
- 5.4.1. Western Europe Soda Ash Market Analysis by By Application: Introduction
- 5.4.2. Market Size Absolute $ Opportunity Analysis and Forecast, By By Application, 2016-2032
- 5.4.3. Glass
- 5.4.4. Soap & Detergents
- 5.4.5. Chemicals
- 5.4.6. Pulp & Paper
- 5.4.7. Metal Processing
- 5.4.8. Water Treatment
- 5.5. Western Europe Soda Ash Market Analysis, Opportunity and Forecast, By Country , 2016-2032
- 5.5.1. Western Europe Soda Ash Market Analysis by Country : Introduction
- 5.5.2. Market Size Absolute $ Opportunity Analysis and Forecast, Country , 2016-2032
- 5.5.2.1. Germany
- 5.5.2.2. France
- 5.5.2.3. The UK
- 5.5.2.4. Spain
- 5.5.2.5. Italy
- 5.5.2.6. Portugal
- 5.5.2.7. Ireland
- 5.5.2.8. Austria
- 5.5.2.9. Switzerland
- 5.5.2.10. Benelux
- 5.5.2.11. Nordic
- 5.5.2.12. Rest of Western Europe
- 6. Eastern Europe Soda Ash Market Analysis, Opportunity and Forecast, 2016-2032
- 6.1. Eastern Europe Soda Ash Market Analysis, 2016-2021
- 6.2. Eastern Europe Soda Ash Market Opportunity and Forecast, 2023-2032
- 6.3. Eastern Europe Soda Ash Market Analysis, Opportunity and Forecast, By By Type, 2016-2032
- 6.3.1. Eastern Europe Soda Ash Market Analysis by By Type: Introduction
- 6.3.2. Market Size Absolute $ Opportunity Analysis and Forecast, By By Type, 2016-2032
- 6.3.3. Synthetic
- 6.3.4. Natural
- 6.4. Eastern Europe Soda Ash Market Analysis, Opportunity and Forecast, By By Application, 2016-2032
- 6.4.1. Eastern Europe Soda Ash Market Analysis by By Application: Introduction
- 6.4.2. Market Size Absolute $ Opportunity Analysis and Forecast, By By Application, 2016-2032
- 6.4.3. Glass
- 6.4.4. Soap & Detergents
- 6.4.5. Chemicals
- 6.4.6. Pulp & Paper
- 6.4.7. Metal Processing
- 6.4.8. Water Treatment
- 6.5. Eastern Europe Soda Ash Market Analysis, Opportunity and Forecast, By Country , 2016-2032
- 6.5.1. Eastern Europe Soda Ash Market Analysis by Country : Introduction
- 6.5.2. Market Size Absolute $ Opportunity Analysis and Forecast, Country , 2016-2032
- 6.5.2.1. Russia
- 6.5.2.2. Poland
- 6.5.2.3. The Czech Republic
- 6.5.2.4. Greece
- 6.5.2.5. Rest of Eastern Europe
- 7. APAC Soda Ash Market Analysis, Opportunity and Forecast, 2016-2032
- 7.1. APAC Soda Ash Market Analysis, 2016-2021
- 7.2. APAC Soda Ash Market Opportunity and Forecast, 2023-2032
- 7.3. APAC Soda Ash Market Analysis, Opportunity and Forecast, By By Type, 2016-2032
- 7.3.1. APAC Soda Ash Market Analysis by By Type: Introduction
- 7.3.2. Market Size Absolute $ Opportunity Analysis and Forecast, By By Type, 2016-2032
- 7.3.3. Synthetic
- 7.3.4. Natural
- 7.4. APAC Soda Ash Market Analysis, Opportunity and Forecast, By By Application, 2016-2032
- 7.4.1. APAC Soda Ash Market Analysis by By Application: Introduction
- 7.4.2. Market Size Absolute $ Opportunity Analysis and Forecast, By By Application, 2016-2032
- 7.4.3. Glass
- 7.4.4. Soap & Detergents
- 7.4.5. Chemicals
- 7.4.6. Pulp & Paper
- 7.4.7. Metal Processing
- 7.4.8. Water Treatment
- 7.5. APAC Soda Ash Market Analysis, Opportunity and Forecast, By Country , 2016-2032
- 7.5.1. APAC Soda Ash Market Analysis by Country : Introduction
- 7.5.2. Market Size Absolute $ Opportunity Analysis and Forecast, Country , 2016-2032
- 7.5.2.1. China
- 7.5.2.2. Japan
- 7.5.2.3. South Korea
- 7.5.2.4. India
- 7.5.2.5. Australia & New Zeland
- 7.5.2.6. Indonesia
- 7.5.2.7. Malaysia
- 7.5.2.8. Philippines
- 7.5.2.9. Singapore
- 7.5.2.10. Thailand
- 7.5.2.11. Vietnam
- 7.5.2.12. Rest of APAC
- 8. Latin America Soda Ash Market Analysis, Opportunity and Forecast, 2016-2032
- 8.1. Latin America Soda Ash Market Analysis, 2016-2021
- 8.2. Latin America Soda Ash Market Opportunity and Forecast, 2023-2032
- 8.3. Latin America Soda Ash Market Analysis, Opportunity and Forecast, By By Type, 2016-2032
- 8.3.1. Latin America Soda Ash Market Analysis by By Type: Introduction
- 8.3.2. Market Size Absolute $ Opportunity Analysis and Forecast, By By Type, 2016-2032
- 8.3.3. Synthetic
- 8.3.4. Natural
- 8.4. Latin America Soda Ash Market Analysis, Opportunity and Forecast, By By Application, 2016-2032
- 8.4.1. Latin America Soda Ash Market Analysis by By Application: Introduction
- 8.4.2. Market Size Absolute $ Opportunity Analysis and Forecast, By By Application, 2016-2032
- 8.4.3. Glass
- 8.4.4. Soap & Detergents
- 8.4.5. Chemicals
- 8.4.6. Pulp & Paper
- 8.4.7. Metal Processing
- 8.4.8. Water Treatment
- 8.5. Latin America Soda Ash Market Analysis, Opportunity and Forecast, By Country , 2016-2032
- 8.5.1. Latin America Soda Ash Market Analysis by Country : Introduction
- 8.5.2. Market Size Absolute $ Opportunity Analysis and Forecast, Country , 2016-2032
- 8.5.2.1. Brazil
- 8.5.2.2. Colombia
- 8.5.2.3. Chile
- 8.5.2.4. Argentina
- 8.5.2.5. Costa Rica
- 8.5.2.6. Rest of Latin America
- 9. Middle East & Africa Soda Ash Market Analysis, Opportunity and Forecast, 2016-2032
- 9.1. Middle East & Africa Soda Ash Market Analysis, 2016-2021
- 9.2. Middle East & Africa Soda Ash Market Opportunity and Forecast, 2023-2032
- 9.3. Middle East & Africa Soda Ash Market Analysis, Opportunity and Forecast, By By Type, 2016-2032
- 9.3.1. Middle East & Africa Soda Ash Market Analysis by By Type: Introduction
- 9.3.2. Market Size Absolute $ Opportunity Analysis and Forecast, By By Type, 2016-2032
- 9.3.3. Synthetic
- 9.3.4. Natural
- 9.4. Middle East & Africa Soda Ash Market Analysis, Opportunity and Forecast, By By Application, 2016-2032
- 9.4.1. Middle East & Africa Soda Ash Market Analysis by By Application: Introduction
- 9.4.2. Market Size Absolute $ Opportunity Analysis and Forecast, By By Application, 2016-2032
- 9.4.3. Glass
- 9.4.4. Soap & Detergents
- 9.4.5. Chemicals
- 9.4.6. Pulp & Paper
- 9.4.7. Metal Processing
- 9.4.8. Water Treatment
- 9.5. Middle East & Africa Soda Ash Market Analysis, Opportunity and Forecast, By Country , 2016-2032
- 9.5.1. Middle East & Africa Soda Ash Market Analysis by Country : Introduction
- 9.5.2. Market Size Absolute $ Opportunity Analysis and Forecast, Country , 2016-2032
- 9.5.2.1. Algeria
- 9.5.2.2. Egypt
- 9.5.2.3. Israel
- 9.5.2.4. Kuwait
- 9.5.2.5. Nigeria
- 9.5.2.6. Saudi Arabia
- 9.5.2.7. South Africa
- 9.5.2.8. Turkey
- 9.5.2.9. The UAE
- 9.5.2.10. Rest of MEA
- 10. Global Soda Ash Market Analysis, Opportunity and Forecast, By Region , 2016-2032
- 10.1. Global Soda Ash Market Analysis by Region : Introduction
- 10.2. Market Size Absolute $ Opportunity Analysis and Forecast, By Region , 2016-2032
- 10.2.1. North America
- 10.2.2. Western Europe
- 10.2.3. Eastern Europe
- 10.2.4. APAC
- 10.2.5. Latin America
- 10.2.6. Middle East & Africa
- 11. Global Soda Ash Market Competitive Landscape, Market Share Analysis, and Company Profiles
- 11.1. Market Share Analysis
- 11.2. Company Profiles
- 11.3. LTata Chemicals Ltd (India)
- 11.3.1. Company Overview
- 11.3.2. Financial Highlights
- 11.3.3. Product Portfolio
- 11.3.4. SWOT Analysis
- 11.3.5. Key Strategies and Developments
- 11.4. Shandong Haihua Bunch (China)
- 11.4.1. Company Overview
- 11.4.2. Financial Highlights
- 11.4.3. Product Portfolio
- 11.4.4. SWOT Analysis
- 11.4.5. Key Strategies and Developments
- 11.5. GHCL Constrained (India)
- 11.5.1. Company Overview
- 11.5.2. Financial Highlights
- 11.5.3. Product Portfolio
- 11.5.4. SWOT Analysis
- 11.5.5. Key Strategies and Developments
- 11.6. Sisecam Bunch (Turkey)
- 11.6.1. Company Overview
- 11.6.2. Financial Highlights
- 11.6.3. Product Portfolio
- 11.6.4. SWOT Analysis
- 11.6.5. Key Strategies and Developments
- 11.7. Searles Valley Minerals (US)
- 11.7.1. Company Overview
- 11.7.2. Financial Highlights
- 11.7.3. Product Portfolio
- 11.7.4. SWOT Analysis
- 11.7.5. Key Strategies and Developments
- 11.8. Ciner Assets Organization (US)
- 11.8.1. Company Overview
- 11.8.2. Financial Highlights
- 11.8.3. Product Portfolio
- 11.8.4. SWOT Analysis
- 11.8.5. Key Strategies and Developments
- 11.9. Beginning Vitality LP (US)
- 11.9.1. Company Overview
- 11.9.2. Financial Highlights
- 11.9.3. Product Portfolio
- 11.9.4. SWOT Analysis
- 11.9.5. Key Strategies and Developments
- 11.10. Ciech SA (Poland)
- 11.10.1. Company Overview
- 11.10.2. Financial Highlights
- 11.10.3. Product Portfolio
- 11.10.4. SWOT Analysis
- 11.10.5. Key Strategies and Developments
- 11.11. Nirma Constrained (India)
- 11.11.1. Company Overview
- 11.11.2. Financial Highlights
- 11.11.3. Product Portfolio
- 11.11.4. SWOT Analysis
- 11.11.5. Key Strategies and Developments
- 11.12. OCI COMPANY Ltd (South Korea), among others
- 11.12.1. Company Overview
- 11.12.2. Financial Highlights
- 11.12.3. Product Portfolio
- 11.12.4. SWOT Analysis
- 11.12.5. Key Strategies and Developments
- 11.13.1. Company Overview
- 11.13.2. Financial Highlights
- 11.13.3. Product Portfolio
- 11.13.4. SWOT Analysis
- 11.13.5. Key Strategies and Developments
- 12. Assumptions and Acronyms
- 13. Research Methodology
- 14. Contact
"
- List of Figures
- "
- Figure 1: Global Soda Ash Market Revenue (US$ Mn) Market Share by By Type in 2022
- Figure 2: Global Soda Ash Market Market Attractiveness Analysis by By Type, 2016-2032
- Figure 3: Global Soda Ash Market Revenue (US$ Mn) Market Share by By Applicationin 2022
- Figure 4: Global Soda Ash Market Market Attractiveness Analysis by By Application, 2016-2032
- Figure 5: Global Soda Ash Market Revenue (US$ Mn) Market Share by Region in 2022
- Figure 6: Global Soda Ash Market Market Attractiveness Analysis by Region, 2016-2032
- Figure 7: Global Soda Ash Market Market Revenue (US$ Mn) (2016-2032)
- Figure 8: Global Soda Ash Market Market Revenue (US$ Mn) Comparison by Region (2016-2032)
- Figure 9: Global Soda Ash Market Market Revenue (US$ Mn) Comparison by By Type (2016-2032)
- Figure 10: Global Soda Ash Market Market Revenue (US$ Mn) Comparison by By Application (2016-2032)
- Figure 11: Global Soda Ash Market Market Y-o-Y Growth Rate Comparison by Region (2016-2032)
- Figure 12: Global Soda Ash Market Market Y-o-Y Growth Rate Comparison by By Type (2016-2032)
- Figure 13: Global Soda Ash Market Market Y-o-Y Growth Rate Comparison by By Application (2016-2032)
- Figure 14: Global Soda Ash Market Market Share Comparison by Region (2016-2032)
- Figure 15: Global Soda Ash Market Market Share Comparison by By Type (2016-2032)
- Figure 16: Global Soda Ash Market Market Share Comparison by By Application (2016-2032)
- Figure 17: North America Soda Ash Market Revenue (US$ Mn) Market Share by By Typein 2022
- Figure 18: North America Soda Ash Market Market Attractiveness Analysis by By Type, 2016-2032
- Figure 19: North America Soda Ash Market Revenue (US$ Mn) Market Share by By Applicationin 2022
- Figure 20: North America Soda Ash Market Market Attractiveness Analysis by By Application, 2016-2032
- Figure 21: North America Soda Ash Market Revenue (US$ Mn) Market Share by Country in 2022
- Figure 22: North America Soda Ash Market Market Attractiveness Analysis by Country, 2016-2032
- Figure 23: North America Soda Ash Market Market Revenue (US$ Mn) (2016-2032)
- Figure 24: North America Soda Ash Market Market Revenue (US$ Mn) Comparison by Country (2016-2032)
- Figure 25: North America Soda Ash Market Market Revenue (US$ Mn) Comparison by By Type (2016-2032)
- Figure 26: North America Soda Ash Market Market Revenue (US$ Mn) Comparison by By Application (2016-2032)
- Figure 27: North America Soda Ash Market Market Y-o-Y Growth Rate Comparison by Country (2016-2032)
- Figure 28: North America Soda Ash Market Market Y-o-Y Growth Rate Comparison by By Type (2016-2032)
- Figure 29: North America Soda Ash Market Market Y-o-Y Growth Rate Comparison by By Application (2016-2032)
- Figure 30: North America Soda Ash Market Market Share Comparison by Country (2016-2032)
- Figure 31: North America Soda Ash Market Market Share Comparison by By Type (2016-2032)
- Figure 32: North America Soda Ash Market Market Share Comparison by By Application (2016-2032)
- Figure 33: Western Europe Soda Ash Market Revenue (US$ Mn) Market Share by By Typein 2022
- Figure 34: Western Europe Soda Ash Market Market Attractiveness Analysis by By Type, 2016-2032
- Figure 35: Western Europe Soda Ash Market Revenue (US$ Mn) Market Share by By Applicationin 2022
- Figure 36: Western Europe Soda Ash Market Market Attractiveness Analysis by By Application, 2016-2032
- Figure 37: Western Europe Soda Ash Market Revenue (US$ Mn) Market Share by Country in 2022
- Figure 38: Western Europe Soda Ash Market Market Attractiveness Analysis by Country, 2016-2032
- Figure 39: Western Europe Soda Ash Market Market Revenue (US$ Mn) (2016-2032)
- Figure 40: Western Europe Soda Ash Market Market Revenue (US$ Mn) Comparison by Country (2016-2032)
- Figure 41: Western Europe Soda Ash Market Market Revenue (US$ Mn) Comparison by By Type (2016-2032)
- Figure 42: Western Europe Soda Ash Market Market Revenue (US$ Mn) Comparison by By Application (2016-2032)
- Figure 43: Western Europe Soda Ash Market Market Y-o-Y Growth Rate Comparison by Country (2016-2032)
- Figure 44: Western Europe Soda Ash Market Market Y-o-Y Growth Rate Comparison by By Type (2016-2032)
- Figure 45: Western Europe Soda Ash Market Market Y-o-Y Growth Rate Comparison by By Application (2016-2032)
- Figure 46: Western Europe Soda Ash Market Market Share Comparison by Country (2016-2032)
- Figure 47: Western Europe Soda Ash Market Market Share Comparison by By Type (2016-2032)
- Figure 48: Western Europe Soda Ash Market Market Share Comparison by By Application (2016-2032)
- Figure 49: Eastern Europe Soda Ash Market Revenue (US$ Mn) Market Share by By Typein 2022
- Figure 50: Eastern Europe Soda Ash Market Market Attractiveness Analysis by By Type, 2016-2032
- Figure 51: Eastern Europe Soda Ash Market Revenue (US$ Mn) Market Share by By Applicationin 2022
- Figure 52: Eastern Europe Soda Ash Market Market Attractiveness Analysis by By Application, 2016-2032
- Figure 53: Eastern Europe Soda Ash Market Revenue (US$ Mn) Market Share by Country in 2022
- Figure 54: Eastern Europe Soda Ash Market Market Attractiveness Analysis by Country, 2016-2032
- Figure 55: Eastern Europe Soda Ash Market Market Revenue (US$ Mn) (2016-2032)
- Figure 56: Eastern Europe Soda Ash Market Market Revenue (US$ Mn) Comparison by Country (2016-2032)
- Figure 57: Eastern Europe Soda Ash Market Market Revenue (US$ Mn) Comparison by By Type (2016-2032)
- Figure 58: Eastern Europe Soda Ash Market Market Revenue (US$ Mn) Comparison by By Application (2016-2032)
- Figure 59: Eastern Europe Soda Ash Market Market Y-o-Y Growth Rate Comparison by Country (2016-2032)
- Figure 60: Eastern Europe Soda Ash Market Market Y-o-Y Growth Rate Comparison by By Type (2016-2032)
- Figure 61: Eastern Europe Soda Ash Market Market Y-o-Y Growth Rate Comparison by By Application (2016-2032)
- Figure 62: Eastern Europe Soda Ash Market Market Share Comparison by Country (2016-2032)
- Figure 63: Eastern Europe Soda Ash Market Market Share Comparison by By Type (2016-2032)
- Figure 64: Eastern Europe Soda Ash Market Market Share Comparison by By Application (2016-2032)
- Figure 65: APAC Soda Ash Market Revenue (US$ Mn) Market Share by By Typein 2022
- Figure 66: APAC Soda Ash Market Market Attractiveness Analysis by By Type, 2016-2032
- Figure 67: APAC Soda Ash Market Revenue (US$ Mn) Market Share by By Applicationin 2022
- Figure 68: APAC Soda Ash Market Market Attractiveness Analysis by By Application, 2016-2032
- Figure 69: APAC Soda Ash Market Revenue (US$ Mn) Market Share by Country in 2022
- Figure 70: APAC Soda Ash Market Market Attractiveness Analysis by Country, 2016-2032
- Figure 71: APAC Soda Ash Market Market Revenue (US$ Mn) (2016-2032)
- Figure 72: APAC Soda Ash Market Market Revenue (US$ Mn) Comparison by Country (2016-2032)
- Figure 73: APAC Soda Ash Market Market Revenue (US$ Mn) Comparison by By Type (2016-2032)
- Figure 74: APAC Soda Ash Market Market Revenue (US$ Mn) Comparison by By Application (2016-2032)
- Figure 75: APAC Soda Ash Market Market Y-o-Y Growth Rate Comparison by Country (2016-2032)
- Figure 76: APAC Soda Ash Market Market Y-o-Y Growth Rate Comparison by By Type (2016-2032)
- Figure 77: APAC Soda Ash Market Market Y-o-Y Growth Rate Comparison by By Application (2016-2032)
- Figure 78: APAC Soda Ash Market Market Share Comparison by Country (2016-2032)
- Figure 79: APAC Soda Ash Market Market Share Comparison by By Type (2016-2032)
- Figure 80: APAC Soda Ash Market Market Share Comparison by By Application (2016-2032)
- Figure 81: Latin America Soda Ash Market Revenue (US$ Mn) Market Share by By Typein 2022
- Figure 82: Latin America Soda Ash Market Market Attractiveness Analysis by By Type, 2016-2032
- Figure 83: Latin America Soda Ash Market Revenue (US$ Mn) Market Share by By Applicationin 2022
- Figure 84: Latin America Soda Ash Market Market Attractiveness Analysis by By Application, 2016-2032
- Figure 85: Latin America Soda Ash Market Revenue (US$ Mn) Market Share by Country in 2022
- Figure 86: Latin America Soda Ash Market Market Attractiveness Analysis by Country, 2016-2032
- Figure 87: Latin America Soda Ash Market Market Revenue (US$ Mn) (2016-2032)
- Figure 88: Latin America Soda Ash Market Market Revenue (US$ Mn) Comparison by Country (2016-2032)
- Figure 89: Latin America Soda Ash Market Market Revenue (US$ Mn) Comparison by By Type (2016-2032)
- Figure 90: Latin America Soda Ash Market Market Revenue (US$ Mn) Comparison by By Application (2016-2032)
- Figure 91: Latin America Soda Ash Market Market Y-o-Y Growth Rate Comparison by Country (2016-2032)
- Figure 92: Latin America Soda Ash Market Market Y-o-Y Growth Rate Comparison by By Type (2016-2032)
- Figure 93: Latin America Soda Ash Market Market Y-o-Y Growth Rate Comparison by By Application (2016-2032)
- Figure 94: Latin America Soda Ash Market Market Share Comparison by Country (2016-2032)
- Figure 95: Latin America Soda Ash Market Market Share Comparison by By Type (2016-2032)
- Figure 96: Latin America Soda Ash Market Market Share Comparison by By Application (2016-2032)
- Figure 97: Middle East & Africa Soda Ash Market Revenue (US$ Mn) Market Share by By Typein 2022
- Figure 98: Middle East & Africa Soda Ash Market Market Attractiveness Analysis by By Type, 2016-2032
- Figure 99: Middle East & Africa Soda Ash Market Revenue (US$ Mn) Market Share by By Applicationin 2022
- Figure 100: Middle East & Africa Soda Ash Market Market Attractiveness Analysis by By Application, 2016-2032
- Figure 101: Middle East & Africa Soda Ash Market Revenue (US$ Mn) Market Share by Country in 2022
- Figure 102: Middle East & Africa Soda Ash Market Market Attractiveness Analysis by Country, 2016-2032
- Figure 103: Middle East & Africa Soda Ash Market Market Revenue (US$ Mn) (2016-2032)
- Figure 104: Middle East & Africa Soda Ash Market Market Revenue (US$ Mn) Comparison by Country (2016-2032)
- Figure 105: Middle East & Africa Soda Ash Market Market Revenue (US$ Mn) Comparison by By Type (2016-2032)
- Figure 106: Middle East & Africa Soda Ash Market Market Revenue (US$ Mn) Comparison by By Application (2016-2032)
- Figure 107: Middle East & Africa Soda Ash Market Market Y-o-Y Growth Rate Comparison by Country (2016-2032)
- Figure 108: Middle East & Africa Soda Ash Market Market Y-o-Y Growth Rate Comparison by By Type (2016-2032)
- Figure 109: Middle East & Africa Soda Ash Market Market Y-o-Y Growth Rate Comparison by By Application (2016-2032)
- Figure 110: Middle East & Africa Soda Ash Market Market Share Comparison by Country (2016-2032)
- Figure 111: Middle East & Africa Soda Ash Market Market Share Comparison by By Type (2016-2032)
- Figure 112: Middle East & Africa Soda Ash Market Market Share Comparison by By Application (2016-2032)
"
- List of Tables
- "
- Table 1: Global Soda Ash Market Market Comparison by By Type (2016-2032)
- Table 2: Global Soda Ash Market Market Comparison by By Application (2016-2032)
- Table 3: Global Soda Ash Market Revenue (US$ Mn) Comparison by Region (2016-2032)
- Table 4: Global Soda Ash Market Market Revenue (US$ Mn) (2016-2032)
- Table 5: Global Soda Ash Market Market Revenue (US$ Mn) Comparison by Region (2016-2032)
- Table 6: Global Soda Ash Market Market Revenue (US$ Mn) Comparison by By Type (2016-2032)
- Table 7: Global Soda Ash Market Market Revenue (US$ Mn) Comparison by By Application (2016-2032)
- Table 8: Global Soda Ash Market Market Y-o-Y Growth Rate Comparison by Region (2016-2032)
- Table 9: Global Soda Ash Market Market Y-o-Y Growth Rate Comparison by By Type (2016-2032)
- Table 10: Global Soda Ash Market Market Y-o-Y Growth Rate Comparison by By Application (2016-2032)
- Table 11: Global Soda Ash Market Market Share Comparison by Region (2016-2032)
- Table 12: Global Soda Ash Market Market Share Comparison by By Type (2016-2032)
- Table 13: Global Soda Ash Market Market Share Comparison by By Application (2016-2032)
- Table 14: North America Soda Ash Market Market Comparison by By Application (2016-2032)
- Table 15: North America Soda Ash Market Revenue (US$ Mn) Comparison by Country (2016-2032)
- Table 16: North America Soda Ash Market Market Revenue (US$ Mn) (2016-2032)
- Table 17: North America Soda Ash Market Market Revenue (US$ Mn) Comparison by Country (2016-2032)
- Table 18: North America Soda Ash Market Market Revenue (US$ Mn) Comparison by By Type (2016-2032)
- Table 19: North America Soda Ash Market Market Revenue (US$ Mn) Comparison by By Application (2016-2032)
- Table 20: North America Soda Ash Market Market Y-o-Y Growth Rate Comparison by Country (2016-2032)
- Table 21: North America Soda Ash Market Market Y-o-Y Growth Rate Comparison by By Type (2016-2032)
- Table 22: North America Soda Ash Market Market Y-o-Y Growth Rate Comparison by By Application (2016-2032)
- Table 23: North America Soda Ash Market Market Share Comparison by Country (2016-2032)
- Table 24: North America Soda Ash Market Market Share Comparison by By Type (2016-2032)
- Table 25: North America Soda Ash Market Market Share Comparison by By Application (2016-2032)
- Table 26: Western Europe Soda Ash Market Market Comparison by By Type (2016-2032)
- Table 27: Western Europe Soda Ash Market Market Comparison by By Application (2016-2032)
- Table 28: Western Europe Soda Ash Market Revenue (US$ Mn) Comparison by Country (2016-2032)
- Table 29: Western Europe Soda Ash Market Market Revenue (US$ Mn) (2016-2032)
- Table 30: Western Europe Soda Ash Market Market Revenue (US$ Mn) Comparison by Country (2016-2032)
- Table 31: Western Europe Soda Ash Market Market Revenue (US$ Mn) Comparison by By Type (2016-2032)
- Table 32: Western Europe Soda Ash Market Market Revenue (US$ Mn) Comparison by By Application (2016-2032)
- Table 33: Western Europe Soda Ash Market Market Y-o-Y Growth Rate Comparison by Country (2016-2032)
- Table 34: Western Europe Soda Ash Market Market Y-o-Y Growth Rate Comparison by By Type (2016-2032)
- Table 35: Western Europe Soda Ash Market Market Y-o-Y Growth Rate Comparison by By Application (2016-2032)
- Table 36: Western Europe Soda Ash Market Market Share Comparison by Country (2016-2032)
- Table 37: Western Europe Soda Ash Market Market Share Comparison by By Type (2016-2032)
- Table 38: Western Europe Soda Ash Market Market Share Comparison by By Application (2016-2032)
- Table 39: Eastern Europe Soda Ash Market Market Comparison by By Type (2016-2032)
- Table 40: Eastern Europe Soda Ash Market Market Comparison by By Application (2016-2032)
- Table 41: Eastern Europe Soda Ash Market Revenue (US$ Mn) Comparison by Country (2016-2032)
- Table 42: Eastern Europe Soda Ash Market Market Revenue (US$ Mn) (2016-2032)
- Table 43: Eastern Europe Soda Ash Market Market Revenue (US$ Mn) Comparison by Country (2016-2032)
- Table 44: Eastern Europe Soda Ash Market Market Revenue (US$ Mn) Comparison by By Type (2016-2032)
- Table 45: Eastern Europe Soda Ash Market Market Revenue (US$ Mn) Comparison by By Application (2016-2032)
- Table 46: Eastern Europe Soda Ash Market Market Y-o-Y Growth Rate Comparison by Country (2016-2032)
- Table 47: Eastern Europe Soda Ash Market Market Y-o-Y Growth Rate Comparison by By Type (2016-2032)
- Table 48: Eastern Europe Soda Ash Market Market Y-o-Y Growth Rate Comparison by By Application (2016-2032)
- Table 49: Eastern Europe Soda Ash Market Market Share Comparison by Country (2016-2032)
- Table 50: Eastern Europe Soda Ash Market Market Share Comparison by By Type (2016-2032)
- Table 51: Eastern Europe Soda Ash Market Market Share Comparison by By Application (2016-2032)
- Table 52: APAC Soda Ash Market Market Comparison by By Type (2016-2032)
- Table 53: APAC Soda Ash Market Market Comparison by By Application (2016-2032)
- Table 54: APAC Soda Ash Market Revenue (US$ Mn) Comparison by Country (2016-2032)
- Table 55: APAC Soda Ash Market Market Revenue (US$ Mn) (2016-2032)
- Table 56: APAC Soda Ash Market Market Revenue (US$ Mn) Comparison by Country (2016-2032)
- Table 57: APAC Soda Ash Market Market Revenue (US$ Mn) Comparison by By Type (2016-2032)
- Table 58: APAC Soda Ash Market Market Revenue (US$ Mn) Comparison by By Application (2016-2032)
- Table 59: APAC Soda Ash Market Market Y-o-Y Growth Rate Comparison by Country (2016-2032)
- Table 60: APAC Soda Ash Market Market Y-o-Y Growth Rate Comparison by By Type (2016-2032)
- Table 61: APAC Soda Ash Market Market Y-o-Y Growth Rate Comparison by By Application (2016-2032)
- Table 62: APAC Soda Ash Market Market Share Comparison by Country (2016-2032)
- Table 63: APAC Soda Ash Market Market Share Comparison by By Type (2016-2032)
- Table 64: APAC Soda Ash Market Market Share Comparison by By Application (2016-2032)
- Table 65: Latin America Soda Ash Market Market Comparison by By Type (2016-2032)
- Table 66: Latin America Soda Ash Market Market Comparison by By Application (2016-2032)
- Table 67: Latin America Soda Ash Market Revenue (US$ Mn) Comparison by Country (2016-2032)
- Table 68: Latin America Soda Ash Market Market Revenue (US$ Mn) (2016-2032)
- Table 69: Latin America Soda Ash Market Market Revenue (US$ Mn) Comparison by Country (2016-2032)
- Table 70: Latin America Soda Ash Market Market Revenue (US$ Mn) Comparison by By Type (2016-2032)
- Table 71: Latin America Soda Ash Market Market Revenue (US$ Mn) Comparison by By Application (2016-2032)
- Table 72: Latin America Soda Ash Market Market Y-o-Y Growth Rate Comparison by Country (2016-2032)
- Table 73: Latin America Soda Ash Market Market Y-o-Y Growth Rate Comparison by By Type (2016-2032)
- Table 74: Latin America Soda Ash Market Market Y-o-Y Growth Rate Comparison by By Application (2016-2032)
- Table 75: Latin America Soda Ash Market Market Share Comparison by Country (2016-2032)
- Table 76: Latin America Soda Ash Market Market Share Comparison by By Type (2016-2032)
- Table 77: Latin America Soda Ash Market Market Share Comparison by By Application (2016-2032)
- Table 78: Middle East & Africa Soda Ash Market Market Comparison by By Type (2016-2032)
- Table 79: Middle East & Africa Soda Ash Market Market Comparison by By Application (2016-2032)
- Table 80: Middle East & Africa Soda Ash Market Revenue (US$ Mn) Comparison by Country (2016-2032)
- Table 81: Middle East & Africa Soda Ash Market Market Revenue (US$ Mn) (2016-2032)
- Table 82: Middle East & Africa Soda Ash Market Market Revenue (US$ Mn) Comparison by Country (2016-2032)
- Table 83: Middle East & Africa Soda Ash Market Market Revenue (US$ Mn) Comparison by By Type (2016-2032)
- Table 84: Middle East & Africa Soda Ash Market Market Revenue (US$ Mn) Comparison by By Application (2016-2032)
- Table 85: Middle East & Africa Soda Ash Market Market Y-o-Y Growth Rate Comparison by Country (2016-2032)
- Table 86: Middle East & Africa Soda Ash Market Market Y-o-Y Growth Rate Comparison by By Type (2016-2032)
- Table 87: Middle East & Africa Soda Ash Market Market Y-o-Y Growth Rate Comparison by By Application (2016-2032)
- Table 88: Middle East & Africa Soda Ash Market Market Share Comparison by Country (2016-2032)
- Table 89: Middle East & Africa Soda Ash Market Market Share Comparison by By Type (2016-2032)
- Table 90: Middle East & Africa Soda Ash Market Market Share Comparison by By Application (2016-2032)
- 1. Executive Summary
-
- Tata Chemicals Ltd (India)
- Shandong Haihua Bunch (China)
- GHCL Constrained (India)
- Sisecam Bunch (Turkey)
- Searles Valley Minerals (US)
- Ciner Assets Organization (US)
- Beginning Vitality LP (US)
- Ciech SA (Poland)
- Nirma Constrained (India)
- OCI COMPANY Ltd (South Korea), among others
Our Clients


View Our Licence Options
