
SOC as a Service Market By Service (Security Information and Event Management (SIEM), Intrusion Detection and Prevention Systems (IDPS), Vulnerability Management, Endpoint Security, Others), By Offering (Fully Managed Service, Co-Managed Service), By Enterprise Type (SMEs, Large Enterprises), By Industry (BFSI, IT & Telecom, Healthcare, Government & Public Sector, Retail & E-commerce, Manufacturing, Others), By Region And Companies - Industry Segment Outlook, Market Assessment, Competition Scenario, Trends, And Forecast 2024-2033
-
51204
-
September 2024
-
300
-


-
This report was compiled by Vishwa Gaul Vishwa is an experienced market research and consulting professional with over 8 years of expertise in the ICT industry, contributing to over 700 reports across telecommunications, software, hardware, and digital solutions. Correspondence Team Lead- ICT Linkedin | Detailed Market research Methodology Our methodology involves a mix of primary research, including interviews with leading mental health experts, and secondary research from reputable medical journals and databases. View Detailed Methodology Page
-
Quick Navigation
Report Overview
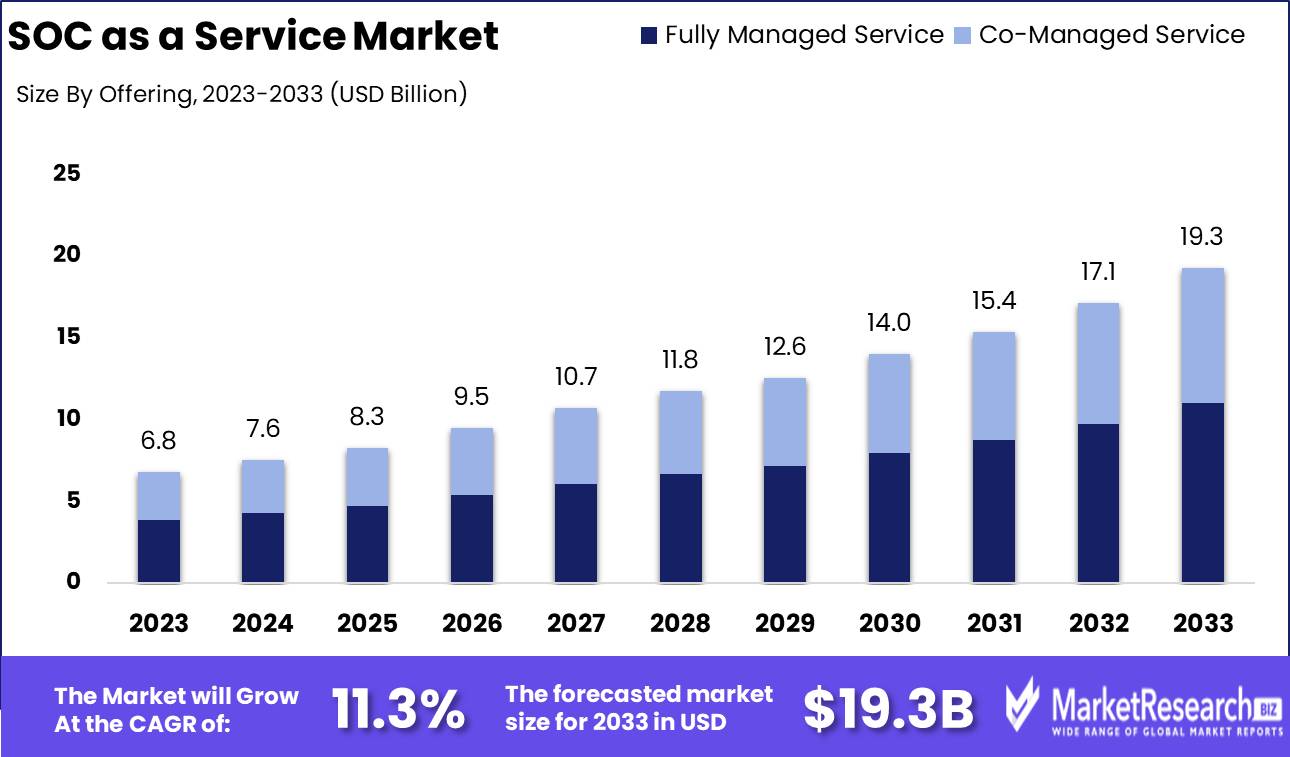
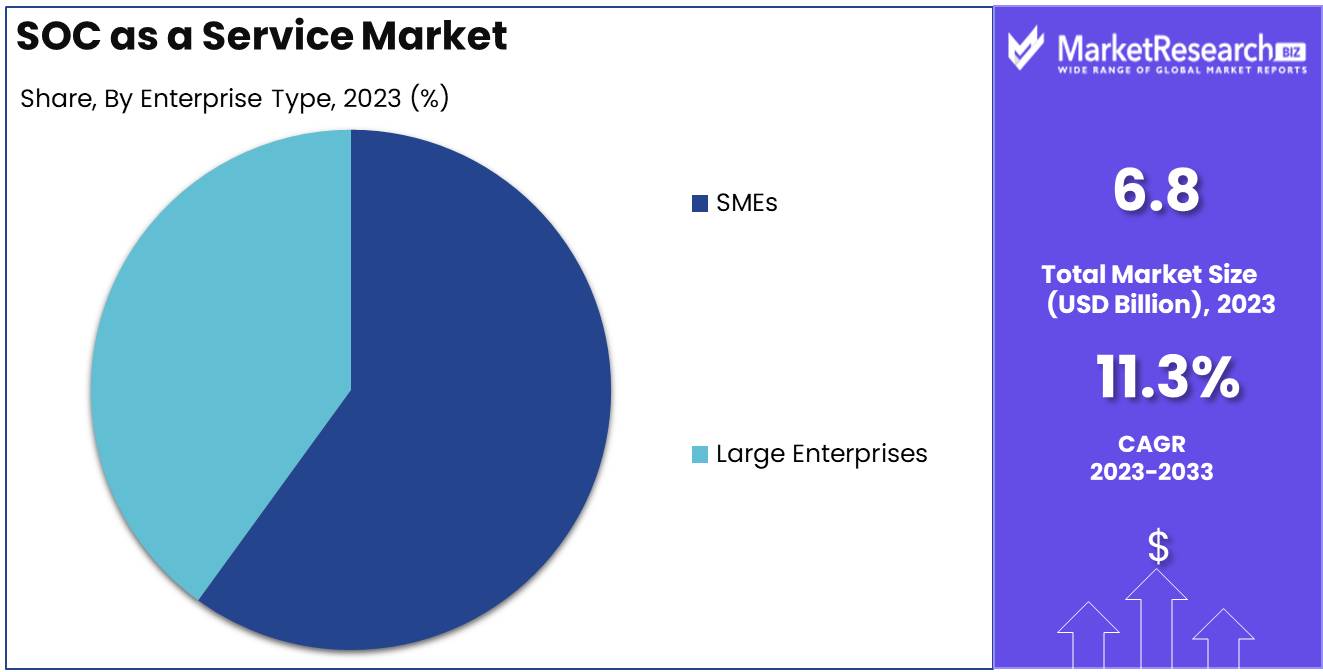
The SOC as a Service Market was valued at USD 6.8 billion in 2023. It is expected to reach USD 19.3 billion by 2033, with a CAGR of 11.3% during the forecast period from 2024 to 2033.
SOC as a Service (Security Operations Center as a Service) is a comprehensive outsourced solution that provides organizations with round-the-clock monitoring, threat detection, incident response, and vulnerability management. It combines advanced security technologies, skilled cybersecurity professionals, and real-time threat intelligence to protect businesses from cyberattacks and breaches. By leveraging SOC as a Service, companies can enhance their security posture without the need for in-house teams, ensuring cost efficiency and scalability.
The SOC (Security Operations Center) as a Service market is poised for substantial growth, driven primarily by the increasing sophistication of cyber threats, which demand more robust and dynamic security solutions. As organizations across industries face complex security challenges, there is a growing need for outsourced SOC services to detect, respond to, and mitigate cyber incidents in real-time. This trend is further compounded by the rapid adoption of cloud computing, which introduces new security vulnerabilities and expands the attack surface. As cloud infrastructure becomes a critical business enabler, enterprises are increasingly turning to cloud-based SOC solutions to secure their digital assets, maintain compliance, and reduce operational risk.
Furthermore, the integration of SOC services with legacy systems presents both a challenge and an opportunity. While legacy infrastructure may not be inherently equipped for modern cybersecurity protocols, vendors offering seamless integration with these older systems are well-positioned to capture significant market share.
Additionally, the adoption of AI and automation in SOC services is revolutionizing threat detection and response capabilities, enabling faster and more accurate identification of anomalies, which enhances the overall efficiency of security operations. This technological evolution is expected to drive further demand, particularly for scalable, cloud-based SOC services that offer flexibility, cost-efficiency, and adaptability to the changing threat landscape. These factors underscore the critical role SOC as a Service plays in modern cybersecurity strategies, with robust growth anticipated in the near term.
Key Takeaways
- Market Growth: The SOC as a Service Market was valued at USD 6.8 billion in 2023. It is expected to reach USD 19.3 billion by 2033, with a CAGR of 11.3% during the forecast period from 2024 to 2033.
- By Offering: SIEM dominated SOC as a Service with comprehensive cybersecurity solutions.
- By Offering: Fully Managed Service dominated the SOC as a Service market.
- By Enterprise Type: SMEs dominated the SOC as a Service market segment.
- By Industry: BFSI dominated SOC as a Service adoption across industries.
- Regional Dominance: North America dominates SOC as a Service market with a 40% largest share.
- Growth Opportunity: The global SOC as a Service market is set for substantial growth, driven by remote work expansion and increasing demand from SMEs seeking scalable and cost-effective cybersecurity solutions.
Driving factors
Increasing Cybersecurity Threats Driving SOC as a Service Adoption
The surge in sophisticated cyber threats, including malware, ransomware, phishing, and advanced persistent threats (APTs), has heightened the demand for robust security solutions, fueling the growth of the Security Operations Center (SOC) as a Service market. As organizations face increasingly complex and frequent cyberattacks, they are compelled to adopt proactive monitoring and incident response systems. According to industry data, global cybercrime is projected to cost businesses over $10.5 trillion annually by 2025, significantly increasing the demand for SOC as a Service, which offers 24/7 threat detection and response capabilities. The need to safeguard sensitive data, ensure regulatory compliance, and avoid costly breaches continues to be a primary driver for market growth.
Remote Work Trends Expanding the SOC as a Service Market
The widespread shift towards remote work, accelerated by the COVID-19 pandemic, has dramatically expanded the attack surface for cybercriminals. As employees access corporate networks from various locations and devices, the risk of unauthorized access, data breaches, and insider threats increases. SOC as a Service offers centralized security monitoring that spans across geographically distributed workforces, ensuring real-time protection of cloud services, mobile devices, and remote connections.
In 2023, over 60% of companies reported an increase in cybersecurity incidents attributed to remote work environments, further driving the need for scalable and flexible security solutions such as SOC as a Service. The ability to provide cloud-based threat detection and response makes SOC as a Service an essential tool for companies adapting to long-term remote work arrangements.
Advancements in Technology Enhancing SOC as a Service Capabilities
Technological advancements, including artificial intelligence (AI), machine learning (ML), and automation, have significantly improved the efficiency and effectiveness of SOC as a Service offering. AI and ML enable advanced threat detection and predictive analytics, allowing service providers to identify and neutralize emerging threats faster than traditional methods. These technologies also reduce the burden on human analysts by automating repetitive tasks and improving accuracy in threat analysis.
Moreover, innovations in cloud computing and big data analytics allow SOC as a Service provider to handle vast amounts of security data in real-time, enhancing incident response and mitigation strategies. According to market research, the integration of AI and automation in cybersecurity solutions is expected to grow at a compound annual growth rate (CAGR) of over 20% by 2026, reflecting its crucial role in SOC as a Service market expansion.
Restraining Factors
Data Privacy Concerns: Limiting Adoption and Expansion of SOC as a Service
Data privacy concerns represent a significant restraining factor in the growth of the SOC as a Service market. As cybersecurity threats evolve, businesses are increasingly adopting third-party services such as Security Operations Centers (SOC) to safeguard their infrastructure. However, the handling of sensitive information by external providers raises concerns about compliance with privacy regulations and data sovereignty laws. This is particularly pertinent in regions with stringent data protection laws, such as the European Union, where regulations like the General Data Protection Regulation (GDPR) impose strict requirements on how personal data is stored, transferred, and processed.
The reluctance of businesses to relinquish control over sensitive data to external SOC providers is further heightened by fears of data breaches, unauthorized access, and the potential misuse of information by service providers. The result is a slower rate of adoption among businesses in highly regulated industries such as healthcare, finance, and government sectors, where data privacy is paramount. According to industry estimates, privacy concerns could potentially limit market expansion, particularly in regions where companies face the risk of non-compliance penalties. This concern also drives businesses to prefer in-house SOC solutions or hybrid models where they maintain greater control over data, thereby limiting the full-scale outsourcing of security operations.
Customization Challenges: Restricting Service Flexibility and Market Penetration
Customization challenges also play a critical role in restraining the growth of the SOC as a Service market. Businesses have unique cybersecurity needs that vary based on their industry, size, and operational model. The inability of some SOC as Service providers to offer highly customizable solutions limits their attractiveness to businesses that require tailored security approaches. While standard SOC services can address common cybersecurity issues, they may not be sufficient for businesses with specialized needs, such as those operating in niche markets or facing highly sophisticated cyber threats.
This lack of customization flexibility can discourage potential clients, particularly large enterprises or organizations with complex IT environments, from adopting SOC as a Service solution. They may instead opt for in-house solutions that allow them to fully control and adapt their security systems to meet specific requirements. The challenge of integrating SOC services with existing IT infrastructure and workflows also contributes to this restraint. As a result, smaller providers offering one-size-fits-all solutions struggle to penetrate certain market segments, which slows overall market growth.
By Service Analysis
In 2023, SIEM dominated SOC as a Service with comprehensive cybersecurity solutions.
In 2023, Security Information and Event Management (SIEM) held a dominant market position in the "By Service" segment of the SOC as a Service Market. SIEM's leadership was driven by its comprehensive threat detection capabilities, real-time analysis, and centralized security management, positioning it as a critical solution for organizations seeking to enhance their cybersecurity infrastructure.
Other key services include Intrusion Detection and Prevention Systems (IDPS), which play a crucial role in identifying and mitigating potential threats through network traffic monitoring. Vulnerability Management gained traction due to its focus on identifying and addressing system weaknesses before exploitation, contributing to proactive security measures. Endpoint Security continued to be essential for securing individual devices against malware, phishing, and other attacks, which are increasingly common as organizations adopt remote work environments.
Lastly, the "Others" category, encompassing services such as security assessment and auditing, also experienced steady demand, as businesses sought a holistic approach to securing their operational networks. The convergence of these services solidified the SOC as a Service Market’s critical importance in an era of rising cyber threats.
By Offering Analysis
In 2023, Fully Managed Service dominated the SOC as a Service market.
In 2023, Fully Managed Service held a dominant market position in the "By Offering" segment of the SOC (Security Operations Center) as a Service Market. This service type accounted for a significant portion of the market due to its comprehensive coverage and the increasing demand for end-to-end security solutions. Fully managed SOC services allow organizations to outsource their security operations entirely, offering around-the-clock monitoring, threat detection, incident response, and compliance management without the need for in-house expertise. This is particularly appealing to small and medium-sized enterprises (SMEs) lacking the resources to maintain an internal SOC.
Conversely, Co-Managed Service also saw notable adoption, especially among large enterprises that prefer to retain partial control over their security operations while leveraging external SOC expertise. Co-Managed Services provide flexibility, allowing organizations to integrate their internal teams with external SOC providers, improving operational efficiency and cost management. While Fully Managed Service dominated the segment, the co-managed model gained traction due to its hybrid approach, offering scalability and collaboration. Together, these services catered to varying organizational needs, driving overall market growth in the SOC as a Service market.
By Enterprise Type Analysis
In 2023, SMEs dominated the SOC as a Service market segment.
In 2023, SMEs held a dominant market position in the "By Enterprise Type" segment of the SOC as a Service market. This growth is attributed to the increasing need for robust cybersecurity solutions among small and medium-sized enterprises, which are increasingly becoming targets of cyberattacks. SMEs, often lacking the resources for in-house Security Operations Centers (SOCs), have turned to SOCS as a Service for cost-effective, scalable solutions. The shift toward remote working and digital transformation has further amplified the demand for these services, with SMEs prioritizing cybersecurity to ensure business continuity and data protection.
Large enterprises, although significant players have traditionally maintained internal SOC teams, which limits the overall share of SOC as a Service adoption within this group. However, the complexity of cyber threats and cost-efficiency concerns are leading some large enterprises to adopt hybrid models, combining internal SOCs with third-party services. SMEs’ reliance on third-party expertise, coupled with the increasing sophistication of managed detection and response services, positions them as key contributors to the growth of the SOC as a Service market.
By Industry Analysis
In 2023, BFSI dominated SOC as a Service adoption across industries.
In 2023, BFSI held a dominant market position in the "By Industry" segment of the SOC as a Service Market. The banking, financial services, and insurance sectors experienced significant demand for SOC as a Service due to the growing necessity to mitigate cyber threats and ensure regulatory compliance.
The IT & Telecom sector also exhibited strong adoption, driven by the need to protect vast amounts of sensitive data from sophisticated cyberattacks. The Healthcare industry saw increased utilization of SOC services to safeguard patient data and maintain HIPAA compliance. The Government & Public Sector emerged as a key player, focusing on protecting critical infrastructure and sensitive information. Retail & E-commerce continued to adopt these services to secure transactional data and protect consumer information.
Meanwhile, the Manufacturing industry, increasingly reliant on interconnected systems and IoT, utilized SOC services to prevent disruptions. Lastly, Others, encompassing sectors like education and energy, increasingly turned to SOC as a Service to address growing cybersecurity concerns and meet regulatory requirements. This diverse uptake underscores the market’s growing recognition of cybersecurity as a crucial business function across industries.
Key Market Segments
By Service
- Security Information and Event Management (SIEM)
- Intrusion Detection and Prevention Systems (IDPS)
- Vulnerability Management
- Endpoint Security
- Others
By Offering
- Fully Managed Service
- Co-Managed Service
By Enterprise Type
- SMEs
- Large Enterprises
By Industry
- BFSI
- IT & Telecom
- Healthcare
- Government & Public Sector
- Retail & E-commerce
- Manufacturing
- Others
Growth Opportunity
The Expansion of Remote Work and Its Impact on SOC as a Service Demand
The global SOC (Security Operations Center) as a Service market is poised for significant growth, driven by the continued expansion of remote work trends. As companies increasingly adopt hybrid and fully remote work models, the attack surface for cyber threats has expanded. According to recent studies, over 70% of businesses worldwide are expected to maintain some form of remote work structure. This shift has prompted organizations to prioritize cybersecurity solutions that are scalable and adaptable to a decentralized workforce.
SOC as a Service provides organizations with real-time monitoring, threat detection, and incident response, which are critical in safeguarding distributed networks and cloud infrastructures. The increasing reliance on digital communication and collaboration tools further underscores the importance of managed cybersecurity solutions, presenting a significant opportunity for SOC as a Service provider.
Growing Demand from SMEs Accelerating the Adoption of SOC as a Service
Small and medium-sized enterprises (SMEs) are also driving the growth of the SOC as a Service market. SMEs often lack the resources and expertise to manage in-house security operations, making outsourced solutions an attractive option. The global SME market is projected to grow at a CAGR of 7.5% from 2024 to 2029, with many companies investing in cybersecurity to protect against increasing cyber threats. SOC as a Service offers a cost-effective and scalable solution for SMEs, enabling them to access advanced security features without the need for large capital investments in infrastructure. This growing demand among SMEs will further contribute to the market’s expansion.
Latest Trends
Rising Demand in Financial Services
The SOC as a Service (SOCaaS) market is expected to experience a substantial rise in demand from the financial services sector. The increasing sophistication of cyber threats, such as ransomware and phishing attacks, has prompted financial institutions to invest more heavily in security solutions that can provide real-time threat detection and response. Given the sensitive nature of financial data and the stringent regulatory environment, banks, insurance firms, and fintech companies are looking to SOCaaS providers for robust, scalable, and compliant security monitoring services. Additionally, the adoption of cloud-based banking and digital payment solutions has further increased the need for continuous monitoring and enhanced security, driving market growth in this sector.
Healthcare Sector Adoption
The healthcare industry is poised to become a key adopter of SOCaaS, driven by the increasing digitization of patient records and the proliferation of telehealth services. The need to protect sensitive patient data in compliance with stringent regulations like HIPAA in the United States and GDPR in Europe is pushing healthcare providers to adopt SOCaaS solutions. The rise in cyberattacks targeting healthcare institutions, combined with the sector’s growing reliance on cloud-based electronic health record (EHR) systems, is expected to significantly contribute to market expansion. SOCaaS offers healthcare organizations the ability to proactively detect and mitigate threats without the need to build and maintain expensive, in-house security operations centers.
Regional Analysis
North America dominates the SOC as a Service market with a 40% largest share.
The SOC as a Service (Security Operations Center as a Service) market exhibits significant regional disparities driven by varying degrees of cybersecurity adoption, regulatory frameworks, and technological advancements. North America dominates the market, accounting for over 40% of the global revenue share in 2023. This leadership is attributed to the high concentration of major cybersecurity service providers, widespread adoption of cloud technologies, and stringent regulatory standards like GDPR and CCPA. The United States, in particular, leads the charge due to its robust IT infrastructure and increasing cyber threats across industries.
Europe holds the second-largest share, driven by the rise in cyberattacks and the implementation of stricter data protection laws such as the General Data Protection Regulation (GDPR). Germany, the UK, and France are key contributors to market growth, with an increasing focus on managed security services.
The Asia Pacific region is expected to witness the fastest growth, with a compound annual growth rate (CAGR) exceeding 20% during the forecast period. Rapid digitalization in countries like India, China, and Japan, combined with growing awareness of cyber risks, is fueling demand for SOC services. Moreover, the increasing adoption of cloud services in this region is accelerating market expansion.
In the Middle East & Africa, the market is growing steadily, driven by the rise in cyber threats targeting critical infrastructure. Latin America is experiencing slower adoption, though Brazil and Mexico are emerging markets due to increasing investment in cybersecurity.

Key Regions and Countries
North America
- The US
- Canada
- Rest of North America
Europe
- Germany
- France
- The UK
- Spain
- Netherlands
- Russia
- Italy
- Rest of Europe
Asia-Pacific
- China
- Japan
- Singapore
- Thailand
- South Korea
- Vietnam
- India
- New Zealand
- Rest of Asia Pacific
Latin America
- Mexico
- Brazil
- Rest of Latin America
Middle East & Africa
- Saudi Arabia
- South Africa
- UAE
- Rest of the Middle East & Africa
Key Players Analysis
The global Security Operations Center (SOC) as a Service market is expected to exhibit significant growth, driven by the rising incidence of cyber threats, increasing complexity of IT environments, and growing awareness of cybersecurity. Key players in this market, such as AlienVault and Fortinet, are well-positioned due to their comprehensive security solutions and strong market presence. AlienVault's integrated threat detection capabilities and Fortinet's extensive security infrastructure continue to attract enterprises seeking robust defense mechanisms.
Thales E-security and Verizon Communications Inc. leverage their advanced cybersecurity technologies and established client base to provide scalable SOC services, catering to a diverse range of industries, including finance, healthcare, and government sectors. Additionally, Arctic Wolf Networks is gaining traction due to its managed detection and response services, which are increasingly appealing to mid-sized businesses looking for affordable yet effective SOC solutions.
Smaller players like Cygilant and Suma Soft focus on providing cost-effective and customized SOC as a Service, aiming to capture the SME segment of the market. On the other hand, AT&T Inc. and NTT Data Corp benefit from their extensive global presence and integrated service portfolios, enabling them to serve larger enterprises with comprehensive security solutions.
Cloud-native SOC providers such as Cloudflare Inc. and Alert Logic are particularly well-positioned as cloud adoption accelerates, offering solutions that seamlessly integrate into cloud environments, thus driving market expansion. These companies are poised to benefit from increased demand for SOC services, with innovation and strategic partnerships likely to define their competitive advantage in 2024.
Market Key Players
- AlienVault
- BlackStratus
- Cygilant
- Thales E-security
- Proficio
- Netmagic
- AqmTechnologies
- ESDS Software Solution
- Suma Soft
- GA Systems
- Alert Logic
- Expel
- Radar Cyber Security
- Stratozen
- Fortinet
- Arctic Wolf Networks
- Binary Defense
- Fortinet Inc
- Atos SE
- NTT Data Corp
- Verizon Communications Inc
- AT&T Inc
- Arctic Wolf Networks Inc
- Cloudflare Inc
- ConnectWise LLC
Recent Development
- In July 2024, Lumen Technologies announced the integration of 5G technology with its SOC services, targeting communication service providers. This development is expected to provide real-time, low-latency threat detection and response across 5G networks, enabling faster and more secure data transmission, especially in industries like healthcare and smart cities.
- In March 2024, Netmagic Solutions launched enhanced SOCaaS offerings tailored to address the increasing frequency of cyberattacks targeting cloud infrastructures. These new services emphasize real-time threat monitoring and response, aimed at helping enterprises across India meet regulatory compliance and safeguard their digital assets.
- In February 2024, Infoblox introduced a new AI-driven tool, SOC Insights, integrated into its BloxOne Threat Defense platform. This tool significantly enhances detection and remediation capabilities for security operations, providing real-time insights for security professionals to respond more proactively to evolving cyber threats.
Report Scope
Report Features Description Market Value (2023) USD 6.8 Billion Forecast Revenue (2033) USD 19.3 Billion CAGR (2024-2032) 11.3% Base Year for Estimation 2023 Historic Period 2016-2023 Forecast Period 2024-2033 Report Coverage Revenue Forecast, Market Dynamics, COVID-19 Impact, Competitive Landscape, Recent Developments Segments Covered By Service (Security Information and Event Management (SIEM), Intrusion Detection and Prevention Systems (IDPS), Vulnerability Management, Endpoint Security, Others), By Offering (Fully Managed Service, Co-Managed Service), By Enterprise Type (SMEs, Large Enterprises), By Industry (BFSI, IT & Telecom, Healthcare, Government & Public Sector, Retail & E-commerce, Manufacturing, Others) Regional Analysis North America - The US, Canada, Rest of North America, Europe - Germany, France, The UK, Spain, Italy, Russia, Netherlands, Rest of Europe, Asia-Pacific - China, Japan, South Korea, India, New Zealand, Singapore, Thailand, Vietnam, Rest of Asia Pacific, Latin America - Brazil, Mexico, Rest of Latin America, Middle East & Africa - South Africa, Saudi Arabia, UAE, Rest of Middle East & Africa Competitive Landscape AlienVault, BlackStratus, Cygilant, Thales E-security, Proficio, Netmagic, AqmTechnologies, ESDS Software Solution, Suma Soft, GA Systems, Alert Logic, Expel, Radar Cyber Security, Stratozen, Fortinet, Arctic Wolf Networks, Binary Defense, Fortinet Inc, Atos SE, NTT Data Corp, Verizon Communications Inc, AT&T Inc, Arctic Wolf Networks Inc, Cloudflare Inc, ConnectWise LLC Customization Scope Customization for segments at the regional/country level will be provided. Moreover, additional customization can be done based on the requirements. Purchase Options We have three licenses to opt for Single User License, Multi-User License (Up to 5 Users), Corporate Use License (Unlimited User and Printable PDF) -
- 1. Executive Summary
- 1.1. Definition
- 1.2. Taxonomy
- 1.3. Research Scope
- 1.4. Key Analysis
- 1.5. Key Findings by Major Segments
- 1.6. Top strategies by Major Players
- 2. Global SOC as a Service Market Overview
- 2.1. SOC as a Service Market Dynamics
- 2.1.1. Drivers
- 2.1.2. Opportunities
- 2.1.3. Restraints
- 2.1.4. Challenges
- 2.2. Macro-economic Factors
- 2.3. Regulatory Framework
- 2.4. Market Investment Feasibility Index
- 2.5. PEST Analysis
- 2.6. PORTER’S Five Force Analysis
- 2.7. Drivers & Restraints Impact Analysis
- 2.8. Industry Chain Analysis
- 2.9. Cost Structure Analysis
- 2.10. Marketing Strategy
- 2.11. Russia-Ukraine War Impact Analysis
- 2.12. Opportunity Map Analysis
- 2.13. Market Competition Scenario Analysis
- 2.14. Product Life Cycle Analysis
- 2.15. Opportunity Orbits
- 2.16. Manufacturer Intensity Map
- 2.17. Major Companies sales by Value & Volume
- 2.1. SOC as a Service Market Dynamics
- 3. Global SOC as a Service Market Analysis, Opportunity and Forecast, 2016-2032
- 3.1. Global SOC as a Service Market Analysis, 2016-2021
- 3.2. Global SOC as a Service Market Opportunity and Forecast, 2023-2032
- 3.3. Global SOC as a Service Market Analysis, Opportunity and Forecast, By Service, 2016-2032
- 3.3.1. Global SOC as a Service Market Analysis by Service: Introduction
- 3.3.2. Market Size Absolute $ Opportunity Analysis and Forecast, By Service, 2016-2032
- 3.3.3. Security Information and Event Management (SIEM)
- 3.3.4. Intrusion Detection and Prevention Systems (IDPS)
- 3.3.5. Vulnerability Management
- 3.3.6. Endpoint Security
- 3.3.7. Others
- 3.4. Global SOC as a Service Market Analysis, Opportunity and Forecast, By Offering, 2016-2032
- 3.4.1. Global SOC as a Service Market Analysis by Offering: Introduction
- 3.4.2. Market Size Absolute $ Opportunity Analysis and Forecast, By Offering, 2016-2032
- 3.4.3. Fully Managed Service
- 3.4.4. Co-Managed Service
- 3.5. Global SOC as a Service Market Analysis, Opportunity and Forecast, By Enterprise Type, 2016-2032
- 3.5.1. Global SOC as a Service Market Analysis by Enterprise Type: Introduction
- 3.5.2. Market Size Absolute $ Opportunity Analysis and Forecast, By Enterprise Type, 2016-2032
- 3.5.3. SMEs
- 3.5.4. Large Enterprises
- 3.6. Global SOC as a Service Market Analysis, Opportunity and Forecast, By Industry, 2016-2032
- 3.6.1. Global SOC as a Service Market Analysis by Industry: Introduction
- 3.6.2. Market Size Absolute $ Opportunity Analysis and Forecast, By Industry, 2016-2032
- 3.6.3. BFSI
- 3.6.4. IT & Telecom
- 3.6.5. Healthcare
- 3.6.6. Government & Public Sector
- 3.6.7. Retail & E-commerce
- 3.6.8. Manufacturing
- 3.6.9. Others
- 4. North America SOC as a Service Market Analysis, Opportunity and Forecast, 2016-2032
- 4.1. North America SOC as a Service Market Analysis, 2016-2021
- 4.2. North America SOC as a Service Market Opportunity and Forecast, 2023-2032
- 4.3. North America SOC as a Service Market Analysis, Opportunity and Forecast, By Service, 2016-2032
- 4.3.1. North America SOC as a Service Market Analysis by Service: Introduction
- 4.3.2. Market Size Absolute $ Opportunity Analysis and Forecast, By Service, 2016-2032
- 4.3.3. Security Information and Event Management (SIEM)
- 4.3.4. Intrusion Detection and Prevention Systems (IDPS)
- 4.3.5. Vulnerability Management
- 4.3.6. Endpoint Security
- 4.3.7. Others
- 4.4. North America SOC as a Service Market Analysis, Opportunity and Forecast, By Offering, 2016-2032
- 4.4.1. North America SOC as a Service Market Analysis by Offering: Introduction
- 4.4.2. Market Size Absolute $ Opportunity Analysis and Forecast, By Offering, 2016-2032
- 4.4.3. Fully Managed Service
- 4.4.4. Co-Managed Service
- 4.5. North America SOC as a Service Market Analysis, Opportunity and Forecast, By Enterprise Type, 2016-2032
- 4.5.1. North America SOC as a Service Market Analysis by Enterprise Type: Introduction
- 4.5.2. Market Size Absolute $ Opportunity Analysis and Forecast, By Enterprise Type, 2016-2032
- 4.5.3. SMEs
- 4.5.4. Large Enterprises
- 4.6. North America SOC as a Service Market Analysis, Opportunity and Forecast, By Industry, 2016-2032
- 4.6.1. North America SOC as a Service Market Analysis by Industry: Introduction
- 4.6.2. Market Size Absolute $ Opportunity Analysis and Forecast, By Industry, 2016-2032
- 4.6.3. BFSI
- 4.6.4. IT & Telecom
- 4.6.5. Healthcare
- 4.6.6. Government & Public Sector
- 4.6.7. Retail & E-commerce
- 4.6.8. Manufacturing
- 4.6.9. Others
- 4.7. North America SOC as a Service Market Analysis, Opportunity and Forecast, By Country , 2016-2032
- 4.7.1. North America SOC as a Service Market Analysis by Country : Introduction
- 4.7.2. Market Size Absolute $ Opportunity Analysis and Forecast, Country , 2016-2032
- 4.7.2.1. The US
- 4.7.2.2. Canada
- 4.7.2.3. Mexico
- 5. Western Europe SOC as a Service Market Analysis, Opportunity and Forecast, 2016-2032
- 5.1. Western Europe SOC as a Service Market Analysis, 2016-2021
- 5.2. Western Europe SOC as a Service Market Opportunity and Forecast, 2023-2032
- 5.3. Western Europe SOC as a Service Market Analysis, Opportunity and Forecast, By Service, 2016-2032
- 5.3.1. Western Europe SOC as a Service Market Analysis by Service: Introduction
- 5.3.2. Market Size Absolute $ Opportunity Analysis and Forecast, By Service, 2016-2032
- 5.3.3. Security Information and Event Management (SIEM)
- 5.3.4. Intrusion Detection and Prevention Systems (IDPS)
- 5.3.5. Vulnerability Management
- 5.3.6. Endpoint Security
- 5.3.7. Others
- 5.4. Western Europe SOC as a Service Market Analysis, Opportunity and Forecast, By Offering, 2016-2032
- 5.4.1. Western Europe SOC as a Service Market Analysis by Offering: Introduction
- 5.4.2. Market Size Absolute $ Opportunity Analysis and Forecast, By Offering, 2016-2032
- 5.4.3. Fully Managed Service
- 5.4.4. Co-Managed Service
- 5.5. Western Europe SOC as a Service Market Analysis, Opportunity and Forecast, By Enterprise Type, 2016-2032
- 5.5.1. Western Europe SOC as a Service Market Analysis by Enterprise Type: Introduction
- 5.5.2. Market Size Absolute $ Opportunity Analysis and Forecast, By Enterprise Type, 2016-2032
- 5.5.3. SMEs
- 5.5.4. Large Enterprises
- 5.6. Western Europe SOC as a Service Market Analysis, Opportunity and Forecast, By Industry, 2016-2032
- 5.6.1. Western Europe SOC as a Service Market Analysis by Industry: Introduction
- 5.6.2. Market Size Absolute $ Opportunity Analysis and Forecast, By Industry, 2016-2032
- 5.6.3. BFSI
- 5.6.4. IT & Telecom
- 5.6.5. Healthcare
- 5.6.6. Government & Public Sector
- 5.6.7. Retail & E-commerce
- 5.6.8. Manufacturing
- 5.6.9. Others
- 5.7. Western Europe SOC as a Service Market Analysis, Opportunity and Forecast, By Country , 2016-2032
- 5.7.1. Western Europe SOC as a Service Market Analysis by Country : Introduction
- 5.7.2. Market Size Absolute $ Opportunity Analysis and Forecast, Country , 2016-2032
- 5.7.2.1. Germany
- 5.7.2.2. France
- 5.7.2.3. The UK
- 5.7.2.4. Spain
- 5.7.2.5. Italy
- 5.7.2.6. Portugal
- 5.7.2.7. Ireland
- 5.7.2.8. Austria
- 5.7.2.9. Switzerland
- 5.7.2.10. Benelux
- 5.7.2.11. Nordic
- 5.7.2.12. Rest of Western Europe
- 6. Eastern Europe SOC as a Service Market Analysis, Opportunity and Forecast, 2016-2032
- 6.1. Eastern Europe SOC as a Service Market Analysis, 2016-2021
- 6.2. Eastern Europe SOC as a Service Market Opportunity and Forecast, 2023-2032
- 6.3. Eastern Europe SOC as a Service Market Analysis, Opportunity and Forecast, By Service, 2016-2032
- 6.3.1. Eastern Europe SOC as a Service Market Analysis by Service: Introduction
- 6.3.2. Market Size Absolute $ Opportunity Analysis and Forecast, By Service, 2016-2032
- 6.3.3. Security Information and Event Management (SIEM)
- 6.3.4. Intrusion Detection and Prevention Systems (IDPS)
- 6.3.5. Vulnerability Management
- 6.3.6. Endpoint Security
- 6.3.7. Others
- 6.4. Eastern Europe SOC as a Service Market Analysis, Opportunity and Forecast, By Offering, 2016-2032
- 6.4.1. Eastern Europe SOC as a Service Market Analysis by Offering: Introduction
- 6.4.2. Market Size Absolute $ Opportunity Analysis and Forecast, By Offering, 2016-2032
- 6.4.3. Fully Managed Service
- 6.4.4. Co-Managed Service
- 6.5. Eastern Europe SOC as a Service Market Analysis, Opportunity and Forecast, By Enterprise Type, 2016-2032
- 6.5.1. Eastern Europe SOC as a Service Market Analysis by Enterprise Type: Introduction
- 6.5.2. Market Size Absolute $ Opportunity Analysis and Forecast, By Enterprise Type, 2016-2032
- 6.5.3. SMEs
- 6.5.4. Large Enterprises
- 6.6. Eastern Europe SOC as a Service Market Analysis, Opportunity and Forecast, By Industry, 2016-2032
- 6.6.1. Eastern Europe SOC as a Service Market Analysis by Industry: Introduction
- 6.6.2. Market Size Absolute $ Opportunity Analysis and Forecast, By Industry, 2016-2032
- 6.6.3. BFSI
- 6.6.4. IT & Telecom
- 6.6.5. Healthcare
- 6.6.6. Government & Public Sector
- 6.6.7. Retail & E-commerce
- 6.6.8. Manufacturing
- 6.6.9. Others
- 6.7. Eastern Europe SOC as a Service Market Analysis, Opportunity and Forecast, By Country , 2016-2032
- 6.7.1. Eastern Europe SOC as a Service Market Analysis by Country : Introduction
- 6.7.2. Market Size Absolute $ Opportunity Analysis and Forecast, Country , 2016-2032
- 6.7.2.1. Russia
- 6.7.2.2. Poland
- 6.7.2.3. The Czech Republic
- 6.7.2.4. Greece
- 6.7.2.5. Rest of Eastern Europe
- 7. APAC SOC as a Service Market Analysis, Opportunity and Forecast, 2016-2032
- 7.1. APAC SOC as a Service Market Analysis, 2016-2021
- 7.2. APAC SOC as a Service Market Opportunity and Forecast, 2023-2032
- 7.3. APAC SOC as a Service Market Analysis, Opportunity and Forecast, By Service, 2016-2032
- 7.3.1. APAC SOC as a Service Market Analysis by Service: Introduction
- 7.3.2. Market Size Absolute $ Opportunity Analysis and Forecast, By Service, 2016-2032
- 7.3.3. Security Information and Event Management (SIEM)
- 7.3.4. Intrusion Detection and Prevention Systems (IDPS)
- 7.3.5. Vulnerability Management
- 7.3.6. Endpoint Security
- 7.3.7. Others
- 7.4. APAC SOC as a Service Market Analysis, Opportunity and Forecast, By Offering, 2016-2032
- 7.4.1. APAC SOC as a Service Market Analysis by Offering: Introduction
- 7.4.2. Market Size Absolute $ Opportunity Analysis and Forecast, By Offering, 2016-2032
- 7.4.3. Fully Managed Service
- 7.4.4. Co-Managed Service
- 7.5. APAC SOC as a Service Market Analysis, Opportunity and Forecast, By Enterprise Type, 2016-2032
- 7.5.1. APAC SOC as a Service Market Analysis by Enterprise Type: Introduction
- 7.5.2. Market Size Absolute $ Opportunity Analysis and Forecast, By Enterprise Type, 2016-2032
- 7.5.3. SMEs
- 7.5.4. Large Enterprises
- 7.6. APAC SOC as a Service Market Analysis, Opportunity and Forecast, By Industry, 2016-2032
- 7.6.1. APAC SOC as a Service Market Analysis by Industry: Introduction
- 7.6.2. Market Size Absolute $ Opportunity Analysis and Forecast, By Industry, 2016-2032
- 7.6.3. BFSI
- 7.6.4. IT & Telecom
- 7.6.5. Healthcare
- 7.6.6. Government & Public Sector
- 7.6.7. Retail & E-commerce
- 7.6.8. Manufacturing
- 7.6.9. Others
- 7.7. APAC SOC as a Service Market Analysis, Opportunity and Forecast, By Country , 2016-2032
- 7.7.1. APAC SOC as a Service Market Analysis by Country : Introduction
- 7.7.2. Market Size Absolute $ Opportunity Analysis and Forecast, Country , 2016-2032
- 7.7.2.1. China
- 7.7.2.2. Japan
- 7.7.2.3. South Korea
- 7.7.2.4. India
- 7.7.2.5. Australia & New Zeland
- 7.7.2.6. Indonesia
- 7.7.2.7. Malaysia
- 7.7.2.8. Philippines
- 7.7.2.9. Singapore
- 7.7.2.10. Thailand
- 7.7.2.11. Vietnam
- 7.7.2.12. Rest of APAC
- 8. Latin America SOC as a Service Market Analysis, Opportunity and Forecast, 2016-2032
- 8.1. Latin America SOC as a Service Market Analysis, 2016-2021
- 8.2. Latin America SOC as a Service Market Opportunity and Forecast, 2023-2032
- 8.3. Latin America SOC as a Service Market Analysis, Opportunity and Forecast, By Service, 2016-2032
- 8.3.1. Latin America SOC as a Service Market Analysis by Service: Introduction
- 8.3.2. Market Size Absolute $ Opportunity Analysis and Forecast, By Service, 2016-2032
- 8.3.3. Security Information and Event Management (SIEM)
- 8.3.4. Intrusion Detection and Prevention Systems (IDPS)
- 8.3.5. Vulnerability Management
- 8.3.6. Endpoint Security
- 8.3.7. Others
- 8.4. Latin America SOC as a Service Market Analysis, Opportunity and Forecast, By Offering, 2016-2032
- 8.4.1. Latin America SOC as a Service Market Analysis by Offering: Introduction
- 8.4.2. Market Size Absolute $ Opportunity Analysis and Forecast, By Offering, 2016-2032
- 8.4.3. Fully Managed Service
- 8.4.4. Co-Managed Service
- 8.5. Latin America SOC as a Service Market Analysis, Opportunity and Forecast, By Enterprise Type, 2016-2032
- 8.5.1. Latin America SOC as a Service Market Analysis by Enterprise Type: Introduction
- 8.5.2. Market Size Absolute $ Opportunity Analysis and Forecast, By Enterprise Type, 2016-2032
- 8.5.3. SMEs
- 8.5.4. Large Enterprises
- 8.6. Latin America SOC as a Service Market Analysis, Opportunity and Forecast, By Industry, 2016-2032
- 8.6.1. Latin America SOC as a Service Market Analysis by Industry: Introduction
- 8.6.2. Market Size Absolute $ Opportunity Analysis and Forecast, By Industry, 2016-2032
- 8.6.3. BFSI
- 8.6.4. IT & Telecom
- 8.6.5. Healthcare
- 8.6.6. Government & Public Sector
- 8.6.7. Retail & E-commerce
- 8.6.8. Manufacturing
- 8.6.9. Others
- 8.7. Latin America SOC as a Service Market Analysis, Opportunity and Forecast, By Country , 2016-2032
- 8.7.1. Latin America SOC as a Service Market Analysis by Country : Introduction
- 8.7.2. Market Size Absolute $ Opportunity Analysis and Forecast, Country , 2016-2032
- 8.7.2.1. Brazil
- 8.7.2.2. Colombia
- 8.7.2.3. Chile
- 8.7.2.4. Argentina
- 8.7.2.5. Costa Rica
- 8.7.2.6. Rest of Latin America
- 9. Middle East & Africa SOC as a Service Market Analysis, Opportunity and Forecast, 2016-2032
- 9.1. Middle East & Africa SOC as a Service Market Analysis, 2016-2021
- 9.2. Middle East & Africa SOC as a Service Market Opportunity and Forecast, 2023-2032
- 9.3. Middle East & Africa SOC as a Service Market Analysis, Opportunity and Forecast, By Service, 2016-2032
- 9.3.1. Middle East & Africa SOC as a Service Market Analysis by Service: Introduction
- 9.3.2. Market Size Absolute $ Opportunity Analysis and Forecast, By Service, 2016-2032
- 9.3.3. Security Information and Event Management (SIEM)
- 9.3.4. Intrusion Detection and Prevention Systems (IDPS)
- 9.3.5. Vulnerability Management
- 9.3.6. Endpoint Security
- 9.3.7. Others
- 9.4. Middle East & Africa SOC as a Service Market Analysis, Opportunity and Forecast, By Offering, 2016-2032
- 9.4.1. Middle East & Africa SOC as a Service Market Analysis by Offering: Introduction
- 9.4.2. Market Size Absolute $ Opportunity Analysis and Forecast, By Offering, 2016-2032
- 9.4.3. Fully Managed Service
- 9.4.4. Co-Managed Service
- 9.5. Middle East & Africa SOC as a Service Market Analysis, Opportunity and Forecast, By Enterprise Type, 2016-2032
- 9.5.1. Middle East & Africa SOC as a Service Market Analysis by Enterprise Type: Introduction
- 9.5.2. Market Size Absolute $ Opportunity Analysis and Forecast, By Enterprise Type, 2016-2032
- 9.5.3. SMEs
- 9.5.4. Large Enterprises
- 9.6. Middle East & Africa SOC as a Service Market Analysis, Opportunity and Forecast, By Industry, 2016-2032
- 9.6.1. Middle East & Africa SOC as a Service Market Analysis by Industry: Introduction
- 9.6.2. Market Size Absolute $ Opportunity Analysis and Forecast, By Industry, 2016-2032
- 9.6.3. BFSI
- 9.6.4. IT & Telecom
- 9.6.5. Healthcare
- 9.6.6. Government & Public Sector
- 9.6.7. Retail & E-commerce
- 9.6.8. Manufacturing
- 9.6.9. Others
- 9.7. Middle East & Africa SOC as a Service Market Analysis, Opportunity and Forecast, By Country , 2016-2032
- 9.7.1. Middle East & Africa SOC as a Service Market Analysis by Country : Introduction
- 9.7.2. Market Size Absolute $ Opportunity Analysis and Forecast, Country , 2016-2032
- 9.7.2.1. Algeria
- 9.7.2.2. Egypt
- 9.7.2.3. Israel
- 9.7.2.4. Kuwait
- 9.7.2.5. Nigeria
- 9.7.2.6. Saudi Arabia
- 9.7.2.7. South Africa
- 9.7.2.8. Turkey
- 9.7.2.9. The UAE
- 9.7.2.10. Rest of MEA
- 10. Global SOC as a Service Market Analysis, Opportunity and Forecast, By Region , 2016-2032
- 10.1. Global SOC as a Service Market Analysis by Region : Introduction
- 10.2. Market Size Absolute $ Opportunity Analysis and Forecast, By Region , 2016-2032
- 10.2.1. North America
- 10.2.2. Western Europe
- 10.2.3. Eastern Europe
- 10.2.4. APAC
- 10.2.5. Latin America
- 10.2.6. Middle East & Africa
- 11. Global SOC as a Service Market Competitive Landscape, Market Share Analysis, and Company Profiles
- 11.1. Market Share Analysis
- 11.2. Company Profiles
- 11.3. AlienVault
- 11.3.1. Company Overview
- 11.3.2. Financial Highlights
- 11.3.3. Product Portfolio
- 11.3.4. SWOT Analysis
- 11.3.5. Key Strategies and Developments
- 11.4. BlackStratus
- 11.4.1. Company Overview
- 11.4.2. Financial Highlights
- 11.4.3. Product Portfolio
- 11.4.4. SWOT Analysis
- 11.4.5. Key Strategies and Developments
- 11.5. Cygilant
- 11.5.1. Company Overview
- 11.5.2. Financial Highlights
- 11.5.3. Product Portfolio
- 11.5.4. SWOT Analysis
- 11.5.5. Key Strategies and Developments
- 11.6. Thales E-security
- 11.6.1. Company Overview
- 11.6.2. Financial Highlights
- 11.6.3. Product Portfolio
- 11.6.4. SWOT Analysis
- 11.6.5. Key Strategies and Developments
- 11.7. Proficio
- 11.7.1. Company Overview
- 11.7.2. Financial Highlights
- 11.7.3. Product Portfolio
- 11.7.4. SWOT Analysis
- 11.7.5. Key Strategies and Developments
- 11.8. Netmagic
- 11.8.1. Company Overview
- 11.8.2. Financial Highlights
- 11.8.3. Product Portfolio
- 11.8.4. SWOT Analysis
- 11.8.5. Key Strategies and Developments
- 11.9. AqmTechnologies
- 11.9.1. Company Overview
- 11.9.2. Financial Highlights
- 11.9.3. Product Portfolio
- 11.9.4. SWOT Analysis
- 11.9.5. Key Strategies and Developments
- 11.10. ESDS Software Solution
- 11.10.1. Company Overview
- 11.10.2. Financial Highlights
- 11.10.3. Product Portfolio
- 11.10.4. SWOT Analysis
- 11.10.5. Key Strategies and Developments
- 11.11. Suma Soft
- 11.11.1. Company Overview
- 11.11.2. Financial Highlights
- 11.11.3. Product Portfolio
- 11.11.4. SWOT Analysis
- 11.11.5. Key Strategies and Developments
- 11.12. GA Systems
- 11.12.1. Company Overview
- 11.12.2. Financial Highlights
- 11.12.3. Product Portfolio
- 11.12.4. SWOT Analysis
- 11.12.5. Key Strategies and Developments
- 11.13.1. Company Overview
- 11.13.2. Financial Highlights
- 11.13.3. Product Portfolio
- 11.13.4. SWOT Analysis
- 11.13.5. Key Strategies and Developments
- 11.14. Alert Logic
- 11.14.1. Company Overview
- 11.14.2. Financial Highlights
- 11.14.3. Product Portfolio
- 11.14.4. SWOT Analysis
- 11.14.5. Key Strategies and Developments
- 11.15. Radar Cyber Security
- 11.15.1. Company Overview
- 11.15.2. Financial Highlights
- 11.15.3. Product Portfolio
- 11.15.4. SWOT Analysis
- 11.15.5. Key Strategies and Developments
- 11.16. Stratozen
- 11.16.1. Company Overview
- 11.16.2. Financial Highlights
- 11.16.3. Product Portfolio
- 11.16.4. SWOT Analysis
- 11.16.5. Key Strategies and Developments
- 11.17. Fortinet
- 11.17.1. Company Overview
- 11.17.2. Financial Highlights
- 11.17.3. Product Portfolio
- 11.17.4. SWOT Analysis
- 11.17.5. Key Strategies and Developments
- 11.18. Arctic Wolf Networks
- 11.18.1. Company Overview
- 11.18.2. Financial Highlights
- 11.18.3. Product Portfolio
- 11.18.4. SWOT Analysis
- 11.18.5. Key Strategies and Developments
- 11.19. Binary Defense
- 11.19.1. Company Overview
- 11.19.2. Financial Highlights
- 11.19.3. Product Portfolio
- 11.19.4. SWOT Analysis
- 11.19.5. Key Strategies and Developments
- 11.20. Fortinet Inc
- 11.20.1. Company Overview
- 11.20.2. Financial Highlights
- 11.20.3. Product Portfolio
- 11.20.4. SWOT Analysis
- 11.20.5. Key Strategies and Developments
- 11.21. Atos SE
- 11.21.1. Company Overview
- 11.21.2. Financial Highlights
- 11.21.3. Product Portfolio
- 11.21.4. SWOT Analysis
- 11.21.5. Key Strategies and Developments
- 11.22. NTT Data Corp
- 11.22.1. Company Overview
- 11.22.2. Financial Highlights
- 11.22.3. Product Portfolio
- 11.22.4. SWOT Analysis
- 11.22.5. Key Strategies and Developments
- 12. Assumptions and Acronyms
- 13. Research Methodology
- 14. Contact
"
- List of Figures
- "
- Figure 1: Global SOC as a Service Market Revenue (US$ Mn) Market Share by Service in 2022
- Figure 2: Global SOC as a Service Market Market Attractiveness Analysis by Service, 2016-2032
- Figure 3: Global SOC as a Service Market Revenue (US$ Mn) Market Share by Offeringin 2022
- Figure 4: Global SOC as a Service Market Market Attractiveness Analysis by Offering, 2016-2032
- Figure 5: Global SOC as a Service Market Revenue (US$ Mn) Market Share by Enterprise Typein 2022
- Figure 6: Global SOC as a Service Market Market Attractiveness Analysis by Enterprise Type, 2016-2032
- Figure 7: Global SOC as a Service Market Revenue (US$ Mn) Market Share by Industryin 2022
- Figure 8: Global SOC as a Service Market Market Attractiveness Analysis by Industry, 2016-2032
- Figure 9: Global SOC as a Service Market Revenue (US$ Mn) Market Share by Region in 2022
- Figure 10: Global SOC as a Service Market Market Attractiveness Analysis by Region, 2016-2032
- Figure 11: Global SOC as a Service Market Market Revenue (US$ Mn) (2016-2032)
- Figure 12: Global SOC as a Service Market Market Revenue (US$ Mn) Comparison by Region (2016-2032)
- Figure 13: Global SOC as a Service Market Market Revenue (US$ Mn) Comparison by Service (2016-2032)
- Figure 14: Global SOC as a Service Market Market Revenue (US$ Mn) Comparison by Offering (2016-2032)
- Figure 15: Global SOC as a Service Market Market Revenue (US$ Mn) Comparison by Enterprise Type (2016-2032)
- Figure 16: Global SOC as a Service Market Market Revenue (US$ Mn) Comparison by Industry (2016-2032)
- Figure 17: Global SOC as a Service Market Market Y-o-Y Growth Rate Comparison by Region (2016-2032)
- Figure 18: Global SOC as a Service Market Market Y-o-Y Growth Rate Comparison by Service (2016-2032)
- Figure 19: Global SOC as a Service Market Market Y-o-Y Growth Rate Comparison by Offering (2016-2032)
- Figure 20: Global SOC as a Service Market Market Y-o-Y Growth Rate Comparison by Enterprise Type (2016-2032)
- Figure 21: Global SOC as a Service Market Market Y-o-Y Growth Rate Comparison by Industry (2016-2032)
- Figure 22: Global SOC as a Service Market Market Share Comparison by Region (2016-2032)
- Figure 23: Global SOC as a Service Market Market Share Comparison by Service (2016-2032)
- Figure 24: Global SOC as a Service Market Market Share Comparison by Offering (2016-2032)
- Figure 25: Global SOC as a Service Market Market Share Comparison by Enterprise Type (2016-2032)
- Figure 26: Global SOC as a Service Market Market Share Comparison by Industry (2016-2032)
- Figure 27: North America SOC as a Service Market Revenue (US$ Mn) Market Share by Servicein 2022
- Figure 28: North America SOC as a Service Market Market Attractiveness Analysis by Service, 2016-2032
- Figure 29: North America SOC as a Service Market Revenue (US$ Mn) Market Share by Offeringin 2022
- Figure 30: North America SOC as a Service Market Market Attractiveness Analysis by Offering, 2016-2032
- Figure 31: North America SOC as a Service Market Revenue (US$ Mn) Market Share by Enterprise Typein 2022
- Figure 32: North America SOC as a Service Market Market Attractiveness Analysis by Enterprise Type, 2016-2032
- Figure 33: North America SOC as a Service Market Revenue (US$ Mn) Market Share by Industryin 2022
- Figure 34: North America SOC as a Service Market Market Attractiveness Analysis by Industry, 2016-2032
- Figure 35: North America SOC as a Service Market Revenue (US$ Mn) Market Share by Country in 2022
- Figure 36: North America SOC as a Service Market Market Attractiveness Analysis by Country, 2016-2032
- Figure 37: North America SOC as a Service Market Market Revenue (US$ Mn) (2016-2032)
- Figure 38: North America SOC as a Service Market Market Revenue (US$ Mn) Comparison by Country (2016-2032)
- Figure 39: North America SOC as a Service Market Market Revenue (US$ Mn) Comparison by Service (2016-2032)
- Figure 40: North America SOC as a Service Market Market Revenue (US$ Mn) Comparison by Offering (2016-2032)
- Figure 41: North America SOC as a Service Market Market Revenue (US$ Mn) Comparison by Enterprise Type (2016-2032)
- Figure 42: North America SOC as a Service Market Market Revenue (US$ Mn) Comparison by Industry (2016-2032)
- Figure 43: North America SOC as a Service Market Market Y-o-Y Growth Rate Comparison by Country (2016-2032)
- Figure 44: North America SOC as a Service Market Market Y-o-Y Growth Rate Comparison by Service (2016-2032)
- Figure 45: North America SOC as a Service Market Market Y-o-Y Growth Rate Comparison by Offering (2016-2032)
- Figure 46: North America SOC as a Service Market Market Y-o-Y Growth Rate Comparison by Enterprise Type (2016-2032)
- Figure 47: North America SOC as a Service Market Market Y-o-Y Growth Rate Comparison by Industry (2016-2032)
- Figure 48: North America SOC as a Service Market Market Share Comparison by Country (2016-2032)
- Figure 49: North America SOC as a Service Market Market Share Comparison by Service (2016-2032)
- Figure 50: North America SOC as a Service Market Market Share Comparison by Offering (2016-2032)
- Figure 51: North America SOC as a Service Market Market Share Comparison by Enterprise Type (2016-2032)
- Figure 52: North America SOC as a Service Market Market Share Comparison by Industry (2016-2032)
- Figure 53: Western Europe SOC as a Service Market Revenue (US$ Mn) Market Share by Servicein 2022
- Figure 54: Western Europe SOC as a Service Market Market Attractiveness Analysis by Service, 2016-2032
- Figure 55: Western Europe SOC as a Service Market Revenue (US$ Mn) Market Share by Offeringin 2022
- Figure 56: Western Europe SOC as a Service Market Market Attractiveness Analysis by Offering, 2016-2032
- Figure 57: Western Europe SOC as a Service Market Revenue (US$ Mn) Market Share by Enterprise Typein 2022
- Figure 58: Western Europe SOC as a Service Market Market Attractiveness Analysis by Enterprise Type, 2016-2032
- Figure 59: Western Europe SOC as a Service Market Revenue (US$ Mn) Market Share by Industryin 2022
- Figure 60: Western Europe SOC as a Service Market Market Attractiveness Analysis by Industry, 2016-2032
- Figure 61: Western Europe SOC as a Service Market Revenue (US$ Mn) Market Share by Country in 2022
- Figure 62: Western Europe SOC as a Service Market Market Attractiveness Analysis by Country, 2016-2032
- Figure 63: Western Europe SOC as a Service Market Market Revenue (US$ Mn) (2016-2032)
- Figure 64: Western Europe SOC as a Service Market Market Revenue (US$ Mn) Comparison by Country (2016-2032)
- Figure 65: Western Europe SOC as a Service Market Market Revenue (US$ Mn) Comparison by Service (2016-2032)
- Figure 66: Western Europe SOC as a Service Market Market Revenue (US$ Mn) Comparison by Offering (2016-2032)
- Figure 67: Western Europe SOC as a Service Market Market Revenue (US$ Mn) Comparison by Enterprise Type (2016-2032)
- Figure 68: Western Europe SOC as a Service Market Market Revenue (US$ Mn) Comparison by Industry (2016-2032)
- Figure 69: Western Europe SOC as a Service Market Market Y-o-Y Growth Rate Comparison by Country (2016-2032)
- Figure 70: Western Europe SOC as a Service Market Market Y-o-Y Growth Rate Comparison by Service (2016-2032)
- Figure 71: Western Europe SOC as a Service Market Market Y-o-Y Growth Rate Comparison by Offering (2016-2032)
- Figure 72: Western Europe SOC as a Service Market Market Y-o-Y Growth Rate Comparison by Enterprise Type (2016-2032)
- Figure 73: Western Europe SOC as a Service Market Market Y-o-Y Growth Rate Comparison by Industry (2016-2032)
- Figure 74: Western Europe SOC as a Service Market Market Share Comparison by Country (2016-2032)
- Figure 75: Western Europe SOC as a Service Market Market Share Comparison by Service (2016-2032)
- Figure 76: Western Europe SOC as a Service Market Market Share Comparison by Offering (2016-2032)
- Figure 77: Western Europe SOC as a Service Market Market Share Comparison by Enterprise Type (2016-2032)
- Figure 78: Western Europe SOC as a Service Market Market Share Comparison by Industry (2016-2032)
- Figure 79: Eastern Europe SOC as a Service Market Revenue (US$ Mn) Market Share by Servicein 2022
- Figure 80: Eastern Europe SOC as a Service Market Market Attractiveness Analysis by Service, 2016-2032
- Figure 81: Eastern Europe SOC as a Service Market Revenue (US$ Mn) Market Share by Offeringin 2022
- Figure 82: Eastern Europe SOC as a Service Market Market Attractiveness Analysis by Offering, 2016-2032
- Figure 83: Eastern Europe SOC as a Service Market Revenue (US$ Mn) Market Share by Enterprise Typein 2022
- Figure 84: Eastern Europe SOC as a Service Market Market Attractiveness Analysis by Enterprise Type, 2016-2032
- Figure 85: Eastern Europe SOC as a Service Market Revenue (US$ Mn) Market Share by Industryin 2022
- Figure 86: Eastern Europe SOC as a Service Market Market Attractiveness Analysis by Industry, 2016-2032
- Figure 87: Eastern Europe SOC as a Service Market Revenue (US$ Mn) Market Share by Country in 2022
- Figure 88: Eastern Europe SOC as a Service Market Market Attractiveness Analysis by Country, 2016-2032
- Figure 89: Eastern Europe SOC as a Service Market Market Revenue (US$ Mn) (2016-2032)
- Figure 90: Eastern Europe SOC as a Service Market Market Revenue (US$ Mn) Comparison by Country (2016-2032)
- Figure 91: Eastern Europe SOC as a Service Market Market Revenue (US$ Mn) Comparison by Service (2016-2032)
- Figure 92: Eastern Europe SOC as a Service Market Market Revenue (US$ Mn) Comparison by Offering (2016-2032)
- Figure 93: Eastern Europe SOC as a Service Market Market Revenue (US$ Mn) Comparison by Enterprise Type (2016-2032)
- Figure 94: Eastern Europe SOC as a Service Market Market Revenue (US$ Mn) Comparison by Industry (2016-2032)
- Figure 95: Eastern Europe SOC as a Service Market Market Y-o-Y Growth Rate Comparison by Country (2016-2032)
- Figure 96: Eastern Europe SOC as a Service Market Market Y-o-Y Growth Rate Comparison by Service (2016-2032)
- Figure 97: Eastern Europe SOC as a Service Market Market Y-o-Y Growth Rate Comparison by Offering (2016-2032)
- Figure 98: Eastern Europe SOC as a Service Market Market Y-o-Y Growth Rate Comparison by Enterprise Type (2016-2032)
- Figure 99: Eastern Europe SOC as a Service Market Market Y-o-Y Growth Rate Comparison by Industry (2016-2032)
- Figure 100: Eastern Europe SOC as a Service Market Market Share Comparison by Country (2016-2032)
- Figure 101: Eastern Europe SOC as a Service Market Market Share Comparison by Service (2016-2032)
- Figure 102: Eastern Europe SOC as a Service Market Market Share Comparison by Offering (2016-2032)
- Figure 103: Eastern Europe SOC as a Service Market Market Share Comparison by Enterprise Type (2016-2032)
- Figure 104: Eastern Europe SOC as a Service Market Market Share Comparison by Industry (2016-2032)
- Figure 105: APAC SOC as a Service Market Revenue (US$ Mn) Market Share by Servicein 2022
- Figure 106: APAC SOC as a Service Market Market Attractiveness Analysis by Service, 2016-2032
- Figure 107: APAC SOC as a Service Market Revenue (US$ Mn) Market Share by Offeringin 2022
- Figure 108: APAC SOC as a Service Market Market Attractiveness Analysis by Offering, 2016-2032
- Figure 109: APAC SOC as a Service Market Revenue (US$ Mn) Market Share by Enterprise Typein 2022
- Figure 110: APAC SOC as a Service Market Market Attractiveness Analysis by Enterprise Type, 2016-2032
- Figure 111: APAC SOC as a Service Market Revenue (US$ Mn) Market Share by Industryin 2022
- Figure 112: APAC SOC as a Service Market Market Attractiveness Analysis by Industry, 2016-2032
- Figure 113: APAC SOC as a Service Market Revenue (US$ Mn) Market Share by Country in 2022
- Figure 114: APAC SOC as a Service Market Market Attractiveness Analysis by Country, 2016-2032
- Figure 115: APAC SOC as a Service Market Market Revenue (US$ Mn) (2016-2032)
- Figure 116: APAC SOC as a Service Market Market Revenue (US$ Mn) Comparison by Country (2016-2032)
- Figure 117: APAC SOC as a Service Market Market Revenue (US$ Mn) Comparison by Service (2016-2032)
- Figure 118: APAC SOC as a Service Market Market Revenue (US$ Mn) Comparison by Offering (2016-2032)
- Figure 119: APAC SOC as a Service Market Market Revenue (US$ Mn) Comparison by Enterprise Type (2016-2032)
- Figure 120: APAC SOC as a Service Market Market Revenue (US$ Mn) Comparison by Industry (2016-2032)
- Figure 121: APAC SOC as a Service Market Market Y-o-Y Growth Rate Comparison by Country (2016-2032)
- Figure 122: APAC SOC as a Service Market Market Y-o-Y Growth Rate Comparison by Service (2016-2032)
- Figure 123: APAC SOC as a Service Market Market Y-o-Y Growth Rate Comparison by Offering (2016-2032)
- Figure 124: APAC SOC as a Service Market Market Y-o-Y Growth Rate Comparison by Enterprise Type (2016-2032)
- Figure 125: APAC SOC as a Service Market Market Y-o-Y Growth Rate Comparison by Industry (2016-2032)
- Figure 126: APAC SOC as a Service Market Market Share Comparison by Country (2016-2032)
- Figure 127: APAC SOC as a Service Market Market Share Comparison by Service (2016-2032)
- Figure 128: APAC SOC as a Service Market Market Share Comparison by Offering (2016-2032)
- Figure 129: APAC SOC as a Service Market Market Share Comparison by Enterprise Type (2016-2032)
- Figure 130: APAC SOC as a Service Market Market Share Comparison by Industry (2016-2032)
- Figure 131: Latin America SOC as a Service Market Revenue (US$ Mn) Market Share by Servicein 2022
- Figure 132: Latin America SOC as a Service Market Market Attractiveness Analysis by Service, 2016-2032
- Figure 133: Latin America SOC as a Service Market Revenue (US$ Mn) Market Share by Offeringin 2022
- Figure 134: Latin America SOC as a Service Market Market Attractiveness Analysis by Offering, 2016-2032
- Figure 135: Latin America SOC as a Service Market Revenue (US$ Mn) Market Share by Enterprise Typein 2022
- Figure 136: Latin America SOC as a Service Market Market Attractiveness Analysis by Enterprise Type, 2016-2032
- Figure 137: Latin America SOC as a Service Market Revenue (US$ Mn) Market Share by Industryin 2022
- Figure 138: Latin America SOC as a Service Market Market Attractiveness Analysis by Industry, 2016-2032
- Figure 139: Latin America SOC as a Service Market Revenue (US$ Mn) Market Share by Country in 2022
- Figure 140: Latin America SOC as a Service Market Market Attractiveness Analysis by Country, 2016-2032
- Figure 141: Latin America SOC as a Service Market Market Revenue (US$ Mn) (2016-2032)
- Figure 142: Latin America SOC as a Service Market Market Revenue (US$ Mn) Comparison by Country (2016-2032)
- Figure 143: Latin America SOC as a Service Market Market Revenue (US$ Mn) Comparison by Service (2016-2032)
- Figure 144: Latin America SOC as a Service Market Market Revenue (US$ Mn) Comparison by Offering (2016-2032)
- Figure 145: Latin America SOC as a Service Market Market Revenue (US$ Mn) Comparison by Enterprise Type (2016-2032)
- Figure 146: Latin America SOC as a Service Market Market Revenue (US$ Mn) Comparison by Industry (2016-2032)
- Figure 147: Latin America SOC as a Service Market Market Y-o-Y Growth Rate Comparison by Country (2016-2032)
- Figure 148: Latin America SOC as a Service Market Market Y-o-Y Growth Rate Comparison by Service (2016-2032)
- Figure 149: Latin America SOC as a Service Market Market Y-o-Y Growth Rate Comparison by Offering (2016-2032)
- Figure 150: Latin America SOC as a Service Market Market Y-o-Y Growth Rate Comparison by Enterprise Type (2016-2032)
- Figure 151: Latin America SOC as a Service Market Market Y-o-Y Growth Rate Comparison by Industry (2016-2032)
- Figure 152: Latin America SOC as a Service Market Market Share Comparison by Country (2016-2032)
- Figure 153: Latin America SOC as a Service Market Market Share Comparison by Service (2016-2032)
- Figure 154: Latin America SOC as a Service Market Market Share Comparison by Offering (2016-2032)
- Figure 155: Latin America SOC as a Service Market Market Share Comparison by Enterprise Type (2016-2032)
- Figure 156: Latin America SOC as a Service Market Market Share Comparison by Industry (2016-2032)
- Figure 157: Middle East & Africa SOC as a Service Market Revenue (US$ Mn) Market Share by Servicein 2022
- Figure 158: Middle East & Africa SOC as a Service Market Market Attractiveness Analysis by Service, 2016-2032
- Figure 159: Middle East & Africa SOC as a Service Market Revenue (US$ Mn) Market Share by Offeringin 2022
- Figure 160: Middle East & Africa SOC as a Service Market Market Attractiveness Analysis by Offering, 2016-2032
- Figure 161: Middle East & Africa SOC as a Service Market Revenue (US$ Mn) Market Share by Enterprise Typein 2022
- Figure 162: Middle East & Africa SOC as a Service Market Market Attractiveness Analysis by Enterprise Type, 2016-2032
- Figure 163: Middle East & Africa SOC as a Service Market Revenue (US$ Mn) Market Share by Industryin 2022
- Figure 164: Middle East & Africa SOC as a Service Market Market Attractiveness Analysis by Industry, 2016-2032
- Figure 165: Middle East & Africa SOC as a Service Market Revenue (US$ Mn) Market Share by Country in 2022
- Figure 166: Middle East & Africa SOC as a Service Market Market Attractiveness Analysis by Country, 2016-2032
- Figure 167: Middle East & Africa SOC as a Service Market Market Revenue (US$ Mn) (2016-2032)
- Figure 168: Middle East & Africa SOC as a Service Market Market Revenue (US$ Mn) Comparison by Country (2016-2032)
- Figure 169: Middle East & Africa SOC as a Service Market Market Revenue (US$ Mn) Comparison by Service (2016-2032)
- Figure 170: Middle East & Africa SOC as a Service Market Market Revenue (US$ Mn) Comparison by Offering (2016-2032)
- Figure 171: Middle East & Africa SOC as a Service Market Market Revenue (US$ Mn) Comparison by Enterprise Type (2016-2032)
- Figure 172: Middle East & Africa SOC as a Service Market Market Revenue (US$ Mn) Comparison by Industry (2016-2032)
- Figure 173: Middle East & Africa SOC as a Service Market Market Y-o-Y Growth Rate Comparison by Country (2016-2032)
- Figure 174: Middle East & Africa SOC as a Service Market Market Y-o-Y Growth Rate Comparison by Service (2016-2032)
- Figure 175: Middle East & Africa SOC as a Service Market Market Y-o-Y Growth Rate Comparison by Offering (2016-2032)
- Figure 176: Middle East & Africa SOC as a Service Market Market Y-o-Y Growth Rate Comparison by Enterprise Type (2016-2032)
- Figure 177: Middle East & Africa SOC as a Service Market Market Y-o-Y Growth Rate Comparison by Industry (2016-2032)
- Figure 178: Middle East & Africa SOC as a Service Market Market Share Comparison by Country (2016-2032)
- Figure 179: Middle East & Africa SOC as a Service Market Market Share Comparison by Service (2016-2032)
- Figure 180: Middle East & Africa SOC as a Service Market Market Share Comparison by Offering (2016-2032)
- Figure 181: Middle East & Africa SOC as a Service Market Market Share Comparison by Enterprise Type (2016-2032)
- Figure 182: Middle East & Africa SOC as a Service Market Market Share Comparison by Industry (2016-2032)
"
- List of Tables
- "
- Table 1: Global SOC as a Service Market Market Comparison by Service (2016-2032)
- Table 2: Global SOC as a Service Market Market Comparison by Offering (2016-2032)
- Table 3: Global SOC as a Service Market Market Comparison by Enterprise Type (2016-2032)
- Table 4: Global SOC as a Service Market Market Comparison by Industry (2016-2032)
- Table 5: Global SOC as a Service Market Revenue (US$ Mn) Comparison by Region (2016-2032)
- Table 6: Global SOC as a Service Market Market Revenue (US$ Mn) (2016-2032)
- Table 7: Global SOC as a Service Market Market Revenue (US$ Mn) Comparison by Region (2016-2032)
- Table 8: Global SOC as a Service Market Market Revenue (US$ Mn) Comparison by Service (2016-2032)
- Table 9: Global SOC as a Service Market Market Revenue (US$ Mn) Comparison by Offering (2016-2032)
- Table 10: Global SOC as a Service Market Market Revenue (US$ Mn) Comparison by Enterprise Type (2016-2032)
- Table 11: Global SOC as a Service Market Market Revenue (US$ Mn) Comparison by Industry (2016-2032)
- Table 12: Global SOC as a Service Market Market Y-o-Y Growth Rate Comparison by Region (2016-2032)
- Table 13: Global SOC as a Service Market Market Y-o-Y Growth Rate Comparison by Service (2016-2032)
- Table 14: Global SOC as a Service Market Market Y-o-Y Growth Rate Comparison by Offering (2016-2032)
- Table 15: Global SOC as a Service Market Market Y-o-Y Growth Rate Comparison by Enterprise Type (2016-2032)
- Table 16: Global SOC as a Service Market Market Y-o-Y Growth Rate Comparison by Industry (2016-2032)
- Table 17: Global SOC as a Service Market Market Share Comparison by Region (2016-2032)
- Table 18: Global SOC as a Service Market Market Share Comparison by Service (2016-2032)
- Table 19: Global SOC as a Service Market Market Share Comparison by Offering (2016-2032)
- Table 20: Global SOC as a Service Market Market Share Comparison by Enterprise Type (2016-2032)
- Table 21: Global SOC as a Service Market Market Share Comparison by Industry (2016-2032)
- Table 22: North America SOC as a Service Market Market Comparison by Offering (2016-2032)
- Table 23: North America SOC as a Service Market Market Comparison by Enterprise Type (2016-2032)
- Table 24: North America SOC as a Service Market Market Comparison by Industry (2016-2032)
- Table 25: North America SOC as a Service Market Revenue (US$ Mn) Comparison by Country (2016-2032)
- Table 26: North America SOC as a Service Market Market Revenue (US$ Mn) (2016-2032)
- Table 27: North America SOC as a Service Market Market Revenue (US$ Mn) Comparison by Country (2016-2032)
- Table 28: North America SOC as a Service Market Market Revenue (US$ Mn) Comparison by Service (2016-2032)
- Table 29: North America SOC as a Service Market Market Revenue (US$ Mn) Comparison by Offering (2016-2032)
- Table 30: North America SOC as a Service Market Market Revenue (US$ Mn) Comparison by Enterprise Type (2016-2032)
- Table 31: North America SOC as a Service Market Market Revenue (US$ Mn) Comparison by Industry (2016-2032)
- Table 32: North America SOC as a Service Market Market Y-o-Y Growth Rate Comparison by Country (2016-2032)
- Table 33: North America SOC as a Service Market Market Y-o-Y Growth Rate Comparison by Service (2016-2032)
- Table 34: North America SOC as a Service Market Market Y-o-Y Growth Rate Comparison by Offering (2016-2032)
- Table 35: North America SOC as a Service Market Market Y-o-Y Growth Rate Comparison by Enterprise Type (2016-2032)
- Table 36: North America SOC as a Service Market Market Y-o-Y Growth Rate Comparison by Industry (2016-2032)
- Table 37: North America SOC as a Service Market Market Share Comparison by Country (2016-2032)
- Table 38: North America SOC as a Service Market Market Share Comparison by Service (2016-2032)
- Table 39: North America SOC as a Service Market Market Share Comparison by Offering (2016-2032)
- Table 40: North America SOC as a Service Market Market Share Comparison by Enterprise Type (2016-2032)
- Table 41: North America SOC as a Service Market Market Share Comparison by Industry (2016-2032)
- Table 42: Western Europe SOC as a Service Market Market Comparison by Service (2016-2032)
- Table 43: Western Europe SOC as a Service Market Market Comparison by Offering (2016-2032)
- Table 44: Western Europe SOC as a Service Market Market Comparison by Enterprise Type (2016-2032)
- Table 45: Western Europe SOC as a Service Market Market Comparison by Industry (2016-2032)
- Table 46: Western Europe SOC as a Service Market Revenue (US$ Mn) Comparison by Country (2016-2032)
- Table 47: Western Europe SOC as a Service Market Market Revenue (US$ Mn) (2016-2032)
- Table 48: Western Europe SOC as a Service Market Market Revenue (US$ Mn) Comparison by Country (2016-2032)
- Table 49: Western Europe SOC as a Service Market Market Revenue (US$ Mn) Comparison by Service (2016-2032)
- Table 50: Western Europe SOC as a Service Market Market Revenue (US$ Mn) Comparison by Offering (2016-2032)
- Table 51: Western Europe SOC as a Service Market Market Revenue (US$ Mn) Comparison by Enterprise Type (2016-2032)
- Table 52: Western Europe SOC as a Service Market Market Revenue (US$ Mn) Comparison by Industry (2016-2032)
- Table 53: Western Europe SOC as a Service Market Market Y-o-Y Growth Rate Comparison by Country (2016-2032)
- Table 54: Western Europe SOC as a Service Market Market Y-o-Y Growth Rate Comparison by Service (2016-2032)
- Table 55: Western Europe SOC as a Service Market Market Y-o-Y Growth Rate Comparison by Offering (2016-2032)
- Table 56: Western Europe SOC as a Service Market Market Y-o-Y Growth Rate Comparison by Enterprise Type (2016-2032)
- Table 57: Western Europe SOC as a Service Market Market Y-o-Y Growth Rate Comparison by Industry (2016-2032)
- Table 58: Western Europe SOC as a Service Market Market Share Comparison by Country (2016-2032)
- Table 59: Western Europe SOC as a Service Market Market Share Comparison by Service (2016-2032)
- Table 60: Western Europe SOC as a Service Market Market Share Comparison by Offering (2016-2032)
- Table 61: Western Europe SOC as a Service Market Market Share Comparison by Enterprise Type (2016-2032)
- Table 62: Western Europe SOC as a Service Market Market Share Comparison by Industry (2016-2032)
- Table 63: Eastern Europe SOC as a Service Market Market Comparison by Service (2016-2032)
- Table 64: Eastern Europe SOC as a Service Market Market Comparison by Offering (2016-2032)
- Table 65: Eastern Europe SOC as a Service Market Market Comparison by Enterprise Type (2016-2032)
- Table 66: Eastern Europe SOC as a Service Market Market Comparison by Industry (2016-2032)
- Table 67: Eastern Europe SOC as a Service Market Revenue (US$ Mn) Comparison by Country (2016-2032)
- Table 68: Eastern Europe SOC as a Service Market Market Revenue (US$ Mn) (2016-2032)
- Table 69: Eastern Europe SOC as a Service Market Market Revenue (US$ Mn) Comparison by Country (2016-2032)
- Table 70: Eastern Europe SOC as a Service Market Market Revenue (US$ Mn) Comparison by Service (2016-2032)
- Table 71: Eastern Europe SOC as a Service Market Market Revenue (US$ Mn) Comparison by Offering (2016-2032)
- Table 72: Eastern Europe SOC as a Service Market Market Revenue (US$ Mn) Comparison by Enterprise Type (2016-2032)
- Table 73: Eastern Europe SOC as a Service Market Market Revenue (US$ Mn) Comparison by Industry (2016-2032)
- Table 74: Eastern Europe SOC as a Service Market Market Y-o-Y Growth Rate Comparison by Country (2016-2032)
- Table 75: Eastern Europe SOC as a Service Market Market Y-o-Y Growth Rate Comparison by Service (2016-2032)
- Table 76: Eastern Europe SOC as a Service Market Market Y-o-Y Growth Rate Comparison by Offering (2016-2032)
- Table 77: Eastern Europe SOC as a Service Market Market Y-o-Y Growth Rate Comparison by Enterprise Type (2016-2032)
- Table 78: Eastern Europe SOC as a Service Market Market Y-o-Y Growth Rate Comparison by Industry (2016-2032)
- Table 79: Eastern Europe SOC as a Service Market Market Share Comparison by Country (2016-2032)
- Table 80: Eastern Europe SOC as a Service Market Market Share Comparison by Service (2016-2032)
- Table 81: Eastern Europe SOC as a Service Market Market Share Comparison by Offering (2016-2032)
- Table 82: Eastern Europe SOC as a Service Market Market Share Comparison by Enterprise Type (2016-2032)
- Table 83: Eastern Europe SOC as a Service Market Market Share Comparison by Industry (2016-2032)
- Table 84: APAC SOC as a Service Market Market Comparison by Service (2016-2032)
- Table 85: APAC SOC as a Service Market Market Comparison by Offering (2016-2032)
- Table 86: APAC SOC as a Service Market Market Comparison by Enterprise Type (2016-2032)
- Table 87: APAC SOC as a Service Market Market Comparison by Industry (2016-2032)
- Table 88: APAC SOC as a Service Market Revenue (US$ Mn) Comparison by Country (2016-2032)
- Table 89: APAC SOC as a Service Market Market Revenue (US$ Mn) (2016-2032)
- Table 90: APAC SOC as a Service Market Market Revenue (US$ Mn) Comparison by Country (2016-2032)
- Table 91: APAC SOC as a Service Market Market Revenue (US$ Mn) Comparison by Service (2016-2032)
- Table 92: APAC SOC as a Service Market Market Revenue (US$ Mn) Comparison by Offering (2016-2032)
- Table 93: APAC SOC as a Service Market Market Revenue (US$ Mn) Comparison by Enterprise Type (2016-2032)
- Table 94: APAC SOC as a Service Market Market Revenue (US$ Mn) Comparison by Industry (2016-2032)
- Table 95: APAC SOC as a Service Market Market Y-o-Y Growth Rate Comparison by Country (2016-2032)
- Table 96: APAC SOC as a Service Market Market Y-o-Y Growth Rate Comparison by Service (2016-2032)
- Table 97: APAC SOC as a Service Market Market Y-o-Y Growth Rate Comparison by Offering (2016-2032)
- Table 98: APAC SOC as a Service Market Market Y-o-Y Growth Rate Comparison by Enterprise Type (2016-2032)
- Table 99: APAC SOC as a Service Market Market Y-o-Y Growth Rate Comparison by Industry (2016-2032)
- Table 100: APAC SOC as a Service Market Market Share Comparison by Country (2016-2032)
- Table 101: APAC SOC as a Service Market Market Share Comparison by Service (2016-2032)
- Table 102: APAC SOC as a Service Market Market Share Comparison by Offering (2016-2032)
- Table 103: APAC SOC as a Service Market Market Share Comparison by Enterprise Type (2016-2032)
- Table 104: APAC SOC as a Service Market Market Share Comparison by Industry (2016-2032)
- Table 105: Latin America SOC as a Service Market Market Comparison by Service (2016-2032)
- Table 106: Latin America SOC as a Service Market Market Comparison by Offering (2016-2032)
- Table 107: Latin America SOC as a Service Market Market Comparison by Enterprise Type (2016-2032)
- Table 108: Latin America SOC as a Service Market Market Comparison by Industry (2016-2032)
- Table 109: Latin America SOC as a Service Market Revenue (US$ Mn) Comparison by Country (2016-2032)
- Table 110: Latin America SOC as a Service Market Market Revenue (US$ Mn) (2016-2032)
- Table 111: Latin America SOC as a Service Market Market Revenue (US$ Mn) Comparison by Country (2016-2032)
- Table 112: Latin America SOC as a Service Market Market Revenue (US$ Mn) Comparison by Service (2016-2032)
- Table 113: Latin America SOC as a Service Market Market Revenue (US$ Mn) Comparison by Offering (2016-2032)
- Table 114: Latin America SOC as a Service Market Market Revenue (US$ Mn) Comparison by Enterprise Type (2016-2032)
- Table 115: Latin America SOC as a Service Market Market Revenue (US$ Mn) Comparison by Industry (2016-2032)
- Table 116: Latin America SOC as a Service Market Market Y-o-Y Growth Rate Comparison by Country (2016-2032)
- Table 117: Latin America SOC as a Service Market Market Y-o-Y Growth Rate Comparison by Service (2016-2032)
- Table 118: Latin America SOC as a Service Market Market Y-o-Y Growth Rate Comparison by Offering (2016-2032)
- Table 119: Latin America SOC as a Service Market Market Y-o-Y Growth Rate Comparison by Enterprise Type (2016-2032)
- Table 120: Latin America SOC as a Service Market Market Y-o-Y Growth Rate Comparison by Industry (2016-2032)
- Table 121: Latin America SOC as a Service Market Market Share Comparison by Country (2016-2032)
- Table 122: Latin America SOC as a Service Market Market Share Comparison by Service (2016-2032)
- Table 123: Latin America SOC as a Service Market Market Share Comparison by Offering (2016-2032)
- Table 124: Latin America SOC as a Service Market Market Share Comparison by Enterprise Type (2016-2032)
- Table 125: Latin America SOC as a Service Market Market Share Comparison by Industry (2016-2032)
- Table 126: Middle East & Africa SOC as a Service Market Market Comparison by Service (2016-2032)
- Table 127: Middle East & Africa SOC as a Service Market Market Comparison by Offering (2016-2032)
- Table 128: Middle East & Africa SOC as a Service Market Market Comparison by Enterprise Type (2016-2032)
- Table 129: Middle East & Africa SOC as a Service Market Market Comparison by Industry (2016-2032)
- Table 130: Middle East & Africa SOC as a Service Market Revenue (US$ Mn) Comparison by Country (2016-2032)
- Table 131: Middle East & Africa SOC as a Service Market Market Revenue (US$ Mn) (2016-2032)
- Table 132: Middle East & Africa SOC as a Service Market Market Revenue (US$ Mn) Comparison by Country (2016-2032)
- Table 133: Middle East & Africa SOC as a Service Market Market Revenue (US$ Mn) Comparison by Service (2016-2032)
- Table 134: Middle East & Africa SOC as a Service Market Market Revenue (US$ Mn) Comparison by Offering (2016-2032)
- Table 135: Middle East & Africa SOC as a Service Market Market Revenue (US$ Mn) Comparison by Enterprise Type (2016-2032)
- Table 136: Middle East & Africa SOC as a Service Market Market Revenue (US$ Mn) Comparison by Industry (2016-2032)
- Table 137: Middle East & Africa SOC as a Service Market Market Y-o-Y Growth Rate Comparison by Country (2016-2032)
- Table 138: Middle East & Africa SOC as a Service Market Market Y-o-Y Growth Rate Comparison by Service (2016-2032)
- Table 139: Middle East & Africa SOC as a Service Market Market Y-o-Y Growth Rate Comparison by Offering (2016-2032)
- Table 140: Middle East & Africa SOC as a Service Market Market Y-o-Y Growth Rate Comparison by Enterprise Type (2016-2032)
- Table 141: Middle East & Africa SOC as a Service Market Market Y-o-Y Growth Rate Comparison by Industry (2016-2032)
- Table 142: Middle East & Africa SOC as a Service Market Market Share Comparison by Country (2016-2032)
- Table 143: Middle East & Africa SOC as a Service Market Market Share Comparison by Service (2016-2032)
- Table 144: Middle East & Africa SOC as a Service Market Market Share Comparison by Offering (2016-2032)
- Table 145: Middle East & Africa SOC as a Service Market Market Share Comparison by Enterprise Type (2016-2032)
- Table 146: Middle East & Africa SOC as a Service Market Market Share Comparison by Industry (2016-2032)
- 1. Executive Summary
-
- AlienVault
- BlackStratus
- Cygilant
- Thales E-security
- Proficio
- Netmagic
- AqmTechnologies
- ESDS Software Solution
- Suma Soft
- GA Systems
- Alert Logic
- Expel
- Radar Cyber Security
- Stratozen
- Fortinet
- Arctic Wolf Networks
- Binary Defense
- Fortinet Inc
- Atos SE
- NTT Data Corp
- Verizon Communications Inc
- AT&T Inc
- Arctic Wolf Networks Inc
- Cloudflare Inc
- ConnectWise LLC
Our Clients


View Our Licence Options
