Smart Waste Management Market By Waste Type(Solid Waste, Special Waste, E-Waste) By Source(Residential, Commercial, Industrial), By Application(Construction, Healthcare, Municipalities, Food & Retail, Colleges & Universities, Manufacturing & Industrial), By Region And Companies - Industry Segment Outlook, Market Assessment, Competition Scenario, Trends, And Forecast 2023-2032
-
9512
-
Jul 2023
-
190
-


-
This report was compiled by Correspondence Linkedin | Detailed Market research Methodology Our methodology involves a mix of primary research, including interviews with leading mental health experts, and secondary research from reputable medical journals and databases. View Detailed Methodology Page
-
Quick Navigation
Report Overview
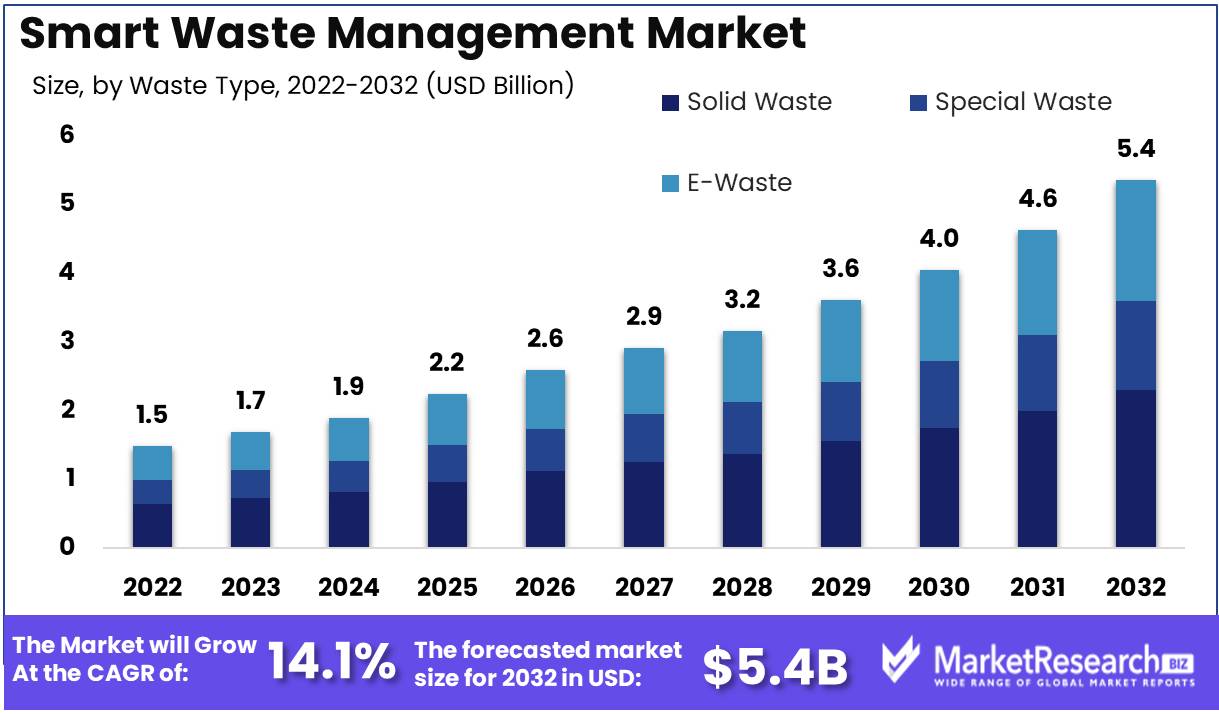
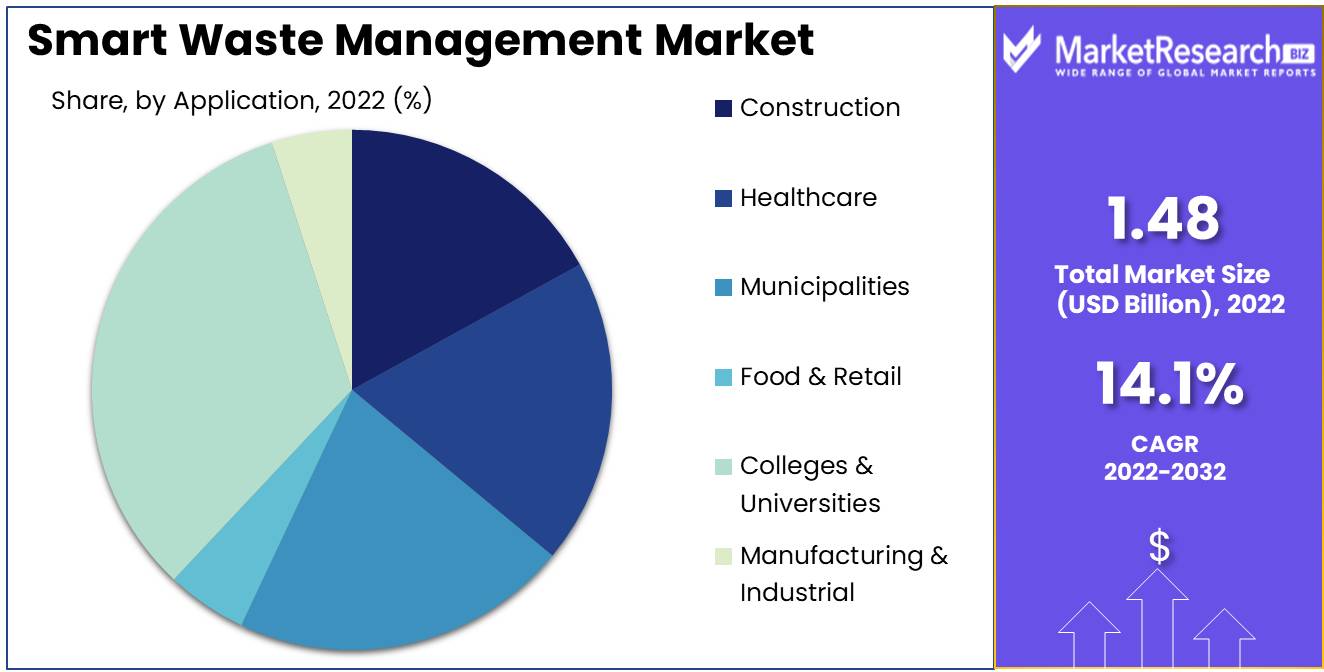
Smart Waste Management Market size is expected to be worth around USD 5.53 Bn by 2032 from USD 1.48 Bn in 2022, growing at a CAGR of 14.1% during the forecast period from 2023 to 2032.
Smart waste management is an innovative concept that aims to transform the conventional approach to waste management. This innovative concept optimizes waste management processes, increases efficiency, and promotes sustainability through the application of advanced technology and data analytics. The smart waste management market solution is expanding exponentially, driven by a variety of factors such as environmental concerns, regulatory compliance, and the need for cost-effective solutions, among others.
The report provides a thorough analysis of the market, ranging from market size, market drivers, market restraints, market trends, market opportunities, and the competitive landscape. The market is segmented by product type, solution, service, application, and geography.
Utilizing data and technology to optimize the entire waste management cycle, including waste collection, transportation, recycling, and disposal, constitutes intelligent Generative AI in Waste Management Market. It involves the incorporation of multiple cutting-edge technologies, such as sensors, Internet of Things (IoT) devices, software, and analytics, to monitor and manage waste in real time. A crucial part of smart waste management is the use of data-driven decisions to increase efficiency and sustainability.
The primary goals of smart waste management are numerous, ranging from environmental reduction and increased recycling rates to resource efficiency, mitigating environmental impacts, and improving public health and safety. Effective waste management is crucial for environmental and economic reasons, given that ineffective waste management practices can result in substantial economic losses and significant environmental damage. Consequently, smart waste management is an essential component of the solution to the global waste crisis.
Driving factors
Smart Waste Management Market on the Rise
The global smart waste management market is experiencing a remarkable expansion, and the main factor contributing to this expansion is the increasing amount of waste produced as a result of rapid urbanization and industrialization. In addition, governments and regulatory bodies have emphasized reducing waste and increasing resource efficiency, thereby fostering sustainable practices. This has increased people's cognizance of the negative environmental effects of waste on our planet, thereby contributing to the growth of the smart waste management market.
Governmental Policies Support Environmental Sustainability
Governments' initiatives and regulations aimed at reducing waste have significantly contributed to the promotion of a sustainable environment. New policies and regulations are being formulated by regulatory bodies in response to expanding environmental concerns. Governments worldwide are investing in smart waste management technologies that can transform waste into a valuable resource. Establishing recycling plants, waste-to-energy technologies, and biogas plants will ensure that waste is disposed of in an environmentally responsible manner.
Influence of New Regulations and Emerging Technologies
As governments invest in smart waste management solutions, there may be regulatory changes that have a positive impact on the market. New policies or regulations that encourage recycling and waste reduction and limit the use of landfills may have a positive impact on the market. In addition, emerging technologies like the Internet of Things (IoT) can be integrated with waste management solutions to optimize waste collection and disposal.
Restraining Factors
Absence of Efficient Connections
A lack of effective connectivity is one of the primary factors reducing the efficiency of smart waste management systems. Intelligent waste management systems significantly rely on Internet of Things (IoT) devices, sensors, and other advanced technologies. All of these devices must communicate with one another and with the central system for proper operation. Poor connectivity, on the other hand, can result in data transmission delays, loss of information, and system efficiency.
To overcome this issue, companies can adopt mesh networking, a form of IoT connectivity that enables IoT devices to connect directly with one another, thereby establishing a robust network with no single point of failure. Mesh networks can manage large amounts of data, are scalable, and provide dependable connectivity even in remote locations with feeble network signals.
Lack of knowledge about intelligent waste and recycling systems
A lack of awareness among end-users is another obstacle for smart waste management systems. Numerous individuals are unaware of the benefits that smart waste management systems offer, such as reduced waste in landfills, fewer carbon emissions, and enhanced public health. As a consequence, they are averse to investing time or money in such systems, reducing their rates of adoption.
Through public education, outreach programs, and social media campaigns, organizations can raise awareness about the benefits of smart waste management systems to address this issue. To encourage end-users to adopt these systems, businesses can also offer them discounts on their waste disposal fees and other rewards for recycling.
Waste Type Analysis
The primary segments of the smart waste management market are solid waste, smart waste collection, residential, and colleges and universities. However, the solid waste segment dominates the smart waste management market, holding the greatest market share.
The economic development in emerging economies is a significant factor in the growth of the solid waste segment of the smart waste management market. Increasing urbanization rates and population growth in emergent economies have resulted in a surge in the amount of waste produced. To combat the growing amount of waste being produced, these nations are implementing smart waste management solutions.
In addition, urbanization has led to the development of smart cities that make use of smart waste management technologies to manage waste more efficiently. This is a significant factor propelling the growth of the smart waste management market in developing economies.
Source Analysis
The residential segment is another crucial segment of the smart waste management market. It accounts for a significant share of the market and is anticipated to grow rapidly over the next few years.
The growth of the residential segment of the smart waste management market is driven by the economic development of emerging economies. Increasing urbanization rates and population growth have resulted in a surge in the amount of waste produced, making smart waste management solutions, including in residential areas, necessary.
In addition, the development of smart residences has led to the adoption of smart waste management solutions for more efficient waste management. This is a significant growth driver for the residential segment of the smart waste management market.
Application Analysis
The segment of colleges and universities is another significant segment of the smart waste management market. It accounts for a significant share of the market and is anticipated to grow rapidly over the next few years.
Similar to other segments, the growth of the colleges and universities segment of the smart waste management market is driven by the economic development of emerging economies. The growing number of colleges and universities in developing economies has led to a surge in the amount of waste produced, making smart waste management imperative.
The development of smart campuses has led to the adoption of smart waste management solutions for more efficient waste management. This is a significant growth driver for the colleges and universities segment of the smart waste management market.
Key Market Segments
Segmentation by Waste Type
- Solid Waste
- Special Waste
- E-Waste
Segmentation by Source
- Residential
- Commercial
- Industrial
Segmentation by Application
- Construction
- Healthcare
- Municipalities
- Food & Retail
- Colleges & Universities
- Manufacturing & Industrial
Growth Opportunity
Raising the Awareness of Individuals
As environmental awareness increases, people are becoming more cognizant of their impact on the environment. They are accountable for the proper disposal of their waste. Various educational campaigns and government initiatives have emphasized the significance of effective waste management. People are more inclined to pay for eco-friendly solutions like smart waste management due to growing climate change concerns.
Increasing Adoption of Intelligent City Initiatives
Global urbanization has led to the emergence of numerous smart cities. The concept of a smart city is to use technology to improve the lives of its occupants through the provision of efficient and effective services. Any city must have effective waste management. To optimize waste collection and disposal, smart cities incorporate sensors, IoT devices, and other innovative technologies. This has led to a substantial reduction in the time, money, and energy required for waste management.
Government funding increases for environmental sustainability
Global governments are investing in environmental sustainability initiatives, such as waste management. They are providing companies and individuals with incentives to employ environmentally responsible solutions. This has led to an increase in demand for waste management solutions, including smart waste management. Governments are also investing in research and development to improve waste management's efficacy, effectiveness, and sustainability.
Latest Trends
Market Trends Influencing Intelligent Waste Management Solutions
As the global population continues to increase and urbanization reaches new heights, waste management challenges also become more pronounced. However, the smart waste management market is swiftly evolving, with numerous innovations aimed at addressing some of these challenges.
Enhanced Utilization of Autonomous Vehicles
The waste management industry is transitioning towards the use of autonomous vehicles to collect refuse, recycling, and organic waste from residences and businesses. These vehicles can operate autonomously, reducing the costs and hazards associated with human error and the carbon footprint of waste collection methods.
Technological advances in waste-to-energy conversion
The development of waste-to-energy technologies is a second factor shaping the smart waste management market. This process entails converting waste into energy sources that can be utilized, such as electricity, heat, and fuel. Companies are developing and investing in new technologies to guarantee that waste is treated and recycled more efficiently and sustainably.
Smart City Initiatives on the Rise
Smart cities are those that use technology and data to enhance their occupants' quality of life. Utilizing sensors, cameras, and other devices, these initiatives optimize waste collection, management, and recycling. To reduce the impact of waste on the environment, city administrators are increasingly turning to smart waste management solutions.
Regional Analysis
The global need for smart waste management is rising quickly as an industry. To streamline waste collection, transportation, and disposal operations, smart waste management makes use of cutting-edge technology, such as sensors and data analytics. In addition to helping to reduce waste, lower environmental pollution, and enhance public health, this also makes waste management more efficient.
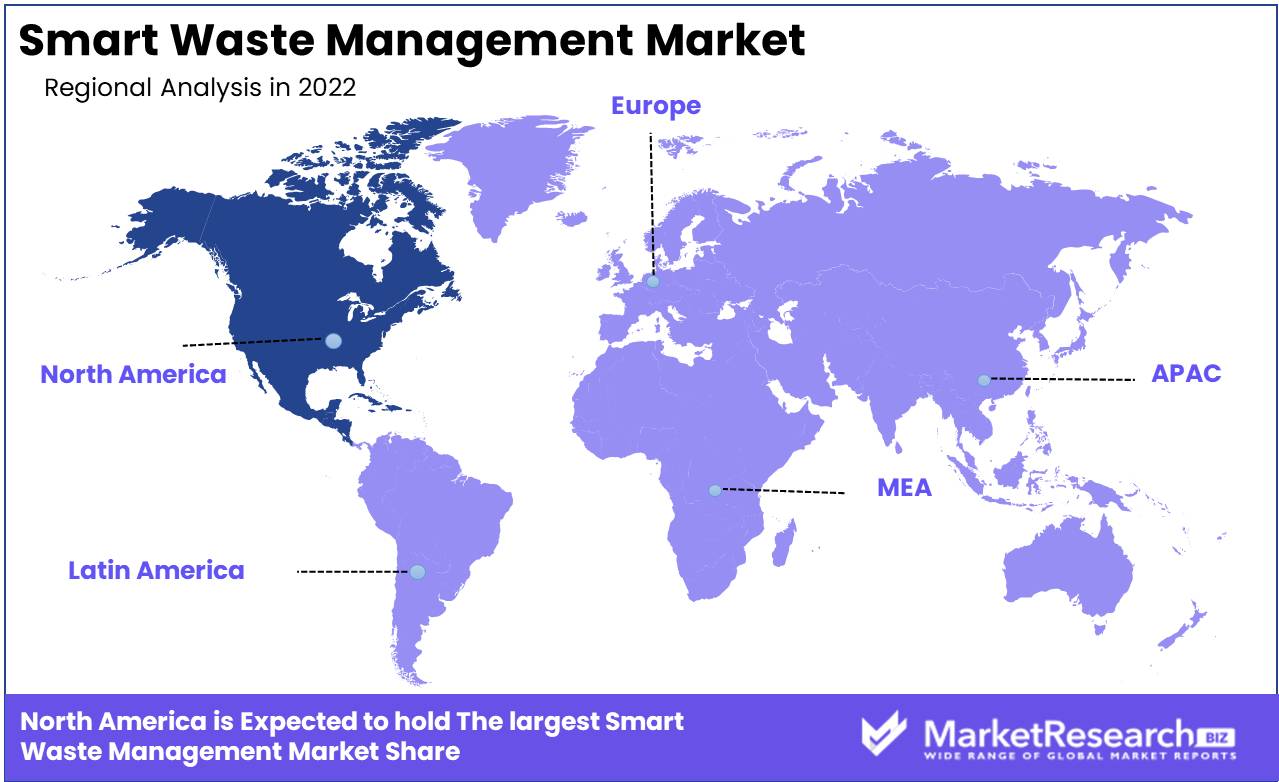
The market is now dominated by North America, even though smart waste management is being adopted in many areas of the world. In North America, the United States is the largest smart waste management market industry, and it is fostering development and innovation in the sector.
The high level of investment and government backing for the industry is one of the reasons why North America is leading the smart waste management market. To boost efficiency, reduce waste, and promote public health, governments at the federal, state, and municipal levels are investing in smart waste management infrastructure and technology.
The US Environmental Protection Agency (EPA), for instance, has launched the SmartWay program, which offers cash and technical assistance to companies that implement smart waste management methods. This program has helped to hasten the deployment of smart waste management technology across the nation.
Key Regions and Countries
North America
- US
- Canada
- Mexico
Western Europe
- Germany
- France
- The UK
- Spain
- Italy
- Portugal
- Ireland
- Austria
- Switzerland
- Benelux
- Nordic
- Rest of Western Europe
Eastern Europe
- Russia
- Poland
- The Czech Republic
- Greece
- Rest of Eastern Europe
APAC
- China
- Japan
- South Korea
- India
- Australia & New Zealand
- Indonesia
- Malaysia
- Philippines
- Singapore
- Thailand
- Vietnam
- Rest of APAC
Latin America
- Brazil
- Colombia
- Chile
- Argentina
- Costa Rica
- Rest of Latin America
Middle East & Africa
- Algeria
- Egypt
- Israel
- Kuwait
- Nigeria
- Saudi Arabia
- South Africa
- Turkey
- United Arab Emirates
- Rest of MEA
Key Players Analysis
To effectively manage waste materials, smart waste management combines cutting-edge technologies and tactics. Due to growing environmental pollution concerns and the demand for efficient waste management solutions, this market is expanding significantly. The major players in the smart waste management market are providing a wide range of cutting-edge solutions that are designed to optimize waste collection, transportation, and disposal.
The following companies are some of the top players in this market: IBM, SAP SE, Waste Management Inc., Republic Services Inc., Enevo Oy, and Covanta Holding Corporation. To create smart waste management solutions, these businesses are utilizing technologies including cloud computing, big data analytics, and the Internet of Things (IoT).
With a variety of solutions available, including the Intelligent Operations Center for Smarter Cities, which offers real-time data analytics for enhanced decision-making, IBM is one of the market's top players in smart waste management. To help businesses optimize their waste management procedures and cut costs, SAP SE offers smart waste management solutions. Smart waste management technologies have been actively invested in by the well-known waste collection and disposal business Waste Management Inc.
Top Key Players in the Smart Waste Management Market
- International Business Machines Corporation
- Waste Management, Inc.
- SAP SE
- Enevo Oy
- Smartbin
- Ecube Labs Co., Ltd.
- BigBelly Solar, Inc.
- Urbiótica, S.L.
- Pepperl+Fuchs GmbH
- WAVIoT
Recent Development
SUEZ and FDJ Group Join Forces to Improve Waste Management in the Sporting Arena
SUEZ and the FDJ Group have announced a ground-breaking partnership, a significant development for the smart waste management market. SUEZ will be the primary co-sponsor of the first French team to compete on the UCI Women's World Tour as part of a three-year agreement between the two corporations.
This intriguing new partnership was just announced and is already generating a great deal of industry chatter. Experts anticipate that it will have a significant impact on waste management practices at sporting events in general, as well as the development of the smart waste management market as a whole.
SUEZ, a prominent provider of sustainable resource management solutions, will apply its cutting-edge technology and specialized knowledge to the challenge of managing waste from sporting events. The company is recognized for its innovative and effective waste management solutions, which have been implemented at key sporting events such as the Tour de France and the Olympics.
The French betting and gaming corporation FDJ Group is a major participant in the world of cycling. The purpose of this partnership is to raise awareness about the significance of responsible waste management and recycling and to promote sustainable practices in the sporting world.
Report Scope
Report Features Description Market Value (2022) USD 1.48 Bn Forecast Revenue (2032) USD 5.53 Bn CAGR (2023-2032) 14.1% Base Year for Estimation 2022 Historic Period 2016-2022 Forecast Period 2023-2032 Report Coverage Revenue Forecast, Market Dynamics, COVID-19 Impact, Competitive Landscape, Recent Developments Segments Covered By Waste Type(Solid Waste, Special Waste, E-Waste) By Source(Residential, Commercial, Industrial), By Application(Construction, Healthcare, Municipalities, Food & Retail, Colleges & Universities, Manufacturing & Industrial) Regional Analysis North America – The US, Canada, & Mexico; Western Europe – Germany, France, The UK, Spain, Italy, Portugal, Ireland, Austria, Switzerland, Benelux, Nordic, & Rest of Western Europe; Eastern Europe – Russia, Poland, The Czech Republic, Greece, & Rest of Eastern Europe; APAC – China, Japan, South Korea, India, Australia & New Zealand, Indonesia, Malaysia, Philippines, Singapore, Thailand, Vietnam, & Rest of APAC; Latin America – Brazil, Colombia, Chile, Argentina, Costa Rica, & Rest of Latin America; Middle East & Africa – Algeria, Egypt, Israel, Kuwait, Nigeria, Saudi Arabia, South Africa, Turkey, United Arab Emirates, & Rest of MEA Competitive Landscape International Business Machines Corporation, Waste Management, Inc., SAP SE, Enevo Oy, Smartbin, Ecube Labs Co., Ltd., BigBelly Solar, Inc., Urbiótica, S.L., Pepperl+Fuchs GmbH, WAVIoT Customization Scope Customization for segments, region/country-level will be provided. Moreover, additional customization can be done based on the requirements. Purchase Options We have three licenses to opt for Single User License, Multi-User License (Up to 5 Users), Corporate Use License (Unlimited User and Printable PDF) -
- 1. Executive Summary
- 1.1. Definition
- 1.2. Taxonomy
- 1.3. Research Scope
- 1.4. Key Analysis
- 1.5. Key Findings by Major Segments
- 1.6. Top strategies by Major Players
- 2. Global Smart Waste Management Market Overview
- 2.1. Smart Waste Management Market Dynamics
- 2.1.1. Drivers
- 2.1.2. Opportunities
- 2.1.3. Restraints
- 2.1.4. Challenges
- 2.2. Macro-economic Factors
- 2.3. Regulatory Framework
- 2.4. Market Investment Feasibility Index
- 2.5. PEST Analysis
- 2.6. PORTER’S Five Force Analysis
- 2.7. Drivers & Restraints Impact Analysis
- 2.8. Industry Chain Analysis
- 2.9. Cost Structure Analysis
- 2.10. Marketing Strategy
- 2.11. Russia-Ukraine War Impact Analysis
- 2.12. Opportunity Map Analysis
- 2.13. Market Competition Scenario Analysis
- 2.14. Product Life Cycle Analysis
- 2.15. Opportunity Orbits
- 2.16. Manufacturer Intensity Map
- 2.17. Major Companies sales by Value & Volume
- 2.1. Smart Waste Management Market Dynamics
- 3. Global Smart Waste Management Market Analysis, Opportunity and Forecast, 2016-2032
- 3.1. Global Smart Waste Management Market Analysis, 2016-2021
- 3.2. Global Smart Waste Management Market Opportunity and Forecast, 2023-2032
- 3.3. Global Smart Waste Management Market Analysis, Opportunity and Forecast, By by Waste Type, 2016-2032
- 3.3.1. Global Smart Waste Management Market Analysis by by Waste Type: Introduction
- 3.3.2. Market Size Absolute $ Opportunity Analysis and Forecast, By by Waste Type, 2016-2032
- 3.3.3. Solid Waste
- 3.3.4. Special Waste
- 3.3.5. E-Waste
- 3.4. Global Smart Waste Management Market Analysis, Opportunity and Forecast, By by Source, 2016-2032
- 3.4.1. Global Smart Waste Management Market Analysis by by Source: Introduction
- 3.4.2. Market Size Absolute $ Opportunity Analysis and Forecast, By by Source, 2016-2032
- 3.4.3. Residential
- 3.4.4. Commercial
- 3.4.5. Industrial
- 3.5. Global Smart Waste Management Market Analysis, Opportunity and Forecast, By by Application, 2016-2032
- 3.5.1. Global Smart Waste Management Market Analysis by by Application: Introduction
- 3.5.2. Market Size Absolute $ Opportunity Analysis and Forecast, By by Application, 2016-2032
- 3.5.3. Construction
- 3.5.4. Healthcare
- 3.5.5. Municipalities
- 3.5.6. Food & Retail
- 3.5.7. Colleges & Universities
- 3.5.8. Manufacturing & Industrial
- 3.6. Global Smart Waste Management Market Analysis, Opportunity and Forecast, By , 2016-2032
- 3.6.1. Global Smart Waste Management Market Analysis by : Introduction
- 3.6.2. Market Size Absolute $ Opportunity Analysis and Forecast, By , 2016-2032
- 4. North America Smart Waste Management Market Analysis, Opportunity and Forecast, 2016-2032
- 4.1. North America Smart Waste Management Market Analysis, 2016-2021
- 4.2. North America Smart Waste Management Market Opportunity and Forecast, 2023-2032
- 4.3. North America Smart Waste Management Market Analysis, Opportunity and Forecast, By by Waste Type, 2016-2032
- 4.3.1. North America Smart Waste Management Market Analysis by by Waste Type: Introduction
- 4.3.2. Market Size Absolute $ Opportunity Analysis and Forecast, By by Waste Type, 2016-2032
- 4.3.3. Solid Waste
- 4.3.4. Special Waste
- 4.3.5. E-Waste
- 4.4. North America Smart Waste Management Market Analysis, Opportunity and Forecast, By by Source, 2016-2032
- 4.4.1. North America Smart Waste Management Market Analysis by by Source: Introduction
- 4.4.2. Market Size Absolute $ Opportunity Analysis and Forecast, By by Source, 2016-2032
- 4.4.3. Residential
- 4.4.4. Commercial
- 4.4.5. Industrial
- 4.5. North America Smart Waste Management Market Analysis, Opportunity and Forecast, By by Application, 2016-2032
- 4.5.1. North America Smart Waste Management Market Analysis by by Application: Introduction
- 4.5.2. Market Size Absolute $ Opportunity Analysis and Forecast, By by Application, 2016-2032
- 4.5.3. Construction
- 4.5.4. Healthcare
- 4.5.5. Municipalities
- 4.5.6. Food & Retail
- 4.5.7. Colleges & Universities
- 4.5.8. Manufacturing & Industrial
- 4.6. North America Smart Waste Management Market Analysis, Opportunity and Forecast, By , 2016-2032
- 4.6.1. North America Smart Waste Management Market Analysis by : Introduction
- 4.6.2. Market Size Absolute $ Opportunity Analysis and Forecast, By , 2016-2032
- 4.7. North America Smart Waste Management Market Analysis, Opportunity and Forecast, By Country , 2016-2032
- 4.7.1. North America Smart Waste Management Market Analysis by Country : Introduction
- 4.7.2. Market Size Absolute $ Opportunity Analysis and Forecast, Country , 2016-2032
- 4.7.2.1. The US
- 4.7.2.2. Canada
- 4.7.2.3. Mexico
- 5. Western Europe Smart Waste Management Market Analysis, Opportunity and Forecast, 2016-2032
- 5.1. Western Europe Smart Waste Management Market Analysis, 2016-2021
- 5.2. Western Europe Smart Waste Management Market Opportunity and Forecast, 2023-2032
- 5.3. Western Europe Smart Waste Management Market Analysis, Opportunity and Forecast, By by Waste Type, 2016-2032
- 5.3.1. Western Europe Smart Waste Management Market Analysis by by Waste Type: Introduction
- 5.3.2. Market Size Absolute $ Opportunity Analysis and Forecast, By by Waste Type, 2016-2032
- 5.3.3. Solid Waste
- 5.3.4. Special Waste
- 5.3.5. E-Waste
- 5.4. Western Europe Smart Waste Management Market Analysis, Opportunity and Forecast, By by Source, 2016-2032
- 5.4.1. Western Europe Smart Waste Management Market Analysis by by Source: Introduction
- 5.4.2. Market Size Absolute $ Opportunity Analysis and Forecast, By by Source, 2016-2032
- 5.4.3. Residential
- 5.4.4. Commercial
- 5.4.5. Industrial
- 5.5. Western Europe Smart Waste Management Market Analysis, Opportunity and Forecast, By by Application, 2016-2032
- 5.5.1. Western Europe Smart Waste Management Market Analysis by by Application: Introduction
- 5.5.2. Market Size Absolute $ Opportunity Analysis and Forecast, By by Application, 2016-2032
- 5.5.3. Construction
- 5.5.4. Healthcare
- 5.5.5. Municipalities
- 5.5.6. Food & Retail
- 5.5.7. Colleges & Universities
- 5.5.8. Manufacturing & Industrial
- 5.6. Western Europe Smart Waste Management Market Analysis, Opportunity and Forecast, By , 2016-2032
- 5.6.1. Western Europe Smart Waste Management Market Analysis by : Introduction
- 5.6.2. Market Size Absolute $ Opportunity Analysis and Forecast, By , 2016-2032
- 5.7. Western Europe Smart Waste Management Market Analysis, Opportunity and Forecast, By Country , 2016-2032
- 5.7.1. Western Europe Smart Waste Management Market Analysis by Country : Introduction
- 5.7.2. Market Size Absolute $ Opportunity Analysis and Forecast, Country , 2016-2032
- 5.7.2.1. Germany
- 5.7.2.2. France
- 5.7.2.3. The UK
- 5.7.2.4. Spain
- 5.7.2.5. Italy
- 5.7.2.6. Portugal
- 5.7.2.7. Ireland
- 5.7.2.8. Austria
- 5.7.2.9. Switzerland
- 5.7.2.10. Benelux
- 5.7.2.11. Nordic
- 5.7.2.12. Rest of Western Europe
- 6. Eastern Europe Smart Waste Management Market Analysis, Opportunity and Forecast, 2016-2032
- 6.1. Eastern Europe Smart Waste Management Market Analysis, 2016-2021
- 6.2. Eastern Europe Smart Waste Management Market Opportunity and Forecast, 2023-2032
- 6.3. Eastern Europe Smart Waste Management Market Analysis, Opportunity and Forecast, By by Waste Type, 2016-2032
- 6.3.1. Eastern Europe Smart Waste Management Market Analysis by by Waste Type: Introduction
- 6.3.2. Market Size Absolute $ Opportunity Analysis and Forecast, By by Waste Type, 2016-2032
- 6.3.3. Solid Waste
- 6.3.4. Special Waste
- 6.3.5. E-Waste
- 6.4. Eastern Europe Smart Waste Management Market Analysis, Opportunity and Forecast, By by Source, 2016-2032
- 6.4.1. Eastern Europe Smart Waste Management Market Analysis by by Source: Introduction
- 6.4.2. Market Size Absolute $ Opportunity Analysis and Forecast, By by Source, 2016-2032
- 6.4.3. Residential
- 6.4.4. Commercial
- 6.4.5. Industrial
- 6.5. Eastern Europe Smart Waste Management Market Analysis, Opportunity and Forecast, By by Application, 2016-2032
- 6.5.1. Eastern Europe Smart Waste Management Market Analysis by by Application: Introduction
- 6.5.2. Market Size Absolute $ Opportunity Analysis and Forecast, By by Application, 2016-2032
- 6.5.3. Construction
- 6.5.4. Healthcare
- 6.5.5. Municipalities
- 6.5.6. Food & Retail
- 6.5.7. Colleges & Universities
- 6.5.8. Manufacturing & Industrial
- 6.6. Eastern Europe Smart Waste Management Market Analysis, Opportunity and Forecast, By , 2016-2032
- 6.6.1. Eastern Europe Smart Waste Management Market Analysis by : Introduction
- 6.6.2. Market Size Absolute $ Opportunity Analysis and Forecast, By , 2016-2032
- 6.7. Eastern Europe Smart Waste Management Market Analysis, Opportunity and Forecast, By Country , 2016-2032
- 6.7.1. Eastern Europe Smart Waste Management Market Analysis by Country : Introduction
- 6.7.2. Market Size Absolute $ Opportunity Analysis and Forecast, Country , 2016-2032
- 6.7.2.1. Russia
- 6.7.2.2. Poland
- 6.7.2.3. The Czech Republic
- 6.7.2.4. Greece
- 6.7.2.5. Rest of Eastern Europe
- 7. APAC Smart Waste Management Market Analysis, Opportunity and Forecast, 2016-2032
- 7.1. APAC Smart Waste Management Market Analysis, 2016-2021
- 7.2. APAC Smart Waste Management Market Opportunity and Forecast, 2023-2032
- 7.3. APAC Smart Waste Management Market Analysis, Opportunity and Forecast, By by Waste Type, 2016-2032
- 7.3.1. APAC Smart Waste Management Market Analysis by by Waste Type: Introduction
- 7.3.2. Market Size Absolute $ Opportunity Analysis and Forecast, By by Waste Type, 2016-2032
- 7.3.3. Solid Waste
- 7.3.4. Special Waste
- 7.3.5. E-Waste
- 7.4. APAC Smart Waste Management Market Analysis, Opportunity and Forecast, By by Source, 2016-2032
- 7.4.1. APAC Smart Waste Management Market Analysis by by Source: Introduction
- 7.4.2. Market Size Absolute $ Opportunity Analysis and Forecast, By by Source, 2016-2032
- 7.4.3. Residential
- 7.4.4. Commercial
- 7.4.5. Industrial
- 7.5. APAC Smart Waste Management Market Analysis, Opportunity and Forecast, By by Application, 2016-2032
- 7.5.1. APAC Smart Waste Management Market Analysis by by Application: Introduction
- 7.5.2. Market Size Absolute $ Opportunity Analysis and Forecast, By by Application, 2016-2032
- 7.5.3. Construction
- 7.5.4. Healthcare
- 7.5.5. Municipalities
- 7.5.6. Food & Retail
- 7.5.7. Colleges & Universities
- 7.5.8. Manufacturing & Industrial
- 7.6. APAC Smart Waste Management Market Analysis, Opportunity and Forecast, By , 2016-2032
- 7.6.1. APAC Smart Waste Management Market Analysis by : Introduction
- 7.6.2. Market Size Absolute $ Opportunity Analysis and Forecast, By , 2016-2032
- 7.7. APAC Smart Waste Management Market Analysis, Opportunity and Forecast, By Country , 2016-2032
- 7.7.1. APAC Smart Waste Management Market Analysis by Country : Introduction
- 7.7.2. Market Size Absolute $ Opportunity Analysis and Forecast, Country , 2016-2032
- 7.7.2.1. China
- 7.7.2.2. Japan
- 7.7.2.3. South Korea
- 7.7.2.4. India
- 7.7.2.5. Australia & New Zeland
- 7.7.2.6. Indonesia
- 7.7.2.7. Malaysia
- 7.7.2.8. Philippines
- 7.7.2.9. Singapore
- 7.7.2.10. Thailand
- 7.7.2.11. Vietnam
- 7.7.2.12. Rest of APAC
- 8. Latin America Smart Waste Management Market Analysis, Opportunity and Forecast, 2016-2032
- 8.1. Latin America Smart Waste Management Market Analysis, 2016-2021
- 8.2. Latin America Smart Waste Management Market Opportunity and Forecast, 2023-2032
- 8.3. Latin America Smart Waste Management Market Analysis, Opportunity and Forecast, By by Waste Type, 2016-2032
- 8.3.1. Latin America Smart Waste Management Market Analysis by by Waste Type: Introduction
- 8.3.2. Market Size Absolute $ Opportunity Analysis and Forecast, By by Waste Type, 2016-2032
- 8.3.3. Solid Waste
- 8.3.4. Special Waste
- 8.3.5. E-Waste
- 8.4. Latin America Smart Waste Management Market Analysis, Opportunity and Forecast, By by Source, 2016-2032
- 8.4.1. Latin America Smart Waste Management Market Analysis by by Source: Introduction
- 8.4.2. Market Size Absolute $ Opportunity Analysis and Forecast, By by Source, 2016-2032
- 8.4.3. Residential
- 8.4.4. Commercial
- 8.4.5. Industrial
- 8.5. Latin America Smart Waste Management Market Analysis, Opportunity and Forecast, By by Application, 2016-2032
- 8.5.1. Latin America Smart Waste Management Market Analysis by by Application: Introduction
- 8.5.2. Market Size Absolute $ Opportunity Analysis and Forecast, By by Application, 2016-2032
- 8.5.3. Construction
- 8.5.4. Healthcare
- 8.5.5. Municipalities
- 8.5.6. Food & Retail
- 8.5.7. Colleges & Universities
- 8.5.8. Manufacturing & Industrial
- 8.6. Latin America Smart Waste Management Market Analysis, Opportunity and Forecast, By , 2016-2032
- 8.6.1. Latin America Smart Waste Management Market Analysis by : Introduction
- 8.6.2. Market Size Absolute $ Opportunity Analysis and Forecast, By , 2016-2032
- 8.7. Latin America Smart Waste Management Market Analysis, Opportunity and Forecast, By Country , 2016-2032
- 8.7.1. Latin America Smart Waste Management Market Analysis by Country : Introduction
- 8.7.2. Market Size Absolute $ Opportunity Analysis and Forecast, Country , 2016-2032
- 8.7.2.1. Brazil
- 8.7.2.2. Colombia
- 8.7.2.3. Chile
- 8.7.2.4. Argentina
- 8.7.2.5. Costa Rica
- 8.7.2.6. Rest of Latin America
- 9. Middle East & Africa Smart Waste Management Market Analysis, Opportunity and Forecast, 2016-2032
- 9.1. Middle East & Africa Smart Waste Management Market Analysis, 2016-2021
- 9.2. Middle East & Africa Smart Waste Management Market Opportunity and Forecast, 2023-2032
- 9.3. Middle East & Africa Smart Waste Management Market Analysis, Opportunity and Forecast, By by Waste Type, 2016-2032
- 9.3.1. Middle East & Africa Smart Waste Management Market Analysis by by Waste Type: Introduction
- 9.3.2. Market Size Absolute $ Opportunity Analysis and Forecast, By by Waste Type, 2016-2032
- 9.3.3. Solid Waste
- 9.3.4. Special Waste
- 9.3.5. E-Waste
- 9.4. Middle East & Africa Smart Waste Management Market Analysis, Opportunity and Forecast, By by Source, 2016-2032
- 9.4.1. Middle East & Africa Smart Waste Management Market Analysis by by Source: Introduction
- 9.4.2. Market Size Absolute $ Opportunity Analysis and Forecast, By by Source, 2016-2032
- 9.4.3. Residential
- 9.4.4. Commercial
- 9.4.5. Industrial
- 9.5. Middle East & Africa Smart Waste Management Market Analysis, Opportunity and Forecast, By by Application, 2016-2032
- 9.5.1. Middle East & Africa Smart Waste Management Market Analysis by by Application: Introduction
- 9.5.2. Market Size Absolute $ Opportunity Analysis and Forecast, By by Application, 2016-2032
- 9.5.3. Construction
- 9.5.4. Healthcare
- 9.5.5. Municipalities
- 9.5.6. Food & Retail
- 9.5.7. Colleges & Universities
- 9.5.8. Manufacturing & Industrial
- 9.6. Middle East & Africa Smart Waste Management Market Analysis, Opportunity and Forecast, By , 2016-2032
- 9.6.1. Middle East & Africa Smart Waste Management Market Analysis by : Introduction
- 9.6.2. Market Size Absolute $ Opportunity Analysis and Forecast, By , 2016-2032
- 9.7. Middle East & Africa Smart Waste Management Market Analysis, Opportunity and Forecast, By Country , 2016-2032
- 9.7.1. Middle East & Africa Smart Waste Management Market Analysis by Country : Introduction
- 9.7.2. Market Size Absolute $ Opportunity Analysis and Forecast, Country , 2016-2032
- 9.7.2.1. Algeria
- 9.7.2.2. Egypt
- 9.7.2.3. Israel
- 9.7.2.4. Kuwait
- 9.7.2.5. Nigeria
- 9.7.2.6. Saudi Arabia
- 9.7.2.7. South Africa
- 9.7.2.8. Turkey
- 9.7.2.9. The UAE
- 9.7.2.10. Rest of MEA
- 10. Global Smart Waste Management Market Analysis, Opportunity and Forecast, By Region , 2016-2032
- 10.1. Global Smart Waste Management Market Analysis by Region : Introduction
- 10.2. Market Size Absolute $ Opportunity Analysis and Forecast, By Region , 2016-2032
- 10.2.1. North America
- 10.2.2. Western Europe
- 10.2.3. Eastern Europe
- 10.2.4. APAC
- 10.2.5. Latin America
- 10.2.6. Middle East & Africa
- 11. Global Smart Waste Management Market Competitive Landscape, Market Share Analysis, and Company Profiles
- 11.1. Market Share Analysis
- 11.2. Company Profiles
- 11.3. International Business Machines Corporation
- 11.3.1. Company Overview
- 11.3.2. Financial Highlights
- 11.3.3. Product Portfolio
- 11.3.4. SWOT Analysis
- 11.3.5. Key Strategies and Developments
- 11.4. Waste Management, Inc.
- 11.4.1. Company Overview
- 11.4.2. Financial Highlights
- 11.4.3. Product Portfolio
- 11.4.4. SWOT Analysis
- 11.4.5. Key Strategies and Developments
- 11.5. SAP SE
- 11.5.1. Company Overview
- 11.5.2. Financial Highlights
- 11.5.3. Product Portfolio
- 11.5.4. SWOT Analysis
- 11.5.5. Key Strategies and Developments
- 11.6. Enevo Oy
- 11.6.1. Company Overview
- 11.6.2. Financial Highlights
- 11.6.3. Product Portfolio
- 11.6.4. SWOT Analysis
- 11.6.5. Key Strategies and Developments
- 11.7. Smartbin
- 11.7.1. Company Overview
- 11.7.2. Financial Highlights
- 11.7.3. Product Portfolio
- 11.7.4. SWOT Analysis
- 11.7.5. Key Strategies and Developments
- 11.8. Ecube Labs Co., Ltd.
- 11.8.1. Company Overview
- 11.8.2. Financial Highlights
- 11.8.3. Product Portfolio
- 11.8.4. SWOT Analysis
- 11.8.5. Key Strategies and Developments
- 11.9. BigBelly Solar, Inc.
- 11.9.1. Company Overview
- 11.9.2. Financial Highlights
- 11.9.3. Product Portfolio
- 11.9.4. SWOT Analysis
- 11.9.5. Key Strategies and Developments
- 11.10. Urbiótica, S.L.
- 11.10.1. Company Overview
- 11.10.2. Financial Highlights
- 11.10.3. Product Portfolio
- 11.10.4. SWOT Analysis
- 11.10.5. Key Strategies and Developments
- 11.11. Pepperl+Fuchs GmbH
- 11.11.1. Company Overview
- 11.11.2. Financial Highlights
- 11.11.3. Product Portfolio
- 11.11.4. SWOT Analysis
- 11.11.5. Key Strategies and Developments
- 11.12. WAVIoT
- 11.12.1. Company Overview
- 11.12.2. Financial Highlights
- 11.12.3. Product Portfolio
- 11.12.4. SWOT Analysis
- 11.12.5. Key Strategies and Developments
- 12. Assumptions and Acronyms
- 13. Research Methodology
- 14. Contact
- List of Figures
- Figure 1: Global Smart Waste Management Market Revenue (US$ Mn) Market Share by by Waste Type in 2022
- Figure 2: Global Smart Waste Management Market Attractiveness Analysis by by Waste Type, 2016-2032
- Figure 3: Global Smart Waste Management Market Revenue (US$ Mn) Market Share by by Sourcein 2022
- Figure 4: Global Smart Waste Management Market Attractiveness Analysis by by Source, 2016-2032
- Figure 5: Global Smart Waste Management Market Revenue (US$ Mn) Market Share by by Applicationin 2022
- Figure 6: Global Smart Waste Management Market Attractiveness Analysis by by Application, 2016-2032
- Figure 7: Global Smart Waste Management Market Revenue (US$ Mn) Market Share by in 2022
- Figure 8: Global Smart Waste Management Market Attractiveness Analysis by , 2016-2032
- Figure 9: Global Smart Waste Management Market Revenue (US$ Mn) Market Share by Region in 2022
- Figure 10: Global Smart Waste Management Market Attractiveness Analysis by Region, 2016-2032
- Figure 11: Global Smart Waste Management Market Revenue (US$ Mn) (2016-2032)
- Figure 12: Global Smart Waste Management Market Revenue (US$ Mn) Comparison by Region (2016-2032)
- Figure 13: Global Smart Waste Management Market Revenue (US$ Mn) Comparison by by Waste Type (2016-2032)
- Figure 14: Global Smart Waste Management Market Revenue (US$ Mn) Comparison by by Source (2016-2032)
- Figure 15: Global Smart Waste Management Market Revenue (US$ Mn) Comparison by by Application (2016-2032)
- Figure 16: Global Smart Waste Management Market Revenue (US$ Mn) Comparison by (2016-2032)
- Figure 17: Global Smart Waste Management Market Y-o-Y Growth Rate Comparison by Region (2016-2032)
- Figure 18: Global Smart Waste Management Market Y-o-Y Growth Rate Comparison by by Waste Type (2016-2032)
- Figure 19: Global Smart Waste Management Market Y-o-Y Growth Rate Comparison by by Source (2016-2032)
- Figure 20: Global Smart Waste Management Market Y-o-Y Growth Rate Comparison by by Application (2016-2032)
- Figure 21: Global Smart Waste Management Market Y-o-Y Growth Rate Comparison by (2016-2032)
- Figure 22: Global Smart Waste Management Market Share Comparison by Region (2016-2032)
- Figure 23: Global Smart Waste Management Market Share Comparison by by Waste Type (2016-2032)
- Figure 24: Global Smart Waste Management Market Share Comparison by by Source (2016-2032)
- Figure 25: Global Smart Waste Management Market Share Comparison by by Application (2016-2032)
- Figure 26: Global Smart Waste Management Market Share Comparison by (2016-2032)
- Figure 27: North America Smart Waste Management Market Revenue (US$ Mn) Market Share by by Waste Typein 2022
- Figure 28: North America Smart Waste Management Market Attractiveness Analysis by by Waste Type, 2016-2032
- Figure 29: North America Smart Waste Management Market Revenue (US$ Mn) Market Share by by Sourcein 2022
- Figure 30: North America Smart Waste Management Market Attractiveness Analysis by by Source, 2016-2032
- Figure 31: North America Smart Waste Management Market Revenue (US$ Mn) Market Share by by Applicationin 2022
- Figure 32: North America Smart Waste Management Market Attractiveness Analysis by by Application, 2016-2032
- Figure 33: North America Smart Waste Management Market Revenue (US$ Mn) Market Share by in 2022
- Figure 34: North America Smart Waste Management Market Attractiveness Analysis by , 2016-2032
- Figure 35: North America Smart Waste Management Market Revenue (US$ Mn) Market Share by Country in 2022
- Figure 36: North America Smart Waste Management Market Attractiveness Analysis by Country, 2016-2032
- Figure 37: North America Smart Waste Management Market Revenue (US$ Mn) (2016-2032)
- Figure 38: North America Smart Waste Management Market Revenue (US$ Mn) Comparison by Country (2016-2032)
- Figure 39: North America Smart Waste Management Market Revenue (US$ Mn) Comparison by by Waste Type (2016-2032)
- Figure 40: North America Smart Waste Management Market Revenue (US$ Mn) Comparison by by Source (2016-2032)
- Figure 41: North America Smart Waste Management Market Revenue (US$ Mn) Comparison by by Application (2016-2032)
- Figure 42: North America Smart Waste Management Market Revenue (US$ Mn) Comparison by (2016-2032)
- Figure 43: North America Smart Waste Management Market Y-o-Y Growth Rate Comparison by Country (2016-2032)
- Figure 44: North America Smart Waste Management Market Y-o-Y Growth Rate Comparison by by Waste Type (2016-2032)
- Figure 45: North America Smart Waste Management Market Y-o-Y Growth Rate Comparison by by Source (2016-2032)
- Figure 46: North America Smart Waste Management Market Y-o-Y Growth Rate Comparison by by Application (2016-2032)
- Figure 47: North America Smart Waste Management Market Y-o-Y Growth Rate Comparison by (2016-2032)
- Figure 48: North America Smart Waste Management Market Share Comparison by Country (2016-2032)
- Figure 49: North America Smart Waste Management Market Share Comparison by by Waste Type (2016-2032)
- Figure 50: North America Smart Waste Management Market Share Comparison by by Source (2016-2032)
- Figure 51: North America Smart Waste Management Market Share Comparison by by Application (2016-2032)
- Figure 52: North America Smart Waste Management Market Share Comparison by (2016-2032)
- Figure 53: Western Europe Smart Waste Management Market Revenue (US$ Mn) Market Share by by Waste Typein 2022
- Figure 54: Western Europe Smart Waste Management Market Attractiveness Analysis by by Waste Type, 2016-2032
- Figure 55: Western Europe Smart Waste Management Market Revenue (US$ Mn) Market Share by by Sourcein 2022
- Figure 56: Western Europe Smart Waste Management Market Attractiveness Analysis by by Source, 2016-2032
- Figure 57: Western Europe Smart Waste Management Market Revenue (US$ Mn) Market Share by by Applicationin 2022
- Figure 58: Western Europe Smart Waste Management Market Attractiveness Analysis by by Application, 2016-2032
- Figure 59: Western Europe Smart Waste Management Market Revenue (US$ Mn) Market Share by in 2022
- Figure 60: Western Europe Smart Waste Management Market Attractiveness Analysis by , 2016-2032
- Figure 61: Western Europe Smart Waste Management Market Revenue (US$ Mn) Market Share by Country in 2022
- Figure 62: Western Europe Smart Waste Management Market Attractiveness Analysis by Country, 2016-2032
- Figure 63: Western Europe Smart Waste Management Market Revenue (US$ Mn) (2016-2032)
- Figure 64: Western Europe Smart Waste Management Market Revenue (US$ Mn) Comparison by Country (2016-2032)
- Figure 65: Western Europe Smart Waste Management Market Revenue (US$ Mn) Comparison by by Waste Type (2016-2032)
- Figure 66: Western Europe Smart Waste Management Market Revenue (US$ Mn) Comparison by by Source (2016-2032)
- Figure 67: Western Europe Smart Waste Management Market Revenue (US$ Mn) Comparison by by Application (2016-2032)
- Figure 68: Western Europe Smart Waste Management Market Revenue (US$ Mn) Comparison by (2016-2032)
- Figure 69: Western Europe Smart Waste Management Market Y-o-Y Growth Rate Comparison by Country (2016-2032)
- Figure 70: Western Europe Smart Waste Management Market Y-o-Y Growth Rate Comparison by by Waste Type (2016-2032)
- Figure 71: Western Europe Smart Waste Management Market Y-o-Y Growth Rate Comparison by by Source (2016-2032)
- Figure 72: Western Europe Smart Waste Management Market Y-o-Y Growth Rate Comparison by by Application (2016-2032)
- Figure 73: Western Europe Smart Waste Management Market Y-o-Y Growth Rate Comparison by (2016-2032)
- Figure 74: Western Europe Smart Waste Management Market Share Comparison by Country (2016-2032)
- Figure 75: Western Europe Smart Waste Management Market Share Comparison by by Waste Type (2016-2032)
- Figure 76: Western Europe Smart Waste Management Market Share Comparison by by Source (2016-2032)
- Figure 77: Western Europe Smart Waste Management Market Share Comparison by by Application (2016-2032)
- Figure 78: Western Europe Smart Waste Management Market Share Comparison by (2016-2032)
- Figure 79: Eastern Europe Smart Waste Management Market Revenue (US$ Mn) Market Share by by Waste Typein 2022
- Figure 80: Eastern Europe Smart Waste Management Market Attractiveness Analysis by by Waste Type, 2016-2032
- Figure 81: Eastern Europe Smart Waste Management Market Revenue (US$ Mn) Market Share by by Sourcein 2022
- Figure 82: Eastern Europe Smart Waste Management Market Attractiveness Analysis by by Source, 2016-2032
- Figure 83: Eastern Europe Smart Waste Management Market Revenue (US$ Mn) Market Share by by Applicationin 2022
- Figure 84: Eastern Europe Smart Waste Management Market Attractiveness Analysis by by Application, 2016-2032
- Figure 85: Eastern Europe Smart Waste Management Market Revenue (US$ Mn) Market Share by in 2022
- Figure 86: Eastern Europe Smart Waste Management Market Attractiveness Analysis by , 2016-2032
- Figure 87: Eastern Europe Smart Waste Management Market Revenue (US$ Mn) Market Share by Country in 2022
- Figure 88: Eastern Europe Smart Waste Management Market Attractiveness Analysis by Country, 2016-2032
- Figure 89: Eastern Europe Smart Waste Management Market Revenue (US$ Mn) (2016-2032)
- Figure 90: Eastern Europe Smart Waste Management Market Revenue (US$ Mn) Comparison by Country (2016-2032)
- Figure 91: Eastern Europe Smart Waste Management Market Revenue (US$ Mn) Comparison by by Waste Type (2016-2032)
- Figure 92: Eastern Europe Smart Waste Management Market Revenue (US$ Mn) Comparison by by Source (2016-2032)
- Figure 93: Eastern Europe Smart Waste Management Market Revenue (US$ Mn) Comparison by by Application (2016-2032)
- Figure 94: Eastern Europe Smart Waste Management Market Revenue (US$ Mn) Comparison by (2016-2032)
- Figure 95: Eastern Europe Smart Waste Management Market Y-o-Y Growth Rate Comparison by Country (2016-2032)
- Figure 96: Eastern Europe Smart Waste Management Market Y-o-Y Growth Rate Comparison by by Waste Type (2016-2032)
- Figure 97: Eastern Europe Smart Waste Management Market Y-o-Y Growth Rate Comparison by by Source (2016-2032)
- Figure 98: Eastern Europe Smart Waste Management Market Y-o-Y Growth Rate Comparison by by Application (2016-2032)
- Figure 99: Eastern Europe Smart Waste Management Market Y-o-Y Growth Rate Comparison by (2016-2032)
- Figure 100: Eastern Europe Smart Waste Management Market Share Comparison by Country (2016-2032)
- Figure 101: Eastern Europe Smart Waste Management Market Share Comparison by by Waste Type (2016-2032)
- Figure 102: Eastern Europe Smart Waste Management Market Share Comparison by by Source (2016-2032)
- Figure 103: Eastern Europe Smart Waste Management Market Share Comparison by by Application (2016-2032)
- Figure 104: Eastern Europe Smart Waste Management Market Share Comparison by (2016-2032)
- Figure 105: APAC Smart Waste Management Market Revenue (US$ Mn) Market Share by by Waste Typein 2022
- Figure 106: APAC Smart Waste Management Market Attractiveness Analysis by by Waste Type, 2016-2032
- Figure 107: APAC Smart Waste Management Market Revenue (US$ Mn) Market Share by by Sourcein 2022
- Figure 108: APAC Smart Waste Management Market Attractiveness Analysis by by Source, 2016-2032
- Figure 109: APAC Smart Waste Management Market Revenue (US$ Mn) Market Share by by Applicationin 2022
- Figure 110: APAC Smart Waste Management Market Attractiveness Analysis by by Application, 2016-2032
- Figure 111: APAC Smart Waste Management Market Revenue (US$ Mn) Market Share by in 2022
- Figure 112: APAC Smart Waste Management Market Attractiveness Analysis by , 2016-2032
- Figure 113: APAC Smart Waste Management Market Revenue (US$ Mn) Market Share by Country in 2022
- Figure 114: APAC Smart Waste Management Market Attractiveness Analysis by Country, 2016-2032
- Figure 115: APAC Smart Waste Management Market Revenue (US$ Mn) (2016-2032)
- Figure 116: APAC Smart Waste Management Market Revenue (US$ Mn) Comparison by Country (2016-2032)
- Figure 117: APAC Smart Waste Management Market Revenue (US$ Mn) Comparison by by Waste Type (2016-2032)
- Figure 118: APAC Smart Waste Management Market Revenue (US$ Mn) Comparison by by Source (2016-2032)
- Figure 119: APAC Smart Waste Management Market Revenue (US$ Mn) Comparison by by Application (2016-2032)
- Figure 120: APAC Smart Waste Management Market Revenue (US$ Mn) Comparison by (2016-2032)
- Figure 121: APAC Smart Waste Management Market Y-o-Y Growth Rate Comparison by Country (2016-2032)
- Figure 122: APAC Smart Waste Management Market Y-o-Y Growth Rate Comparison by by Waste Type (2016-2032)
- Figure 123: APAC Smart Waste Management Market Y-o-Y Growth Rate Comparison by by Source (2016-2032)
- Figure 124: APAC Smart Waste Management Market Y-o-Y Growth Rate Comparison by by Application (2016-2032)
- Figure 125: APAC Smart Waste Management Market Y-o-Y Growth Rate Comparison by (2016-2032)
- Figure 126: APAC Smart Waste Management Market Share Comparison by Country (2016-2032)
- Figure 127: APAC Smart Waste Management Market Share Comparison by by Waste Type (2016-2032)
- Figure 128: APAC Smart Waste Management Market Share Comparison by by Source (2016-2032)
- Figure 129: APAC Smart Waste Management Market Share Comparison by by Application (2016-2032)
- Figure 130: APAC Smart Waste Management Market Share Comparison by (2016-2032)
- Figure 131: Latin America Smart Waste Management Market Revenue (US$ Mn) Market Share by by Waste Typein 2022
- Figure 132: Latin America Smart Waste Management Market Attractiveness Analysis by by Waste Type, 2016-2032
- Figure 133: Latin America Smart Waste Management Market Revenue (US$ Mn) Market Share by by Sourcein 2022
- Figure 134: Latin America Smart Waste Management Market Attractiveness Analysis by by Source, 2016-2032
- Figure 135: Latin America Smart Waste Management Market Revenue (US$ Mn) Market Share by by Applicationin 2022
- Figure 136: Latin America Smart Waste Management Market Attractiveness Analysis by by Application, 2016-2032
- Figure 137: Latin America Smart Waste Management Market Revenue (US$ Mn) Market Share by in 2022
- Figure 138: Latin America Smart Waste Management Market Attractiveness Analysis by , 2016-2032
- Figure 139: Latin America Smart Waste Management Market Revenue (US$ Mn) Market Share by Country in 2022
- Figure 140: Latin America Smart Waste Management Market Attractiveness Analysis by Country, 2016-2032
- Figure 141: Latin America Smart Waste Management Market Revenue (US$ Mn) (2016-2032)
- Figure 142: Latin America Smart Waste Management Market Revenue (US$ Mn) Comparison by Country (2016-2032)
- Figure 143: Latin America Smart Waste Management Market Revenue (US$ Mn) Comparison by by Waste Type (2016-2032)
- Figure 144: Latin America Smart Waste Management Market Revenue (US$ Mn) Comparison by by Source (2016-2032)
- Figure 145: Latin America Smart Waste Management Market Revenue (US$ Mn) Comparison by by Application (2016-2032)
- Figure 146: Latin America Smart Waste Management Market Revenue (US$ Mn) Comparison by (2016-2032)
- Figure 147: Latin America Smart Waste Management Market Y-o-Y Growth Rate Comparison by Country (2016-2032)
- Figure 148: Latin America Smart Waste Management Market Y-o-Y Growth Rate Comparison by by Waste Type (2016-2032)
- Figure 149: Latin America Smart Waste Management Market Y-o-Y Growth Rate Comparison by by Source (2016-2032)
- Figure 150: Latin America Smart Waste Management Market Y-o-Y Growth Rate Comparison by by Application (2016-2032)
- Figure 151: Latin America Smart Waste Management Market Y-o-Y Growth Rate Comparison by (2016-2032)
- Figure 152: Latin America Smart Waste Management Market Share Comparison by Country (2016-2032)
- Figure 153: Latin America Smart Waste Management Market Share Comparison by by Waste Type (2016-2032)
- Figure 154: Latin America Smart Waste Management Market Share Comparison by by Source (2016-2032)
- Figure 155: Latin America Smart Waste Management Market Share Comparison by by Application (2016-2032)
- Figure 156: Latin America Smart Waste Management Market Share Comparison by (2016-2032)
- Figure 157: Middle East & Africa Smart Waste Management Market Revenue (US$ Mn) Market Share by by Waste Typein 2022
- Figure 158: Middle East & Africa Smart Waste Management Market Attractiveness Analysis by by Waste Type, 2016-2032
- Figure 159: Middle East & Africa Smart Waste Management Market Revenue (US$ Mn) Market Share by by Sourcein 2022
- Figure 160: Middle East & Africa Smart Waste Management Market Attractiveness Analysis by by Source, 2016-2032
- Figure 161: Middle East & Africa Smart Waste Management Market Revenue (US$ Mn) Market Share by by Applicationin 2022
- Figure 162: Middle East & Africa Smart Waste Management Market Attractiveness Analysis by by Application, 2016-2032
- Figure 163: Middle East & Africa Smart Waste Management Market Revenue (US$ Mn) Market Share by in 2022
- Figure 164: Middle East & Africa Smart Waste Management Market Attractiveness Analysis by , 2016-2032
- Figure 165: Middle East & Africa Smart Waste Management Market Revenue (US$ Mn) Market Share by Country in 2022
- Figure 166: Middle East & Africa Smart Waste Management Market Attractiveness Analysis by Country, 2016-2032
- Figure 167: Middle East & Africa Smart Waste Management Market Revenue (US$ Mn) (2016-2032)
- Figure 168: Middle East & Africa Smart Waste Management Market Revenue (US$ Mn) Comparison by Country (2016-2032)
- Figure 169: Middle East & Africa Smart Waste Management Market Revenue (US$ Mn) Comparison by by Waste Type (2016-2032)
- Figure 170: Middle East & Africa Smart Waste Management Market Revenue (US$ Mn) Comparison by by Source (2016-2032)
- Figure 171: Middle East & Africa Smart Waste Management Market Revenue (US$ Mn) Comparison by by Application (2016-2032)
- Figure 172: Middle East & Africa Smart Waste Management Market Revenue (US$ Mn) Comparison by (2016-2032)
- Figure 173: Middle East & Africa Smart Waste Management Market Y-o-Y Growth Rate Comparison by Country (2016-2032)
- Figure 174: Middle East & Africa Smart Waste Management Market Y-o-Y Growth Rate Comparison by by Waste Type (2016-2032)
- Figure 175: Middle East & Africa Smart Waste Management Market Y-o-Y Growth Rate Comparison by by Source (2016-2032)
- Figure 176: Middle East & Africa Smart Waste Management Market Y-o-Y Growth Rate Comparison by by Application (2016-2032)
- Figure 177: Middle East & Africa Smart Waste Management Market Y-o-Y Growth Rate Comparison by (2016-2032)
- Figure 178: Middle East & Africa Smart Waste Management Market Share Comparison by Country (2016-2032)
- Figure 179: Middle East & Africa Smart Waste Management Market Share Comparison by by Waste Type (2016-2032)
- Figure 180: Middle East & Africa Smart Waste Management Market Share Comparison by by Source (2016-2032)
- Figure 181: Middle East & Africa Smart Waste Management Market Share Comparison by by Application (2016-2032)
- Figure 182: Middle East & Africa Smart Waste Management Market Share Comparison by (2016-2032)
List of Tables
- Table 1: Global Smart Waste Management Market Comparison by by Waste Type (2016-2032)
- Table 2: Global Smart Waste Management Market Comparison by by Source (2016-2032)
- Table 3: Global Smart Waste Management Market Comparison by by Application (2016-2032)
- Table 4: Global Smart Waste Management Market Comparison by (2016-2032)
- Table 5: Global Smart Waste Management Market Revenue (US$ Mn) Comparison by Region (2016-2032)
- Table 6: Global Smart Waste Management Market Revenue (US$ Mn) (2016-2032)
- Table 7: Global Smart Waste Management Market Revenue (US$ Mn) Comparison by Region (2016-2032)
- Table 8: Global Smart Waste Management Market Revenue (US$ Mn) Comparison by by Waste Type (2016-2032)
- Table 9: Global Smart Waste Management Market Revenue (US$ Mn) Comparison by by Source (2016-2032)
- Table 10: Global Smart Waste Management Market Revenue (US$ Mn) Comparison by by Application (2016-2032)
- Table 11: Global Smart Waste Management Market Revenue (US$ Mn) Comparison by (2016-2032)
- Table 12: Global Smart Waste Management Market Y-o-Y Growth Rate Comparison by Region (2016-2032)
- Table 13: Global Smart Waste Management Market Y-o-Y Growth Rate Comparison by by Waste Type (2016-2032)
- Table 14: Global Smart Waste Management Market Y-o-Y Growth Rate Comparison by by Source (2016-2032)
- Table 15: Global Smart Waste Management Market Y-o-Y Growth Rate Comparison by by Application (2016-2032)
- Table 16: Global Smart Waste Management Market Y-o-Y Growth Rate Comparison by (2016-2032)
- Table 17: Global Smart Waste Management Market Share Comparison by Region (2016-2032)
- Table 18: Global Smart Waste Management Market Share Comparison by by Waste Type (2016-2032)
- Table 19: Global Smart Waste Management Market Share Comparison by by Source (2016-2032)
- Table 20: Global Smart Waste Management Market Share Comparison by by Application (2016-2032)
- Table 21: Global Smart Waste Management Market Share Comparison by (2016-2032)
- Table 22: North America Smart Waste Management Market Comparison by by Source (2016-2032)
- Table 23: North America Smart Waste Management Market Comparison by by Application (2016-2032)
- Table 24: North America Smart Waste Management Market Comparison by (2016-2032)
- Table 25: North America Smart Waste Management Market Revenue (US$ Mn) Comparison by Country (2016-2032)
- Table 26: North America Smart Waste Management Market Revenue (US$ Mn) (2016-2032)
- Table 27: North America Smart Waste Management Market Revenue (US$ Mn) Comparison by Country (2016-2032)
- Table 28: North America Smart Waste Management Market Revenue (US$ Mn) Comparison by by Waste Type (2016-2032)
- Table 29: North America Smart Waste Management Market Revenue (US$ Mn) Comparison by by Source (2016-2032)
- Table 30: North America Smart Waste Management Market Revenue (US$ Mn) Comparison by by Application (2016-2032)
- Table 31: North America Smart Waste Management Market Revenue (US$ Mn) Comparison by (2016-2032)
- Table 32: North America Smart Waste Management Market Y-o-Y Growth Rate Comparison by Country (2016-2032)
- Table 33: North America Smart Waste Management Market Y-o-Y Growth Rate Comparison by by Waste Type (2016-2032)
- Table 34: North America Smart Waste Management Market Y-o-Y Growth Rate Comparison by by Source (2016-2032)
- Table 35: North America Smart Waste Management Market Y-o-Y Growth Rate Comparison by by Application (2016-2032)
- Table 36: North America Smart Waste Management Market Y-o-Y Growth Rate Comparison by (2016-2032)
- Table 37: North America Smart Waste Management Market Share Comparison by Country (2016-2032)
- Table 38: North America Smart Waste Management Market Share Comparison by by Waste Type (2016-2032)
- Table 39: North America Smart Waste Management Market Share Comparison by by Source (2016-2032)
- Table 40: North America Smart Waste Management Market Share Comparison by by Application (2016-2032)
- Table 41: North America Smart Waste Management Market Share Comparison by (2016-2032)
- Table 42: Western Europe Smart Waste Management Market Comparison by by Waste Type (2016-2032)
- Table 43: Western Europe Smart Waste Management Market Comparison by by Source (2016-2032)
- Table 44: Western Europe Smart Waste Management Market Comparison by by Application (2016-2032)
- Table 45: Western Europe Smart Waste Management Market Comparison by (2016-2032)
- Table 46: Western Europe Smart Waste Management Market Revenue (US$ Mn) Comparison by Country (2016-2032)
- Table 47: Western Europe Smart Waste Management Market Revenue (US$ Mn) (2016-2032)
- Table 48: Western Europe Smart Waste Management Market Revenue (US$ Mn) Comparison by Country (2016-2032)
- Table 49: Western Europe Smart Waste Management Market Revenue (US$ Mn) Comparison by by Waste Type (2016-2032)
- Table 50: Western Europe Smart Waste Management Market Revenue (US$ Mn) Comparison by by Source (2016-2032)
- Table 51: Western Europe Smart Waste Management Market Revenue (US$ Mn) Comparison by by Application (2016-2032)
- Table 52: Western Europe Smart Waste Management Market Revenue (US$ Mn) Comparison by (2016-2032)
- Table 53: Western Europe Smart Waste Management Market Y-o-Y Growth Rate Comparison by Country (2016-2032)
- Table 54: Western Europe Smart Waste Management Market Y-o-Y Growth Rate Comparison by by Waste Type (2016-2032)
- Table 55: Western Europe Smart Waste Management Market Y-o-Y Growth Rate Comparison by by Source (2016-2032)
- Table 56: Western Europe Smart Waste Management Market Y-o-Y Growth Rate Comparison by by Application (2016-2032)
- Table 57: Western Europe Smart Waste Management Market Y-o-Y Growth Rate Comparison by (2016-2032)
- Table 58: Western Europe Smart Waste Management Market Share Comparison by Country (2016-2032)
- Table 59: Western Europe Smart Waste Management Market Share Comparison by by Waste Type (2016-2032)
- Table 60: Western Europe Smart Waste Management Market Share Comparison by by Source (2016-2032)
- Table 61: Western Europe Smart Waste Management Market Share Comparison by by Application (2016-2032)
- Table 62: Western Europe Smart Waste Management Market Share Comparison by (2016-2032)
- Table 63: Eastern Europe Smart Waste Management Market Comparison by by Waste Type (2016-2032)
- Table 64: Eastern Europe Smart Waste Management Market Comparison by by Source (2016-2032)
- Table 65: Eastern Europe Smart Waste Management Market Comparison by by Application (2016-2032)
- Table 66: Eastern Europe Smart Waste Management Market Comparison by (2016-2032)
- Table 67: Eastern Europe Smart Waste Management Market Revenue (US$ Mn) Comparison by Country (2016-2032)
- Table 68: Eastern Europe Smart Waste Management Market Revenue (US$ Mn) (2016-2032)
- Table 69: Eastern Europe Smart Waste Management Market Revenue (US$ Mn) Comparison by Country (2016-2032)
- Table 70: Eastern Europe Smart Waste Management Market Revenue (US$ Mn) Comparison by by Waste Type (2016-2032)
- Table 71: Eastern Europe Smart Waste Management Market Revenue (US$ Mn) Comparison by by Source (2016-2032)
- Table 72: Eastern Europe Smart Waste Management Market Revenue (US$ Mn) Comparison by by Application (2016-2032)
- Table 73: Eastern Europe Smart Waste Management Market Revenue (US$ Mn) Comparison by (2016-2032)
- Table 74: Eastern Europe Smart Waste Management Market Y-o-Y Growth Rate Comparison by Country (2016-2032)
- Table 75: Eastern Europe Smart Waste Management Market Y-o-Y Growth Rate Comparison by by Waste Type (2016-2032)
- Table 76: Eastern Europe Smart Waste Management Market Y-o-Y Growth Rate Comparison by by Source (2016-2032)
- Table 77: Eastern Europe Smart Waste Management Market Y-o-Y Growth Rate Comparison by by Application (2016-2032)
- Table 78: Eastern Europe Smart Waste Management Market Y-o-Y Growth Rate Comparison by (2016-2032)
- Table 79: Eastern Europe Smart Waste Management Market Share Comparison by Country (2016-2032)
- Table 80: Eastern Europe Smart Waste Management Market Share Comparison by by Waste Type (2016-2032)
- Table 81: Eastern Europe Smart Waste Management Market Share Comparison by by Source (2016-2032)
- Table 82: Eastern Europe Smart Waste Management Market Share Comparison by by Application (2016-2032)
- Table 83: Eastern Europe Smart Waste Management Market Share Comparison by (2016-2032)
- Table 84: APAC Smart Waste Management Market Comparison by by Waste Type (2016-2032)
- Table 85: APAC Smart Waste Management Market Comparison by by Source (2016-2032)
- Table 86: APAC Smart Waste Management Market Comparison by by Application (2016-2032)
- Table 87: APAC Smart Waste Management Market Comparison by (2016-2032)
- Table 88: APAC Smart Waste Management Market Revenue (US$ Mn) Comparison by Country (2016-2032)
- Table 89: APAC Smart Waste Management Market Revenue (US$ Mn) (2016-2032)
- Table 90: APAC Smart Waste Management Market Revenue (US$ Mn) Comparison by Country (2016-2032)
- Table 91: APAC Smart Waste Management Market Revenue (US$ Mn) Comparison by by Waste Type (2016-2032)
- Table 92: APAC Smart Waste Management Market Revenue (US$ Mn) Comparison by by Source (2016-2032)
- Table 93: APAC Smart Waste Management Market Revenue (US$ Mn) Comparison by by Application (2016-2032)
- Table 94: APAC Smart Waste Management Market Revenue (US$ Mn) Comparison by (2016-2032)
- Table 95: APAC Smart Waste Management Market Y-o-Y Growth Rate Comparison by Country (2016-2032)
- Table 96: APAC Smart Waste Management Market Y-o-Y Growth Rate Comparison by by Waste Type (2016-2032)
- Table 97: APAC Smart Waste Management Market Y-o-Y Growth Rate Comparison by by Source (2016-2032)
- Table 98: APAC Smart Waste Management Market Y-o-Y Growth Rate Comparison by by Application (2016-2032)
- Table 99: APAC Smart Waste Management Market Y-o-Y Growth Rate Comparison by (2016-2032)
- Table 100: APAC Smart Waste Management Market Share Comparison by Country (2016-2032)
- Table 101: APAC Smart Waste Management Market Share Comparison by by Waste Type (2016-2032)
- Table 102: APAC Smart Waste Management Market Share Comparison by by Source (2016-2032)
- Table 103: APAC Smart Waste Management Market Share Comparison by by Application (2016-2032)
- Table 104: APAC Smart Waste Management Market Share Comparison by (2016-2032)
- Table 105: Latin America Smart Waste Management Market Comparison by by Waste Type (2016-2032)
- Table 106: Latin America Smart Waste Management Market Comparison by by Source (2016-2032)
- Table 107: Latin America Smart Waste Management Market Comparison by by Application (2016-2032)
- Table 108: Latin America Smart Waste Management Market Comparison by (2016-2032)
- Table 109: Latin America Smart Waste Management Market Revenue (US$ Mn) Comparison by Country (2016-2032)
- Table 110: Latin America Smart Waste Management Market Revenue (US$ Mn) (2016-2032)
- Table 111: Latin America Smart Waste Management Market Revenue (US$ Mn) Comparison by Country (2016-2032)
- Table 112: Latin America Smart Waste Management Market Revenue (US$ Mn) Comparison by by Waste Type (2016-2032)
- Table 113: Latin America Smart Waste Management Market Revenue (US$ Mn) Comparison by by Source (2016-2032)
- Table 114: Latin America Smart Waste Management Market Revenue (US$ Mn) Comparison by by Application (2016-2032)
- Table 115: Latin America Smart Waste Management Market Revenue (US$ Mn) Comparison by (2016-2032)
- Table 116: Latin America Smart Waste Management Market Y-o-Y Growth Rate Comparison by Country (2016-2032)
- Table 117: Latin America Smart Waste Management Market Y-o-Y Growth Rate Comparison by by Waste Type (2016-2032)
- Table 118: Latin America Smart Waste Management Market Y-o-Y Growth Rate Comparison by by Source (2016-2032)
- Table 119: Latin America Smart Waste Management Market Y-o-Y Growth Rate Comparison by by Application (2016-2032)
- Table 120: Latin America Smart Waste Management Market Y-o-Y Growth Rate Comparison by (2016-2032)
- Table 121: Latin America Smart Waste Management Market Share Comparison by Country (2016-2032)
- Table 122: Latin America Smart Waste Management Market Share Comparison by by Waste Type (2016-2032)
- Table 123: Latin America Smart Waste Management Market Share Comparison by by Source (2016-2032)
- Table 124: Latin America Smart Waste Management Market Share Comparison by by Application (2016-2032)
- Table 125: Latin America Smart Waste Management Market Share Comparison by (2016-2032)
- Table 126: Middle East & Africa Smart Waste Management Market Comparison by by Waste Type (2016-2032)
- Table 127: Middle East & Africa Smart Waste Management Market Comparison by by Source (2016-2032)
- Table 128: Middle East & Africa Smart Waste Management Market Comparison by by Application (2016-2032)
- Table 129: Middle East & Africa Smart Waste Management Market Comparison by (2016-2032)
- Table 130: Middle East & Africa Smart Waste Management Market Revenue (US$ Mn) Comparison by Country (2016-2032)
- Table 131: Middle East & Africa Smart Waste Management Market Revenue (US$ Mn) (2016-2032)
- Table 132: Middle East & Africa Smart Waste Management Market Revenue (US$ Mn) Comparison by Country (2016-2032)
- Table 133: Middle East & Africa Smart Waste Management Market Revenue (US$ Mn) Comparison by by Waste Type (2016-2032)
- Table 134: Middle East & Africa Smart Waste Management Market Revenue (US$ Mn) Comparison by by Source (2016-2032)
- Table 135: Middle East & Africa Smart Waste Management Market Revenue (US$ Mn) Comparison by by Application (2016-2032)
- Table 136: Middle East & Africa Smart Waste Management Market Revenue (US$ Mn) Comparison by (2016-2032)
- Table 137: Middle East & Africa Smart Waste Management Market Y-o-Y Growth Rate Comparison by Country (2016-2032)
- Table 138: Middle East & Africa Smart Waste Management Market Y-o-Y Growth Rate Comparison by by Waste Type (2016-2032)
- Table 139: Middle East & Africa Smart Waste Management Market Y-o-Y Growth Rate Comparison by by Source (2016-2032)
- Table 140: Middle East & Africa Smart Waste Management Market Y-o-Y Growth Rate Comparison by by Application (2016-2032)
- Table 141: Middle East & Africa Smart Waste Management Market Y-o-Y Growth Rate Comparison by (2016-2032)
- Table 142: Middle East & Africa Smart Waste Management Market Share Comparison by Country (2016-2032)
- Table 143: Middle East & Africa Smart Waste Management Market Share Comparison by by Waste Type (2016-2032)
- Table 144: Middle East & Africa Smart Waste Management Market Share Comparison by by Source (2016-2032)
- Table 145: Middle East & Africa Smart Waste Management Market Share Comparison by by Application (2016-2032)
- Table 146: Middle East & Africa Smart Waste Management Market Share Comparison by (2016-2032)
- 1. Executive Summary
-
- International Business Machines Corporation
- Waste Management, Inc.
- SAP SE
- Enevo Oy
- Smartbin
- Ecube Labs Co., Ltd.
- BigBelly Solar, Inc.
- Urbiótica, S.L.
- Pepperl+Fuchs GmbH
- WAVIoT
Our Clients


View Our Licence Options
