Smart Contact Lenses Market By Procedure (Continuous Glucose Monitoring, Intraocular Pressure Monitoring, And Other Procedures), By End-User (Hospitals, Ophthalmology Clinics, Home Care Settings), By Region And Companies - Industry Segment Outlook, Market Assessment, Competition Scenario, Trends, And Forecast 2023-2032
-
11547
-
Jul 2023
-
162
-


-
This report was compiled by Vishwa Gaul Vishwa is an experienced market research and consulting professional with over 8 years of expertise in the ICT industry, contributing to over 700 reports across telecommunications, software, hardware, and digital solutions. Correspondence Team Lead- ICT Linkedin | Detailed Market research Methodology Our methodology involves a mix of primary research, including interviews with leading mental health experts, and secondary research from reputable medical journals and databases. View Detailed Methodology Page
-
Quick Navigation
Report Overview
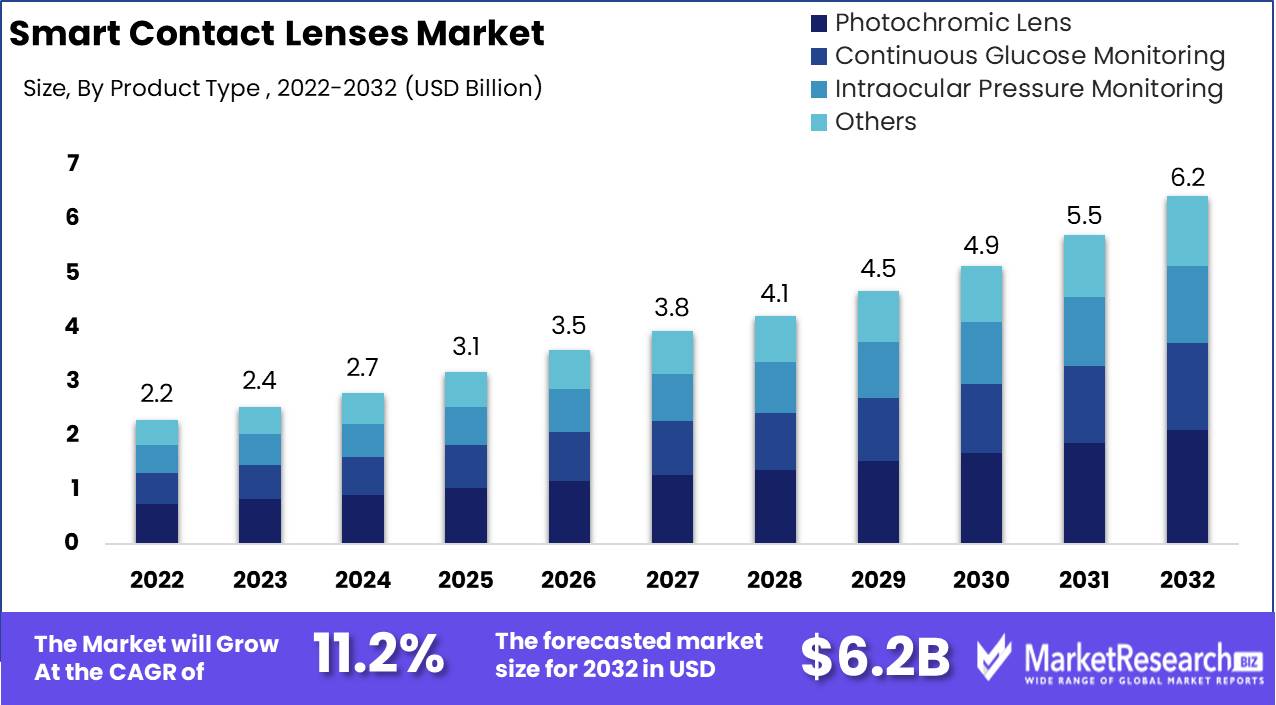
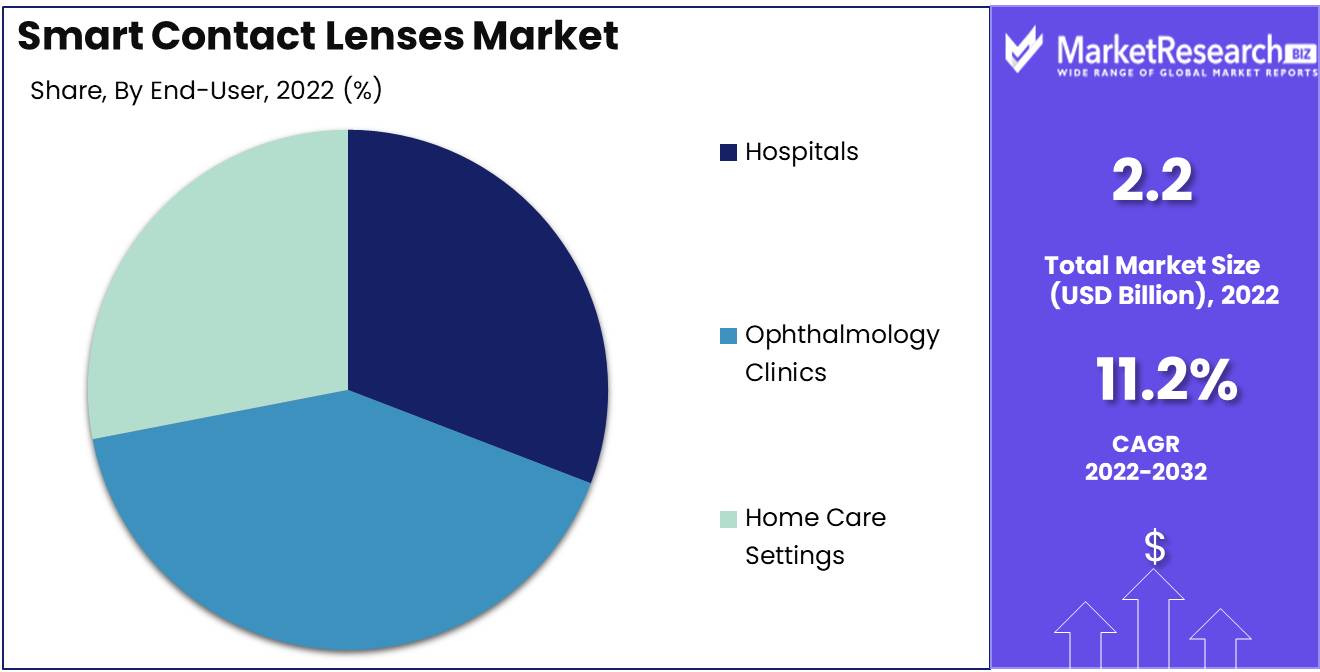
Smart Contact Lenses Market size is expected to be worth around USD 6.2 Bn by 2032 from USD 2.2 Bn in 2022, growing at a CAGR of 11.2% during the forecast period from 2023 to 2032.
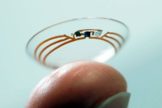
The smart contact lenses market is a rapidly expanding industry involving the development and incorporation of smart devices into contact lenses. They contain electronic devices and sensors that enable the wearer to monitor their health and improve their vision. They provide various benefits, including monitoring diabetes, tracking body temperature, and monitoring oxygen levels in a patient. This reduces the necessity for invasive procedures and hospital visits.
The potential of smart contact lenses Market to aid in diagnosing and treating various medical conditions highlights their significance. They increase the accuracy and sensitivity of health monitoring, allowing for quicker and more precise problem identification. In addition, smart contact lenses offer the benefit of being non-invasive, allowing patients to continue with their daily activities without interruption.
The development of the smart contact lenses Market has resulted in numerous significant innovations, such as the incorporation of sensors that detect blood sugar levels for diabetics, augmented reality technology that improves vision, and micro cameras embedded within the lens that can provide sight to the blind. These innovations have enormous potential, and researchers are continuously developing new capabilities for smart contact lenses.
The smart contact lens market has attracted the interest of numerous industries, which have made investments to advance research and development. Companies such as Google, Novartis, and Samsung have made substantial investments in the development of this technology, resulting in the release of products such as the Google x Verily Smart Contact Lens and the HoloLens smart spectacles that incorporate augmented reality into contact lenses. Such organizations recognize the potential for smart contacts to improve the user experience and quality of life.
Driving factors
Diabetes and related eye problems are becoming more common.
In the past few years, the smart contact lens market has grown a lot, and this is likely to continue in the years to come. One reason for this trend is the growing number of people with diabetes and related eye illnesses. As more people are diagnosed with diabetes, there is a greater need for advanced healthcare technology like the smart contact lenses market to help control these conditions. These lenses might be able to keep track of glucose levels in real-time, which would be very helpful for diabetics.
Getting more people to care for their eyes and vision
The fact that people are becoming more aware of eye health and vision is another thing that is helping the smart contact lens market grow. People are becoming more aware of how important it is to take care of their eyes and are willing to spend money on technology that can help them keep an eye on their health. The rise of this market has also been helped by smart devices getting smarter and more people using wearable devices.
Technological advancements in the field of smart devices
Augmented reality (AR) technology is a new technology that could change the smart contact lens business. AR technology could be added to smart contact lenses so that users could get real-time information about their surroundings or even see virtual information like maps or alerts.
Restraining Factors
High cost of initial investment
Significant resources are required for the creation and manufacture of smart contact lenses. This initial expenditure is one of the primary obstacles to market expansion. The majority of smart contact lenses are prototypes, and the lack of economies of scale increases the price of each pair. This high price makes it difficult to make the technology accessible to a wider audience.
Healthcare providers may be reluctant to prescribe the technology to patients due to its high cost, thereby limiting its market penetration. In order for the market to attain its full potential, companies must find ways to reduce production and pricing costs, thereby making lenses more affordable for end users.
Battery Life Of The Lenses Is Limited
Smart contact lenses are equipped with a number of electronic components that allow them to perform as anticipated. The greatest difficulty is designing lenses that can operate for multiple days on a small battery while providing all of the necessary functions. This is a significant obstacle for manufacturers, as the necessary technology is still in its infancy of development.
In addition, the lenses' functionality is limited by their short battery life; they cannot perform complex duties for extended periods, such as glucose monitoring in diabetic patients. As technology advances, manufacturers must develop batteries that are more efficient and can sustain lens functionality for longer durations.
By Type Analysis
The smart contact lens market is changing. Photochromic Lens Segment smart contact lenses dominate the market due to innovative technologies. Photochromic lenses are versatile because they change colour depending on the light.
The Photochromic Lens Segment of smart contact lenses dominates the market and is predicted to continue to do so. Due to many variables, market experts estimate the segment's growth rate to rise significantly.
The Photochromic Lens Segment of smart contact lenses is driven by economic expansion in developing countries. Advanced medical technology is in demand in emerging economies due to rapid economic growth.
Thus, smart contact lenses, especially photochromic lenses, have grown in these rising economies. With more spare income and better healthcare, citizens in these countries are eager to spend in modern technologies to improve their quality of life.
End-User Analysis
Smart contact lenses market is dominated by Ophthalmology Clinics. Due to its usage in ophthalmology clinics, the segment is predicted to grow the fastest.
Advanced medical technology is in demand in emerging economies due to rapid economic growth. Thus, smart contact lenses have grown in emerging nations, notably in ophthalmology clinics.
These countries' inhabitants are prepared to invest in modern eye health technology due to higher disposable income and greater healthcare access.
Specialised eye care patients have flocked to the Ophthalmology Clinics Segment. Due to its efficacy in treating eye diseases, the segment is growing significantly.
Key Market Segments
By product type
- Photochromic Lens
- Continuous Glucose Monitoring
- Intraocular Pressure Monitoring
- Others (Cholesterol detection, Sodium detection, and Alcohol detection)
By end-user
- Hospitals
- Ophthalmology Clinics
- Home Care Settings
Growth Opportunity
Potential Expansion of the Smart Contact Lenses Market Through Technology, Innovation, and Targeted Services
In a unique way, the smart contact lenses market has the potential to revolutionize healthcare and the way we interact with technology. With significant advancements in wearables and health technology, smart contact lenses offer numerous unrealized benefits and opportunities. By 2025, the global market for smart contact lenses is anticipated to reach $22.6 billion. Expansion into new geographies, the introduction of new features and functionalities, subscription-based service models, targeted solutions for aging populations, and ancillary services to enhance the customer experience are just some of the opportunities that will drive innovation and growth in this industry.
Implementing New Functionality
New capabilities are also essential growth drivers for smart contact lenses. The incorporation of vital diagnostic tools into contact lenses enables users to monitor vital signs and chronic medical conditions in real time. Using smart contact lenses makes the diagnosis, treatment, and monitoring of medical conditions less invasive and more comfortable than traditional methods. This enables patients to manage their health in a nonintrusive manner more effectively.
Latest Trends
Myopia and Other Vision Disorders Are Becoming More Common
Myopia, also known as nearsightedness, has become a prevalent vision condition, particularly among adolescents. According to a study conducted by the National Eye Institute, nearsightedness has increased from 25% in the early 1970s to 42% today. By monitoring changes in the eye's refractive power, smart contact lenses are a promising method for treating myopia and other visual disorders.
Increasing demand for remote monitoring of patients
Because of their ability to monitor patient health parameters in real-time, smart contact lenses have garnered interest from the medical community. In this COVID-19 era, where social distancing is the norm, remote patient monitoring solutions are in high demand. Smart contact lenses can be used to monitor everything from the glucose levels of diabetic patients to the hydration levels of athletes, enabling physicians and clinicians to make more informed decisions regarding patient care.
Increasing Healthcare Investments and Expenditures
Governments and private companies invest significantly in research and development, resulting in a rise in healthcare expenditures and investments worldwide. With the introduction of new products and the globalization of the market, the smart contact lenses market is anticipated to grow significantly in the coming years. Increasing investments in R&D are anticipated to stimulate market growth and innovation, thereby enhancing the capabilities of these lenses.
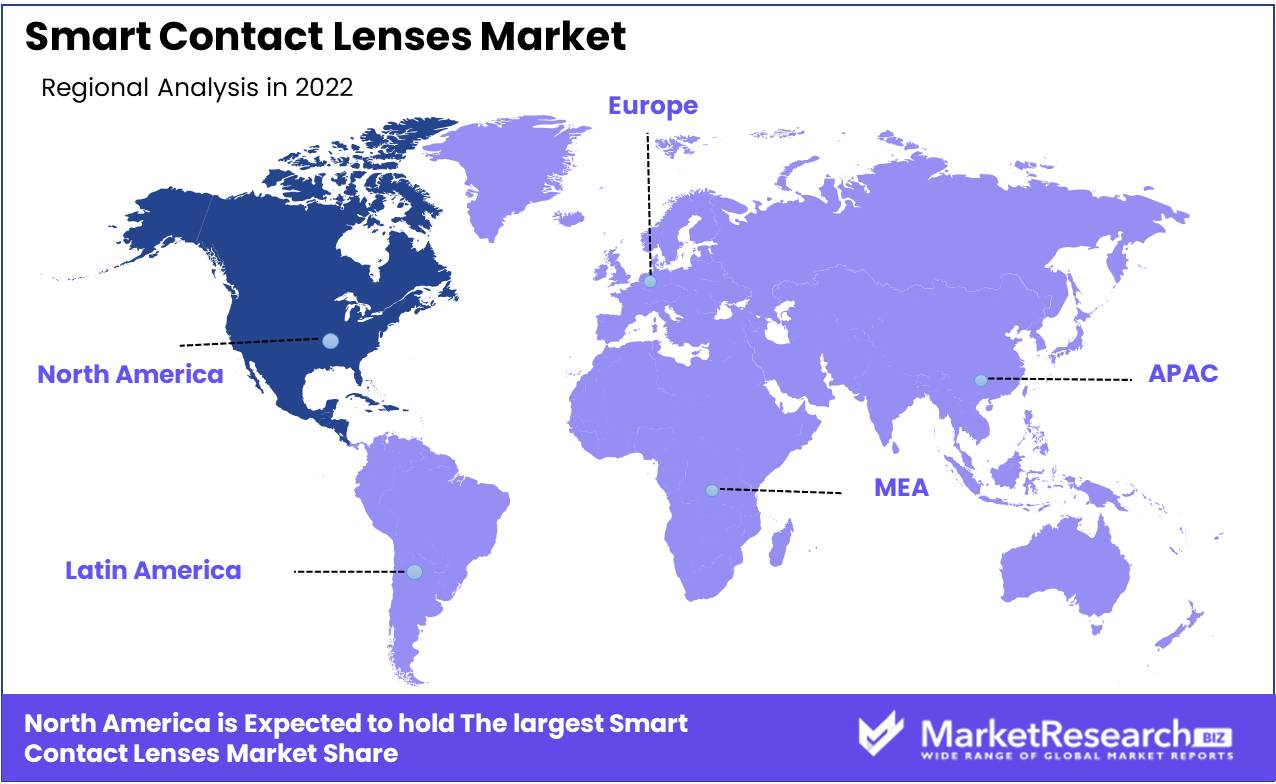
Regional Analysis
North America has always been a center of entrepreneurship, innovation, and expansion. Over the years, the market size in this region has increased exponentially. According to recent reports, North America dominated the market in 2020
The purpose of this article is to provide readers with a thorough understanding of the market size in North America, the factors that have contributed to its growth, and the market's future prospects.
North America's market size has experienced unprecedented growth over the past decade. This expansion is primarily due to the thriving e-commerce industry. The growth of online shopping has resulted in a rise in the number of businesses operating in the region, leading to an increase in demand for logistics and warehouse services.
Additionally, the growing adoption of digital technologies by businesses has increased the demand for IT services. This has contributed to the expansion of the North American market.
Key Regions and Countries
North America
- US
- Canada
- Mexico
Western Europe
- Germany
- France
- The UK
- Spain
- Italy
- Portugal
- Ireland
- Austria
- Switzerland
- Benelux
- Nordic
- Rest of Western Europe
Eastern Europe
- Russia
- Poland
- The Czech Republic
- Greece
- Rest of Eastern Europe
APAC
- China
- Japan
- South Korea
- India
- Australia & New Zealand
- Indonesia
- Malaysia
- Philippines
- Singapore
- Thailand
- Vietnam
- Rest of APAC
Latin America
- Brazil
- Colombia
- Chile
- Argentina
- Costa Rica
- Rest of Latin America
Middle East & Africa
- Algeria
- Egypt
- Israel
- Kuwait
- Nigeria
- Saudi Arabia
- South Africa
- Turkey
- United Arab Emirates
- Rest of MEA
Key Players Analysis
Numerous prominent competitors have made their mark in the smart contact lenses market, which is rising rapidly. Google has spent over four years developing smart contact lenses. Google's smart contact lens continuously monitors glucose levels for diabetics. Samsung, Sony, Novartis, and J&J are other market leaders.
Samsung's smart contact lenses track reading, TV, and phone use. Sony's unique iris measurement technology can unlock gadgets and control them via eye tracking.
Novartis and J&J are healthcare giants. Novartis is creating a presbyopia-correcting smart contact lens. Johnson & Johnson is developing electronic-correcting smart contact lenses.
Smart contact lenses could revolutionize healthcare by monitoring chronic illnesses like diabetes and correcting vision. These significant players will determine the future of smart contact lenses and how they might improve people's lives as the market grows.
Top Key Players in Smart Contact Lenses Market
- Sony
- Samsung
- Sensimed AG
- Nuravision
- Liner Technologies
- Alcon Vision LLC
- Mojo Vision Inc.
- Innovega Inc.
- Other
Recent Development
- 2021: Mojo Vision, a renowned smart contact lens developer, made headlines in September 2021 when it announced a successful Series B funding round. The company raised a whopping $51 million, cementing its position as one of the leading players in the smart contact lens market.
- In August 2021, researchers at the University of California San Diego made a breakthrough in the development of smart contact lenses. They created a lens that can measure glucose levels in tears, providing an innovative solution for diabetes management.
- 2021: The University of Surrey made a similar progress in June 2021 by announcing the development of a smart contact lens that can monitor intraocular pressure, a key indicator of glaucoma. This development can help prevent vision loss in patients by allowing for early detection and treatment.
- In March 2021, the US Food and Drug Administration (FDA) approved the first smart contact lens for use in the United States. This milestone offers new options for people with ocular conditions, such as presbyopia, that require visual assistance with everyday activities.
Report Scope
Report Features Description Market Value (2022) USD 2.2 Bn Forecast Revenue (2032) USD 6.2 Bn CAGR (2023-2032) 11.2% Base Year for Estimation 2022 Historic Period 2016-2022 Forecast Period 2023-2032 Report Coverage Revenue Forecast, Market Dynamics, COVID-19 Impact, Competitive Landscape, Recent Developments Segments Covered by product type:Continuous Glucose Monitoring, Intraocular Pressure Monitoring, Others (Cholesterol detection, Sodium detection, and Alcohol detection). by end-user: Hospitals, Ophthalmology Clinics, Home Care Settings Regional Analysis North America – The US, Canada, & Mexico; Western Europe – Germany, France, The UK, Spain, Italy, Portugal, Ireland, Austria, Switzerland, Benelux, Nordic, & Rest of Western Europe; Eastern Europe – Russia, Poland, The Czech Republic, Greece, & Rest of Eastern Europe; APAC – China, Japan, South Korea, India, Australia & New Zealand, Indonesia, Malaysia, Philippines, Singapore, Thailand, Vietnam, & Rest of APAC; Latin America – Brazil, Colombia, Chile, Argentina, Costa Rica, & Rest of Latin America; Middle East & Africa – Algeria, Egypt, Israel, Kuwait, Nigeria, Saudi Arabia, South Africa, Turkey, United Arab Emirates, & Rest of MEA Competitive Landscape Google, Sony, Samsung, Sensimed AG, Nuravision, Liner Technologies, Alcon Vision LLC, Mojo Vision Inc., Innovega Inc., Other Customization Scope Customization for segments, region/country-level will be provided. Moreover, additional customization can be done based on the requirements. Purchase Options We have three licenses to opt for: Single User License, Multi-User License (Up to 5 Users), Corporate Use License (Unlimited User and Printable PDF) -
- 1. Executive Summary
- 1.1. Definition
- 1.2. Taxonomy
- 1.3. Research Scope
- 1.4. Key Analysis
- 1.5. Key Findings by Major Segments
- 1.6. Top strategies by Major Players
- 2. Global Smart Contact Lenses Market Overview
- 2.1. Smart Contact Lenses Market Dynamics
- 2.1.1. Drivers
- 2.1.2. Opportunities
- 2.1.3. Restraints
- 2.1.4. Challenges
- 2.2. Macro-economic Factors
- 2.3. Regulatory Framework
- 2.4. Market Investment Feasibility Index
- 2.5. PEST Analysis
- 2.6. PORTER’S Five Force Analysis
- 2.7. Drivers & Restraints Impact Analysis
- 2.8. Industry Chain Analysis
- 2.9. Cost Structure Analysis
- 2.10. Marketing Strategy
- 2.11. Russia-Ukraine War Impact Analysis
- 2.12. Opportunity Map Analysis
- 2.13. Market Competition Scenario Analysis
- 2.14. Product Life Cycle Analysis
- 2.15. Opportunity Orbits
- 2.16. Manufacturer Intensity Map
- 2.17. Major Companies sales by Value & Volume
- 2.1. Smart Contact Lenses Market Dynamics
- 3. Global Smart Contact Lenses Market Analysis, Opportunity and Forecast, 2016-2032
- 3.1. Global Smart Contact Lenses Market Analysis, 2016-2021
- 3.2. Global Smart Contact Lenses Market Opportunity and Forecast, 2023-2032
- 3.3. Global Smart Contact Lenses Market Analysis, Opportunity and Forecast, By Segmentation by product type:, 2016-2032
- 3.3.1. Global Smart Contact Lenses Market Analysis by Segmentation by product type:: Introduction
- 3.3.2. Market Size Absolute $ Opportunity Analysis and Forecast, By Segmentation by product type:, 2016-2032
- 3.3.3. Continuous Glucose Monitoring
- 3.3.4. Intraocular Pressure Monitoring
- 3.3.5. Others (Cholesterol detection, Sodium detection, and Alcohol detection)
- 3.4. Global Smart Contact Lenses Market Analysis, Opportunity and Forecast, By End-User, 2016-2032
- 3.4.1. Global Smart Contact Lenses Market Analysis by End-User: Introduction
- 3.4.2. Market Size Absolute $ Opportunity Analysis and Forecast, By End-User, 2016-2032
- 3.4.3. Hospitals
- 3.4.4. Clinics
- 3.4.5. Home Care Settings
- 4. North America Smart Contact Lenses Market Analysis, Opportunity and Forecast, 2016-2032
- 4.1. North America Smart Contact Lenses Market Analysis, 2016-2021
- 4.2. North America Smart Contact Lenses Market Opportunity and Forecast, 2023-2032
- 4.3. North America Smart Contact Lenses Market Analysis, Opportunity and Forecast, By Segmentation by product type:, 2016-2032
- 4.3.1. North America Smart Contact Lenses Market Analysis by Segmentation by product type:: Introduction
- 4.3.2. Market Size Absolute $ Opportunity Analysis and Forecast, By Segmentation by product type:, 2016-2032
- 4.3.3. Continuous Glucose Monitoring
- 4.3.4. Intraocular Pressure Monitoring
- 4.3.5. Others (Cholesterol detection, Sodium detection, and Alcohol detection)
- 4.4. North America Smart Contact Lenses Market Analysis, Opportunity and Forecast, By End-User, 2016-2032
- 4.4.1. North America Smart Contact Lenses Market Analysis by End-User: Introduction
- 4.4.2. Market Size Absolute $ Opportunity Analysis and Forecast, By End-User, 2016-2032
- 4.4.3. Hospitals
- 4.4.4. Clinics
- 4.4.5. Home Care Settings
- 4.5. North America Smart Contact Lenses Market Analysis, Opportunity and Forecast, By Country , 2016-2032
- 4.5.1. North America Smart Contact Lenses Market Analysis by Country : Introduction
- 4.5.2. Market Size Absolute $ Opportunity Analysis and Forecast, Country , 2016-2032
- 4.5.2.1. The US
- 4.5.2.2. Canada
- 4.5.2.3. Mexico
- 5. Western Europe Smart Contact Lenses Market Analysis, Opportunity and Forecast, 2016-2032
- 5.1. Western Europe Smart Contact Lenses Market Analysis, 2016-2021
- 5.2. Western Europe Smart Contact Lenses Market Opportunity and Forecast, 2023-2032
- 5.3. Western Europe Smart Contact Lenses Market Analysis, Opportunity and Forecast, By Segmentation by product type:, 2016-2032
- 5.3.1. Western Europe Smart Contact Lenses Market Analysis by Segmentation by product type:: Introduction
- 5.3.2. Market Size Absolute $ Opportunity Analysis and Forecast, By Segmentation by product type:, 2016-2032
- 5.3.3. Continuous Glucose Monitoring
- 5.3.4. Intraocular Pressure Monitoring
- 5.3.5. Others (Cholesterol detection, Sodium detection, and Alcohol detection)
- 5.4. Western Europe Smart Contact Lenses Market Analysis, Opportunity and Forecast, By End-User, 2016-2032
- 5.4.1. Western Europe Smart Contact Lenses Market Analysis by End-User: Introduction
- 5.4.2. Market Size Absolute $ Opportunity Analysis and Forecast, By End-User, 2016-2032
- 5.4.3. Hospitals
- 5.4.4. Clinics
- 5.4.5. Home Care Settings
- 5.5. Western Europe Smart Contact Lenses Market Analysis, Opportunity and Forecast, By Country , 2016-2032
- 5.5.1. Western Europe Smart Contact Lenses Market Analysis by Country : Introduction
- 5.5.2. Market Size Absolute $ Opportunity Analysis and Forecast, Country , 2016-2032
- 5.5.2.1. Germany
- 5.5.2.2. France
- 5.5.2.3. The UK
- 5.5.2.4. Spain
- 5.5.2.5. Italy
- 5.5.2.6. Portugal
- 5.5.2.7. Ireland
- 5.5.2.8. Austria
- 5.5.2.9. Switzerland
- 5.5.2.10. Benelux
- 5.5.2.11. Nordic
- 5.5.2.12. Rest of Western Europe
- 6. Eastern Europe Smart Contact Lenses Market Analysis, Opportunity and Forecast, 2016-2032
- 6.1. Eastern Europe Smart Contact Lenses Market Analysis, 2016-2021
- 6.2. Eastern Europe Smart Contact Lenses Market Opportunity and Forecast, 2023-2032
- 6.3. Eastern Europe Smart Contact Lenses Market Analysis, Opportunity and Forecast, By Segmentation by product type:, 2016-2032
- 6.3.1. Eastern Europe Smart Contact Lenses Market Analysis by Segmentation by product type:: Introduction
- 6.3.2. Market Size Absolute $ Opportunity Analysis and Forecast, By Segmentation by product type:, 2016-2032
- 6.3.3. Continuous Glucose Monitoring
- 6.3.4. Intraocular Pressure Monitoring
- 6.3.5. Others (Cholesterol detection, Sodium detection, and Alcohol detection)
- 6.4. Eastern Europe Smart Contact Lenses Market Analysis, Opportunity and Forecast, By End-User, 2016-2032
- 6.4.1. Eastern Europe Smart Contact Lenses Market Analysis by End-User: Introduction
- 6.4.2. Market Size Absolute $ Opportunity Analysis and Forecast, By End-User, 2016-2032
- 6.4.3. Hospitals
- 6.4.4. Clinics
- 6.4.5. Home Care Settings
- 6.5. Eastern Europe Smart Contact Lenses Market Analysis, Opportunity and Forecast, By Country , 2016-2032
- 6.5.1. Eastern Europe Smart Contact Lenses Market Analysis by Country : Introduction
- 6.5.2. Market Size Absolute $ Opportunity Analysis and Forecast, Country , 2016-2032
- 6.5.2.1. Russia
- 6.5.2.2. Poland
- 6.5.2.3. The Czech Republic
- 6.5.2.4. Greece
- 6.5.2.5. Rest of Eastern Europe
- 7. APAC Smart Contact Lenses Market Analysis, Opportunity and Forecast, 2016-2032
- 7.1. APAC Smart Contact Lenses Market Analysis, 2016-2021
- 7.2. APAC Smart Contact Lenses Market Opportunity and Forecast, 2023-2032
- 7.3. APAC Smart Contact Lenses Market Analysis, Opportunity and Forecast, By Segmentation by product type:, 2016-2032
- 7.3.1. APAC Smart Contact Lenses Market Analysis by Segmentation by product type:: Introduction
- 7.3.2. Market Size Absolute $ Opportunity Analysis and Forecast, By Segmentation by product type:, 2016-2032
- 7.3.3. Continuous Glucose Monitoring
- 7.3.4. Intraocular Pressure Monitoring
- 7.3.5. Others (Cholesterol detection, Sodium detection, and Alcohol detection)
- 7.4. APAC Smart Contact Lenses Market Analysis, Opportunity and Forecast, By End-User, 2016-2032
- 7.4.1. APAC Smart Contact Lenses Market Analysis by End-User: Introduction
- 7.4.2. Market Size Absolute $ Opportunity Analysis and Forecast, By End-User, 2016-2032
- 7.4.3. Hospitals
- 7.4.4. Clinics
- 7.4.5. Home Care Settings
- 7.5. APAC Smart Contact Lenses Market Analysis, Opportunity and Forecast, By Country , 2016-2032
- 7.5.1. APAC Smart Contact Lenses Market Analysis by Country : Introduction
- 7.5.2. Market Size Absolute $ Opportunity Analysis and Forecast, Country , 2016-2032
- 7.5.2.1. China
- 7.5.2.2. Japan
- 7.5.2.3. South Korea
- 7.5.2.4. India
- 7.5.2.5. Australia & New Zeland
- 7.5.2.6. Indonesia
- 7.5.2.7. Malaysia
- 7.5.2.8. Philippines
- 7.5.2.9. Singapore
- 7.5.2.10. Thailand
- 7.5.2.11. Vietnam
- 7.5.2.12. Rest of APAC
- 8. Latin America Smart Contact Lenses Market Analysis, Opportunity and Forecast, 2016-2032
- 8.1. Latin America Smart Contact Lenses Market Analysis, 2016-2021
- 8.2. Latin America Smart Contact Lenses Market Opportunity and Forecast, 2023-2032
- 8.3. Latin America Smart Contact Lenses Market Analysis, Opportunity and Forecast, By Segmentation by product type:, 2016-2032
- 8.3.1. Latin America Smart Contact Lenses Market Analysis by Segmentation by product type:: Introduction
- 8.3.2. Market Size Absolute $ Opportunity Analysis and Forecast, By Segmentation by product type:, 2016-2032
- 8.3.3. Continuous Glucose Monitoring
- 8.3.4. Intraocular Pressure Monitoring
- 8.3.5. Others (Cholesterol detection, Sodium detection, and Alcohol detection)
- 8.4. Latin America Smart Contact Lenses Market Analysis, Opportunity and Forecast, By End-User, 2016-2032
- 8.4.1. Latin America Smart Contact Lenses Market Analysis by End-User: Introduction
- 8.4.2. Market Size Absolute $ Opportunity Analysis and Forecast, By End-User, 2016-2032
- 8.4.3. Hospitals
- 8.4.4. Clinics
- 8.4.5. Home Care Settings
- 8.5. Latin America Smart Contact Lenses Market Analysis, Opportunity and Forecast, By Country , 2016-2032
- 8.5.1. Latin America Smart Contact Lenses Market Analysis by Country : Introduction
- 8.5.2. Market Size Absolute $ Opportunity Analysis and Forecast, Country , 2016-2032
- 8.5.2.1. Brazil
- 8.5.2.2. Colombia
- 8.5.2.3. Chile
- 8.5.2.4. Argentina
- 8.5.2.5. Costa Rica
- 8.5.2.6. Rest of Latin America
- 9. Middle East & Africa Smart Contact Lenses Market Analysis, Opportunity and Forecast, 2016-2032
- 9.1. Middle East & Africa Smart Contact Lenses Market Analysis, 2016-2021
- 9.2. Middle East & Africa Smart Contact Lenses Market Opportunity and Forecast, 2023-2032
- 9.3. Middle East & Africa Smart Contact Lenses Market Analysis, Opportunity and Forecast, By Segmentation by product type:, 2016-2032
- 9.3.1. Middle East & Africa Smart Contact Lenses Market Analysis by Segmentation by product type:: Introduction
- 9.3.2. Market Size Absolute $ Opportunity Analysis and Forecast, By Segmentation by product type:, 2016-2032
- 9.3.3. Continuous Glucose Monitoring
- 9.3.4. Intraocular Pressure Monitoring
- 9.3.5. Others (Cholesterol detection, Sodium detection, and Alcohol detection)
- 9.4. Middle East & Africa Smart Contact Lenses Market Analysis, Opportunity and Forecast, By End-User, 2016-2032
- 9.4.1. Middle East & Africa Smart Contact Lenses Market Analysis by End-User: Introduction
- 9.4.2. Market Size Absolute $ Opportunity Analysis and Forecast, By End-User, 2016-2032
- 9.4.3. Hospitals
- 9.4.4. Clinics
- 9.4.5. Home Care Settings
- 9.5. Middle East & Africa Smart Contact Lenses Market Analysis, Opportunity and Forecast, By Country , 2016-2032
- 9.5.1. Middle East & Africa Smart Contact Lenses Market Analysis by Country : Introduction
- 9.5.2. Market Size Absolute $ Opportunity Analysis and Forecast, Country , 2016-2032
- 9.5.2.1. Algeria
- 9.5.2.2. Egypt
- 9.5.2.3. Israel
- 9.5.2.4. Kuwait
- 9.5.2.5. Nigeria
- 9.5.2.6. Saudi Arabia
- 9.5.2.7. South Africa
- 9.5.2.8. Turkey
- 9.5.2.9. The UAE
- 9.5.2.10. Rest of MEA
- 10. Global Smart Contact Lenses Market Analysis, Opportunity and Forecast, By Region , 2016-2032
- 10.1. Global Smart Contact Lenses Market Analysis by Region : Introduction
- 10.2. Market Size Absolute $ Opportunity Analysis and Forecast, By Region , 2016-2032
- 10.2.1. North America
- 10.2.2. Western Europe
- 10.2.3. Eastern Europe
- 10.2.4. APAC
- 10.2.5. Latin America
- 10.2.6. Middle East & Africa
- 11. Global Smart Contact Lenses Market Competitive Landscape, Market Share Analysis, and Company Profiles
- 11.1. Market Share Analysis
- 11.2. Company Profiles
- 11.3. Google
- 11.3.1. Company Overview
- 11.3.2. Financial Highlights
- 11.3.3. Product Portfolio
- 11.3.4. SWOT Analysis
- 11.3.5. Key Strategies and Developments
- 11.4. Sony
- 11.4.1. Company Overview
- 11.4.2. Financial Highlights
- 11.4.3. Product Portfolio
- 11.4.4. SWOT Analysis
- 11.4.5. Key Strategies and Developments
- 11.5. Samsung
- 11.5.1. Company Overview
- 11.5.2. Financial Highlights
- 11.5.3. Product Portfolio
- 11.5.4. SWOT Analysis
- 11.5.5. Key Strategies and Developments
- 11.6. Sensimed AG
- 11.6.1. Company Overview
- 11.6.2. Financial Highlights
- 11.6.3. Product Portfolio
- 11.6.4. SWOT Analysis
- 11.6.5. Key Strategies and Developments
- 11.7. Nuravision
- 11.7.1. Company Overview
- 11.7.2. Financial Highlights
- 11.7.3. Product Portfolio
- 11.7.4. SWOT Analysis
- 11.7.5. Key Strategies and Developments
- 11.8. Liner Technologies
- 11.8.1. Company Overview
- 11.8.2. Financial Highlights
- 11.8.3. Product Portfolio
- 11.8.4. SWOT Analysis
- 11.8.5. Key Strategies and Developments
- 11.9. Alcon Vision LLC
- 11.9.1. Company Overview
- 11.9.2. Financial Highlights
- 11.9.3. Product Portfolio
- 11.9.4. SWOT Analysis
- 11.9.5. Key Strategies and Developments
- 11.10. Mojo Vision Inc.
- 11.10.1. Company Overview
- 11.10.2. Financial Highlights
- 11.10.3. Product Portfolio
- 11.10.4. SWOT Analysis
- 11.10.5. Key Strategies and Developments
- 11.11. Innovega Inc.
- 11.11.1. Company Overview
- 11.11.2. Financial Highlights
- 11.11.3. Product Portfolio
- 11.11.4. SWOT Analysis
- 11.11.5. Key Strategies and Developments
- 11.12. Other
- 11.12.1. Company Overview
- 11.12.2. Financial Highlights
- 11.12.3. Product Portfolio
- 11.12.4. SWOT Analysis
- 11.12.5. Key Strategies and Developments
- 12. Assumptions and Acronyms
- 13. Research Methodology
- 14. Contact
List Of Figure
-
- Figure 1: Global Smart Contact Lenses Market Revenue (US$ Mn) Market Share by Segmentation by product type: in 2022
- Figure 2: Global Smart Contact Lenses Market Attractiveness Analysis by Segmentation by product type:, 2016-2032
- Figure 3: Global Smart Contact Lenses Market Revenue (US$ Mn) Market Share by End-Userin 2022
- Figure 4: Global Smart Contact Lenses Market Attractiveness Analysis by End-User, 2016-2032
- Figure 5: Global Smart Contact Lenses Market Revenue (US$ Mn) Market Share by Region in 2022
- Figure 6: Global Smart Contact Lenses Market Attractiveness Analysis by Region, 2016-2032
- Figure 7: Global Smart Contact Lenses Market Revenue (US$ Mn) (2016-2032)
- Figure 8: Global Smart Contact Lenses Market Revenue (US$ Mn) Comparison by Region (2016-2032)
- Figure 9: Global Smart Contact Lenses Market Revenue (US$ Mn) Comparison by Segmentation by product type: (2016-2032)
- Figure 10: Global Smart Contact Lenses Market Revenue (US$ Mn) Comparison by End-User (2016-2032)
- Figure 11: Global Smart Contact Lenses Market Y-o-Y Growth Rate Comparison by Region (2016-2032)
- Figure 12: Global Smart Contact Lenses Market Y-o-Y Growth Rate Comparison by Segmentation by product type: (2016-2032)
- Figure 13: Global Smart Contact Lenses Market Y-o-Y Growth Rate Comparison by End-User (2016-2032)
- Figure 14: Global Smart Contact Lenses Market Share Comparison by Region (2016-2032)
- Figure 15: Global Smart Contact Lenses Market Share Comparison by Segmentation by product type: (2016-2032)
- Figure 16: Global Smart Contact Lenses Market Share Comparison by End-User (2016-2032)
- Figure 17: North America Smart Contact Lenses Market Revenue (US$ Mn) Market Share by Segmentation by product type:in 2022
- Figure 18: North America Smart Contact Lenses Market Attractiveness Analysis by Segmentation by product type:, 2016-2032
- Figure 19: North America Smart Contact Lenses Market Revenue (US$ Mn) Market Share by End-Userin 2022
- Figure 20: North America Smart Contact Lenses Market Attractiveness Analysis by End-User, 2016-2032
- Figure 21: North America Smart Contact Lenses Market Revenue (US$ Mn) Market Share by Country in 2022
- Figure 22: North America Smart Contact Lenses Market Attractiveness Analysis by Country, 2016-2032
- Figure 23: North America Smart Contact Lenses Market Revenue (US$ Mn) (2016-2032)
- Figure 24: North America Smart Contact Lenses Market Revenue (US$ Mn) Comparison by Country (2016-2032)
- Figure 25: North America Smart Contact Lenses Market Revenue (US$ Mn) Comparison by Segmentation by product type: (2016-2032)
- Figure 26: North America Smart Contact Lenses Market Revenue (US$ Mn) Comparison by End-User (2016-2032)
- Figure 27: North America Smart Contact Lenses Market Y-o-Y Growth Rate Comparison by Country (2016-2032)
- Figure 28: North America Smart Contact Lenses Market Y-o-Y Growth Rate Comparison by Segmentation by product type: (2016-2032)
- Figure 29: North America Smart Contact Lenses Market Y-o-Y Growth Rate Comparison by End-User (2016-2032)
- Figure 30: North America Smart Contact Lenses Market Share Comparison by Country (2016-2032)
- Figure 31: North America Smart Contact Lenses Market Share Comparison by Segmentation by product type: (2016-2032)
- Figure 32: North America Smart Contact Lenses Market Share Comparison by End-User (2016-2032)
- Figure 33: Western Europe Smart Contact Lenses Market Revenue (US$ Mn) Market Share by Segmentation by product type:in 2022
- Figure 34: Western Europe Smart Contact Lenses Market Attractiveness Analysis by Segmentation by product type:, 2016-2032
- Figure 35: Western Europe Smart Contact Lenses Market Revenue (US$ Mn) Market Share by End-Userin 2022
- Figure 36: Western Europe Smart Contact Lenses Market Attractiveness Analysis by End-User, 2016-2032
- Figure 37: Western Europe Smart Contact Lenses Market Revenue (US$ Mn) Market Share by Country in 2022
- Figure 38: Western Europe Smart Contact Lenses Market Attractiveness Analysis by Country, 2016-2032
- Figure 39: Western Europe Smart Contact Lenses Market Revenue (US$ Mn) (2016-2032)
- Figure 40: Western Europe Smart Contact Lenses Market Revenue (US$ Mn) Comparison by Country (2016-2032)
- Figure 41: Western Europe Smart Contact Lenses Market Revenue (US$ Mn) Comparison by Segmentation by product type: (2016-2032)
- Figure 42: Western Europe Smart Contact Lenses Market Revenue (US$ Mn) Comparison by End-User (2016-2032)
- Figure 43: Western Europe Smart Contact Lenses Market Y-o-Y Growth Rate Comparison by Country (2016-2032)
- Figure 44: Western Europe Smart Contact Lenses Market Y-o-Y Growth Rate Comparison by Segmentation by product type: (2016-2032)
- Figure 45: Western Europe Smart Contact Lenses Market Y-o-Y Growth Rate Comparison by End-User (2016-2032)
- Figure 46: Western Europe Smart Contact Lenses Market Share Comparison by Country (2016-2032)
- Figure 47: Western Europe Smart Contact Lenses Market Share Comparison by Segmentation by product type: (2016-2032)
- Figure 48: Western Europe Smart Contact Lenses Market Share Comparison by End-User (2016-2032)
- Figure 49: Eastern Europe Smart Contact Lenses Market Revenue (US$ Mn) Market Share by Segmentation by product type:in 2022
- Figure 50: Eastern Europe Smart Contact Lenses Market Attractiveness Analysis by Segmentation by product type:, 2016-2032
- Figure 51: Eastern Europe Smart Contact Lenses Market Revenue (US$ Mn) Market Share by End-Userin 2022
- Figure 52: Eastern Europe Smart Contact Lenses Market Attractiveness Analysis by End-User, 2016-2032
- Figure 53: Eastern Europe Smart Contact Lenses Market Revenue (US$ Mn) Market Share by Country in 2022
- Figure 54: Eastern Europe Smart Contact Lenses Market Attractiveness Analysis by Country, 2016-2032
- Figure 55: Eastern Europe Smart Contact Lenses Market Revenue (US$ Mn) (2016-2032)
- Figure 56: Eastern Europe Smart Contact Lenses Market Revenue (US$ Mn) Comparison by Country (2016-2032)
- Figure 57: Eastern Europe Smart Contact Lenses Market Revenue (US$ Mn) Comparison by Segmentation by product type: (2016-2032)
- Figure 58: Eastern Europe Smart Contact Lenses Market Revenue (US$ Mn) Comparison by End-User (2016-2032)
- Figure 59: Eastern Europe Smart Contact Lenses Market Y-o-Y Growth Rate Comparison by Country (2016-2032)
- Figure 60: Eastern Europe Smart Contact Lenses Market Y-o-Y Growth Rate Comparison by Segmentation by product type: (2016-2032)
- Figure 61: Eastern Europe Smart Contact Lenses Market Y-o-Y Growth Rate Comparison by End-User (2016-2032)
- Figure 62: Eastern Europe Smart Contact Lenses Market Share Comparison by Country (2016-2032)
- Figure 63: Eastern Europe Smart Contact Lenses Market Share Comparison by Segmentation by product type: (2016-2032)
- Figure 64: Eastern Europe Smart Contact Lenses Market Share Comparison by End-User (2016-2032)
- Figure 65: APAC Smart Contact Lenses Market Revenue (US$ Mn) Market Share by Segmentation by product type:in 2022
- Figure 66: APAC Smart Contact Lenses Market Attractiveness Analysis by Segmentation by product type:, 2016-2032
- Figure 67: APAC Smart Contact Lenses Market Revenue (US$ Mn) Market Share by End-Userin 2022
- Figure 68: APAC Smart Contact Lenses Market Attractiveness Analysis by End-User, 2016-2032
- Figure 69: APAC Smart Contact Lenses Market Revenue (US$ Mn) Market Share by Country in 2022
- Figure 70: APAC Smart Contact Lenses Market Attractiveness Analysis by Country, 2016-2032
- Figure 71: APAC Smart Contact Lenses Market Revenue (US$ Mn) (2016-2032)
- Figure 72: APAC Smart Contact Lenses Market Revenue (US$ Mn) Comparison by Country (2016-2032)
- Figure 73: APAC Smart Contact Lenses Market Revenue (US$ Mn) Comparison by Segmentation by product type: (2016-2032)
- Figure 74: APAC Smart Contact Lenses Market Revenue (US$ Mn) Comparison by End-User (2016-2032)
- Figure 75: APAC Smart Contact Lenses Market Y-o-Y Growth Rate Comparison by Country (2016-2032)
- Figure 76: APAC Smart Contact Lenses Market Y-o-Y Growth Rate Comparison by Segmentation by product type: (2016-2032)
- Figure 77: APAC Smart Contact Lenses Market Y-o-Y Growth Rate Comparison by End-User (2016-2032)
- Figure 78: APAC Smart Contact Lenses Market Share Comparison by Country (2016-2032)
- Figure 79: APAC Smart Contact Lenses Market Share Comparison by Segmentation by product type: (2016-2032)
- Figure 80: APAC Smart Contact Lenses Market Share Comparison by End-User (2016-2032)
- Figure 81: Latin America Smart Contact Lenses Market Revenue (US$ Mn) Market Share by Segmentation by product type:in 2022
- Figure 82: Latin America Smart Contact Lenses Market Attractiveness Analysis by Segmentation by product type:, 2016-2032
- Figure 83: Latin America Smart Contact Lenses Market Revenue (US$ Mn) Market Share by End-Userin 2022
- Figure 84: Latin America Smart Contact Lenses Market Attractiveness Analysis by End-User, 2016-2032
- Figure 85: Latin America Smart Contact Lenses Market Revenue (US$ Mn) Market Share by Country in 2022
- Figure 86: Latin America Smart Contact Lenses Market Attractiveness Analysis by Country, 2016-2032
- Figure 87: Latin America Smart Contact Lenses Market Revenue (US$ Mn) (2016-2032)
- Figure 88: Latin America Smart Contact Lenses Market Revenue (US$ Mn) Comparison by Country (2016-2032)
- Figure 89: Latin America Smart Contact Lenses Market Revenue (US$ Mn) Comparison by Segmentation by product type: (2016-2032)
- Figure 90: Latin America Smart Contact Lenses Market Revenue (US$ Mn) Comparison by End-User (2016-2032)
- Figure 91: Latin America Smart Contact Lenses Market Y-o-Y Growth Rate Comparison by Country (2016-2032)
- Figure 92: Latin America Smart Contact Lenses Market Y-o-Y Growth Rate Comparison by Segmentation by product type: (2016-2032)
- Figure 93: Latin America Smart Contact Lenses Market Y-o-Y Growth Rate Comparison by End-User (2016-2032)
- Figure 94: Latin America Smart Contact Lenses Market Share Comparison by Country (2016-2032)
- Figure 95: Latin America Smart Contact Lenses Market Share Comparison by Segmentation by product type: (2016-2032)
- Figure 96: Latin America Smart Contact Lenses Market Share Comparison by End-User (2016-2032)
- Figure 97: Middle East & Africa Smart Contact Lenses Market Revenue (US$ Mn) Market Share by Segmentation by product type:in 2022
- Figure 98: Middle East & Africa Smart Contact Lenses Market Attractiveness Analysis by Segmentation by product type:, 2016-2032
- Figure 99: Middle East & Africa Smart Contact Lenses Market Revenue (US$ Mn) Market Share by End-Userin 2022
- Figure 100: Middle East & Africa Smart Contact Lenses Market Attractiveness Analysis by End-User, 2016-2032
- Figure 101: Middle East & Africa Smart Contact Lenses Market Revenue (US$ Mn) Market Share by Country in 2022
- Figure 102: Middle East & Africa Smart Contact Lenses Market Attractiveness Analysis by Country, 2016-2032
- Figure 103: Middle East & Africa Smart Contact Lenses Market Revenue (US$ Mn) (2016-2032)
- Figure 104: Middle East & Africa Smart Contact Lenses Market Revenue (US$ Mn) Comparison by Country (2016-2032)
- Figure 105: Middle East & Africa Smart Contact Lenses Market Revenue (US$ Mn) Comparison by Segmentation by product type: (2016-2032)
- Figure 106: Middle East & Africa Smart Contact Lenses Market Revenue (US$ Mn) Comparison by End-User (2016-2032)
- Figure 107: Middle East & Africa Smart Contact Lenses Market Y-o-Y Growth Rate Comparison by Country (2016-2032)
- Figure 108: Middle East & Africa Smart Contact Lenses Market Y-o-Y Growth Rate Comparison by Segmentation by product type: (2016-2032)
- Figure 109: Middle East & Africa Smart Contact Lenses Market Y-o-Y Growth Rate Comparison by End-User (2016-2032)
- Figure 110: Middle East & Africa Smart Contact Lenses Market Share Comparison by Country (2016-2032)
- Figure 111: Middle East & Africa Smart Contact Lenses Market Share Comparison by Segmentation by product type: (2016-2032)
- Figure 112: Middle East & Africa Smart Contact Lenses Market Share Comparison by End-User (2016-2032)List of Figures
- List of Tables
- "
- Table 1: Global Smart Contact Lenses Market Comparison by Segmentation by product type: (2016-2032)
- Table 2: Global Smart Contact Lenses Market Comparison by End-User (2016-2032)
- Table 3: Global Smart Contact Lenses Market Revenue (US$ Mn) Comparison by Region (2016-2032)
- Table 4: Global Smart Contact Lenses Market Revenue (US$ Mn) (2016-2032)
- Table 5: Global Smart Contact Lenses Market Revenue (US$ Mn) Comparison by Region (2016-2032)
- Table 6: Global Smart Contact Lenses Market Revenue (US$ Mn) Comparison by Segmentation by product type: (2016-2032)
- Table 7: Global Smart Contact Lenses Market Revenue (US$ Mn) Comparison by End-User (2016-2032)
- Table 8: Global Smart Contact Lenses Market Y-o-Y Growth Rate Comparison by Region (2016-2032)
- Table 9: Global Smart Contact Lenses Market Y-o-Y Growth Rate Comparison by Segmentation by product type: (2016-2032)
- Table 10: Global Smart Contact Lenses Market Y-o-Y Growth Rate Comparison by End-User (2016-2032)
- Table 11: Global Smart Contact Lenses Market Share Comparison by Region (2016-2032)
- Table 12: Global Smart Contact Lenses Market Share Comparison by Segmentation by product type: (2016-2032)
- Table 13: Global Smart Contact Lenses Market Share Comparison by End-User (2016-2032)
- Table 14: North America Smart Contact Lenses Market Comparison by End-User (2016-2032)
- Table 15: North America Smart Contact Lenses Market Revenue (US$ Mn) Comparison by Country (2016-2032)
- Table 16: North America Smart Contact Lenses Market Revenue (US$ Mn) (2016-2032)
- Table 17: North America Smart Contact Lenses Market Revenue (US$ Mn) Comparison by Country (2016-2032)
- Table 18: North America Smart Contact Lenses Market Revenue (US$ Mn) Comparison by Segmentation by product type: (2016-2032)
- Table 19: North America Smart Contact Lenses Market Revenue (US$ Mn) Comparison by End-User (2016-2032)
- Table 20: North America Smart Contact Lenses Market Y-o-Y Growth Rate Comparison by Country (2016-2032)
- Table 21: North America Smart Contact Lenses Market Y-o-Y Growth Rate Comparison by Segmentation by product type: (2016-2032)
- Table 22: North America Smart Contact Lenses Market Y-o-Y Growth Rate Comparison by End-User (2016-2032)
- Table 23: North America Smart Contact Lenses Market Share Comparison by Country (2016-2032)
- Table 24: North America Smart Contact Lenses Market Share Comparison by Segmentation by product type: (2016-2032)
- Table 25: North America Smart Contact Lenses Market Share Comparison by End-User (2016-2032)
- Table 26: Western Europe Smart Contact Lenses Market Comparison by Segmentation by product type: (2016-2032)
- Table 27: Western Europe Smart Contact Lenses Market Comparison by End-User (2016-2032)
- Table 28: Western Europe Smart Contact Lenses Market Revenue (US$ Mn) Comparison by Country (2016-2032)
- Table 29: Western Europe Smart Contact Lenses Market Revenue (US$ Mn) (2016-2032)
- Table 30: Western Europe Smart Contact Lenses Market Revenue (US$ Mn) Comparison by Country (2016-2032)
- Table 31: Western Europe Smart Contact Lenses Market Revenue (US$ Mn) Comparison by Segmentation by product type: (2016-2032)
- Table 32: Western Europe Smart Contact Lenses Market Revenue (US$ Mn) Comparison by End-User (2016-2032)
- Table 33: Western Europe Smart Contact Lenses Market Y-o-Y Growth Rate Comparison by Country (2016-2032)
- Table 34: Western Europe Smart Contact Lenses Market Y-o-Y Growth Rate Comparison by Segmentation by product type: (2016-2032)
- Table 35: Western Europe Smart Contact Lenses Market Y-o-Y Growth Rate Comparison by End-User (2016-2032)
- Table 36: Western Europe Smart Contact Lenses Market Share Comparison by Country (2016-2032)
- Table 37: Western Europe Smart Contact Lenses Market Share Comparison by Segmentation by product type: (2016-2032)
- Table 38: Western Europe Smart Contact Lenses Market Share Comparison by End-User (2016-2032)
- Table 39: Eastern Europe Smart Contact Lenses Market Comparison by Segmentation by product type: (2016-2032)
- Table 40: Eastern Europe Smart Contact Lenses Market Comparison by End-User (2016-2032)
- Table 41: Eastern Europe Smart Contact Lenses Market Revenue (US$ Mn) Comparison by Country (2016-2032)
- Table 42: Eastern Europe Smart Contact Lenses Market Revenue (US$ Mn) (2016-2032)
- Table 43: Eastern Europe Smart Contact Lenses Market Revenue (US$ Mn) Comparison by Country (2016-2032)
- Table 44: Eastern Europe Smart Contact Lenses Market Revenue (US$ Mn) Comparison by Segmentation by product type: (2016-2032)
- Table 45: Eastern Europe Smart Contact Lenses Market Revenue (US$ Mn) Comparison by End-User (2016-2032)
- Table 46: Eastern Europe Smart Contact Lenses Market Y-o-Y Growth Rate Comparison by Country (2016-2032)
- Table 47: Eastern Europe Smart Contact Lenses Market Y-o-Y Growth Rate Comparison by Segmentation by product type: (2016-2032)
- Table 48: Eastern Europe Smart Contact Lenses Market Y-o-Y Growth Rate Comparison by End-User (2016-2032)
- Table 49: Eastern Europe Smart Contact Lenses Market Share Comparison by Country (2016-2032)
- Table 50: Eastern Europe Smart Contact Lenses Market Share Comparison by Segmentation by product type: (2016-2032)
- Table 51: Eastern Europe Smart Contact Lenses Market Share Comparison by End-User (2016-2032)
- Table 52: APAC Smart Contact Lenses Market Comparison by Segmentation by product type: (2016-2032)
- Table 53: APAC Smart Contact Lenses Market Comparison by End-User (2016-2032)
- Table 54: APAC Smart Contact Lenses Market Revenue (US$ Mn) Comparison by Country (2016-2032)
- Table 55: APAC Smart Contact Lenses Market Revenue (US$ Mn) (2016-2032)
- Table 56: APAC Smart Contact Lenses Market Revenue (US$ Mn) Comparison by Country (2016-2032)
- Table 57: APAC Smart Contact Lenses Market Revenue (US$ Mn) Comparison by Segmentation by product type: (2016-2032)
- Table 58: APAC Smart Contact Lenses Market Revenue (US$ Mn) Comparison by End-User (2016-2032)
- Table 59: APAC Smart Contact Lenses Market Y-o-Y Growth Rate Comparison by Country (2016-2032)
- Table 60: APAC Smart Contact Lenses Market Y-o-Y Growth Rate Comparison by Segmentation by product type: (2016-2032)
- Table 61: APAC Smart Contact Lenses Market Y-o-Y Growth Rate Comparison by End-User (2016-2032)
- Table 62: APAC Smart Contact Lenses Market Share Comparison by Country (2016-2032)
- Table 63: APAC Smart Contact Lenses Market Share Comparison by Segmentation by product type: (2016-2032)
- Table 64: APAC Smart Contact Lenses Market Share Comparison by End-User (2016-2032)
- Table 65: Latin America Smart Contact Lenses Market Comparison by Segmentation by product type: (2016-2032)
- Table 66: Latin America Smart Contact Lenses Market Comparison by End-User (2016-2032)
- Table 67: Latin America Smart Contact Lenses Market Revenue (US$ Mn) Comparison by Country (2016-2032)
- Table 68: Latin America Smart Contact Lenses Market Revenue (US$ Mn) (2016-2032)
- Table 69: Latin America Smart Contact Lenses Market Revenue (US$ Mn) Comparison by Country (2016-2032)
- Table 70: Latin America Smart Contact Lenses Market Revenue (US$ Mn) Comparison by Segmentation by product type: (2016-2032)
- Table 71: Latin America Smart Contact Lenses Market Revenue (US$ Mn) Comparison by End-User (2016-2032)
- Table 72: Latin America Smart Contact Lenses Market Y-o-Y Growth Rate Comparison by Country (2016-2032)
- Table 73: Latin America Smart Contact Lenses Market Y-o-Y Growth Rate Comparison by Segmentation by product type: (2016-2032)
- Table 74: Latin America Smart Contact Lenses Market Y-o-Y Growth Rate Comparison by End-User (2016-2032)
- Table 75: Latin America Smart Contact Lenses Market Share Comparison by Country (2016-2032)
- Table 76: Latin America Smart Contact Lenses Market Share Comparison by Segmentation by product type: (2016-2032)
- Table 77: Latin America Smart Contact Lenses Market Share Comparison by End-User (2016-2032)
- Table 78: Middle East & Africa Smart Contact Lenses Market Comparison by Segmentation by product type: (2016-2032)
- Table 79: Middle East & Africa Smart Contact Lenses Market Comparison by End-User (2016-2032)
- Table 80: Middle East & Africa Smart Contact Lenses Market Revenue (US$ Mn) Comparison by Country (2016-2032)
- Table 81: Middle East & Africa Smart Contact Lenses Market Revenue (US$ Mn) (2016-2032)
- Table 82: Middle East & Africa Smart Contact Lenses Market Revenue (US$ Mn) Comparison by Country (2016-2032)
- Table 83: Middle East & Africa Smart Contact Lenses Market Revenue (US$ Mn) Comparison by Segmentation by product type: (2016-2032)
- Table 84: Middle East & Africa Smart Contact Lenses Market Revenue (US$ Mn) Comparison by End-User (2016-2032)
- Table 85: Middle East & Africa Smart Contact Lenses Market Y-o-Y Growth Rate Comparison by Country (2016-2032)
- Table 86: Middle East & Africa Smart Contact Lenses Market Y-o-Y Growth Rate Comparison by Segmentation by product type: (2016-2032)
- Table 87: Middle East & Africa Smart Contact Lenses Market Y-o-Y Growth Rate Comparison by End-User (2016-2032)
- Table 88: Middle East & Africa Smart Contact Lenses Market Share Comparison by Country (2016-2032)
- Table 89: Middle East & Africa Smart Contact Lenses Market Share Comparison by Segmentation by product type: (2016-2032)
- Table 90: Middle East & Africa Smart Contact Lenses Market Share Comparison by End-User (2016-2032)
- 1. Executive Summary
-
- Sensimed AG
- Google Inc.
- Novartis AG
- Samsung Electronics Co., Ltd.
- Innovega Inc.
Our Clients


View Our Licence Options
