Shoe Polish Market Report By Product Type (Cream Polish, Wax Polish, Liquid Polish, Foam Polish, Paste Polish, Others), By Application (Leather Shoes, Synthetic Shoes, Boots, Formal Shoes, Casual Shoes), By Distribution Channel (Supermarkets/Hypermarkets, Convenience Stores, Online Retailers, Pharmacies, Specialty Stores, Department Stores), By Region and Companies - Industry Segment Outlook, Market Assessment, Competition Scenario, Trends and Forecast 2024-2033
-
14570
-
July 2024
-
325
-


-
This report was compiled by Research Team Research team of over 50 passionate professionals leverages advanced research methodologies and analytical expertise to deliver insightful, data-driven market intelligence that empowers businesses across diverse industries to make strategic, well-informed Correspondence Research Team Linkedin | Detailed Market research Methodology Our methodology involves a mix of primary research, including interviews with leading mental health experts, and secondary research from reputable medical journals and databases. View Detailed Methodology Page
-
Quick Navigation
Report Overview
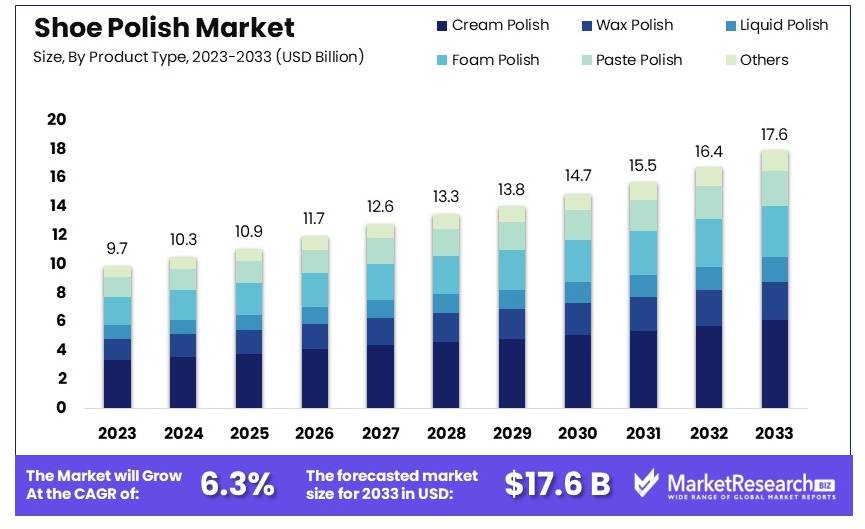
The Global Shoe Polish Market size is expected to be worth around USD 17.6 Billion by 2033, from USD 9.7 Billion in 2023, growing at a CAGR of 6.3% during the forecast period from 2024 to 2033.
The shoe polish market focuses on products used to maintain and enhance the appearance of footwear. This market includes a variety of items such as creams, waxes, liquids, and sprays designed to clean, condition, and protect shoes.
Key drivers include rising demand for premium and designer footwear, growing awareness of personal grooming, and increasing disposable income. The market is segmented by product type, application, distribution channel, and region. Innovations in eco-friendly and multifunctional products are influencing market trends. Major players invest in marketing and expanding product lines to capture a larger share of this competitive market.
The shoe polish market shows promising potential driven by several key factors. Increasing urbanization and the growing demand for formal footwear are notable trends fueling market growth. A surge in fashion consciousness, particularly among younger demographics, contributes significantly to this demand. The market is also witnessing innovations in product formulations, including eco-friendly and premium shoe polishes, which cater to evolving consumer preferences for sustainability and quality.
Brands are expanding their product portfolios to include a variety of shoe care products beyond traditional polishes, such as cleaners, conditioners, and waterproofing solutions. This diversification is aimed at enhancing customer loyalty and capturing a broader market share. The rise of e-commerce platforms has further boosted market accessibility, allowing consumers to purchase a wide range of products conveniently.
Another factor driving growth is the increasing presence of organized retail and specialty stores, which offer a diverse range of shoe care products and personalized services. These channels play a crucial role in educating consumers about the benefits of regular shoe maintenance, thus driving product usage.
Despite the positive outlook, the market faces challenges such as competition from synthetic materials and casual footwear, which require less maintenance. However, the emphasis on appearance and professional grooming in corporate settings continues to support the market's expansion.
In conclusion, the shoe polish market is poised for steady growth, supported by urbanization, fashion trends, product innovation, and expanding retail channels. Brands that can adapt to changing consumer preferences and leverage new distribution avenues are likely to thrive in this evolving market landscape.
Key Takeaways
- Market Value: The Shoe Polish Market was valued at USD 9.7 billion in 2023 and is expected to reach USD 17.6 billion by 2033, with a CAGR of 6.3%.
- By Type Analysis: Cream Polish dominated with 35%; this segment leads due to its versatile application and popular demand.
- By Application Analysis: Leather Shoes dominated with 40%; reflecting the high usage of shoe polish in maintaining leather footwear.
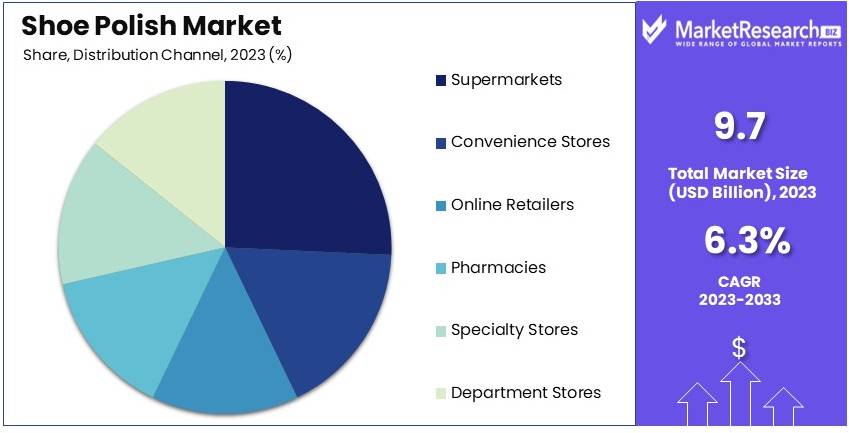
- By Distribution Channel Analysis: Supermarkets/Hypermarkets dominated with 30%; indicating the preference for physical stores for shoe polish purchases.
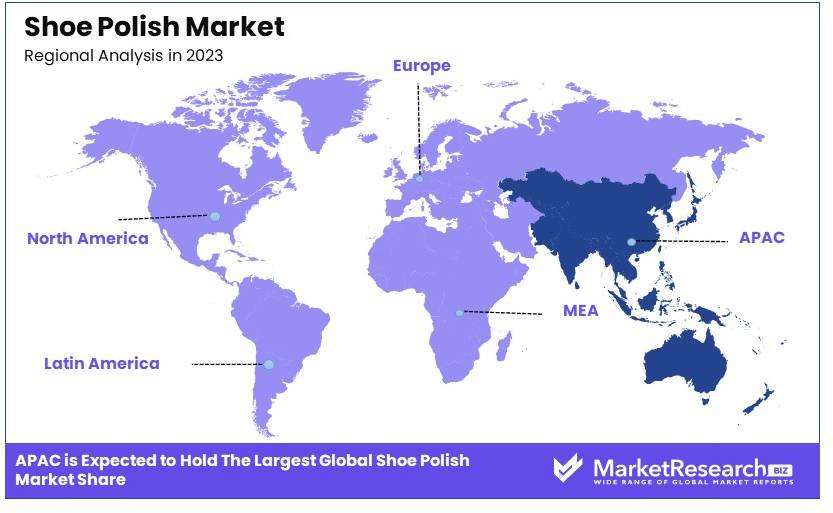
- Dominant Region: Asia-Pacific 40%; significant due to the large consumer base and growing fashion trends.
- High Growth Region: North America; poised for growth due to increasing demand for premium shoe care products.
- Analyst Viewpoint: The market is moderately saturated with strong competition among established players. Future growth is anticipated from emerging markets and innovative product offerings.
- Growth Opportunities: Key players can leverage sustainable and eco-friendly product lines, tapping into the growing consumer preference for environmentally friendly products.
Driving Factors
Growing Emphasis on Professional Appearance Drives Market Growth
The growing emphasis on professional appearance significantly drives the shoe polish market. In many professional settings, a polished appearance, including well-maintained footwear, is crucial. This emphasis on professional attire is driving the demand for shoe polish products.
As more individuals enter the workforce and corporate cultures continue to value a polished appearance, the need for shoe care products increases. For example, in Japan, where corporate culture highly values appearance, brands like Columbus have seen steady growth in their shoe care product lines, with their shoe polish being a staple in many households and offices.
This trend is further supported by global professional standards, which often prioritize a neat and polished look. As a result, companies and individuals invest more in shoe care products, boosting the market.
Rising Disposable Income in Developing Countries Drives Market Growth
The rising disposable income in developing countries plays a significant role in the shoe polish market's growth. As disposable income increases, more consumers can afford higher-quality footwear and the products to maintain them.
This trend is particularly noticeable in countries like India and Brazil, where the middle class is expanding rapidly. For instance, Kiwi, a leading shoe polish brand, has reported significant growth in these markets. In India, Kiwi has expanded its product range and distribution network to cater to the growing demand, reflecting the market's potential in developing economies.
The increase in disposable income leads to greater spending on personal care items, including shoe polish, which helps maintain the appearance and longevity of higher-priced shoes. This economic shift supports the sustained growth of the shoe polish market in these regions.
Increasing Awareness of Footwear Maintenance Drives Market Growth
The increasing awareness of footwear maintenance among consumers is a major driver of the shoe polish market. There's a growing understanding of the importance of proper shoe care to extend the life of footwear. This awareness is partly driven by sustainability concerns and the desire to reduce waste.
As consumers invest in higher-quality shoes, they are more likely to maintain them properly. For example, luxury shoe brands like Allen Edmonds not only sell high-end shoes but also offer their own line of shoe care products, educating customers about proper maintenance and thus driving the shoe polish market.
This trend is complemented by a broader consumer movement towards sustainable living, where maintaining possessions, including footwear, is prioritized. The interplay between sustainability and product longevity enhances the demand for shoe care products, supporting market growth.
Restraining Factors
Shift Towards Casual Footwear Restrains Market Growth
The global trend towards casual workplaces and lifestyles has significantly impacted the shoe polish market. With the increasing acceptance of sneakers, canvas shoes, and other casual footwear in various settings, the demand for traditional shoe polish is diminishing.
Major tech companies like Google and Facebook have adopted casual dress codes, influencing broader workplace norms. This shift reduces the necessity for polished formal shoes, directly affecting the sales of shoe polish products.
Casual footwear often does not require traditional polishing, leading to a decreased market for these products. This trend is evident in various sectors, where even formal events are seeing a relaxed approach to dress codes. The move towards comfort and practicality in footwear choices means fewer consumers are purchasing shoe polish, thereby limiting market growth.
Environmental Concerns Restrain Market Growth
Environmental concerns are increasingly restraining the growth of the shoe polish market. Traditional shoe polish products often contain harmful chemicals, leading to consumer hesitation and regulatory challenges.
As awareness of environmental issues grows, many consumers are opting for eco-friendly alternatives or avoiding shoe polish altogether. Stricter regulations, particularly in Europe, on chemical content in consumer products are forcing manufacturers to reformulate their products. This reformulation process can be costly and time-consuming, leading to a slower market expansion.
For instance, European regulations have compelled manufacturers to limit or eliminate certain chemicals, restricting market access for non-compliant products. This environmental consciousness among consumers and regulatory pressures is dampening the growth prospects of the traditional shoe polish market.
Product Type Analysis
Cream Polish dominates with 35% due to its superior shine and conditioning for leather shoes.
The shoe polish market is segmented by product type, with significant variations in consumer preferences and product performance. Among these segments, Cream Polish dominates, holding approximately 35% of the market share. This dominance is attributed to its ability to offer a superior shine and conditioning effect on leather shoes, which remains a priority for many consumers. Cream polish is favored for its rich, creamy texture that nourishes leather, providing a deep shine and protection against drying and cracking. The versatility of cream polish in restoring color and maintaining the durability of shoes also contributes to its leading position.
Wax Polish holds a substantial share, around 25%, and is particularly popular among those who prefer a higher gloss finish. It provides excellent waterproofing and protection, which makes it a preferred choice for formal and dress shoes. The longevity of the polish and its protective qualities against water and scuffs ensure its steady demand. Wax polish, however, requires more effort to apply, which might limit its usage among less patient consumers.
Liquid Polish, accounting for 20% of the market, is preferred for its convenience and ease of application. The quick-drying formula of liquid polish is ideal for users who need a fast shine without the mess. Despite its ease of use, liquid polish does not offer the same level of nourishment and protection as cream or wax polish, which restricts its growth potential to more casual or occasional users.
Foam Polish and Paste Polish, together comprising around 10%, cater to niche markets. Foam polish is appreciated for its easy application and minimal mess, making it a good choice for casual shoes. Paste polish, known for its intense shine, is favored by enthusiasts who require superior results for special occasions or high-maintenance footwear.
Other types, which include innovative and hybrid products, make up the remaining 10%. These products often combine the best features of traditional polishes and appeal to a segment of consumers looking for multifunctional or specialized solutions. However, their market share remains relatively small due to limited consumer awareness and availability.
Application Analysis
Leather Shoes dominate with 40% due to their high maintenance needs and investment value.
In the shoe polish market segmented by application, Leather Shoes dominate with a commanding 40% market share. This segment's dominance is driven by the intrinsic value and care associated with leather footwear. Leather shoes are often considered an investment, and their maintenance is crucial for longevity and appearance. Consumers prioritize high-quality polish products to ensure their leather shoes remain in pristine condition, driving demand for premium polish types like cream and wax.
Synthetic Shoes hold approximately 25% of the market share. The rise in popularity of synthetic materials in footwear, driven by affordability and diverse design options, has led to increased demand for suitable polish products. Synthetic shoe polishes are formulated to cater specifically to the material’s unique properties, ensuring a clean, polished look without damaging the surface.
Boots, accounting for 15% of the market, are a significant segment due to their higher price point and durability requirements. Boot owners tend to invest in quality polishes that provide superior protection against the elements. Wax polish is particularly popular in this segment due to its waterproofing capabilities and robust finish, which is essential for outdoor and work boots.
Formal Shoes, with a 10% share, represent a stable market segment. Consumers of formal shoes, including business professionals, prioritize a polished and sophisticated look, often opting for high-gloss finishes provided by cream and wax polishes. The formal shoe segment benefits from steady demand driven by professional and formal events, ensuring consistent sales of premium polish products.
Casual Shoes, making up the remaining 10%, are a growing segment as more consumers adopt a casual lifestyle. Polishes for casual shoes emphasize ease of use and quick application, with liquid and foam polishes gaining popularity. This segment is expected to grow as casual footwear becomes more prevalent in everyday wear.
Distribution Channel Analysis
Supermarkets/Hypermarkets dominate with 30% due to wide availability and convenience.
In the shoe polish market segmented by distribution channel, Supermarkets/Hypermarkets lead with approximately 30% market share. Their dominance is due to the wide availability and convenience they offer to consumers. These outlets provide a broad range of products, including various brands and types of shoe polish, making it easy for consumers to find their preferred options during routine shopping trips. The extensive reach of supermarkets and hypermarkets ensures that shoe polish products are accessible to a large customer base.
Convenience Stores hold about 20% of the market share. These stores cater to immediate and last-minute purchases, often located in easily accessible areas. The convenience of quick purchases makes these stores a popular choice for consumers needing shoe polish urgently. However, the variety available in convenience stores may be limited compared to larger retail formats.
Online Retailers, accounting for 25% of the market, are experiencing significant growth. The shift towards e-commerce, driven by the convenience of home delivery and the ability to compare products and prices easily, has boosted online sales. Consumers are increasingly comfortable purchasing shoe care products online, benefiting from detailed product descriptions, reviews, and competitive pricing. The online segment is expected to continue its upward trajectory as digital shopping becomes more ingrained in consumer behavior.
Pharmacies, with a 10% share, play a niche but important role. They cater primarily to customers seeking specialized or higher-end shoe care products. Pharmacies often stock premium brands and cater to a demographic that values quality and convenience, particularly in urban areas where accessibility is key.
Specialty Stores, comprising 10%, focus on high-quality, niche products, often catering to enthusiasts and professional shoe care needs. These stores offer expert advice and a curated selection of products, which appeals to discerning customers willing to invest in premium shoe care solutions. Specialty stores maintain a loyal customer base due to their expertise and personalized service.
Department Stores, making up the remaining 5%, provide a wide array of products, including shoe polish, as part of their broader merchandise. While they do not specialize in shoe care, the presence of shoe polish products in department stores offers convenience to shoppers looking for a one-stop shopping experience. The role of department stores is supplementary, catering to general consumers rather than specialists.
Key Market Segments
By Product Type
- Cream Polish
- Wax Polish
- Liquid Polish
- Foam Polish
- Paste Polish
- Others
By Application
- Leather Shoes
- Synthetic Shoes
- Boots
- Formal Shoes
- Casual Shoes
By Distribution Channel
- Supermarkets/Hypermarkets
- Convenience Stores
- Online Retailers
- Pharmacies
- Specialty Stores
- Department Stores
Growth Opportunities
Eco-Friendly and Natural Shoe Care Products Offer Growth Opportunity
There is a growing market for environmentally friendly and sustainable footwear. Consumers increasingly seek products that are effective yet have minimal environmental impact. This presents an opportunity for shoe polish manufacturers to develop and market eco-friendly alternatives.
For instance, Otter Wax, a small company in Portland, Oregon, has gained popularity with its all-natural leather care products, including shoe polish made from plant-based ingredients. Their success demonstrates the potential market for eco-friendly shoe care solutions. By tapping into this trend, manufacturers can attract environmentally conscious consumers and differentiate themselves in the market, driving growth and expanding their customer base.
Digital Marketing and E-Commerce Offer Growth Opportunity
The shoe polish market can benefit significantly from increased online presence and e-commerce strategies. By leveraging digital platforms, brands can educate consumers about proper shoe care, demonstrate product use, and make purchasing more convenient.
For example, Saphir, a premium shoe care brand, has successfully used YouTube tutorials and Instagram to showcase their products and educate consumers, leading to increased online sales and brand awareness. Embracing digital marketing and e-commerce can help shoe polish brands reach a wider audience, improve customer engagement, and boost sales, creating substantial growth opportunities in the market.
Trending Factors
Multifunctional Shoe Care Products Are Trending Factors
There's a trend towards multifunctional shoe care products that offer multiple benefits in one application. These products cater to consumers seeking convenience and efficiency. For example, Kiwi's "Parade Gloss" not only polishes but also provides a high-shine finish and leather conditioning in a single step. This product appeals to the military and formal wear markets, where maintaining a polished appearance is essential.
The demand for such all-in-one solutions reflects a broader consumer preference for simplicity and time-saving products. By offering multifunctional shoe care options, manufacturers can meet the needs of busy consumers, enhance product appeal, and drive market trends towards more versatile and efficient shoe care solutions.
Subscription-Based Shoe Care Services Are Trending Factors
Subscription-based shoe care services are emerging as a significant trend in the shoe polish market. Companies are exploring models where customers receive regular shipments of polish, brushes, and other maintenance items. This trend aligns with the broader subscription economy and helps build brand loyalty.
For instance, The Elegant Oxford offers a "Shoe Shine Subscription Box" that delivers curated shoe care products monthly. This model taps into the convenience and discovery aspects of subscription services, providing customers with a hassle-free way to maintain their shoes. By adopting subscription models, companies can create steady revenue streams and foster long-term customer relationships, driving market trends.
Regional Analysis
Asia-Pacific Dominates with 40% Market Share in the Shoe Polish Market
The Asia-Pacific region's commanding 40% share in the global shoe polish market can be primarily attributed to its large consumer base and rapid urbanization. Increasing disposable incomes and the expanding retail sector further fuel the demand for shoe care products. Additionally, the presence of numerous local and international manufacturers in this region enhances competitive pricing and product availability, bolstering the market's growth.
The market dynamics in Asia-Pacific are influenced by cultural significance attached to personal appearance, including footwear. The region's diverse climate conditions also necessitate regular shoe maintenance, driving the demand for shoe polish. Moreover, the growth of e-commerce platforms in countries like China and India has made it easier for consumers to access a wide range of shoe care products, significantly impacting the market's expansion in this region.
Looking forward, Asia-Pacific is anticipated to maintain its dominance in the shoe polish market due to ongoing urbanization and the increase in professional workforce. As awareness about footwear maintenance grows and innovations in shoe care products continue, the region is expected to see sustained growth. Companies may increasingly invest in eco-friendly products, appealing to the growing consumer preference for sustainable options.
Regional Market Share and Growth Statistics
- North America: Holding a market share of 25%, North America's growth is supported by a preference for premium shoe care products and high consumer awareness regarding leather goods maintenance.
- Europe: Europe accounts for 20% of the market, driven by a strong tradition of leather craftsmanship and high demand for luxury shoe care products.
- Middle East & Africa: This region commands 10% of the market, with growth influenced by an expanding base of affluent consumers and increased urban retail developments.
- Latin America: Representing 5% of the market, Latin America shows potential for growth through increased consumer spending power and the rising fashion consciousness among its population.
Key Regions and Countries
- North America
- The US
- Canada
- Mexico
- Western Europe
- Germany
- France
- The UK
- Spain
- Italy
- Portugal
- Ireland
- Austria
- Switzerland
- Benelux
- Nordic
- Rest of Western Europe
- Eastern Europe
- Russia
- Poland
- The Czech Republic
- Greece
- Rest of Eastern Europe
- APAC
- China
- Japan
- South Korea
- India
- Australia & New Zealand
- Indonesia
- Malaysia
- Philippines
- Singapore
- Thailand
- Vietnam
- Rest of APAC
- Latin America
- Brazil
- Colombia
- Chile
- Argentina
- Costa Rica
- Rest of Latin America
- Middle East & Africa
- Algeria
- Egypt
- Israel
- Kuwait
- Nigeria
- Saudi Arabia
- South Africa
- Turkey
- United Arab Emirates
- Rest of MEA
Key Players Analysis
The shoe polish market features several key players with strong market positions and influence. SC Johnson & Son, Inc., through its Kiwi brand, dominates the market with a broad product range and global reach. Reckitt Benckiser Group plc holds a significant share with its diverse portfolio, enhancing its market presence. Shinola and Cherry Blossom have established their niches with premium and innovative products. Moneysworth & Best, Angelus Shoe Polish, and Tarrago Brands International offer specialized solutions, catering to specific customer needs.
TRG the One and Cadillac Shoe Products provide high-quality options, strengthening their market positions. Saphir Medaille d'Or and Lincoln Shoe Polish are known for luxury and premium offerings, appealing to high-end consumers. Fiebing Company, Inc. and Lexol (Summit Industries, Inc.) focus on leather care, adding to their market influence. Meltonian's long-standing reputation contributes to its enduring presence in the market.
These companies leverage strong brand recognition, diverse product lines, and targeted marketing strategies to maintain and expand their market influence. Their ability to innovate and meet customer demands plays a crucial role in shaping the shoe polish market's competitive landscape.
Market Key Players
- SC Johnson & Son, Inc.
- Reckitt Benckiser Group plc
- Kiwi (SC Johnson)
- Shinola
- Cherry Blossom
- Moneysworth & Best
- Angelus Shoe Polish
- TRG the One
- Tarrago Brands International
- Cadillac Shoe Products
- Saphir Medaille d'Or
- Lincoln Shoe Polish
- Fiebing Company, Inc.
- Lexol (Summit Industries, Inc.)
- Meltonian
Recent Developments
- Kiwi Instant Shine & Protect Liquid Shoe Polish: Features a durable two-layer sponge applicator for long-lasting shine, color protection, and water resistance for up to seven days. Available in black, brown, and neutral colors, designed for easy and quick application.
- Saphir Medaille d’Or Pommadier Natural Cream Leather Shoe Polish: Known for high-quality ingredients like beeswax, carnauba wax, and shea butter. Offers excellent water resistance and restores leather's natural luster, especially effective in harsh weather conditions.
Report Scope
Report Features Description Market Value (2023) USD 9.7 Billion Forecast Revenue (2033) USD 17.6 Billion CAGR (2024-2033) 6..3% Base Year for Estimation 2023 Historic Period 2018-2023 Forecast Period 2024-2033 Report Coverage Revenue Forecast, Market Dynamics, Competitive Landscape, Recent Developments Segments Covered By Product Type (Cream Polish, Wax Polish, Liquid Polish, Foam Polish, Paste Polish, Others), By Application (Leather Shoes, Synthetic Shoes, Boots, Formal Shoes, Casual Shoes), By Distribution Channel (Supermarkets/Hypermarkets, Convenience Stores, Online Retailers, Pharmacies, Specialty Stores, Department Stores) Regional Analysis North America - The US, Canada, & Mexico; Western Europe - Germany, France, The UK, Spain, Italy, Portugal, Ireland, Austria, Switzerland, Benelux, Nordic, & Rest of Western Europe; Eastern Europe - Russia, Poland, The Czech Republic, Greece, & Rest of Eastern Europe; APAC - China, Japan, South Korea, India, Australia & New Zealand, Indonesia, Malaysia, Philippines, Singapore, Thailand, Vietnam, & Rest of APAC; Latin America - Brazil, Colombia, Chile, Argentina, Costa Rica, & Rest of Latin America; Middle East & Africa - Algeria, Egypt, Israel, Kuwait, Nigeria, Saudi Arabia, South Africa, Turkey, United Arab Emirates, & Rest of MEA Competitive Landscape SC Johnson & Son, Inc., Reckitt Benckiser Group plc, Kiwi (SC Johnson), Shinola, Cherry Blossom, Moneysworth & Best, Angelus Shoe Polish, TRG the One, Tarrago Brands International, Cadillac Shoe Products, Saphir Medaille d'Or, Lincoln Shoe Polish, Fiebing Company, Inc., Lexol (Summit Industries, Inc.), Meltonian Customization Scope Customization for segments, region/country-level will be provided. Moreover, additional customization can be done based on the requirements. Purchase Options We have three licenses to opt for: Single User License, Multi-User License (Up to 5 Users), Corporate Use License (Unlimited User and Printable PDF) -
- 1. Executive Summary
- 1.1. Definition
- 1.2. Taxonomy
- 1.3. Research Scope
- 1.4. Key Analysis
- 1.5. Key Findings by Major Segments
- 1.6. Top strategies by Major Players
- 2. Global Shoe Polish Market Overview
- 2.1. Shoe Polish Market Dynamics
- 2.1.1. Drivers
- 2.1.2. Opportunities
- 2.1.3. Restraints
- 2.1.4. Challenges
- 2.2. Macro-economic Factors
- 2.3. Regulatory Framework
- 2.4. Market Investment Feasibility Index
- 2.5. PEST Analysis
- 2.6. PORTER’S Five Force Analysis
- 2.7. Drivers & Restraints Impact Analysis
- 2.8. Industry Chain Analysis
- 2.9. Cost Structure Analysis
- 2.10. Marketing Strategy
- 2.11. Russia-Ukraine War Impact Analysis
- 2.12. Opportunity Map Analysis
- 2.13. Market Competition Scenario Analysis
- 2.14. Product Life Cycle Analysis
- 2.15. Opportunity Orbits
- 2.16. Manufacturer Intensity Map
- 2.17. Major Companies sales by Value & Volume
- 2.1. Shoe Polish Market Dynamics
- 3. Global Shoe Polish Market Analysis, Opportunity and Forecast, 2016-2032
- 3.1. Global Shoe Polish Market Analysis, 2016-2021
- 3.2. Global Shoe Polish Market Opportunity and Forecast, 2023-2032
- 3.3. Global Shoe Polish Market Analysis, Opportunity and Forecast, By Product Type, 2016-2032
- 3.3.1. Global Shoe Polish Market Analysis by Product Type: Introduction
- 3.3.2. Market Size Absolute $ Opportunity Analysis and Forecast, By Product Type, 2016-2032
- 3.3.3. Cream Polish
- 3.3.4. Wax Polish
- 3.3.5. Liquid Polish
- 3.3.6. Foam Polish
- 3.3.7. Paste Polish
- 3.3.8. Others
- 3.4. Global Shoe Polish Market Analysis, Opportunity and Forecast, By Application, 2016-2032
- 3.4.1. Global Shoe Polish Market Analysis by Application: Introduction
- 3.4.2. Market Size Absolute $ Opportunity Analysis and Forecast, By Application, 2016-2032
- 3.4.3. Leather Shoes
- 3.4.4. Synthetic Shoes
- 3.4.5. Boots
- 3.4.6. Formal Shoes
- 3.4.7. Casual Shoes
- 3.5. Global Shoe Polish Market Analysis, Opportunity and Forecast, By Distribution Channel, 2016-2032
- 3.5.1. Global Shoe Polish Market Analysis by Distribution Channel: Introduction
- 3.5.2. Market Size Absolute $ Opportunity Analysis and Forecast, By Distribution Channel, 2016-2032
- 3.5.3. Supermarkets/Hypermarkets
- 3.5.4. Convenience Stores
- 3.5.5. Online Retailers
- 3.5.6. Pharmacies
- 3.5.7. Specialty Stores
- 3.5.8. Department Stores
- 4. North America Shoe Polish Market Analysis, Opportunity and Forecast, 2016-2032
- 4.1. North America Shoe Polish Market Analysis, 2016-2021
- 4.2. North America Shoe Polish Market Opportunity and Forecast, 2023-2032
- 4.3. North America Shoe Polish Market Analysis, Opportunity and Forecast, By Product Type, 2016-2032
- 4.3.1. North America Shoe Polish Market Analysis by Product Type: Introduction
- 4.3.2. Market Size Absolute $ Opportunity Analysis and Forecast, By Product Type, 2016-2032
- 4.3.3. Cream Polish
- 4.3.4. Wax Polish
- 4.3.5. Liquid Polish
- 4.3.6. Foam Polish
- 4.3.7. Paste Polish
- 4.3.8. Others
- 4.4. North America Shoe Polish Market Analysis, Opportunity and Forecast, By Application, 2016-2032
- 4.4.1. North America Shoe Polish Market Analysis by Application: Introduction
- 4.4.2. Market Size Absolute $ Opportunity Analysis and Forecast, By Application, 2016-2032
- 4.4.3. Leather Shoes
- 4.4.4. Synthetic Shoes
- 4.4.5. Boots
- 4.4.6. Formal Shoes
- 4.4.7. Casual Shoes
- 4.5. North America Shoe Polish Market Analysis, Opportunity and Forecast, By Distribution Channel, 2016-2032
- 4.5.1. North America Shoe Polish Market Analysis by Distribution Channel: Introduction
- 4.5.2. Market Size Absolute $ Opportunity Analysis and Forecast, By Distribution Channel, 2016-2032
- 4.5.3. Supermarkets/Hypermarkets
- 4.5.4. Convenience Stores
- 4.5.5. Online Retailers
- 4.5.6. Pharmacies
- 4.5.7. Specialty Stores
- 4.5.8. Department Stores
- 4.6. North America Shoe Polish Market Analysis, Opportunity and Forecast, By Country , 2016-2032
- 4.6.1. North America Shoe Polish Market Analysis by Country : Introduction
- 4.6.2. Market Size Absolute $ Opportunity Analysis and Forecast, Country , 2016-2032
- 4.6.2.1. The US
- 4.6.2.2. Canada
- 4.6.2.3. Mexico
- 5. Western Europe Shoe Polish Market Analysis, Opportunity and Forecast, 2016-2032
- 5.1. Western Europe Shoe Polish Market Analysis, 2016-2021
- 5.2. Western Europe Shoe Polish Market Opportunity and Forecast, 2023-2032
- 5.3. Western Europe Shoe Polish Market Analysis, Opportunity and Forecast, By Product Type, 2016-2032
- 5.3.1. Western Europe Shoe Polish Market Analysis by Product Type: Introduction
- 5.3.2. Market Size Absolute $ Opportunity Analysis and Forecast, By Product Type, 2016-2032
- 5.3.3. Cream Polish
- 5.3.4. Wax Polish
- 5.3.5. Liquid Polish
- 5.3.6. Foam Polish
- 5.3.7. Paste Polish
- 5.3.8. Others
- 5.4. Western Europe Shoe Polish Market Analysis, Opportunity and Forecast, By Application, 2016-2032
- 5.4.1. Western Europe Shoe Polish Market Analysis by Application: Introduction
- 5.4.2. Market Size Absolute $ Opportunity Analysis and Forecast, By Application, 2016-2032
- 5.4.3. Leather Shoes
- 5.4.4. Synthetic Shoes
- 5.4.5. Boots
- 5.4.6. Formal Shoes
- 5.4.7. Casual Shoes
- 5.5. Western Europe Shoe Polish Market Analysis, Opportunity and Forecast, By Distribution Channel, 2016-2032
- 5.5.1. Western Europe Shoe Polish Market Analysis by Distribution Channel: Introduction
- 5.5.2. Market Size Absolute $ Opportunity Analysis and Forecast, By Distribution Channel, 2016-2032
- 5.5.3. Supermarkets/Hypermarkets
- 5.5.4. Convenience Stores
- 5.5.5. Online Retailers
- 5.5.6. Pharmacies
- 5.5.7. Specialty Stores
- 5.5.8. Department Stores
- 5.6. Western Europe Shoe Polish Market Analysis, Opportunity and Forecast, By Country , 2016-2032
- 5.6.1. Western Europe Shoe Polish Market Analysis by Country : Introduction
- 5.6.2. Market Size Absolute $ Opportunity Analysis and Forecast, Country , 2016-2032
- 5.6.2.1. Germany
- 5.6.2.2. France
- 5.6.2.3. The UK
- 5.6.2.4. Spain
- 5.6.2.5. Italy
- 5.6.2.6. Portugal
- 5.6.2.7. Ireland
- 5.6.2.8. Austria
- 5.6.2.9. Switzerland
- 5.6.2.10. Benelux
- 5.6.2.11. Nordic
- 5.6.2.12. Rest of Western Europe
- 6. Eastern Europe Shoe Polish Market Analysis, Opportunity and Forecast, 2016-2032
- 6.1. Eastern Europe Shoe Polish Market Analysis, 2016-2021
- 6.2. Eastern Europe Shoe Polish Market Opportunity and Forecast, 2023-2032
- 6.3. Eastern Europe Shoe Polish Market Analysis, Opportunity and Forecast, By Product Type, 2016-2032
- 6.3.1. Eastern Europe Shoe Polish Market Analysis by Product Type: Introduction
- 6.3.2. Market Size Absolute $ Opportunity Analysis and Forecast, By Product Type, 2016-2032
- 6.3.3. Cream Polish
- 6.3.4. Wax Polish
- 6.3.5. Liquid Polish
- 6.3.6. Foam Polish
- 6.3.7. Paste Polish
- 6.3.8. Others
- 6.4. Eastern Europe Shoe Polish Market Analysis, Opportunity and Forecast, By Application, 2016-2032
- 6.4.1. Eastern Europe Shoe Polish Market Analysis by Application: Introduction
- 6.4.2. Market Size Absolute $ Opportunity Analysis and Forecast, By Application, 2016-2032
- 6.4.3. Leather Shoes
- 6.4.4. Synthetic Shoes
- 6.4.5. Boots
- 6.4.6. Formal Shoes
- 6.4.7. Casual Shoes
- 6.5. Eastern Europe Shoe Polish Market Analysis, Opportunity and Forecast, By Distribution Channel, 2016-2032
- 6.5.1. Eastern Europe Shoe Polish Market Analysis by Distribution Channel: Introduction
- 6.5.2. Market Size Absolute $ Opportunity Analysis and Forecast, By Distribution Channel, 2016-2032
- 6.5.3. Supermarkets/Hypermarkets
- 6.5.4. Convenience Stores
- 6.5.5. Online Retailers
- 6.5.6. Pharmacies
- 6.5.7. Specialty Stores
- 6.5.8. Department Stores
- 6.6. Eastern Europe Shoe Polish Market Analysis, Opportunity and Forecast, By Country , 2016-2032
- 6.6.1. Eastern Europe Shoe Polish Market Analysis by Country : Introduction
- 6.6.2. Market Size Absolute $ Opportunity Analysis and Forecast, Country , 2016-2032
- 6.6.2.1. Russia
- 6.6.2.2. Poland
- 6.6.2.3. The Czech Republic
- 6.6.2.4. Greece
- 6.6.2.5. Rest of Eastern Europe
- 7. APAC Shoe Polish Market Analysis, Opportunity and Forecast, 2016-2032
- 7.1. APAC Shoe Polish Market Analysis, 2016-2021
- 7.2. APAC Shoe Polish Market Opportunity and Forecast, 2023-2032
- 7.3. APAC Shoe Polish Market Analysis, Opportunity and Forecast, By Product Type, 2016-2032
- 7.3.1. APAC Shoe Polish Market Analysis by Product Type: Introduction
- 7.3.2. Market Size Absolute $ Opportunity Analysis and Forecast, By Product Type, 2016-2032
- 7.3.3. Cream Polish
- 7.3.4. Wax Polish
- 7.3.5. Liquid Polish
- 7.3.6. Foam Polish
- 7.3.7. Paste Polish
- 7.3.8. Others
- 7.4. APAC Shoe Polish Market Analysis, Opportunity and Forecast, By Application, 2016-2032
- 7.4.1. APAC Shoe Polish Market Analysis by Application: Introduction
- 7.4.2. Market Size Absolute $ Opportunity Analysis and Forecast, By Application, 2016-2032
- 7.4.3. Leather Shoes
- 7.4.4. Synthetic Shoes
- 7.4.5. Boots
- 7.4.6. Formal Shoes
- 7.4.7. Casual Shoes
- 7.5. APAC Shoe Polish Market Analysis, Opportunity and Forecast, By Distribution Channel, 2016-2032
- 7.5.1. APAC Shoe Polish Market Analysis by Distribution Channel: Introduction
- 7.5.2. Market Size Absolute $ Opportunity Analysis and Forecast, By Distribution Channel, 2016-2032
- 7.5.3. Supermarkets/Hypermarkets
- 7.5.4. Convenience Stores
- 7.5.5. Online Retailers
- 7.5.6. Pharmacies
- 7.5.7. Specialty Stores
- 7.5.8. Department Stores
- 7.6. APAC Shoe Polish Market Analysis, Opportunity and Forecast, By Country , 2016-2032
- 7.6.1. APAC Shoe Polish Market Analysis by Country : Introduction
- 7.6.2. Market Size Absolute $ Opportunity Analysis and Forecast, Country , 2016-2032
- 7.6.2.1. China
- 7.6.2.2. Japan
- 7.6.2.3. South Korea
- 7.6.2.4. India
- 7.6.2.5. Australia & New Zeland
- 7.6.2.6. Indonesia
- 7.6.2.7. Malaysia
- 7.6.2.8. Philippines
- 7.6.2.9. Singapore
- 7.6.2.10. Thailand
- 7.6.2.11. Vietnam
- 7.6.2.12. Rest of APAC
- 8. Latin America Shoe Polish Market Analysis, Opportunity and Forecast, 2016-2032
- 8.1. Latin America Shoe Polish Market Analysis, 2016-2021
- 8.2. Latin America Shoe Polish Market Opportunity and Forecast, 2023-2032
- 8.3. Latin America Shoe Polish Market Analysis, Opportunity and Forecast, By Product Type, 2016-2032
- 8.3.1. Latin America Shoe Polish Market Analysis by Product Type: Introduction
- 8.3.2. Market Size Absolute $ Opportunity Analysis and Forecast, By Product Type, 2016-2032
- 8.3.3. Cream Polish
- 8.3.4. Wax Polish
- 8.3.5. Liquid Polish
- 8.3.6. Foam Polish
- 8.3.7. Paste Polish
- 8.3.8. Others
- 8.4. Latin America Shoe Polish Market Analysis, Opportunity and Forecast, By Application, 2016-2032
- 8.4.1. Latin America Shoe Polish Market Analysis by Application: Introduction
- 8.4.2. Market Size Absolute $ Opportunity Analysis and Forecast, By Application, 2016-2032
- 8.4.3. Leather Shoes
- 8.4.4. Synthetic Shoes
- 8.4.5. Boots
- 8.4.6. Formal Shoes
- 8.4.7. Casual Shoes
- 8.5. Latin America Shoe Polish Market Analysis, Opportunity and Forecast, By Distribution Channel, 2016-2032
- 8.5.1. Latin America Shoe Polish Market Analysis by Distribution Channel: Introduction
- 8.5.2. Market Size Absolute $ Opportunity Analysis and Forecast, By Distribution Channel, 2016-2032
- 8.5.3. Supermarkets/Hypermarkets
- 8.5.4. Convenience Stores
- 8.5.5. Online Retailers
- 8.5.6. Pharmacies
- 8.5.7. Specialty Stores
- 8.5.8. Department Stores
- 8.6. Latin America Shoe Polish Market Analysis, Opportunity and Forecast, By Country , 2016-2032
- 8.6.1. Latin America Shoe Polish Market Analysis by Country : Introduction
- 8.6.2. Market Size Absolute $ Opportunity Analysis and Forecast, Country , 2016-2032
- 8.6.2.1. Brazil
- 8.6.2.2. Colombia
- 8.6.2.3. Chile
- 8.6.2.4. Argentina
- 8.6.2.5. Costa Rica
- 8.6.2.6. Rest of Latin America
- 9. Middle East & Africa Shoe Polish Market Analysis, Opportunity and Forecast, 2016-2032
- 9.1. Middle East & Africa Shoe Polish Market Analysis, 2016-2021
- 9.2. Middle East & Africa Shoe Polish Market Opportunity and Forecast, 2023-2032
- 9.3. Middle East & Africa Shoe Polish Market Analysis, Opportunity and Forecast, By Product Type, 2016-2032
- 9.3.1. Middle East & Africa Shoe Polish Market Analysis by Product Type: Introduction
- 9.3.2. Market Size Absolute $ Opportunity Analysis and Forecast, By Product Type, 2016-2032
- 9.3.3. Cream Polish
- 9.3.4. Wax Polish
- 9.3.5. Liquid Polish
- 9.3.6. Foam Polish
- 9.3.7. Paste Polish
- 9.3.8. Others
- 9.4. Middle East & Africa Shoe Polish Market Analysis, Opportunity and Forecast, By Application, 2016-2032
- 9.4.1. Middle East & Africa Shoe Polish Market Analysis by Application: Introduction
- 9.4.2. Market Size Absolute $ Opportunity Analysis and Forecast, By Application, 2016-2032
- 9.4.3. Leather Shoes
- 9.4.4. Synthetic Shoes
- 9.4.5. Boots
- 9.4.6. Formal Shoes
- 9.4.7. Casual Shoes
- 9.5. Middle East & Africa Shoe Polish Market Analysis, Opportunity and Forecast, By Distribution Channel, 2016-2032
- 9.5.1. Middle East & Africa Shoe Polish Market Analysis by Distribution Channel: Introduction
- 9.5.2. Market Size Absolute $ Opportunity Analysis and Forecast, By Distribution Channel, 2016-2032
- 9.5.3. Supermarkets/Hypermarkets
- 9.5.4. Convenience Stores
- 9.5.5. Online Retailers
- 9.5.6. Pharmacies
- 9.5.7. Specialty Stores
- 9.5.8. Department Stores
- 9.6. Middle East & Africa Shoe Polish Market Analysis, Opportunity and Forecast, By Country , 2016-2032
- 9.6.1. Middle East & Africa Shoe Polish Market Analysis by Country : Introduction
- 9.6.2. Market Size Absolute $ Opportunity Analysis and Forecast, Country , 2016-2032
- 9.6.2.1. Algeria
- 9.6.2.2. Egypt
- 9.6.2.3. Israel
- 9.6.2.4. Kuwait
- 9.6.2.5. Nigeria
- 9.6.2.6. Saudi Arabia
- 9.6.2.7. South Africa
- 9.6.2.8. Turkey
- 9.6.2.9. The UAE
- 9.6.2.10. Rest of MEA
- 10. Global Shoe Polish Market Analysis, Opportunity and Forecast, By Region , 2016-2032
- 10.1. Global Shoe Polish Market Analysis by Region : Introduction
- 10.2. Market Size Absolute $ Opportunity Analysis and Forecast, By Region , 2016-2032
- 10.2.1. North America
- 10.2.2. Western Europe
- 10.2.3. Eastern Europe
- 10.2.4. APAC
- 10.2.5. Latin America
- 10.2.6. Middle East & Africa
- 11. Global Shoe Polish Market Competitive Landscape, Market Share Analysis, and Company Profiles
- 11.1. Market Share Analysis
- 11.2. Company Profiles
- 11.3. SC Johnson & Son, Inc.
- 11.3.1. Company Overview
- 11.3.2. Financial Highlights
- 11.3.3. Product Portfolio
- 11.3.4. SWOT Analysis
- 11.3.5. Key Strategies and Developments
- 11.4. Reckitt Benckiser Group plc
- 11.4.1. Company Overview
- 11.4.2. Financial Highlights
- 11.4.3. Product Portfolio
- 11.4.4. SWOT Analysis
- 11.4.5. Key Strategies and Developments
- 11.5. Kiwi (SC Johnson)
- 11.5.1. Company Overview
- 11.5.2. Financial Highlights
- 11.5.3. Product Portfolio
- 11.5.4. SWOT Analysis
- 11.5.5. Key Strategies and Developments
- 11.6. Shinola
- 11.6.1. Company Overview
- 11.6.2. Financial Highlights
- 11.6.3. Product Portfolio
- 11.6.4. SWOT Analysis
- 11.6.5. Key Strategies and Developments
- 11.7. Cherry Blossom
- 11.7.1. Company Overview
- 11.7.2. Financial Highlights
- 11.7.3. Product Portfolio
- 11.7.4. SWOT Analysis
- 11.7.5. Key Strategies and Developments
- 11.8. Moneysworth & Best
- 11.8.1. Company Overview
- 11.8.2. Financial Highlights
- 11.8.3. Product Portfolio
- 11.8.4. SWOT Analysis
- 11.8.5. Key Strategies and Developments
- 11.9. Angelus Shoe Polish
- 11.9.1. Company Overview
- 11.9.2. Financial Highlights
- 11.9.3. Product Portfolio
- 11.9.4. SWOT Analysis
- 11.9.5. Key Strategies and Developments
- 11.10. TRG the One
- 11.10.1. Company Overview
- 11.10.2. Financial Highlights
- 11.10.3. Product Portfolio
- 11.10.4. SWOT Analysis
- 11.10.5. Key Strategies and Developments
- 11.11. Tarrago Brands International
- 11.11.1. Company Overview
- 11.11.2. Financial Highlights
- 11.11.3. Product Portfolio
- 11.11.4. SWOT Analysis
- 11.11.5. Key Strategies and Developments
- 11.12. Cadillac Shoe Products
- 11.12.1. Company Overview
- 11.12.2. Financial Highlights
- 11.12.3. Product Portfolio
- 11.12.4. SWOT Analysis
- 11.12.5. Key Strategies and Developments
- 11.13.1. Company Overview
- 11.13.2. Financial Highlights
- 11.13.3. Product Portfolio
- 11.13.4. SWOT Analysis
- 11.13.5. Key Strategies and Developments
- 11.14. Saphir Medaille d'Or
- 11.14.1. Company Overview
- 11.14.2. Financial Highlights
- 11.14.3. Product Portfolio
- 11.14.4. SWOT Analysis
- 11.14.5. Key Strategies and Developments
- 11.15. Fiebing Company, Inc.
- 11.15.1. Company Overview
- 11.15.2. Financial Highlights
- 11.15.3. Product Portfolio
- 11.15.4. SWOT Analysis
- 11.15.5. Key Strategies and Developments
- 11.16. Lexol (Summit Industries, Inc.)
- 11.16.1. Company Overview
- 11.16.2. Financial Highlights
- 11.16.3. Product Portfolio
- 11.16.4. SWOT Analysis
- 11.16.5. Key Strategies and Developments
- 11.17. Meltonian
- 11.17.1. Company Overview
- 11.17.2. Financial Highlights
- 11.17.3. Product Portfolio
- 11.17.4. SWOT Analysis
- 11.17.5. Key Strategies and Developments
- 12. Assumptions and Acronyms
- 13. Research Methodology
- 14. Contact
"
- List of Figures
- "
- Figure 1: Global Shoe Polish Market Revenue (US$ Mn) Market Share by Product Type in 2022
- Figure 2: Global Shoe Polish Market Attractiveness Analysis by Product Type, 2016-2032
- Figure 3: Global Shoe Polish Market Revenue (US$ Mn) Market Share by Applicationin 2022
- Figure 4: Global Shoe Polish Market Attractiveness Analysis by Application, 2016-2032
- Figure 5: Global Shoe Polish Market Revenue (US$ Mn) Market Share by Distribution Channelin 2022
- Figure 6: Global Shoe Polish Market Attractiveness Analysis by Distribution Channel, 2016-2032
- Figure 7: Global Shoe Polish Market Revenue (US$ Mn) Market Share by Region in 2022
- Figure 8: Global Shoe Polish Market Attractiveness Analysis by Region, 2016-2032
- Figure 9: Global Shoe Polish Market Revenue (US$ Mn) (2016-2032)
- Figure 10: Global Shoe Polish Market Revenue (US$ Mn) Comparison by Region (2016-2032)
- Figure 11: Global Shoe Polish Market Revenue (US$ Mn) Comparison by Product Type (2016-2032)
- Figure 12: Global Shoe Polish Market Revenue (US$ Mn) Comparison by Application (2016-2032)
- Figure 13: Global Shoe Polish Market Revenue (US$ Mn) Comparison by Distribution Channel (2016-2032)
- Figure 14: Global Shoe Polish Market Y-o-Y Growth Rate Comparison by Region (2016-2032)
- Figure 15: Global Shoe Polish Market Y-o-Y Growth Rate Comparison by Product Type (2016-2032)
- Figure 16: Global Shoe Polish Market Y-o-Y Growth Rate Comparison by Application (2016-2032)
- Figure 17: Global Shoe Polish Market Y-o-Y Growth Rate Comparison by Distribution Channel (2016-2032)
- Figure 18: Global Shoe Polish Market Share Comparison by Region (2016-2032)
- Figure 19: Global Shoe Polish Market Share Comparison by Product Type (2016-2032)
- Figure 20: Global Shoe Polish Market Share Comparison by Application (2016-2032)
- Figure 21: Global Shoe Polish Market Share Comparison by Distribution Channel (2016-2032)
- Figure 22: North America Shoe Polish Market Revenue (US$ Mn) Market Share by Product Typein 2022
- Figure 23: North America Shoe Polish Market Attractiveness Analysis by Product Type, 2016-2032
- Figure 24: North America Shoe Polish Market Revenue (US$ Mn) Market Share by Applicationin 2022
- Figure 25: North America Shoe Polish Market Attractiveness Analysis by Application, 2016-2032
- Figure 26: North America Shoe Polish Market Revenue (US$ Mn) Market Share by Distribution Channelin 2022
- Figure 27: North America Shoe Polish Market Attractiveness Analysis by Distribution Channel, 2016-2032
- Figure 28: North America Shoe Polish Market Revenue (US$ Mn) Market Share by Country in 2022
- Figure 29: North America Shoe Polish Market Attractiveness Analysis by Country, 2016-2032
- Figure 30: North America Shoe Polish Market Revenue (US$ Mn) (2016-2032)
- Figure 31: North America Shoe Polish Market Revenue (US$ Mn) Comparison by Country (2016-2032)
- Figure 32: North America Shoe Polish Market Revenue (US$ Mn) Comparison by Product Type (2016-2032)
- Figure 33: North America Shoe Polish Market Revenue (US$ Mn) Comparison by Application (2016-2032)
- Figure 34: North America Shoe Polish Market Revenue (US$ Mn) Comparison by Distribution Channel (2016-2032)
- Figure 35: North America Shoe Polish Market Y-o-Y Growth Rate Comparison by Country (2016-2032)
- Figure 36: North America Shoe Polish Market Y-o-Y Growth Rate Comparison by Product Type (2016-2032)
- Figure 37: North America Shoe Polish Market Y-o-Y Growth Rate Comparison by Application (2016-2032)
- Figure 38: North America Shoe Polish Market Y-o-Y Growth Rate Comparison by Distribution Channel (2016-2032)
- Figure 39: North America Shoe Polish Market Share Comparison by Country (2016-2032)
- Figure 40: North America Shoe Polish Market Share Comparison by Product Type (2016-2032)
- Figure 41: North America Shoe Polish Market Share Comparison by Application (2016-2032)
- Figure 42: North America Shoe Polish Market Share Comparison by Distribution Channel (2016-2032)
- Figure 43: Western Europe Shoe Polish Market Revenue (US$ Mn) Market Share by Product Typein 2022
- Figure 44: Western Europe Shoe Polish Market Attractiveness Analysis by Product Type, 2016-2032
- Figure 45: Western Europe Shoe Polish Market Revenue (US$ Mn) Market Share by Applicationin 2022
- Figure 46: Western Europe Shoe Polish Market Attractiveness Analysis by Application, 2016-2032
- Figure 47: Western Europe Shoe Polish Market Revenue (US$ Mn) Market Share by Distribution Channelin 2022
- Figure 48: Western Europe Shoe Polish Market Attractiveness Analysis by Distribution Channel, 2016-2032
- Figure 49: Western Europe Shoe Polish Market Revenue (US$ Mn) Market Share by Country in 2022
- Figure 50: Western Europe Shoe Polish Market Attractiveness Analysis by Country, 2016-2032
- Figure 51: Western Europe Shoe Polish Market Revenue (US$ Mn) (2016-2032)
- Figure 52: Western Europe Shoe Polish Market Revenue (US$ Mn) Comparison by Country (2016-2032)
- Figure 53: Western Europe Shoe Polish Market Revenue (US$ Mn) Comparison by Product Type (2016-2032)
- Figure 54: Western Europe Shoe Polish Market Revenue (US$ Mn) Comparison by Application (2016-2032)
- Figure 55: Western Europe Shoe Polish Market Revenue (US$ Mn) Comparison by Distribution Channel (2016-2032)
- Figure 56: Western Europe Shoe Polish Market Y-o-Y Growth Rate Comparison by Country (2016-2032)
- Figure 57: Western Europe Shoe Polish Market Y-o-Y Growth Rate Comparison by Product Type (2016-2032)
- Figure 58: Western Europe Shoe Polish Market Y-o-Y Growth Rate Comparison by Application (2016-2032)
- Figure 59: Western Europe Shoe Polish Market Y-o-Y Growth Rate Comparison by Distribution Channel (2016-2032)
- Figure 60: Western Europe Shoe Polish Market Share Comparison by Country (2016-2032)
- Figure 61: Western Europe Shoe Polish Market Share Comparison by Product Type (2016-2032)
- Figure 62: Western Europe Shoe Polish Market Share Comparison by Application (2016-2032)
- Figure 63: Western Europe Shoe Polish Market Share Comparison by Distribution Channel (2016-2032)
- Figure 64: Eastern Europe Shoe Polish Market Revenue (US$ Mn) Market Share by Product Typein 2022
- Figure 65: Eastern Europe Shoe Polish Market Attractiveness Analysis by Product Type, 2016-2032
- Figure 66: Eastern Europe Shoe Polish Market Revenue (US$ Mn) Market Share by Applicationin 2022
- Figure 67: Eastern Europe Shoe Polish Market Attractiveness Analysis by Application, 2016-2032
- Figure 68: Eastern Europe Shoe Polish Market Revenue (US$ Mn) Market Share by Distribution Channelin 2022
- Figure 69: Eastern Europe Shoe Polish Market Attractiveness Analysis by Distribution Channel, 2016-2032
- Figure 70: Eastern Europe Shoe Polish Market Revenue (US$ Mn) Market Share by Country in 2022
- Figure 71: Eastern Europe Shoe Polish Market Attractiveness Analysis by Country, 2016-2032
- Figure 72: Eastern Europe Shoe Polish Market Revenue (US$ Mn) (2016-2032)
- Figure 73: Eastern Europe Shoe Polish Market Revenue (US$ Mn) Comparison by Country (2016-2032)
- Figure 74: Eastern Europe Shoe Polish Market Revenue (US$ Mn) Comparison by Product Type (2016-2032)
- Figure 75: Eastern Europe Shoe Polish Market Revenue (US$ Mn) Comparison by Application (2016-2032)
- Figure 76: Eastern Europe Shoe Polish Market Revenue (US$ Mn) Comparison by Distribution Channel (2016-2032)
- Figure 77: Eastern Europe Shoe Polish Market Y-o-Y Growth Rate Comparison by Country (2016-2032)
- Figure 78: Eastern Europe Shoe Polish Market Y-o-Y Growth Rate Comparison by Product Type (2016-2032)
- Figure 79: Eastern Europe Shoe Polish Market Y-o-Y Growth Rate Comparison by Application (2016-2032)
- Figure 80: Eastern Europe Shoe Polish Market Y-o-Y Growth Rate Comparison by Distribution Channel (2016-2032)
- Figure 81: Eastern Europe Shoe Polish Market Share Comparison by Country (2016-2032)
- Figure 82: Eastern Europe Shoe Polish Market Share Comparison by Product Type (2016-2032)
- Figure 83: Eastern Europe Shoe Polish Market Share Comparison by Application (2016-2032)
- Figure 84: Eastern Europe Shoe Polish Market Share Comparison by Distribution Channel (2016-2032)
- Figure 85: APAC Shoe Polish Market Revenue (US$ Mn) Market Share by Product Typein 2022
- Figure 86: APAC Shoe Polish Market Attractiveness Analysis by Product Type, 2016-2032
- Figure 87: APAC Shoe Polish Market Revenue (US$ Mn) Market Share by Applicationin 2022
- Figure 88: APAC Shoe Polish Market Attractiveness Analysis by Application, 2016-2032
- Figure 89: APAC Shoe Polish Market Revenue (US$ Mn) Market Share by Distribution Channelin 2022
- Figure 90: APAC Shoe Polish Market Attractiveness Analysis by Distribution Channel, 2016-2032
- Figure 91: APAC Shoe Polish Market Revenue (US$ Mn) Market Share by Country in 2022
- Figure 92: APAC Shoe Polish Market Attractiveness Analysis by Country, 2016-2032
- Figure 93: APAC Shoe Polish Market Revenue (US$ Mn) (2016-2032)
- Figure 94: APAC Shoe Polish Market Revenue (US$ Mn) Comparison by Country (2016-2032)
- Figure 95: APAC Shoe Polish Market Revenue (US$ Mn) Comparison by Product Type (2016-2032)
- Figure 96: APAC Shoe Polish Market Revenue (US$ Mn) Comparison by Application (2016-2032)
- Figure 97: APAC Shoe Polish Market Revenue (US$ Mn) Comparison by Distribution Channel (2016-2032)
- Figure 98: APAC Shoe Polish Market Y-o-Y Growth Rate Comparison by Country (2016-2032)
- Figure 99: APAC Shoe Polish Market Y-o-Y Growth Rate Comparison by Product Type (2016-2032)
- Figure 100: APAC Shoe Polish Market Y-o-Y Growth Rate Comparison by Application (2016-2032)
- Figure 101: APAC Shoe Polish Market Y-o-Y Growth Rate Comparison by Distribution Channel (2016-2032)
- Figure 102: APAC Shoe Polish Market Share Comparison by Country (2016-2032)
- Figure 103: APAC Shoe Polish Market Share Comparison by Product Type (2016-2032)
- Figure 104: APAC Shoe Polish Market Share Comparison by Application (2016-2032)
- Figure 105: APAC Shoe Polish Market Share Comparison by Distribution Channel (2016-2032)
- Figure 106: Latin America Shoe Polish Market Revenue (US$ Mn) Market Share by Product Typein 2022
- Figure 107: Latin America Shoe Polish Market Attractiveness Analysis by Product Type, 2016-2032
- Figure 108: Latin America Shoe Polish Market Revenue (US$ Mn) Market Share by Applicationin 2022
- Figure 109: Latin America Shoe Polish Market Attractiveness Analysis by Application, 2016-2032
- Figure 110: Latin America Shoe Polish Market Revenue (US$ Mn) Market Share by Distribution Channelin 2022
- Figure 111: Latin America Shoe Polish Market Attractiveness Analysis by Distribution Channel, 2016-2032
- Figure 112: Latin America Shoe Polish Market Revenue (US$ Mn) Market Share by Country in 2022
- Figure 113: Latin America Shoe Polish Market Attractiveness Analysis by Country, 2016-2032
- Figure 114: Latin America Shoe Polish Market Revenue (US$ Mn) (2016-2032)
- Figure 115: Latin America Shoe Polish Market Revenue (US$ Mn) Comparison by Country (2016-2032)
- Figure 116: Latin America Shoe Polish Market Revenue (US$ Mn) Comparison by Product Type (2016-2032)
- Figure 117: Latin America Shoe Polish Market Revenue (US$ Mn) Comparison by Application (2016-2032)
- Figure 118: Latin America Shoe Polish Market Revenue (US$ Mn) Comparison by Distribution Channel (2016-2032)
- Figure 119: Latin America Shoe Polish Market Y-o-Y Growth Rate Comparison by Country (2016-2032)
- Figure 120: Latin America Shoe Polish Market Y-o-Y Growth Rate Comparison by Product Type (2016-2032)
- Figure 121: Latin America Shoe Polish Market Y-o-Y Growth Rate Comparison by Application (2016-2032)
- Figure 122: Latin America Shoe Polish Market Y-o-Y Growth Rate Comparison by Distribution Channel (2016-2032)
- Figure 123: Latin America Shoe Polish Market Share Comparison by Country (2016-2032)
- Figure 124: Latin America Shoe Polish Market Share Comparison by Product Type (2016-2032)
- Figure 125: Latin America Shoe Polish Market Share Comparison by Application (2016-2032)
- Figure 126: Latin America Shoe Polish Market Share Comparison by Distribution Channel (2016-2032)
- Figure 127: Middle East & Africa Shoe Polish Market Revenue (US$ Mn) Market Share by Product Typein 2022
- Figure 128: Middle East & Africa Shoe Polish Market Attractiveness Analysis by Product Type, 2016-2032
- Figure 129: Middle East & Africa Shoe Polish Market Revenue (US$ Mn) Market Share by Applicationin 2022
- Figure 130: Middle East & Africa Shoe Polish Market Attractiveness Analysis by Application, 2016-2032
- Figure 131: Middle East & Africa Shoe Polish Market Revenue (US$ Mn) Market Share by Distribution Channelin 2022
- Figure 132: Middle East & Africa Shoe Polish Market Attractiveness Analysis by Distribution Channel, 2016-2032
- Figure 133: Middle East & Africa Shoe Polish Market Revenue (US$ Mn) Market Share by Country in 2022
- Figure 134: Middle East & Africa Shoe Polish Market Attractiveness Analysis by Country, 2016-2032
- Figure 135: Middle East & Africa Shoe Polish Market Revenue (US$ Mn) (2016-2032)
- Figure 136: Middle East & Africa Shoe Polish Market Revenue (US$ Mn) Comparison by Country (2016-2032)
- Figure 137: Middle East & Africa Shoe Polish Market Revenue (US$ Mn) Comparison by Product Type (2016-2032)
- Figure 138: Middle East & Africa Shoe Polish Market Revenue (US$ Mn) Comparison by Application (2016-2032)
- Figure 139: Middle East & Africa Shoe Polish Market Revenue (US$ Mn) Comparison by Distribution Channel (2016-2032)
- Figure 140: Middle East & Africa Shoe Polish Market Y-o-Y Growth Rate Comparison by Country (2016-2032)
- Figure 141: Middle East & Africa Shoe Polish Market Y-o-Y Growth Rate Comparison by Product Type (2016-2032)
- Figure 142: Middle East & Africa Shoe Polish Market Y-o-Y Growth Rate Comparison by Application (2016-2032)
- Figure 143: Middle East & Africa Shoe Polish Market Y-o-Y Growth Rate Comparison by Distribution Channel (2016-2032)
- Figure 144: Middle East & Africa Shoe Polish Market Share Comparison by Country (2016-2032)
- Figure 145: Middle East & Africa Shoe Polish Market Share Comparison by Product Type (2016-2032)
- Figure 146: Middle East & Africa Shoe Polish Market Share Comparison by Application (2016-2032)
- Figure 147: Middle East & Africa Shoe Polish Market Share Comparison by Distribution Channel (2016-2032)
"
- List of Tables
- "
- Table 1: Global Shoe Polish Market Comparison by Product Type (2016-2032)
- Table 2: Global Shoe Polish Market Comparison by Application (2016-2032)
- Table 3: Global Shoe Polish Market Comparison by Distribution Channel (2016-2032)
- Table 4: Global Shoe Polish Market Revenue (US$ Mn) Comparison by Region (2016-2032)
- Table 5: Global Shoe Polish Market Revenue (US$ Mn) (2016-2032)
- Table 6: Global Shoe Polish Market Revenue (US$ Mn) Comparison by Region (2016-2032)
- Table 7: Global Shoe Polish Market Revenue (US$ Mn) Comparison by Product Type (2016-2032)
- Table 8: Global Shoe Polish Market Revenue (US$ Mn) Comparison by Application (2016-2032)
- Table 9: Global Shoe Polish Market Revenue (US$ Mn) Comparison by Distribution Channel (2016-2032)
- Table 10: Global Shoe Polish Market Y-o-Y Growth Rate Comparison by Region (2016-2032)
- Table 11: Global Shoe Polish Market Y-o-Y Growth Rate Comparison by Product Type (2016-2032)
- Table 12: Global Shoe Polish Market Y-o-Y Growth Rate Comparison by Application (2016-2032)
- Table 13: Global Shoe Polish Market Y-o-Y Growth Rate Comparison by Distribution Channel (2016-2032)
- Table 14: Global Shoe Polish Market Share Comparison by Region (2016-2032)
- Table 15: Global Shoe Polish Market Share Comparison by Product Type (2016-2032)
- Table 16: Global Shoe Polish Market Share Comparison by Application (2016-2032)
- Table 17: Global Shoe Polish Market Share Comparison by Distribution Channel (2016-2032)
- Table 18: North America Shoe Polish Market Comparison by Application (2016-2032)
- Table 19: North America Shoe Polish Market Comparison by Distribution Channel (2016-2032)
- Table 20: North America Shoe Polish Market Revenue (US$ Mn) Comparison by Country (2016-2032)
- Table 21: North America Shoe Polish Market Revenue (US$ Mn) (2016-2032)
- Table 22: North America Shoe Polish Market Revenue (US$ Mn) Comparison by Country (2016-2032)
- Table 23: North America Shoe Polish Market Revenue (US$ Mn) Comparison by Product Type (2016-2032)
- Table 24: North America Shoe Polish Market Revenue (US$ Mn) Comparison by Application (2016-2032)
- Table 25: North America Shoe Polish Market Revenue (US$ Mn) Comparison by Distribution Channel (2016-2032)
- Table 26: North America Shoe Polish Market Y-o-Y Growth Rate Comparison by Country (2016-2032)
- Table 27: North America Shoe Polish Market Y-o-Y Growth Rate Comparison by Product Type (2016-2032)
- Table 28: North America Shoe Polish Market Y-o-Y Growth Rate Comparison by Application (2016-2032)
- Table 29: North America Shoe Polish Market Y-o-Y Growth Rate Comparison by Distribution Channel (2016-2032)
- Table 30: North America Shoe Polish Market Share Comparison by Country (2016-2032)
- Table 31: North America Shoe Polish Market Share Comparison by Product Type (2016-2032)
- Table 32: North America Shoe Polish Market Share Comparison by Application (2016-2032)
- Table 33: North America Shoe Polish Market Share Comparison by Distribution Channel (2016-2032)
- Table 34: Western Europe Shoe Polish Market Comparison by Product Type (2016-2032)
- Table 35: Western Europe Shoe Polish Market Comparison by Application (2016-2032)
- Table 36: Western Europe Shoe Polish Market Comparison by Distribution Channel (2016-2032)
- Table 37: Western Europe Shoe Polish Market Revenue (US$ Mn) Comparison by Country (2016-2032)
- Table 38: Western Europe Shoe Polish Market Revenue (US$ Mn) (2016-2032)
- Table 39: Western Europe Shoe Polish Market Revenue (US$ Mn) Comparison by Country (2016-2032)
- Table 40: Western Europe Shoe Polish Market Revenue (US$ Mn) Comparison by Product Type (2016-2032)
- Table 41: Western Europe Shoe Polish Market Revenue (US$ Mn) Comparison by Application (2016-2032)
- Table 42: Western Europe Shoe Polish Market Revenue (US$ Mn) Comparison by Distribution Channel (2016-2032)
- Table 43: Western Europe Shoe Polish Market Y-o-Y Growth Rate Comparison by Country (2016-2032)
- Table 44: Western Europe Shoe Polish Market Y-o-Y Growth Rate Comparison by Product Type (2016-2032)
- Table 45: Western Europe Shoe Polish Market Y-o-Y Growth Rate Comparison by Application (2016-2032)
- Table 46: Western Europe Shoe Polish Market Y-o-Y Growth Rate Comparison by Distribution Channel (2016-2032)
- Table 47: Western Europe Shoe Polish Market Share Comparison by Country (2016-2032)
- Table 48: Western Europe Shoe Polish Market Share Comparison by Product Type (2016-2032)
- Table 49: Western Europe Shoe Polish Market Share Comparison by Application (2016-2032)
- Table 50: Western Europe Shoe Polish Market Share Comparison by Distribution Channel (2016-2032)
- Table 51: Eastern Europe Shoe Polish Market Comparison by Product Type (2016-2032)
- Table 52: Eastern Europe Shoe Polish Market Comparison by Application (2016-2032)
- Table 53: Eastern Europe Shoe Polish Market Comparison by Distribution Channel (2016-2032)
- Table 54: Eastern Europe Shoe Polish Market Revenue (US$ Mn) Comparison by Country (2016-2032)
- Table 55: Eastern Europe Shoe Polish Market Revenue (US$ Mn) (2016-2032)
- Table 56: Eastern Europe Shoe Polish Market Revenue (US$ Mn) Comparison by Country (2016-2032)
- Table 57: Eastern Europe Shoe Polish Market Revenue (US$ Mn) Comparison by Product Type (2016-2032)
- Table 58: Eastern Europe Shoe Polish Market Revenue (US$ Mn) Comparison by Application (2016-2032)
- Table 59: Eastern Europe Shoe Polish Market Revenue (US$ Mn) Comparison by Distribution Channel (2016-2032)
- Table 60: Eastern Europe Shoe Polish Market Y-o-Y Growth Rate Comparison by Country (2016-2032)
- Table 61: Eastern Europe Shoe Polish Market Y-o-Y Growth Rate Comparison by Product Type (2016-2032)
- Table 62: Eastern Europe Shoe Polish Market Y-o-Y Growth Rate Comparison by Application (2016-2032)
- Table 63: Eastern Europe Shoe Polish Market Y-o-Y Growth Rate Comparison by Distribution Channel (2016-2032)
- Table 64: Eastern Europe Shoe Polish Market Share Comparison by Country (2016-2032)
- Table 65: Eastern Europe Shoe Polish Market Share Comparison by Product Type (2016-2032)
- Table 66: Eastern Europe Shoe Polish Market Share Comparison by Application (2016-2032)
- Table 67: Eastern Europe Shoe Polish Market Share Comparison by Distribution Channel (2016-2032)
- Table 68: APAC Shoe Polish Market Comparison by Product Type (2016-2032)
- Table 69: APAC Shoe Polish Market Comparison by Application (2016-2032)
- Table 70: APAC Shoe Polish Market Comparison by Distribution Channel (2016-2032)
- Table 71: APAC Shoe Polish Market Revenue (US$ Mn) Comparison by Country (2016-2032)
- Table 72: APAC Shoe Polish Market Revenue (US$ Mn) (2016-2032)
- Table 73: APAC Shoe Polish Market Revenue (US$ Mn) Comparison by Country (2016-2032)
- Table 74: APAC Shoe Polish Market Revenue (US$ Mn) Comparison by Product Type (2016-2032)
- Table 75: APAC Shoe Polish Market Revenue (US$ Mn) Comparison by Application (2016-2032)
- Table 76: APAC Shoe Polish Market Revenue (US$ Mn) Comparison by Distribution Channel (2016-2032)
- Table 77: APAC Shoe Polish Market Y-o-Y Growth Rate Comparison by Country (2016-2032)
- Table 78: APAC Shoe Polish Market Y-o-Y Growth Rate Comparison by Product Type (2016-2032)
- Table 79: APAC Shoe Polish Market Y-o-Y Growth Rate Comparison by Application (2016-2032)
- Table 80: APAC Shoe Polish Market Y-o-Y Growth Rate Comparison by Distribution Channel (2016-2032)
- Table 81: APAC Shoe Polish Market Share Comparison by Country (2016-2032)
- Table 82: APAC Shoe Polish Market Share Comparison by Product Type (2016-2032)
- Table 83: APAC Shoe Polish Market Share Comparison by Application (2016-2032)
- Table 84: APAC Shoe Polish Market Share Comparison by Distribution Channel (2016-2032)
- Table 85: Latin America Shoe Polish Market Comparison by Product Type (2016-2032)
- Table 86: Latin America Shoe Polish Market Comparison by Application (2016-2032)
- Table 87: Latin America Shoe Polish Market Comparison by Distribution Channel (2016-2032)
- Table 88: Latin America Shoe Polish Market Revenue (US$ Mn) Comparison by Country (2016-2032)
- Table 89: Latin America Shoe Polish Market Revenue (US$ Mn) (2016-2032)
- Table 90: Latin America Shoe Polish Market Revenue (US$ Mn) Comparison by Country (2016-2032)
- Table 91: Latin America Shoe Polish Market Revenue (US$ Mn) Comparison by Product Type (2016-2032)
- Table 92: Latin America Shoe Polish Market Revenue (US$ Mn) Comparison by Application (2016-2032)
- Table 93: Latin America Shoe Polish Market Revenue (US$ Mn) Comparison by Distribution Channel (2016-2032)
- Table 94: Latin America Shoe Polish Market Y-o-Y Growth Rate Comparison by Country (2016-2032)
- Table 95: Latin America Shoe Polish Market Y-o-Y Growth Rate Comparison by Product Type (2016-2032)
- Table 96: Latin America Shoe Polish Market Y-o-Y Growth Rate Comparison by Application (2016-2032)
- Table 97: Latin America Shoe Polish Market Y-o-Y Growth Rate Comparison by Distribution Channel (2016-2032)
- Table 98: Latin America Shoe Polish Market Share Comparison by Country (2016-2032)
- Table 99: Latin America Shoe Polish Market Share Comparison by Product Type (2016-2032)
- Table 100: Latin America Shoe Polish Market Share Comparison by Application (2016-2032)
- Table 101: Latin America Shoe Polish Market Share Comparison by Distribution Channel (2016-2032)
- Table 102: Middle East & Africa Shoe Polish Market Comparison by Product Type (2016-2032)
- Table 103: Middle East & Africa Shoe Polish Market Comparison by Application (2016-2032)
- Table 104: Middle East & Africa Shoe Polish Market Comparison by Distribution Channel (2016-2032)
- Table 105: Middle East & Africa Shoe Polish Market Revenue (US$ Mn) Comparison by Country (2016-2032)
- Table 106: Middle East & Africa Shoe Polish Market Revenue (US$ Mn) (2016-2032)
- Table 107: Middle East & Africa Shoe Polish Market Revenue (US$ Mn) Comparison by Country (2016-2032)
- Table 108: Middle East & Africa Shoe Polish Market Revenue (US$ Mn) Comparison by Product Type (2016-2032)
- Table 109: Middle East & Africa Shoe Polish Market Revenue (US$ Mn) Comparison by Application (2016-2032)
- Table 110: Middle East & Africa Shoe Polish Market Revenue (US$ Mn) Comparison by Distribution Channel (2016-2032)
- Table 111: Middle East & Africa Shoe Polish Market Y-o-Y Growth Rate Comparison by Country (2016-2032)
- Table 112: Middle East & Africa Shoe Polish Market Y-o-Y Growth Rate Comparison by Product Type (2016-2032)
- Table 113: Middle East & Africa Shoe Polish Market Y-o-Y Growth Rate Comparison by Application (2016-2032)
- Table 114: Middle East & Africa Shoe Polish Market Y-o-Y Growth Rate Comparison by Distribution Channel (2016-2032)
- Table 115: Middle East & Africa Shoe Polish Market Share Comparison by Country (2016-2032)
- Table 116: Middle East & Africa Shoe Polish Market Share Comparison by Product Type (2016-2032)
- Table 117: Middle East & Africa Shoe Polish Market Share Comparison by Application (2016-2032)
- Table 118: Middle East & Africa Shoe Polish Market Share Comparison by Distribution Channel (2016-2032)
- 1. Executive Summary
-
- SC Johnson & Son, Inc.
- Reckitt Benckiser Group plc
- Kiwi (SC Johnson)
- Shinola
- Cherry Blossom
- Moneysworth & Best
- Angelus Shoe Polish
- TRG the One
- Tarrago Brands International
- Cadillac Shoe Products
- Saphir Medaille d'Or
- Lincoln Shoe Polish
- Fiebing Company, Inc.
- Lexol (Summit Industries, Inc.)
- Meltonian
Our Clients


View Our Licence Options
