Footwear Market Report By Product Type (Athletic Footwear [Running Shoes, Training and Walking Shoes, Sports Shoes, Others], Non-Athletic Footwear [Casual Footwear, Formal Footwear, Boots, Others]), By Material (Leather, Non-Leather [Synthetic, Fabric, Rubber, Others]), By End-User (Men, Women, Children), By Distribution Channel (Online Stores, Offline Stores [Supermarkets/Hypermarkets, Specialty Stores, Brand Outlets, Others]), By Region and Companies - Industry Segment Outlook, Market Assessment, Competition Scenario, Trends and Forecast 2024-2033
-
11099
-
August 2024
-
325
-


-
This report was compiled by Research Team Research team of over 50 passionate professionals leverages advanced research methodologies and analytical expertise to deliver insightful, data-driven market intelligence that empowers businesses across diverse industries to make strategic, well-informed Correspondence Research Team Linkedin | Detailed Market research Methodology Our methodology involves a mix of primary research, including interviews with leading mental health experts, and secondary research from reputable medical journals and databases. View Detailed Methodology Page
-
Quick Navigation
Report Overview
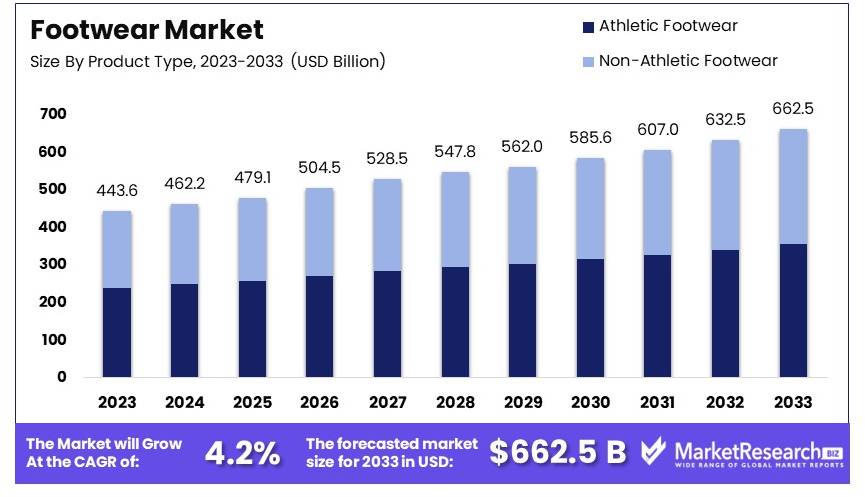
The Global Footwear Market size is expected to be worth around USD 662.5 Billion by 2033, from USD 443.6 Billion in 2023, growing at a CAGR of 4.2% during the forecast period from 2024 to 2033.
The Footwear Market encompasses the production and sale of shoes, sandals, boots, and athletic footwear. It caters to a wide range of consumers including men, women, and children. Key segments include casual, formal, sports, and luxury footwear. The market is driven by fashion trends, increasing disposable income, and growing awareness of foot health.
Major distribution channels include retail stores, e-commerce platforms, and specialty stores. Innovation in design and materials, such as sustainable and lightweight options, boosts market growth. Challenges include fluctuating raw material prices and counterfeit products. The market is highly competitive with numerous global and regional players. Growth is expected due to rising consumer demand and expanding fashion trends.
The footwear market is undergoing significant growth and transformation, driven by increasing production and evolving consumer preferences. In 2022, global footwear production reached 23.9 billion pairs, marking a 7.6% increase from the previous year. Asia dominates this sector, contributing over 87% of global footwear production. This region's output supplies major importers like Germany, Japan, and France, underscoring its critical role in the global supply chain.
The market dynamics are shaped by both production scale and innovation. A concentrated group of ten countries accounts for 88% of the world’s footwear production, highlighting the industry's geographic concentration. Leading brands like Nike and Adidas are pioneering sustainability efforts, responding to the rising consumer demand for eco-friendly products. Nike's 2022 launch of shoes made entirely from recycled materials exemplifies this trend, aligning with broader environmental concerns and corporate social responsibility initiatives.
The athleisure trend is another pivotal factor driving market growth. There has been a notable 20% increase in athletic footwear sales among millennials, reflecting a shift towards products that combine comfort and style. This trend is influencing both design and marketing strategies within the industry, as companies strive to meet the lifestyle needs of younger consumers.
The footwear market is poised for continued expansion, fueled by robust production capabilities in Asia and innovative responses to consumer demands. Companies must focus on sustainability and adaptability to maintain competitiveness in this dynamic market. By leveraging production efficiencies and embracing eco-friendly materials, the footwear industry can achieve sustained growth and meet the evolving expectations of a global consumer base.
Key Takeaways
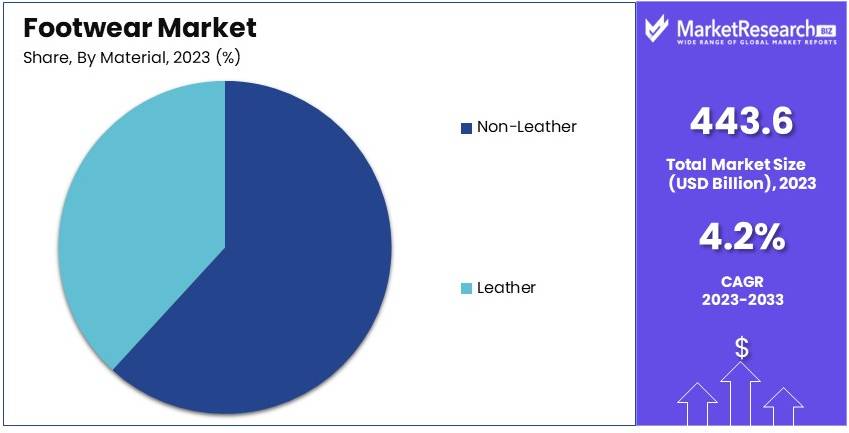
- Market Value: The Footwear Market was valued at USD 443.6 billion in 2023 and is projected to reach USD 662.5 billion by 2033, with a CAGR of 4.2%.
- Product Type Analysis: Athletic Footwear dominates at 53.6%; a primary choice for active lifestyles.
- Material Analysis: Non-Leather materials lead with 67.8%; favored for versatility and sustainability.
- End User Analysis: Women are the largest market segment at 52.3%; driven by diverse footwear demands.
- Distribution Channel Analysis: Online Stores are the primary channel at 58.4%; convenience drives their popularity.
- Dominant Region: APAC leads with 44.1%; strong growth driven by increasing consumer spending.
Driving Factors
Rising Health Consciousness and Fitness Trends Drive Market Growth
The increasing awareness of personal health and fitness is driving demand for athletic and performance footwear. More people are engaging in sports and physical activities, leading to a surge in sales of running and walking shoes. For instance, Nike reported a 19% increase in running shoe sales in 2023, largely due to the post-pandemic fitness boom.
This trend underscores the importance of footwear in supporting active lifestyles. As more individuals prioritize fitness, the need for high-quality, comfortable, and durable footwear grows. This shift towards healthier living also interacts with advancements in footwear technology, enhancing the market's appeal.
E-commerce Growth and Direct-to-Consumer Strategies Drive Market Growth
The shift towards online shopping is transforming the footwear industry. Brands are leveraging e-commerce to reach a wider audience and offer personalized shopping experiences. Companies like Allbirds have built strong online presences, fostering customer loyalty through direct-to-consumer strategies.
E-commerce growth enables footwear brands to expand their market reach and engage with customers more effectively. This trend also facilitates the collection of consumer data, allowing brands to tailor their offerings to meet specific preferences. The convenience of online shopping combined with innovative direct-to-consumer approaches significantly enhances market growth.
Sustainability and Eco-Friendly Materials Drive Market Growth
The increasing demand for sustainable and eco-friendly products is pushing footwear brands to innovate with green materials and production methods. Consumers are prioritizing environmental responsibility in their purchasing decisions. Adidas, for example, has committed to using only recycled polyester in all its products by 2024 and has seen success with its "Parley" line made from ocean plastic.
This trend towards sustainable footwear is encouraging brands to adopt environmentally friendly practices. The integration of eco-friendly materials not only meets consumer demand but also aligns with global sustainability goals, fostering long-term market growth.
Restraining Factors
Supply Chain Disruptions Restrain Market Growth
Supply chain disruptions have significantly impacted the footwear market. Global events such as the COVID-19 pandemic and geopolitical tensions have led to production and distribution challenges. For example, Nike experienced production setbacks in Vietnam due to pandemic-related factory closures in 2021. These disruptions affected inventory levels and sales.
Manufacturers face difficulties in maintaining consistent supply chains, leading to delays and shortages. This unpredictability can hinder the ability to meet consumer demand, affecting overall market growth. Companies struggle to adapt to these disruptions, impacting their operational efficiency and profitability.
Rising Raw Material Costs Restrain Market Growth
Rising raw material costs have put substantial pressure on the footwear market. The increasing prices of key materials like leather, rubber, and synthetic components have squeezed manufacturers' profit margins. For instance, Wolverine Worldwide reported a significant impact on its gross margins in 2023 due to higher material costs.
Manufacturers are forced to absorb these costs or pass them on to consumers, potentially reducing demand. Higher prices can deter price-sensitive consumers, leading to decreased sales and hindering market growth. The ongoing increase in raw material costs remains a persistent challenge for the industry.
Product Type Analysis
Athletic Footwear dominates with 53.6% due to increasing health awareness and sports participation.
Athletic Footwear leads the footwear market, holding a 53.6% share, driven by a global increase in health consciousness and participation in sports and fitness activities. This segment is highly diverse, including Running Footwear, Training and Walking Shoes, Sports Shoes, and others, catering to various consumer needs and activities.
Running Shoes, as a sub-segment, play a crucial role, favored for their comfort and technology that enhance performance and prevent injuries, making up about 21.4% of the athletic footwear market. Training and Walking Shoes, which include footwear for gym activities and everyday use, account for 16.2%, appreciated for their versatility and comfort. Sports Shoes, designed for specific sports like basketball or soccer, hold a 12.3% share, driven by professional and amateur sports engagement.
The 'Others' category within Athletic Footwear encompasses specialized shoes, such as those designed for specific climatic conditions or unique sports, contributing to the segment's depth and appeal.
Non-Athletic Footwear, which includes Casual Footwear, Formal Footwear, Boots, and others, makes up the remaining market share. Casual Footwear is notable for its everyday use and comfort, while Formal Footwear is essential for business attire and formal events. Boots are preferred for their durability and style, particularly in colder climates.
The dominance of Athletic Footwear is supported by technological advancements in shoe manufacturing, which improve comfort and performance, appealing to a broad consumer base. Meanwhile, Non-Athletic Footwear continues to play a vital role in the industry, meeting the diverse needs of global consumers for style, comfort, and functionality.
Material Analysis
Non-Leather dominates with 67.8% due to cost-effectiveness and versatile designs.
In the footwear material segment, Non-Leather materials lead with a 67.8% market share, driven by their affordability, variety in design, and appeal to ethically conscious consumers. Non-Leather materials include Synthetic, Fabric, Rubber, and others, each serving different consumer preferences and needs.
Synthetic materials, making up about 38.4% of the non-leather market, are popular for their durability and ease of maintenance. They are commonly used in both athletic and non-athletic shoes. Fabric, which accounts for 21.3%, is favored for its comfort and breathability, often used in casual and summer shoes. Rubber is essential for both performance and utility footwear, comprising 14.6%, valued for its waterproof properties and resilience.
The 'Others' category includes materials like plastic and plant-based alternatives, which are gaining popularity due to environmental concerns and innovative developments in sustainable footwear.
Leather, holding the remainder of the market, is prized for its quality and durability, traditionally used in formal and high-quality footwear. Despite its smaller market share, leather remains significant for its status and premium feel.
Non-Leather materials' dominance is underpinned by their adaptability and alignment with fast fashion trends, while Leather maintains a steadfast position in the market, catering to traditional and luxury consumer segments.
End-User Analysis
Women dominate the footwear market with 52.3% due to diverse fashion trends and higher purchasing frequency.
Women are the largest end-user group in the footwear market, accounting for 52.3% of consumption. This dominance is fueled by diverse fashion trends and a higher frequency of purchases, driven by a wide range of style options and seasonal updates in women's footwear.
Men's footwear, which accounts for 34.7% of the market, focuses on durability and functionality, with growing interest in athletic and casual styles reflecting modern lifestyle changes. Children's footwear makes up 13%, characterized by the need for frequent replacements due to growth spurts and wear and tear, highlighting the importance of cost-effective and durable options.
The significant share held by women in the footwear market underscores the importance of style diversity and fashion sensitivity in driving sales, while men and children's segments contribute to market stability and growth through consistent demand patterns.
Distribution Channel Analysis
Online Stores dominate with 58.4% due to convenience and a wider selection of products.
Online Stores have become the leading distribution channel in the footwear market, holding a 58.4% share. This rise is attributed to the convenience of shopping from home, the ability to compare prices easily, and access to a wider range of products and sizes that might not be available in physical stores.
Offline Stores, including Supermarkets/Hypermarkets, Specialty Stores, Brand Outlets, and others, collectively make up the remainder of the market. Specialty Stores are particularly important for providing expert advice and the opportunity to try on footwear, making up 18.6% of the offline market. Supermarkets and Hypermarkets offer convenience and competitive pricing, holding 11.9%, while Brand Outlets are preferred for exclusive products and direct-from-manufacturer pricing, accounting for 16.5%.
The dominance of Online Stores reflects changing consumer behaviors, emphasizing the need for flexibility and variety, while Offline Stores remain vital for their tactile shopping experience and immediate product availability, appealing to consumers who value in-store service and trial before purchase.
Key Market Segments
By Product Type
- Athletic Footwear
- Running Shoes
- Training and Walking Shoes
- Sports Shoes
- Others
- Non-Athletic Footwear
- Casual Footwear
- Formal Footwear
- Boots
- Others
By Material
- Leather
- Non-Leather
- Synthetic
- Fabric
- Rubber
- Others
By End-User
- Men
- Women
- Children
By Distribution Channel
- Online Stores
- Offline Stores
- Supermarkets/Hypermarkets
- Specialty Stores
- Brand Outlets
- Others
Growth Opportunities
Smart Footwear and Wearable Technology Offers Growth Opportunity
The integration of technology into footwear presents a significant growth opportunity. Companies like Under Armour have introduced smart shoes that track fitness metrics such as distance, steps, and calories burned. These smart shoes cater to tech-savvy consumers who seek to integrate technology into their fitness routines.
This innovation opens up new market segments, particularly among health-conscious individuals and fitness enthusiasts. By providing valuable data and enhancing the user experience, smart footwear appeals to a growing demographic that prioritizes health and technology, driving market expansion and innovation.
Circular Economy and Recycling Initiatives Offer Growth Opportunity
Embracing circular economy principles presents a substantial growth opportunity in the footwear market. Brands that offer recycling programs or produce shoes from recycled materials can tap into the growing eco-conscious consumer base. For example, Adidas' "Made to Be Remade" line designs shoes to be returned and recycled into new products.
This approach not only addresses environmental concerns but also builds brand loyalty among consumers who prioritize sustainability. By adopting these practices, footwear companies can attract a broader audience, enhance their brand image, and contribute to a more sustainable market.
Trending Factors
Augmented Reality (AR) for Virtual Try-Ons Are Trending Factors
The adoption of AR technology for virtual shoe fittings is a trending factor in the footwear market. AR enhances the online shopping experience by allowing customers to virtually try on shoes, reducing the uncertainty associated with online purchases. Startups like Wanna have partnered with major brands like Gucci to offer these virtual try-on experiences.
This technology can significantly reduce return rates, improve customer satisfaction, and drive online sales. By leveraging AR, footwear brands can provide a more interactive and personalized shopping experience, attracting tech-savvy consumers and increasing market engagement.
Customization and Personalization Are Trending Factors
The demand for unique, personalized products is a significant trend in the footwear market. Brands like Vans and Converse offer online customization tools that allow customers to design their own shoes. This trend has increased sales, customer engagement, and brand loyalty.
Customization meets the consumer desire for individuality and exclusivity. By offering personalized products, footwear companies can differentiate themselves in a competitive market, attract a dedicated customer base, and drive growth through increased consumer satisfaction and loyalty.
Regional Analysis
APAC Dominates with 44.1% Market Share in the Footwear Market
APAC's commanding 44.1% share of the global footwear market, valued at USD 39.91 billion, is driven by its extensive manufacturing capabilities and large consumer base. The region is renowned for its substantial production output, with countries like China and Vietnam leading as major global suppliers due to cost-effective labor and well-established supply chains. Additionally, the increasing middle-class population in the region fuels a growing demand for both low-cost and premium footwear products.
The market dynamics in APAC are significantly shaped by its role as a global manufacturing hub. The region's ability to produce a wide range of footwear at competitive prices attracts major international brands seeking OEM partnerships. Moreover, the growing urbanization and fashion consciousness among its vast population support a dynamic retail market, further bolstered by the rapid growth of e-commerce platforms, making footwear more accessible to consumers.
Looking ahead, APAC’s influence on the global footwear market is poised to grow even stronger. Continued economic growth, coupled with advancements in manufacturing technologies and sustainable practices, is expected to drive further market expansion. The region's focus on innovation and quality improvement might also see it capturing higher value-added segments of the market.
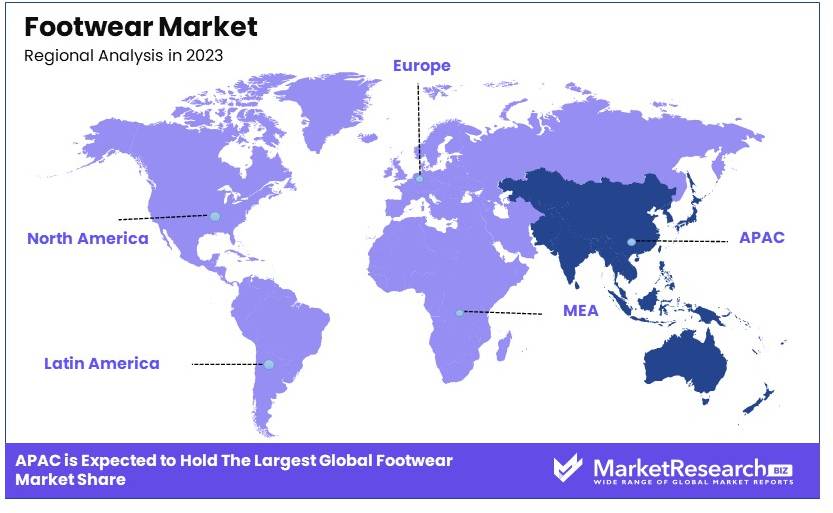
Regional Market Share AnalysisNorth America: Holding approximately 25% of the market, North America's footwear industry is driven by high consumer spending power and a preference for innovative and branded footwear. The region's market is characterized by a strong presence of leading global brands and a growing trend toward sustainable and customized products.
Europe: Europe accounts for about 20% of the global footwear market. The region's market is bolstered by its rich heritage in fashion and luxury footwear, along with increasing consumer demand for eco-friendly and ethically manufactured products.
Middle East & Africa: This region captures around 5% of the market share. Increasing urbanization and the rise of a fashion-conscious consumer base contribute to the growth of the footwear market in these areas.
Latin America: Representing about 6% of the global market, Latin America sees growth driven by increasing disposable incomes and the popularity of athletic and casual footwear among its youthful population.
Key Regions and Countries
- North America
- The US
- Canada
- Mexico
- Western Europe
- Germany
- France
- The UK
- Spain
- Italy
- Portugal
- Ireland
- Austria
- Switzerland
- Benelux
- Nordic
- Rest of Western Europe
- Eastern Europe
- Russia
- Poland
- The Czech Republic
- Greece
- Rest of Eastern Europe
- APAC
- China
- Japan
- South Korea
- India
- Australia & New Zealand
- Indonesia
- Malaysia
- Philippines
- Singapore
- Thailand
- Vietnam
- Rest of APAC
- Latin America
- Brazil
- Colombia
- Chile
- Argentina
- Costa Rica
- Rest of Latin America
- Middle East & Africa
- Algeria
- Egypt
- Israel
- Kuwait
- Nigeria
- Saudi Arabia
- South Africa
- Turkey
- United Arab Emirates
- Rest of MEA
Key Players Analysis
The footwear market is dominated by several key players who significantly influence trends and consumer preferences. Nike, Inc. leads with its innovative designs and strong brand presence, maintaining a competitive edge through strategic marketing and endorsements. Adidas AG follows closely, emphasizing sustainability and advanced athletic footwear technology. Puma SE leverages its stylish and performance-driven products to appeal to younger demographics.
Skechers USA, Inc. focuses on comfort and affordability, capturing a broad consumer base. Under Armour, Inc. and ASICS Corporation are strong in athletic performance and technical innovation, catering to professional athletes and fitness enthusiasts. New Balance Athletics, Inc. emphasizes quality and comfort, appealing to both casual and athletic consumers.
Wolverine World Wide, Inc. and VF Corporation (Vans, Timberland) offer diverse brand portfolios that cater to various market segments, from casual wear to outdoor gear. Deckers Outdoor Corporation (UGG) and Crocs, Inc. stand out with their unique and popular footwear styles. Geox S.p.A. and ECCO Sko A/S focus on comfort and breathability, appealing to health-conscious consumers.
Steve Madden, Ltd. and Columbia Sportswear Company blend fashion with functionality, targeting style-conscious and outdoor-ready consumers. These companies drive the footwear market through strategic positioning, innovative designs, and strong brand identities.
Market Key Players
- Nike, Inc.
- Adidas AG
- Puma SE
- SKECHERS USA Inc.
- Under Armour, Inc.
- ASICS Corporation
- New Balance Athletics, Inc.
- Wolverine World Wide, Inc.
- VF Corporation (Vans, Timberland)
- Deckers Outdoor Corporation (UGG)
- Crocs, Inc.
- Geox S.p.A.
- ECCO Sko A/S
- Steve Madden, Ltd.
- Columbia Sportswear Company
Recent Developments
July 2024: Adidas reported a significant decline in sales in North America, with an 8.8% drop in the third quarter. The company is dealing with high inventory levels and increased discounting, aiming to reduce stock levels. This follows a 16% sales decline in the second quarter. To address these issues, Adidas is focusing on inventory management and strategic discounting to drive sales.
July 2024: Under Armour has revised its full-year outlook due to pressures in the North American market, including inflation, mixed consumer confidence, and wholesale channel destocking. CEO Stephanie Linnartz highlighted the need to strengthen the company's core U.S. wholesale business, with a focus on more productive partnerships with retailers like Dick's Sporting Goods and Macy's.
Report Scope
Report Features Description Market Value (2023) USD 443.6 Billion Forecast Revenue (2033) USD 662.5 Billion CAGR (2024-2033) 4.2% Base Year for Estimation 2023 Historic Period 2018-2023 Forecast Period 2024-2033 Report Coverage Revenue Forecast, Market Dynamics, Competitive Landscape, Recent Developments Segments Covered By Product Type (Athletic Footwear [Running Shoes, Training and Walking Shoes, Sports Shoes, Others], Non-Athletic Footwear [Casual Footwear, Formal Footwear, Boots, Others]), By Material (Leather, Non-Leather [Synthetic, Fabric, Rubber, Others]), By End-User (Men, Women, Children), By Distribution Channel (Online Stores, Offline Stores [Supermarkets/Hypermarkets, Specialty Stores, Brand Outlets, Others]) Regional Analysis North America - The US, Canada, & Mexico; Western Europe - Germany, France, The UK, Spain, Italy, Portugal, Ireland, Austria, Switzerland, Benelux, Nordic, & Rest of Western Europe; Eastern Europe - Russia, Poland, The Czech Republic, Greece, & Rest of Eastern Europe; APAC - China, Japan, South Korea, India, Australia & New Zealand, Indonesia, Malaysia, Philippines, Singapore, Thailand, Vietnam, & Rest of APAC; Latin America - Brazil, Colombia, Chile, Argentina, Costa Rica, & Rest of Latin America; Middle East & Africa - Algeria, Egypt, Israel, Kuwait, Nigeria, Saudi Arabia, South Africa, Turkey, United Arab Emirates, & Rest of MEA Competitive Landscape Nike, Inc., Adidas AG, Puma SE, Skechers USA, Inc., Under Armour, Inc., ASICS Corporation, New Balance Athletics, Inc., Wolverine World Wide, Inc., VF Corporation (Vans, Timberland), Deckers Outdoor Corporation (UGG), Crocs, Inc., Geox S.p.A., ECCO Sko A/S, Steve Madden, Ltd., Columbia Sportswear Company Customization Scope Customization for segments, region/country-level will be provided. Moreover, additional customization can be done based on the requirements. Purchase Options We have three licenses to opt for: Single User License, Multi-User License (Up to 5 Users), Corporate Use License (Unlimited User and Printable PDF) -
-
- Nike, Inc.
- Adidas AG
- Puma SE
- SKECHERS USA Inc.
- Under Armour, Inc.
- ASICS Corporation
- New Balance Athletics, Inc.
- Wolverine World Wide, Inc.
- VF Corporation (Vans, Timberland)
- Deckers Outdoor Corporation (UGG)
- Crocs, Inc.
- Geox S.p.A.
- ECCO Sko A/S
- Steve Madden, Ltd.
- Columbia Sportswear Company
Our Clients


View Our Licence Options
