
Global Shipping Containers Market By Product Type (Dry Storage Container, Flat Rack Container), Size of Container ( Small,(20 feet), Large,(40 feet), High Cube (40 feet)), End-Use Analysis (Food & Beverages, Consumer Goods and Others)By Region And Companies - Industry Segment Outlook, Market Assessment, Competition Scenario, Trends, And Forecast 2023-2032
-
5483
-
Jul 2023
-
185
-


-
This report was compiled by Kalyani Khudsange Kalyani Khudsange is a Research Analyst at Prudour Pvt. Ltd. with 2.5 years of experience in market research and a strong technical background in Chemical Engineering and manufacturing. Correspondence Sr. Research Analyst Linkedin | Detailed Market research Methodology Our methodology involves a mix of primary research, including interviews with leading mental health experts, and secondary research from reputable medical journals and databases. View Detailed Methodology Page
-
Quick Navigation
Report Overview
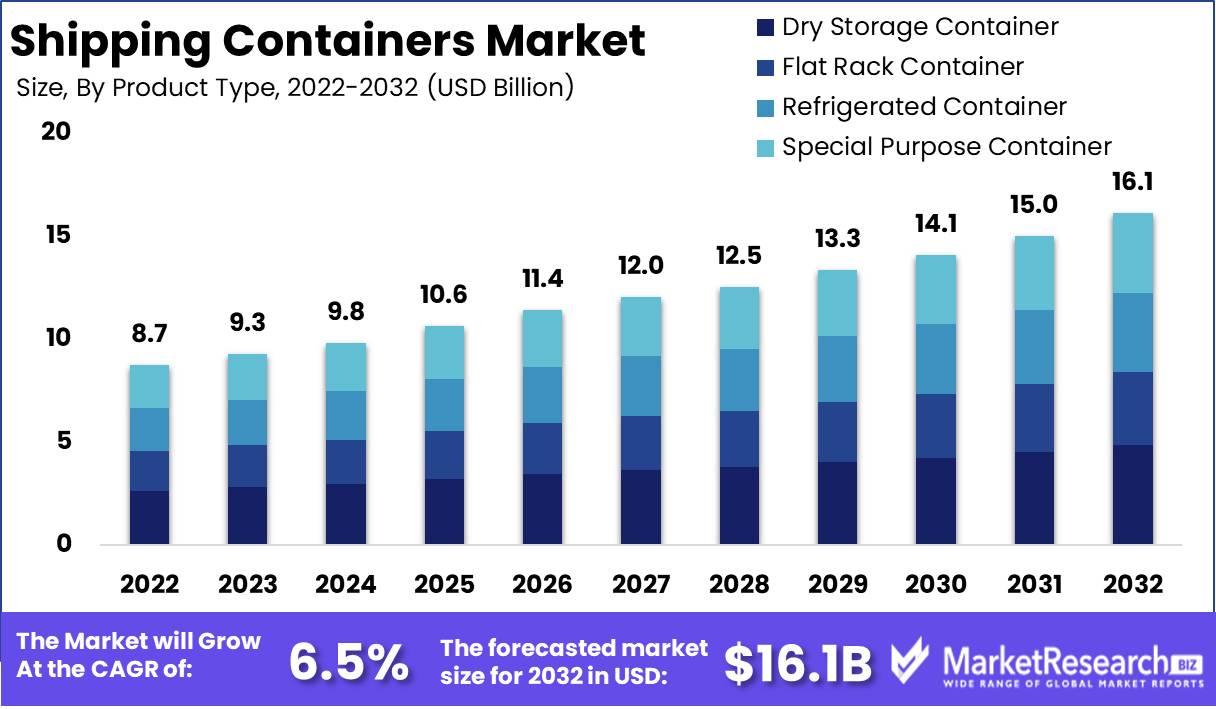
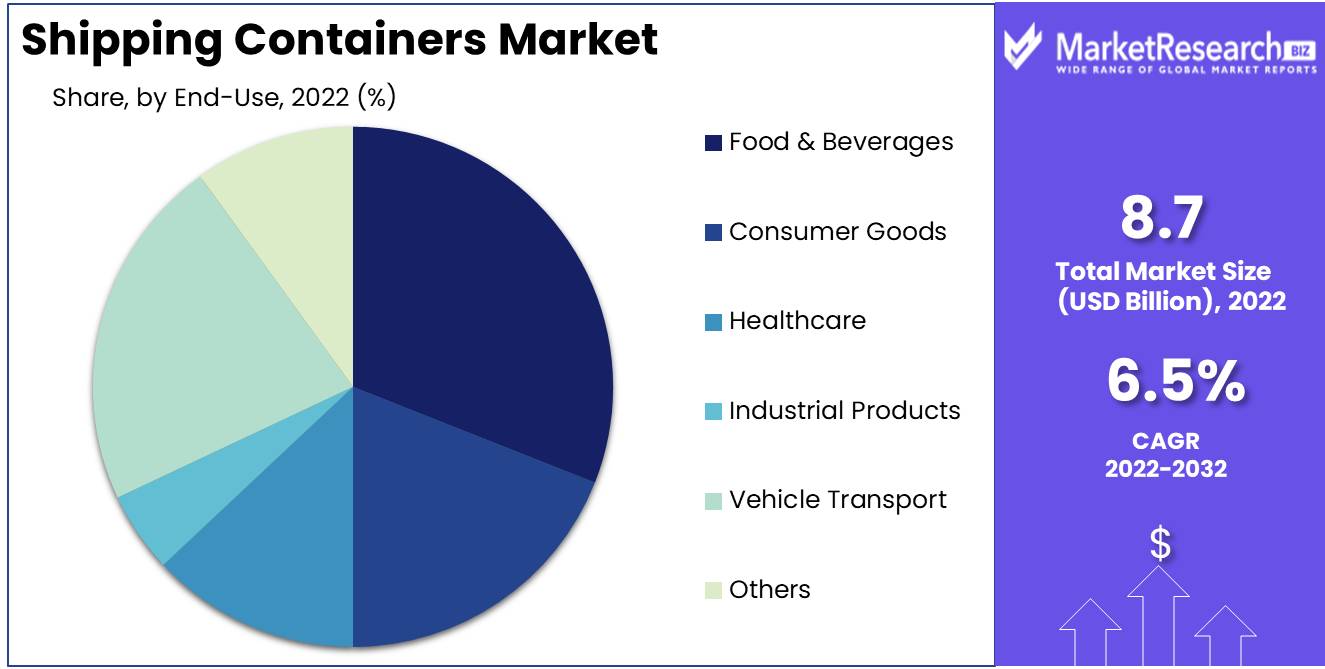
Shipping Container Market size is expected to be worth around USD 16.1 Bn by 2032 from USD 8.7 Bn in 2022, growing at a CAGR of 6.5% during the forecast period from 2023 to 2032.
The shipping container market has been gaining prominence in recent years due to the exponential growth of international trade. Shipping containers are large containers designed to transport goods over long distances, providing a secure and cost-effective mode of transportation. They are durable, eco-friendly, and can be easily transported across various modes of transportation. Moreover, they come in various sizes, making them suitable for transporting different types of goods.
The goal of the shipping containers market is to provide safe, cost-effective, and reliable transportation of goods worldwide. It aims to ensure that shipping containers are produced, maintained, and serviced to meet the evolving needs of the global market. The market also aims to provide efficient and secure transportation of all types of goods, ranging from food and pharmaceuticals to heavy machinery and hazardous materials.
Shipping containers play a critical role in international trade by providing a secure and cost-effective mode of transportation. They are essential for transporting goods across long distances, especially for developing countries that rely on exports. Shipping containers are also instrumental in reducing the carbon footprint of transportation by enabling more efficient use of transportation modes, saving energy, and minimizing the environmental impact.
Several industries are investing in the shipping containers market, recognizing its importance and potential for growth. These include the transportation, logistics, and e-commerce industries, among others. Shipping containers are becoming an integral part of supply chain management, allowing for faster and more efficient movement of goods.
Driving factors
Increasing global trade and demand for international freight transport are growing.
Due to several important factors, the shipping container market is experiencing an increase in demand. The expanding global trade and rising demand for international transport of products is a major contributor. As countries and companies engage in more cross-border commerce, shipping containers are becoming an integral part of the logistics chain. In addition, the increasing adoption of containerization to reduce logistics costs and enhance supply chain efficiency is contributing to market expansion.
Resulting in an increased demand for reusable containers
Increasing emphasis on eco-friendly and sustainable shipping practices has led to an increase in demand for reusable containers, which is another factor propelling the market. As consumers become more conscious of environmental issues, businesses are under pressure to employ eco-friendly practices. This has led to an increase in the use of reusable containers, which are both environmentally beneficial and cost-effective.
Container design innovations aided by technology
Technology also contributes to the expansion of e-commerce, and technological advancements in container design, manufacturing, and tracking systems are propelling the market. Blockchain technology, which can increase container monitoring and management's transparency, is one of the emerging technologies that could have an impact on the shipping container market. Alternative shipping options, such as drone delivery and autonomous shipping, are potential disruptors that could affect the competitive landscape.
Restraining Factors
Limiting Factors Influencing the Market for Shipping Containers
The shipping containers market is an important component of the global trade infrastructure, as containers facilitate the efficient transport of goods around the globe. Despite the increasing demand for containerization in the logistics industry, several restraining factors are preventing the sector from reaching its maximum potential. In this article, we will examine a number of these factors that have a negative impact on the shipping containers market.
Changes in the prices of raw materials and steel affect the costs of manufacturing containers
Shipping containers are primarily made of steel as a basic material. As a result, fluctuations in the price of steel have a significant impact on the cost of producing containers. Due to geopolitical tensions, overcapacity, and inconsistencies in production and demand, the global steel industry has experienced significant disruptions in recent years. These disruptions were associated with substantial steel price fluctuations. The production cost of containers and, ultimately, the shipping containers market are constantly impacted by this.
Container Type Analysis
The dry containers segment has dominated the market for shipping containers. These containers are used to transport wheeled cargo, such as consumer products, electronics, and textiles. Unlike refrigerated containers, which contain temperature-controlling cooling equipment, dry containers are designed to keep cargo dry and secure from external factors such as dust and water. This segment was adopted as a result of the dramatic shifts in trading environments in emerging economies. With the expansion of global economic activity, the demand for dry containers has increased, and this trend is anticipated to continue in the years to come.
As a consequence of globalization, emerging economies such as China, India, and Brazil have experienced a substantial increase in economic activity. These economies are now the primary manufacturing, trading, and service hubs, increasing the transportation of products. In these regions, the container of dry containers is a significant driver of economic growth. It has enhanced trade logistics and opened up new markets, resulting in increased employment opportunities and revenue.
Size Analysis
Small Container 20 feet segment dominates the shipping containers market. These are the standard-sized containers used to transport significant quantities of goods. The adoption of 20-foot containers has been prompted by the expansion of international trade and globalization. These containers are compatible with multiple modes of transportation and can be layered to maximize the use of available space, thereby reducing the overall transportation costs for businesses.
As previously stated, emerging economies are viewed as the primary growth driver for the shipping containers market. The adoption of 20-foot containers is essential to satisfying the demand for shipping goods. The expansion of these economies has led to a rise in manufacturing, and it is anticipated that this trend will continue in the years to come.
The need to transport large quantities of products efficiently and cost-effectively has made the Small Container 20-foot segment popular with businesses. Because these containers are available in standard sizes, they can be readily transported via multiple modes of transportation, thereby reducing the overall shipping costs. The Small Container 20-foot segment's adaptability to various shipping methods has made it popular with customers.
Analysis of End-Use
The shipping container market is dominated by the food and beverages segment. These containers are used to convey perishable goods such as produce, meat, and dairy. The adoption of the food and beverages segment has been driven by the increase in global food consumption and increased demand for convenience foods. Emerging societies are among the world's largest food producers, and the expansion of their food production has fueled the growth of the food and beverages market segment. The expansion of food chains and the modernization of the retail supply chain are anticipated to be the primary growth drivers for the market.
The trend toward healthier lifestyles and increased demand for convenience foods have contributed to the expansion of the food and beverages segment. The use of shipping containers to transport perishable products enables the safe transportation of food items over long distances, thereby ensuring customer satisfaction.
Key Market Segments
By Product Type
- Dry Storage Container
- Flat Rack Container
- Refrigerated Container
- Special Purpose Container
Size of Container
- Small Container (20 feet)
- Large Container (40 feet)
- High Cube Container (40 feet)
End-Use Analysis
- Food & Beverages
- Consumer Goods
- Healthcare
- Industrial Products
- Vehicle Transport
- Others
Growth Opportunity
Growth Potential in Shipping Containers Market Fueled by Opportunity
The shipping container market has been growing remarkably in recent years. The demand for containerization is driven by the increasing trade activities in emerging economies such as China, India, and Brazil. Also, the rising demand for specialized containers, including open-top containers, flat rack containers, and high cube containers, for transporting oversized cargo has been a key driver for the growth of this market. we will analyze the growth potential of the shipping containers market, fueled by opportunity. We will discuss the key factors driving growth, including the growing focus on intermodal transportation, the increasing demand for container leasing services, and the adoption of smart container solutions.
Growing Focus on Intermodal Transportation
Intermodal transportation is a shipping method that involves the use of more than one mode of transportation to move goods from one destination to another. The use of intermodal transportation has increased in recent years due to its cost-effectiveness, as it involves the use of multiple modes such as rail, road, and sea transportation. The integration of rail and road transport with shipping containers has also contributed to the growth of the shipping containers market. Containerization has made it easier to transport goods between different modes of transportation, reducing the time and cost of transportation. This has increased the demand for shipping containers, particularly in emerging economies.
Adoption of Smart Container container
The adoption of smart container solutions, including the Internet of Things (IoT) and blockchain, has revolutionized the shipping industry. These solutions offer enhanced container tracking and supply chain visibility, allowing manufacturers to monitor the movement of goods in real-time. For example, IoT-enabled shipping containers can provide information about the temperature, humidity, and location of goods, ensuring that they are transported under optimal conditions. Similarly, the use of blockchain technology can help reduce the risk of fraud and increase the transparency of the supply chain.
Latest Trends
Utilization of Lightweight Components
In recent years, the adoption of lightweight materials has been one of the most significant trends in the market for transportation containers. To increase the strength and durability of shipping containers while reducing their weight, manufacturers are now using lightweight materials like aluminum and composites. This trend is prompted by the need to reduce fuel consumption and increase container transportation efficiency. In addition, lightweight materials provide container manufacturers with a more sustainable option, as they have a smaller overall environmental impact.
Increasing Concentration on Sustainable Containerization Methods
Increasing emphasis on sustainable containerizareal timepieces is an additional important trend influencing the transport container market. The shipping industry is one of the largest contributors to global carbon emissions, and sustainability has become fundamental to the development of the industry. As a result, container manufacturers are implementing innovative technologies and designs into their products, such as triple-insulated refrigerated containers powered by renewable energy.
Increasing digitization and mechanization of container tracking and management
Increasing digitization and automation in container monitoring and management have significantly improved the shipping industry's supply chain process. Container management has become more efficient, accurate, and secure as a result of the implementation of advanced tracking technologies, such as IoT devices, RFID sensors, and autonomous transportation. Container operators can now digitally monitor the containers' location, contents, and environmental conditions, which has increased operational transparency and efficiency.
Regional Analysis
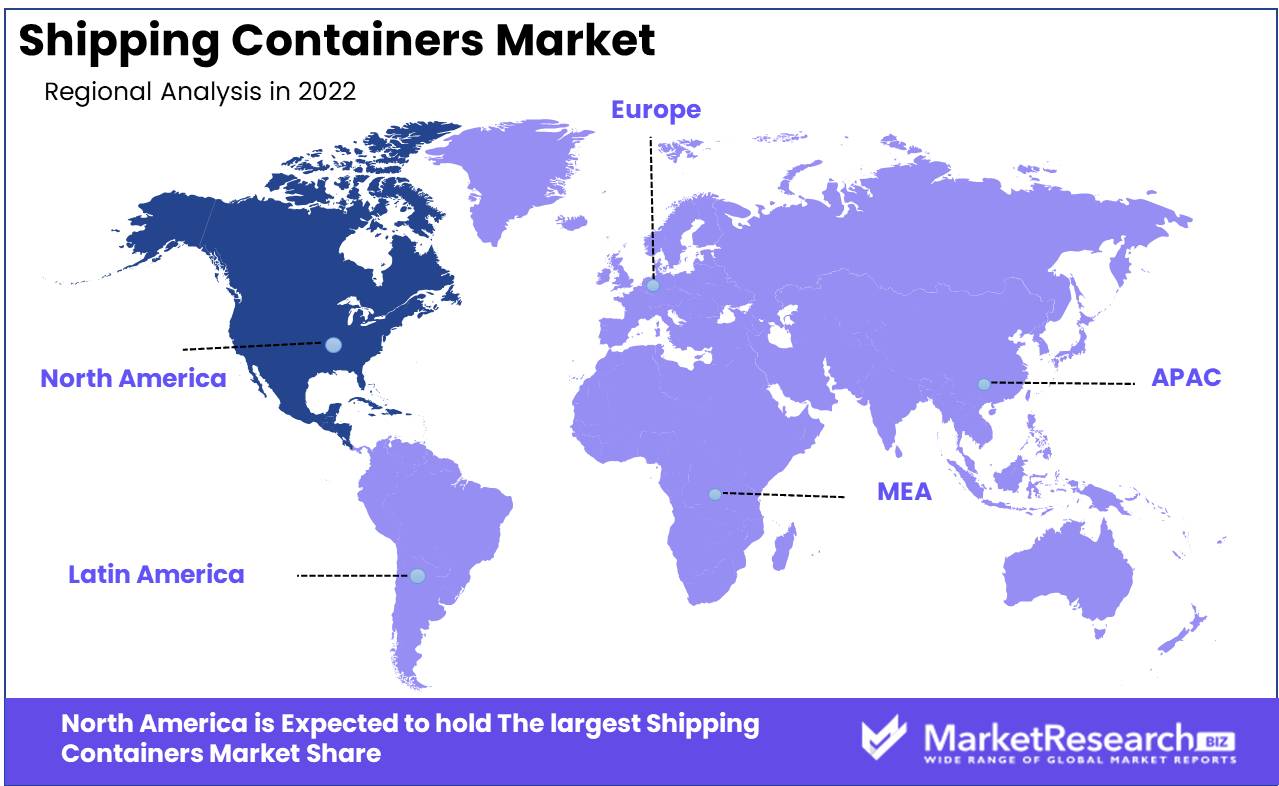
North America Dominates the Global Shipping Containers Market with a 42.3% Share. We will examine in depth the factors that have contributed to the success of the North American market and how it has managed to outperform other regions. North America has three major nations: the US, Canada, and Mexico. The US is the world's largest economy. North America also boasts advanced healthcare, technology, and education. Free trade agreements, stable politics, and commercial incentives have also helped North America's economy.
The US's advanced manufacturing program has boosted the automotive, pharmaceutical, and technology industries. The US leads North America's technical advancement. Silicon Valley, the global powerhouse for innovative entrepreneurs, has a highly qualified workforce that fuels technical innovation. North America's powerful telecommunications infrastructure lets businesses contact clients worldwide.
The US leads North America's technical advancement. Silicon Valley, the global powerhouse for innovative entrepreneurs, has a highly qualified workforce that fuels technical innovation. North America's powerful telecommunications infrastructure lets businesses contact clients worldwide. North American healthcare is world-class.
Key Regions and Countries
North America
- US
- Canada
- Mexico
Western Europe
- Germany
- France
- The UK
- Spain
- Italy
- Portugal
- Ireland
- Austria
- Switzerland
- Benelux
- Nordic
- Rest of Western Europe
Eastern Europe
- Russia
- Poland
- The Czech Republic
- Greece
- Rest of Eastern Europe
APAC
- China
- Japan
- South Korea
- India
- Australia & New Zealand
- Indonesia
- Malaysia
- Philippines
- Singapore
- Thailand
- Vietnam
- Rest of APAC
Latin America
- Brazil
- Colombia
- Chile
- Argentina
- Costa Rica
- Rest of Latin America
Middle East & Africa
- Algeria
- Egypt
- Israel
- Kuwait
- Nigeria
- Saudi Arabia
- South Africa
- Turkey
- United Arab Emirates
- Rest of MEA
Key Players Analysis
The global shipping containers market is extremely competitive with numerous key participants competing for a larger market share. Intermodal freight transportation and efficient, safe cargo handling are projected to drive market expansion in the next years. Maersk, the world's largest container shipping firm, is a prominent player in the shipping container market. Maersk ships commodities worldwide with its large container ship fleet.
Shenzhen-based CIMC is another major player. CIMC makes a variety of shipping containers for different customers. Asia-Pacific, Europe, and North America are its strongholds. Textainer Group Holdings Limited, Triton International Limited, CNS Intermodal, Seacube Container Leasing, and Florens Container Services are some major companies in the shipping containers market.
All of these organizations manufacture and lease shipping containers and are global players in the shipping container market. Due to existing enterprises and emerging entrants, the shipping container market is competitive. These important companies will innovate and grow to satisfy client wants, propelling the market ahead.
Top Key Players in Shipping Containers Market
- Microsoft Corporation
- CA Technologies
- BMC Software Inc.
- Symantec Corporation
- Aspera Technologies
- IBM Corporation
- Ivanti
- Micro Focus International plc
- Snow Software AB
Recent Development
- Hyundai Merchant Marine (HMM) has announced the acquisition of ten ultra-large container vessels (ULCVs) to increase its shipping fleet. The acquisition, scheduled for March 2023, will substantially increase HMM's shipping capacity and strengthen the company's global presence.
- The 23,000 TEU (twenty-foot equivalent unit) ships will feature cutting-edge technology and adhere to stringent environmental regulations. By reducing carbon emissions and fostering eco-friendly practices, HMM is positioning itself as a leader in sustainable shipping.
- The ULCVs are intended to meet the increasing demand for shipping containers, especially in the Asia-Pacific region. As the world continues to recover from the pandemic, it is anticipated that global trade will rebound, leading to a rise in demand for shipping services.
- HMM's purchase of ULCVs is a strategic step to maintain its competitiveness and increase its market share. The vessels will be deployed on the company's Asia-North Europe and Asia-Mediterranean routes, offering customers quicker and more dependable shipping services.
Report Scope
Report Features Description Market Value (2022) USD 8.7 Bn Forecast Revenue (2032) USD 16.1 Bn CAGR (2023-2032) 6.5% Base Year for Estimation 2022 Historic Period 2016-2022 Forecast Period 2023-2032 Report Coverage Revenue Forecast, Market Dynamics, COVID-19 Impact, Competitive Landscape, Recent Developments Segments Covered By Product Type (Dry Storage Container, Flat Rack Container, Refrigerated Container, Special Purpose Container), Size of Container ( Small Container (20 feet), Large Container (40 feet), High Cube Container (40 feet)), End-Use Analysis (Food & Beverages, Consumer Goods, Healthcare, Industrial Products, Vehicle Transport, Others) Regional Analysis North America – The US, Canada, & Mexico; Western Europe – Germany, France, The UK, Spain, Italy, Portugal, Ireland, Austria, Switzerland, Benelux, Nordic, & Rest of Western Europe; Eastern Europe – Russia, Poland, The Czech Republic, Greece, & Rest of Eastern Europe; APAC – China, Japan, South Korea, India, Australia & New Zealand, Indonesia, Malaysia, Philippines, Singapore, Thailand, Vietnam, & Rest of APAC; Latin America – Brazil, Colombia, Chile, Argentina, Costa Rica, & Rest of Latin America; Middle East & Africa – Algeria, Egypt, Israel, Kuwait, Nigeria, Saudi Arabia, South Africa, Turkey, United Arab Emirates, & Rest of MEA Competitive Landscape Microsoft CorporationCA TechnologiesBMC Software Inc.Symantec CorporationAspera TechnologiesIBM CorporationIvantiMicro Focus International plc now Software AB Customization Scope Customization for segments, region/country-level will be provided. Moreover, additional customization can be done based on the requirements. Purchase Options We have three licenses to opt for Single User License, Multi-User License (Up to 5 Users), Corporate Use License (Unlimited User and Printable PDF) -
- 1. Executive Summary
- 1.1. Definition
- 1.2. Taxonomy
- 1.3. Research Scope
- 1.4. Key Analysis
- 1.5. Key Findings by Major Segments
- 1.6. Top strategies by Major Players
- 2. Global Shipping Container Market Overview
- 2.1. Shipping Container Market Dynamics
- 2.1.1. Drivers
- 2.1.2. Opportunities
- 2.1.3. Restraints
- 2.1.4. Challenges
- 2.2. Macro-economic Factors
- 2.3. Regulatory Framework
- 2.4. Market Investment Feasibility Index
- 2.5. PEST Analysis
- 2.6. PORTER’S Five Force Analysis
- 2.7. Drivers & Restraints Impact Analysis
- 2.8. Industry Chain Analysis
- 2.9. Cost Structure Analysis
- 2.10. Marketing Strategy
- 2.11. Russia-Ukraine War Impact Analysis
- 2.12. Opportunity Map Analysis
- 2.13. Market Competition Scenario Analysis
- 2.14. Product Life Cycle Analysis
- 2.15. Opportunity Orbits
- 2.16. Manufacturer Intensity Map
- 2.17. Major Companies sales by Value & Volume
- 2.1. Shipping Container Market Dynamics
- 3. Global Shipping Container Market Analysis, Opportunity and Forecast, 2016-2032
- 3.1. Global Shipping Container Market Analysis, 2016-2021
- 3.2. Global Shipping Container Market Opportunity and Forecast, 2023-2032
- 3.3. Global Shipping Container Market Analysis, Opportunity and Forecast, By By Product Type, 2016-2032
- 3.3.1. Global Shipping Container Market Analysis by By Product Type: Introduction
- 3.3.2. Market Size Absolute $ Opportunity Analysis and Forecast, By By Product Type, 2016-2032
- 3.3.4. Dry Storage Container
- 3.3.5. Flat Rack Container
- 3.3.6. Special Purpose Container
- 3.4. Global Shipping Container Market Analysis, Opportunity and Forecast, By Size of Container, 2016-2032
- 3.4.1. Global Shipping Container Market Analysis by Size of Container: Introduction
- 3.4.2. Market Size Absolute $ Opportunity Analysis and Forecast, By Size of Container, 2016-2032
- 3.4.3. Small Container (20 feet)
- 3.4.4. Large Container (40 feet)
- 3.4.5. High Cube Container (40 feet)
- 3.5. Global Shipping Container Market Analysis, Opportunity and Forecast, By End-Use Analysis, 2016-2032
- 3.5.1. Global Shipping Container Market Analysis by End-Use Analysis: Introduction
- 3.5.2. Market Size Absolute $ Opportunity Analysis and Forecast, By End-Use Analysis, 2016-2032
- 3.5.3. Food & Beverages
- 3.5.4. Consumer Goods
- 3.5.5. Healthcare
- 3.5.6. Industrial Products
- 3.5.7. Vehicle Transport
- 3.5.8. Others
- 4. North America Shipping Container Market Analysis, Opportunity and Forecast, 2016-2032
- 4.1. North America Shipping Container Market Analysis, 2016-2021
- 4.2. North America Shipping Container Market Opportunity and Forecast, 2023-2032
- 4.3. North America Shipping Container Market Analysis, Opportunity and Forecast, By By Product Type, 2016-2032
- 4.3.1. North America Shipping Container Market Analysis by By Product Type: Introduction
- 4.3.2. Market Size Absolute $ Opportunity Analysis and Forecast, By By Product Type, 2016-2032
- 4.3.4. Dry Storage Container
- 4.3.5. Flat Rack Container
- 4.3.6. Special Purpose Container
- 4.4. North America Shipping Container Market Analysis, Opportunity and Forecast, By Size of Container, 2016-2032
- 4.4.1. North America Shipping Container Market Analysis by Size of Container: Introduction
- 4.4.2. Market Size Absolute $ Opportunity Analysis and Forecast, By Size of Container, 2016-2032
- 4.4.3. Small Container (20 feet)
- 4.4.4. Large Container (40 feet)
- 4.4.5. High Cube Container (40 feet)
- 4.5. North America Shipping Container Market Analysis, Opportunity and Forecast, By End-Use Analysis, 2016-2032
- 4.5.1. North America Shipping Container Market Analysis by End-Use Analysis: Introduction
- 4.5.2. Market Size Absolute $ Opportunity Analysis and Forecast, By End-Use Analysis, 2016-2032
- 4.5.3. Food & Beverages
- 4.5.4. Consumer Goods
- 4.5.5. Healthcare
- 4.5.6. Industrial Products
- 4.5.7. Vehicle Transport
- 4.5.8. Others
- 4.6. North America Shipping Container Market Analysis, Opportunity and Forecast, By Country , 2016-2032
- 4.6.1. North America Shipping Container Market Analysis by Country : Introduction
- 4.6.2. Market Size Absolute $ Opportunity Analysis and Forecast, Country , 2016-2032
- 4.6.2.1. The US
- 4.6.2.2. Canada
- 4.6.2.3. Mexico
- 5. Western Europe Shipping Container Market Analysis, Opportunity and Forecast, 2016-2032
- 5.1. Western Europe Shipping Container Market Analysis, 2016-2021
- 5.2. Western Europe Shipping Container Market Opportunity and Forecast, 2023-2032
- 5.3. Western Europe Shipping Container Market Analysis, Opportunity and Forecast, By By Product Type, 2016-2032
- 5.3.1. Western Europe Shipping Container Market Analysis by By Product Type: Introduction
- 5.3.2. Market Size Absolute $ Opportunity Analysis and Forecast, By By Product Type, 2016-2032
- 5.3.4. Dry Storage Container
- 5.3.5. Flat Rack Container
- 5.3.6. Special Purpose Container
- 5.4. Western Europe Shipping Container Market Analysis, Opportunity and Forecast, By Size of Container, 2016-2032
- 5.4.1. Western Europe Shipping Container Market Analysis by Size of Container: Introduction
- 5.4.2. Market Size Absolute $ Opportunity Analysis and Forecast, By Size of Container, 2016-2032
- 5.4.3. Small Container (20 feet)
- 5.4.4. Large Container (40 feet)
- 5.4.5. High Cube Container (40 feet)
- 5.5. Western Europe Shipping Container Market Analysis, Opportunity and Forecast, By End-Use Analysis, 2016-2032
- 5.5.1. Western Europe Shipping Container Market Analysis by End-Use Analysis: Introduction
- 5.5.2. Market Size Absolute $ Opportunity Analysis and Forecast, By End-Use Analysis, 2016-2032
- 5.5.3. Food & Beverages
- 5.5.4. Consumer Goods
- 5.5.5. Healthcare
- 5.5.6. Industrial Products
- 5.5.7. Vehicle Transport
- 5.5.8. Others
- 5.6. Western Europe Shipping Container Market Analysis, Opportunity and Forecast, By Country , 2016-2032
- 5.6.1. Western Europe Shipping Container Market Analysis by Country : Introduction
- 5.6.2. Market Size Absolute $ Opportunity Analysis and Forecast, Country , 2016-2032
- 5.6.2.1. Germany
- 5.6.2.2. France
- 5.6.2.3. The UK
- 5.6.2.4. Spain
- 5.6.2.5. Italy
- 5.6.2.6. Portugal
- 5.6.2.7. Ireland
- 5.6.2.8. Austria
- 5.6.2.9. Switzerland
- 5.6.2.10. Benelux
- 5.6.2.11. Nordic
- 5.6.2.12. Rest of Western Europe
- 6. Eastern Europe Shipping Container Market Analysis, Opportunity and Forecast, 2016-2032
- 6.1. Eastern Europe Shipping Container Market Analysis, 2016-2021
- 6.2. Eastern Europe Shipping Container Market Opportunity and Forecast, 2023-2032
- 6.3. Eastern Europe Shipping Container Market Analysis, Opportunity and Forecast, By By Product Type, 2016-2032
- 6.3.1. Eastern Europe Shipping Container Market Analysis by By Product Type: Introduction
- 6.3.2. Market Size Absolute $ Opportunity Analysis and Forecast, By By Product Type, 2016-2032
- 6.3.4. Dry Storage Container
- 6.3.5. Flat Rack Container
- 6.3.6. Special Purpose Container
- 6.4. Eastern Europe Shipping Container Market Analysis, Opportunity and Forecast, By Size of Container, 2016-2032
- 6.4.1. Eastern Europe Shipping Container Market Analysis by Size of Container: Introduction
- 6.4.2. Market Size Absolute $ Opportunity Analysis and Forecast, By Size of Container, 2016-2032
- 6.4.3. Small Container (20 feet)
- 6.4.4. Large Container (40 feet)
- 6.4.5. High Cube Container (40 feet)
- 6.5. Eastern Europe Shipping Container Market Analysis, Opportunity and Forecast, By End-Use Analysis, 2016-2032
- 6.5.1. Eastern Europe Shipping Container Market Analysis by End-Use Analysis: Introduction
- 6.5.2. Market Size Absolute $ Opportunity Analysis and Forecast, By End-Use Analysis, 2016-2032
- 6.5.3. Food & Beverages
- 6.5.4. Consumer Goods
- 6.5.5. Healthcare
- 6.5.6. Industrial Products
- 6.5.7. Vehicle Transport
- 6.5.8. Others
- 6.6. Eastern Europe Shipping Container Market Analysis, Opportunity and Forecast, By Country , 2016-2032
- 6.6.1. Eastern Europe Shipping Container Market Analysis by Country : Introduction
- 6.6.2. Market Size Absolute $ Opportunity Analysis and Forecast, Country , 2016-2032
- 6.6.2.1. Russia
- 6.6.2.2. Poland
- 6.6.2.3. The Czech Republic
- 6.6.2.4. Greece
- 6.6.2.5. Rest of Eastern Europe
- 7. APAC Shipping Container Market Analysis, Opportunity and Forecast, 2016-2032
- 7.1. APAC Shipping Container Market Analysis, 2016-2021
- 7.2. APAC Shipping Container Market Opportunity and Forecast, 2023-2032
- 7.3. APAC Shipping Container Market Analysis, Opportunity and Forecast, By By Product Type, 2016-2032
- 7.3.1. APAC Shipping Container Market Analysis by By Product Type: Introduction
- 7.3.2. Market Size Absolute $ Opportunity Analysis and Forecast, By By Product Type, 2016-2032
- 7.3.4. Dry Storage Container
- 7.3.5. Flat Rack Container
- 7.3.6. Special Purpose Container
- 7.4. APAC Shipping Container Market Analysis, Opportunity and Forecast, By Size of Container, 2016-2032
- 7.4.1. APAC Shipping Container Market Analysis by Size of Container: Introduction
- 7.4.2. Market Size Absolute $ Opportunity Analysis and Forecast, By Size of Container, 2016-2032
- 7.4.3. Small Container (20 feet)
- 7.4.4. Large Container (40 feet)
- 7.4.5. High Cube Container (40 feet)
- 7.5. APAC Shipping Container Market Analysis, Opportunity and Forecast, By End-Use Analysis, 2016-2032
- 7.5.1. APAC Shipping Container Market Analysis by End-Use Analysis: Introduction
- 7.5.2. Market Size Absolute $ Opportunity Analysis and Forecast, By End-Use Analysis, 2016-2032
- 7.5.3. Food & Beverages
- 7.5.4. Consumer Goods
- 7.5.5. Healthcare
- 7.5.6. Industrial Products
- 7.5.7. Vehicle Transport
- 7.5.8. Others
- 7.6. APAC Shipping Container Market Analysis, Opportunity and Forecast, By Country , 2016-2032
- 7.6.1. APAC Shipping Container Market Analysis by Country : Introduction
- 7.6.2. Market Size Absolute $ Opportunity Analysis and Forecast, Country , 2016-2032
- 7.6.2.1. China
- 7.6.2.2. Japan
- 7.6.2.3. South Korea
- 7.6.2.4. India
- 7.6.2.5. Australia & New Zeland
- 7.6.2.6. Indonesia
- 7.6.2.7. Malaysia
- 7.6.2.8. Philippines
- 7.6.2.9. Singapore
- 7.6.2.10. Thailand
- 7.6.2.11. Vietnam
- 7.6.2.12. Rest of APAC
- 8. Latin America Shipping Container Market Analysis, Opportunity and Forecast, 2016-2032
- 8.1. Latin America Shipping Container Market Analysis, 2016-2021
- 8.2. Latin America Shipping Container Market Opportunity and Forecast, 2023-2032
- 8.3. Latin America Shipping Container Market Analysis, Opportunity and Forecast, By By Product Type, 2016-2032
- 8.3.1. Latin America Shipping Container Market Analysis by By Product Type: Introduction
- 8.3.2. Market Size Absolute $ Opportunity Analysis and Forecast, By By Product Type, 2016-2032
- 8.3.4. Dry Storage Container
- 8.3.5. Flat Rack Container
- 8.3.6. Special Purpose Container
- 8.4. Latin America Shipping Container Market Analysis, Opportunity and Forecast, By Size of Container, 2016-2032
- 8.4.1. Latin America Shipping Container Market Analysis by Size of Container: Introduction
- 8.4.2. Market Size Absolute $ Opportunity Analysis and Forecast, By Size of Container, 2016-2032
- 8.4.3. Small Container (20 feet)
- 8.4.4. Large Container (40 feet)
- 8.4.5. High Cube Container (40 feet)
- 8.5. Latin America Shipping Container Market Analysis, Opportunity and Forecast, By End-Use Analysis, 2016-2032
- 8.5.1. Latin America Shipping Container Market Analysis by End-Use Analysis: Introduction
- 8.5.2. Market Size Absolute $ Opportunity Analysis and Forecast, By End-Use Analysis, 2016-2032
- 8.5.3. Food & Beverages
- 8.5.4. Consumer Goods
- 8.5.5. Healthcare
- 8.5.6. Industrial Products
- 8.5.7. Vehicle Transport
- 8.5.8. Others
- 8.6. Latin America Shipping Container Market Analysis, Opportunity and Forecast, By Country , 2016-2032
- 8.6.1. Latin America Shipping Container Market Analysis by Country : Introduction
- 8.6.2. Market Size Absolute $ Opportunity Analysis and Forecast, Country , 2016-2032
- 8.6.2.1. Brazil
- 8.6.2.2. Colombia
- 8.6.2.3. Chile
- 8.6.2.4. Argentina
- 8.6.2.5. Costa Rica
- 8.6.2.6. Rest of Latin America
- 9. Middle East & Africa Shipping Container Market Analysis, Opportunity and Forecast, 2016-2032
- 9.1. Middle East & Africa Shipping Container Market Analysis, 2016-2021
- 9.2. Middle East & Africa Shipping Container Market Opportunity and Forecast, 2023-2032
- 9.3. Middle East & Africa Shipping Container Market Analysis, Opportunity and Forecast, By By Product Type, 2016-2032
- 9.3.1. Middle East & Africa Shipping Container Market Analysis by By Product Type: Introduction
- 9.3.2. Market Size Absolute $ Opportunity Analysis and Forecast, By By Product Type, 2016-2032
- 9.3.4. Dry Storage Container
- 9.3.5. Flat Rack Container
- 9.3.6. Special Purpose Container
- 9.4. Middle East & Africa Shipping Container Market Analysis, Opportunity and Forecast, By Size of Container, 2016-2032
- 9.4.1. Middle East & Africa Shipping Container Market Analysis by Size of Container: Introduction
- 9.4.2. Market Size Absolute $ Opportunity Analysis and Forecast, By Size of Container, 2016-2032
- 9.4.3. Small Container (20 feet)
- 9.4.4. Large Container (40 feet)
- 9.4.5. High Cube Container (40 feet)
- 9.5. Middle East & Africa Shipping Container Market Analysis, Opportunity and Forecast, By End-Use Analysis, 2016-2032
- 9.5.1. Middle East & Africa Shipping Container Market Analysis by End-Use Analysis: Introduction
- 9.5.2. Market Size Absolute $ Opportunity Analysis and Forecast, By End-Use Analysis, 2016-2032
- 9.5.3. Food & Beverages
- 9.5.4. Consumer Goods
- 9.5.5. Healthcare
- 9.5.6. Industrial Products
- 9.5.7. Vehicle Transport
- 9.5.8. Others
- 9.6. Middle East & Africa Shipping Container Market Analysis, Opportunity and Forecast, By Country , 2016-2032
- 9.6.1. Middle East & Africa Shipping Container Market Analysis by Country : Introduction
- 9.6.2. Market Size Absolute $ Opportunity Analysis and Forecast, Country , 2016-2032
- 9.6.2.1. Algeria
- 9.6.2.2. Egypt
- 9.6.2.3. Israel
- 9.6.2.4. Kuwait
- 9.6.2.5. Nigeria
- 9.6.2.6. Saudi Arabia
- 9.6.2.7. South Africa
- 9.6.2.8. Turkey
- 9.6.2.9. The UAE
- 9.6.2.10. Rest of MEA
- 10. Global Shipping Container Market Analysis, Opportunity and Forecast, By Region , 2016-2032
- 10.1. Global Shipping Container Market Analysis by Region : Introduction
- 10.2. Market Size Absolute $ Opportunity Analysis and Forecast, By Region , 2016-2032
- 10.2.1. North America
- 10.2.2. Western Europe
- 10.2.3. Eastern Europe
- 10.2.4. APAC
- 10.2.5. Latin America
- 10.2.6. Middle East & Africa
- 11. Global Shipping Container Market Competitive Landscape, Market Share Analysis, and Company Profiles
- 11.1. Market Share Analysis
- 11.2. Company Profiles
- 11.3. Microsoft Corporation
- 11.3.1. Company Overview
- 11.3.2. Financial Highlights
- 11.3.3. Product Portfolio
- 11.3.4. SWOT Analysis
- 11.3.5. Key Strategies and Developments
- 11.4. CA Technologies
- 11.4.1. Company Overview
- 11.4.2. Financial Highlights
- 11.4.3. Product Portfolio
- 11.4.4. SWOT Analysis
- 11.4.5. Key Strategies and Developments
- 11.5. BMC Software Inc.
- 11.5.1. Company Overview
- 11.5.2. Financial Highlights
- 11.5.3. Product Portfolio
- 11.5.4. SWOT Analysis
- 11.5.5. Key Strategies and Developments
- 11.6. Symantec Corporation
- 11.6.1. Company Overview
- 11.6.2. Financial Highlights
- 11.6.3. Product Portfolio
- 11.6.4. SWOT Analysis
- 11.6.5. Key Strategies and Developments
- 11.7. Aspera Technologies
- 11.7.1. Company Overview
- 11.7.2. Financial Highlights
- 11.7.3. Product Portfolio
- 11.7.4. SWOT Analysis
- 11.7.5. Key Strategies and Developments
- 11.8. IBM Corporation
- 11.8.1. Company Overview
- 11.8.2. Financial Highlights
- 11.8.3. Product Portfolio
- 11.8.4. SWOT Analysis
- 11.8.5. Key Strategies and Developments
- 11.9. Ivanti
- 11.9.1. Company Overview
- 11.9.2. Financial Highlights
- 11.9.3. Product Portfolio
- 11.9.4. SWOT Analysis
- 11.9.5. Key Strategies and Developments
- 11.10. Micro Focus International plc
- 11.10.1. Company Overview
- 11.10.2. Financial Highlights
- 11.10.3. Product Portfolio
- 11.10.4. SWOT Analysis
- 11.10.5. Key Strategies and Developments
- 11.11. Snow Software AB
- 11.11.1. Company Overview
- 11.11.2. Financial Highlights
- 11.11.3. Product Portfolio
- 11.11.4. SWOT Analysis
- 11.11.5. Key Strategies and Developments
- 12. Assumptions and Acronyms
- 13. Research Methodology
- 14. Contact
- List of Figures
- Figure 1: Global Shipping Container Market Revenue (US$ Mn) Market Share by By Product Type in 2022
- Figure 2: Global Shipping Container Market Attractiveness Analysis by By Product Type, 2016-2032
- Figure 3: Global Shipping Container Market Revenue (US$ Mn) Market Share by Size of Containerin 2022
- Figure 4: Global Shipping Container Market Attractiveness Analysis by Size of Container, 2016-2032
- Figure 5: Global Shipping Container Market Revenue (US$ Mn) Market Share by End-Use Analysisin 2022
- Figure 6: Global Shipping Container Market Attractiveness Analysis by End-Use Analysis, 2016-2032
- Figure 7: Global Shipping Container Market Revenue (US$ Mn) Market Share by Region in 2022
- Figure 8: Global Shipping Container Market Attractiveness Analysis by Region, 2016-2032
- Figure 9: Global Shipping Container Market Revenue (US$ Mn) (2016-2032)
- Figure 10: Global Shipping Container Market Revenue (US$ Mn) Comparison by Region (2016-2032)
- Figure 11: Global Shipping Container Market Revenue (US$ Mn) Comparison by By Product Type (2016-2032)
- Figure 12: Global Shipping Container Market Revenue (US$ Mn) Comparison by Size of Container (2016-2032)
- Figure 13: Global Shipping Container Market Revenue (US$ Mn) Comparison by End-Use Analysis (2016-2032)
- Figure 14: Global Shipping Container Market Y-o-Y Growth Rate Comparison by Region (2016-2032)
- Figure 15: Global Shipping Container Market Y-o-Y Growth Rate Comparison by By Product Type (2016-2032)
- Figure 16: Global Shipping Container Market Y-o-Y Growth Rate Comparison by Size of Container (2016-2032)
- Figure 17: Global Shipping Container Market Y-o-Y Growth Rate Comparison by End-Use Analysis (2016-2032)
- Figure 18: Global Shipping Container Market Share Comparison by Region (2016-2032)
- Figure 19: Global Shipping Container Market Share Comparison by By Product Type (2016-2032)
- Figure 20: Global Shipping Container Market Share Comparison by Size of Container (2016-2032)
- Figure 21: Global Shipping Container Market Share Comparison by End-Use Analysis (2016-2032)
- Figure 22: North America Shipping Container Market Revenue (US$ Mn) Market Share by By Product Typein 2022
- Figure 23: North America Shipping Container Market Attractiveness Analysis by By Product Type, 2016-2032
- Figure 24: North America Shipping Container Market Revenue (US$ Mn) Market Share by Size of Containerin 2022
- Figure 25: North America Shipping Container Market Attractiveness Analysis by Size of Container, 2016-2032
- Figure 26: North America Shipping Container Market Revenue (US$ Mn) Market Share by End-Use Analysisin 2022
- Figure 27: North America Shipping Container Market Attractiveness Analysis by End-Use Analysis, 2016-2032
- Figure 28: North America Shipping Container Market Revenue (US$ Mn) Market Share by Country in 2022
- Figure 29: North America Shipping Container Market Attractiveness Analysis by Country, 2016-2032
- Figure 30: North America Shipping Container Market Revenue (US$ Mn) (2016-2032)
- Figure 31: North America Shipping Container Market Revenue (US$ Mn) Comparison by Country (2016-2032)
- Figure 32: North America Shipping Container Market Revenue (US$ Mn) Comparison by By Product Type (2016-2032)
- Figure 33: North America Shipping Container Market Revenue (US$ Mn) Comparison by Size of Container (2016-2032)
- Figure 34: North America Shipping Container Market Revenue (US$ Mn) Comparison by End-Use Analysis (2016-2032)
- Figure 35: North America Shipping Container Market Y-o-Y Growth Rate Comparison by Country (2016-2032)
- Figure 36: North America Shipping Container Market Y-o-Y Growth Rate Comparison by By Product Type (2016-2032)
- Figure 37: North America Shipping Container Market Y-o-Y Growth Rate Comparison by Size of Container (2016-2032)
- Figure 38: North America Shipping Container Market Y-o-Y Growth Rate Comparison by End-Use Analysis (2016-2032)
- Figure 39: North America Shipping Container Market Share Comparison by Country (2016-2032)
- Figure 40: North America Shipping Container Market Share Comparison by By Product Type (2016-2032)
- Figure 41: North America Shipping Container Market Share Comparison by Size of Container (2016-2032)
- Figure 42: North America Shipping Container Market Share Comparison by End-Use Analysis (2016-2032)
- Figure 43: Western Europe Shipping Container Market Revenue (US$ Mn) Market Share by By Product Typein 2022
- Figure 44: Western Europe Shipping Container Market Attractiveness Analysis by By Product Type, 2016-2032
- Figure 45: Western Europe Shipping Container Market Revenue (US$ Mn) Market Share by Size of Containerin 2022
- Figure 46: Western Europe Shipping Container Market Attractiveness Analysis by Size of Container, 2016-2032
- Figure 47: Western Europe Shipping Container Market Revenue (US$ Mn) Market Share by End-Use Analysisin 2022
- Figure 48: Western Europe Shipping Container Market Attractiveness Analysis by End-Use Analysis, 2016-2032
- Figure 49: Western Europe Shipping Container Market Revenue (US$ Mn) Market Share by Country in 2022
- Figure 50: Western Europe Shipping Container Market Attractiveness Analysis by Country, 2016-2032
- Figure 51: Western Europe Shipping Container Market Revenue (US$ Mn) (2016-2032)
- Figure 52: Western Europe Shipping Container Market Revenue (US$ Mn) Comparison by Country (2016-2032)
- Figure 53: Western Europe Shipping Container Market Revenue (US$ Mn) Comparison by By Product Type (2016-2032)
- Figure 54: Western Europe Shipping Container Market Revenue (US$ Mn) Comparison by Size of Container (2016-2032)
- Figure 55: Western Europe Shipping Container Market Revenue (US$ Mn) Comparison by End-Use Analysis (2016-2032)
- Figure 56: Western Europe Shipping Container Market Y-o-Y Growth Rate Comparison by Country (2016-2032)
- Figure 57: Western Europe Shipping Container Market Y-o-Y Growth Rate Comparison by By Product Type (2016-2032)
- Figure 58: Western Europe Shipping Container Market Y-o-Y Growth Rate Comparison by Size of Container (2016-2032)
- Figure 59: Western Europe Shipping Container Market Y-o-Y Growth Rate Comparison by End-Use Analysis (2016-2032)
- Figure 60: Western Europe Shipping Container Market Share Comparison by Country (2016-2032)
- Figure 61: Western Europe Shipping Container Market Share Comparison by By Product Type (2016-2032)
- Figure 62: Western Europe Shipping Container Market Share Comparison by Size of Container (2016-2032)
- Figure 63: Western Europe Shipping Container Market Share Comparison by End-Use Analysis (2016-2032)
- Figure 64: Eastern Europe Shipping Container Market Revenue (US$ Mn) Market Share by By Product Typein 2022
- Figure 65: Eastern Europe Shipping Container Market Attractiveness Analysis by By Product Type, 2016-2032
- Figure 66: Eastern Europe Shipping Container Market Revenue (US$ Mn) Market Share by Size of Containerin 2022
- Figure 67: Eastern Europe Shipping Container Market Attractiveness Analysis by Size of Container, 2016-2032
- Figure 68: Eastern Europe Shipping Container Market Revenue (US$ Mn) Market Share by End-Use Analysisin 2022
- Figure 69: Eastern Europe Shipping Container Market Attractiveness Analysis by End-Use Analysis, 2016-2032
- Figure 70: Eastern Europe Shipping Container Market Revenue (US$ Mn) Market Share by Country in 2022
- Figure 71: Eastern Europe Shipping Container Market Attractiveness Analysis by Country, 2016-2032
- Figure 72: Eastern Europe Shipping Container Market Revenue (US$ Mn) (2016-2032)
- Figure 73: Eastern Europe Shipping Container Market Revenue (US$ Mn) Comparison by Country (2016-2032)
- Figure 74: Eastern Europe Shipping Container Market Revenue (US$ Mn) Comparison by By Product Type (2016-2032)
- Figure 75: Eastern Europe Shipping Container Market Revenue (US$ Mn) Comparison by Size of Container (2016-2032)
- Figure 76: Eastern Europe Shipping Container Market Revenue (US$ Mn) Comparison by End-Use Analysis (2016-2032)
- Figure 77: Eastern Europe Shipping Container Market Y-o-Y Growth Rate Comparison by Country (2016-2032)
- Figure 78: Eastern Europe Shipping Container Market Y-o-Y Growth Rate Comparison by By Product Type (2016-2032)
- Figure 79: Eastern Europe Shipping Container Market Y-o-Y Growth Rate Comparison by Size of Container (2016-2032)
- Figure 80: Eastern Europe Shipping Container Market Y-o-Y Growth Rate Comparison by End-Use Analysis (2016-2032)
- Figure 81: Eastern Europe Shipping Container Market Share Comparison by Country (2016-2032)
- Figure 82: Eastern Europe Shipping Container Market Share Comparison by By Product Type (2016-2032)
- Figure 83: Eastern Europe Shipping Container Market Share Comparison by Size of Container (2016-2032)
- Figure 84: Eastern Europe Shipping Container Market Share Comparison by End-Use Analysis (2016-2032)
- Figure 85: APAC Shipping Container Market Revenue (US$ Mn) Market Share by By Product Typein 2022
- Figure 86: APAC Shipping Container Market Attractiveness Analysis by By Product Type, 2016-2032
- Figure 87: APAC Shipping Container Market Revenue (US$ Mn) Market Share by Size of Containerin 2022
- Figure 88: APAC Shipping Container Market Attractiveness Analysis by Size of Container, 2016-2032
- Figure 89: APAC Shipping Container Market Revenue (US$ Mn) Market Share by End-Use Analysisin 2022
- Figure 90: APAC Shipping Container Market Attractiveness Analysis by End-Use Analysis, 2016-2032
- Figure 91: APAC Shipping Container Market Revenue (US$ Mn) Market Share by Country in 2022
- Figure 92: APAC Shipping Container Market Attractiveness Analysis by Country, 2016-2032
- Figure 93: APAC Shipping Container Market Revenue (US$ Mn) (2016-2032)
- Figure 94: APAC Shipping Container Market Revenue (US$ Mn) Comparison by Country (2016-2032)
- Figure 95: APAC Shipping Container Market Revenue (US$ Mn) Comparison by By Product Type (2016-2032)
- Figure 96: APAC Shipping Container Market Revenue (US$ Mn) Comparison by Size of Container (2016-2032)
- Figure 97: APAC Shipping Container Market Revenue (US$ Mn) Comparison by End-Use Analysis (2016-2032)
- Figure 98: APAC Shipping Container Market Y-o-Y Growth Rate Comparison by Country (2016-2032)
- Figure 99: APAC Shipping Container Market Y-o-Y Growth Rate Comparison by By Product Type (2016-2032)
- Figure 100: APAC Shipping Container Market Y-o-Y Growth Rate Comparison by Size of Container (2016-2032)
- Figure 101: APAC Shipping Container Market Y-o-Y Growth Rate Comparison by End-Use Analysis (2016-2032)
- Figure 102: APAC Shipping Container Market Share Comparison by Country (2016-2032)
- Figure 103: APAC Shipping Container Market Share Comparison by By Product Type (2016-2032)
- Figure 104: APAC Shipping Container Market Share Comparison by Size of Container (2016-2032)
- Figure 105: APAC Shipping Container Market Share Comparison by End-Use Analysis (2016-2032)
- Figure 106: Latin America Shipping Container Market Revenue (US$ Mn) Market Share by By Product Typein 2022
- Figure 107: Latin America Shipping Container Market Attractiveness Analysis by By Product Type, 2016-2032
- Figure 108: Latin America Shipping Container Market Revenue (US$ Mn) Market Share by Size of Containerin 2022
- Figure 109: Latin America Shipping Container Market Attractiveness Analysis by Size of Container, 2016-2032
- Figure 110: Latin America Shipping Container Market Revenue (US$ Mn) Market Share by End-Use Analysisin 2022
- Figure 111: Latin America Shipping Container Market Attractiveness Analysis by End-Use Analysis, 2016-2032
- Figure 112: Latin America Shipping Container Market Revenue (US$ Mn) Market Share by Country in 2022
- Figure 113: Latin America Shipping Container Market Attractiveness Analysis by Country, 2016-2032
- Figure 114: Latin America Shipping Container Market Revenue (US$ Mn) (2016-2032)
- Figure 115: Latin America Shipping Container Market Revenue (US$ Mn) Comparison by Country (2016-2032)
- Figure 116: Latin America Shipping Container Market Revenue (US$ Mn) Comparison by By Product Type (2016-2032)
- Figure 117: Latin America Shipping Container Market Revenue (US$ Mn) Comparison by Size of Container (2016-2032)
- Figure 118: Latin America Shipping Container Market Revenue (US$ Mn) Comparison by End-Use Analysis (2016-2032)
- Figure 119: Latin America Shipping Container Market Y-o-Y Growth Rate Comparison by Country (2016-2032)
- Figure 120: Latin America Shipping Container Market Y-o-Y Growth Rate Comparison by By Product Type (2016-2032)
- Figure 121: Latin America Shipping Container Market Y-o-Y Growth Rate Comparison by Size of Container (2016-2032)
- Figure 122: Latin America Shipping Container Market Y-o-Y Growth Rate Comparison by End-Use Analysis (2016-2032)
- Figure 123: Latin America Shipping Container Market Share Comparison by Country (2016-2032)
- Figure 124: Latin America Shipping Container Market Share Comparison by By Product Type (2016-2032)
- Figure 125: Latin America Shipping Container Market Share Comparison by Size of Container (2016-2032)
- Figure 126: Latin America Shipping Container Market Share Comparison by End-Use Analysis (2016-2032)
- Figure 127: Middle East & Africa Shipping Container Market Revenue (US$ Mn) Market Share by By Product Typein 2022
- Figure 128: Middle East & Africa Shipping Container Market Attractiveness Analysis by By Product Type, 2016-2032
- Figure 129: Middle East & Africa Shipping Container Market Revenue (US$ Mn) Market Share by Size of Containerin 2022
- Figure 130: Middle East & Africa Shipping Container Market Attractiveness Analysis by Size of Container, 2016-2032
- Figure 131: Middle East & Africa Shipping Container Market Revenue (US$ Mn) Market Share by End-Use Analysisin 2022
- Figure 132: Middle East & Africa Shipping Container Market Attractiveness Analysis by End-Use Analysis, 2016-2032
- Figure 133: Middle East & Africa Shipping Container Market Revenue (US$ Mn) Market Share by Country in 2022
- Figure 134: Middle East & Africa Shipping Container Market Attractiveness Analysis by Country, 2016-2032
- Figure 135: Middle East & Africa Shipping Container Market Revenue (US$ Mn) (2016-2032)
- Figure 136: Middle East & Africa Shipping Container Market Revenue (US$ Mn) Comparison by Country (2016-2032)
- Figure 137: Middle East & Africa Shipping Container Market Revenue (US$ Mn) Comparison by By Product Type (2016-2032)
- Figure 138: Middle East & Africa Shipping Container Market Revenue (US$ Mn) Comparison by Size of Container (2016-2032)
- Figure 139: Middle East & Africa Shipping Container Market Revenue (US$ Mn) Comparison by End-Use Analysis (2016-2032)
- Figure 140: Middle East & Africa Shipping Container Market Y-o-Y Growth Rate Comparison by Country (2016-2032)
- Figure 141: Middle East & Africa Shipping Container Market Y-o-Y Growth Rate Comparison by By Product Type (2016-2032)
- Figure 142: Middle East & Africa Shipping Container Market Y-o-Y Growth Rate Comparison by Size of Container (2016-2032)
- Figure 143: Middle East & Africa Shipping Container Market Y-o-Y Growth Rate Comparison by End-Use Analysis (2016-2032)
- Figure 144: Middle East & Africa Shipping Container Market Share Comparison by Country (2016-2032)
- Figure 145: Middle East & Africa Shipping Container Market Share Comparison by By Product Type (2016-2032)
- Figure 146: Middle East & Africa Shipping Container Market Share Comparison by Size of Container (2016-2032)
- Figure 147: Middle East & Africa Shipping Container Market Share Comparison by End-Use Analysis (2016-2032)
List of Tables
- Table 1: Global Shipping Container Market Comparison by By Product Type (2016-2032)
- Table 2: Global Shipping Container Market Comparison by Size of Container (2016-2032)
- Table 3: Global Shipping Container Market Comparison by End-Use Analysis (2016-2032)
- Table 4: Global Shipping Container Market Revenue (US$ Mn) Comparison by Region (2016-2032)
- Table 5: Global Shipping Container Market Revenue (US$ Mn) (2016-2032)
- Table 6: Global Shipping Container Market Revenue (US$ Mn) Comparison by Region (2016-2032)
- Table 7: Global Shipping Container Market Revenue (US$ Mn) Comparison by By Product Type (2016-2032)
- Table 8: Global Shipping Container Market Revenue (US$ Mn) Comparison by Size of Container (2016-2032)
- Table 9: Global Shipping Container Market Revenue (US$ Mn) Comparison by End-Use Analysis (2016-2032)
- Table 10: Global Shipping Container Market Y-o-Y Growth Rate Comparison by Region (2016-2032)
- Table 11: Global Shipping Container Market Y-o-Y Growth Rate Comparison by By Product Type (2016-2032)
- Table 12: Global Shipping Container Market Y-o-Y Growth Rate Comparison by Size of Container (2016-2032)
- Table 13: Global Shipping Container Market Y-o-Y Growth Rate Comparison by End-Use Analysis (2016-2032)
- Table 14: Global Shipping Container Market Share Comparison by Region (2016-2032)
- Table 15: Global Shipping Container Market Share Comparison by By Product Type (2016-2032)
- Table 16: Global Shipping Container Market Share Comparison by Size of Container (2016-2032)
- Table 17: Global Shipping Container Market Share Comparison by End-Use Analysis (2016-2032)
- Table 18: North America Shipping Container Market Comparison by Size of Container (2016-2032)
- Table 19: North America Shipping Container Market Comparison by End-Use Analysis (2016-2032)
- Table 20: North America Shipping Container Market Revenue (US$ Mn) Comparison by Country (2016-2032)
- Table 21: North America Shipping Container Market Revenue (US$ Mn) (2016-2032)
- Table 22: North America Shipping Container Market Revenue (US$ Mn) Comparison by Country (2016-2032)
- Table 23: North America Shipping Container Market Revenue (US$ Mn) Comparison by By Product Type (2016-2032)
- Table 24: North America Shipping Container Market Revenue (US$ Mn) Comparison by Size of Container (2016-2032)
- Table 25: North America Shipping Container Market Revenue (US$ Mn) Comparison by End-Use Analysis (2016-2032)
- Table 26: North America Shipping Container Market Y-o-Y Growth Rate Comparison by Country (2016-2032)
- Table 27: North America Shipping Container Market Y-o-Y Growth Rate Comparison by By Product Type (2016-2032)
- Table 28: North America Shipping Container Market Y-o-Y Growth Rate Comparison by Size of Container (2016-2032)
- Table 29: North America Shipping Container Market Y-o-Y Growth Rate Comparison by End-Use Analysis (2016-2032)
- Table 30: North America Shipping Container Market Share Comparison by Country (2016-2032)
- Table 31: North America Shipping Container Market Share Comparison by By Product Type (2016-2032)
- Table 32: North America Shipping Container Market Share Comparison by Size of Container (2016-2032)
- Table 33: North America Shipping Container Market Share Comparison by End-Use Analysis (2016-2032)
- Table 34: Western Europe Shipping Container Market Comparison by By Product Type (2016-2032)
- Table 35: Western Europe Shipping Container Market Comparison by Size of Container (2016-2032)
- Table 36: Western Europe Shipping Container Market Comparison by End-Use Analysis (2016-2032)
- Table 37: Western Europe Shipping Container Market Revenue (US$ Mn) Comparison by Country (2016-2032)
- Table 38: Western Europe Shipping Container Market Revenue (US$ Mn) (2016-2032)
- Table 39: Western Europe Shipping Container Market Revenue (US$ Mn) Comparison by Country (2016-2032)
- Table 40: Western Europe Shipping Container Market Revenue (US$ Mn) Comparison by By Product Type (2016-2032)
- Table 41: Western Europe Shipping Container Market Revenue (US$ Mn) Comparison by Size of Container (2016-2032)
- Table 42: Western Europe Shipping Container Market Revenue (US$ Mn) Comparison by End-Use Analysis (2016-2032)
- Table 43: Western Europe Shipping Container Market Y-o-Y Growth Rate Comparison by Country (2016-2032)
- Table 44: Western Europe Shipping Container Market Y-o-Y Growth Rate Comparison by By Product Type (2016-2032)
- Table 45: Western Europe Shipping Container Market Y-o-Y Growth Rate Comparison by Size of Container (2016-2032)
- Table 46: Western Europe Shipping Container Market Y-o-Y Growth Rate Comparison by End-Use Analysis (2016-2032)
- Table 47: Western Europe Shipping Container Market Share Comparison by Country (2016-2032)
- Table 48: Western Europe Shipping Container Market Share Comparison by By Product Type (2016-2032)
- Table 49: Western Europe Shipping Container Market Share Comparison by Size of Container (2016-2032)
- Table 50: Western Europe Shipping Container Market Share Comparison by End-Use Analysis (2016-2032)
- Table 51: Eastern Europe Shipping Container Market Comparison by By Product Type (2016-2032)
- Table 52: Eastern Europe Shipping Container Market Comparison by Size of Container (2016-2032)
- Table 53: Eastern Europe Shipping Container Market Comparison by End-Use Analysis (2016-2032)
- Table 54: Eastern Europe Shipping Container Market Revenue (US$ Mn) Comparison by Country (2016-2032)
- Table 55: Eastern Europe Shipping Container Market Revenue (US$ Mn) (2016-2032)
- Table 56: Eastern Europe Shipping Container Market Revenue (US$ Mn) Comparison by Country (2016-2032)
- Table 57: Eastern Europe Shipping Container Market Revenue (US$ Mn) Comparison by By Product Type (2016-2032)
- Table 58: Eastern Europe Shipping Container Market Revenue (US$ Mn) Comparison by Size of Container (2016-2032)
- Table 59: Eastern Europe Shipping Container Market Revenue (US$ Mn) Comparison by End-Use Analysis (2016-2032)
- Table 60: Eastern Europe Shipping Container Market Y-o-Y Growth Rate Comparison by Country (2016-2032)
- Table 61: Eastern Europe Shipping Container Market Y-o-Y Growth Rate Comparison by By Product Type (2016-2032)
- Table 62: Eastern Europe Shipping Container Market Y-o-Y Growth Rate Comparison by Size of Container (2016-2032)
- Table 63: Eastern Europe Shipping Container Market Y-o-Y Growth Rate Comparison by End-Use Analysis (2016-2032)
- Table 64: Eastern Europe Shipping Container Market Share Comparison by Country (2016-2032)
- Table 65: Eastern Europe Shipping Container Market Share Comparison by By Product Type (2016-2032)
- Table 66: Eastern Europe Shipping Container Market Share Comparison by Size of Container (2016-2032)
- Table 67: Eastern Europe Shipping Container Market Share Comparison by End-Use Analysis (2016-2032)
- Table 68: APAC Shipping Container Market Comparison by By Product Type (2016-2032)
- Table 69: APAC Shipping Container Market Comparison by Size of Container (2016-2032)
- Table 70: APAC Shipping Container Market Comparison by End-Use Analysis (2016-2032)
- Table 71: APAC Shipping Container Market Revenue (US$ Mn) Comparison by Country (2016-2032)
- Table 72: APAC Shipping Container Market Revenue (US$ Mn) (2016-2032)
- Table 73: APAC Shipping Container Market Revenue (US$ Mn) Comparison by Country (2016-2032)
- Table 74: APAC Shipping Container Market Revenue (US$ Mn) Comparison by By Product Type (2016-2032)
- Table 75: APAC Shipping Container Market Revenue (US$ Mn) Comparison by Size of Container (2016-2032)
- Table 76: APAC Shipping Container Market Revenue (US$ Mn) Comparison by End-Use Analysis (2016-2032)
- Table 77: APAC Shipping Container Market Y-o-Y Growth Rate Comparison by Country (2016-2032)
- Table 78: APAC Shipping Container Market Y-o-Y Growth Rate Comparison by By Product Type (2016-2032)
- Table 79: APAC Shipping Container Market Y-o-Y Growth Rate Comparison by Size of Container (2016-2032)
- Table 80: APAC Shipping Container Market Y-o-Y Growth Rate Comparison by End-Use Analysis (2016-2032)
- Table 81: APAC Shipping Container Market Share Comparison by Country (2016-2032)
- Table 82: APAC Shipping Container Market Share Comparison by By Product Type (2016-2032)
- Table 83: APAC Shipping Container Market Share Comparison by Size of Container (2016-2032)
- Table 84: APAC Shipping Container Market Share Comparison by End-Use Analysis (2016-2032)
- Table 85: Latin America Shipping Container Market Comparison by By Product Type (2016-2032)
- Table 86: Latin America Shipping Container Market Comparison by Size of Container (2016-2032)
- Table 87: Latin America Shipping Container Market Comparison by End-Use Analysis (2016-2032)
- Table 88: Latin America Shipping Container Market Revenue (US$ Mn) Comparison by Country (2016-2032)
- Table 89: Latin America Shipping Container Market Revenue (US$ Mn) (2016-2032)
- Table 90: Latin America Shipping Container Market Revenue (US$ Mn) Comparison by Country (2016-2032)
- Table 91: Latin America Shipping Container Market Revenue (US$ Mn) Comparison by By Product Type (2016-2032)
- Table 92: Latin America Shipping Container Market Revenue (US$ Mn) Comparison by Size of Container (2016-2032)
- Table 93: Latin America Shipping Container Market Revenue (US$ Mn) Comparison by End-Use Analysis (2016-2032)
- Table 94: Latin America Shipping Container Market Y-o-Y Growth Rate Comparison by Country (2016-2032)
- Table 95: Latin America Shipping Container Market Y-o-Y Growth Rate Comparison by By Product Type (2016-2032)
- Table 96: Latin America Shipping Container Market Y-o-Y Growth Rate Comparison by Size of Container (2016-2032)
- Table 97: Latin America Shipping Container Market Y-o-Y Growth Rate Comparison by End-Use Analysis (2016-2032)
- Table 98: Latin America Shipping Container Market Share Comparison by Country (2016-2032)
- Table 99: Latin America Shipping Container Market Share Comparison by By Product Type (2016-2032)
- Table 100: Latin America Shipping Container Market Share Comparison by Size of Container (2016-2032)
- Table 101: Latin America Shipping Container Market Share Comparison by End-Use Analysis (2016-2032)
- Table 102: Middle East & Africa Shipping Container Market Comparison by By Product Type (2016-2032)
- Table 103: Middle East & Africa Shipping Container Market Comparison by Size of Container (2016-2032)
- Table 104: Middle East & Africa Shipping Container Market Comparison by End-Use Analysis (2016-2032)
- Table 105: Middle East & Africa Shipping Container Market Revenue (US$ Mn) Comparison by Country (2016-2032)
- Table 106: Middle East & Africa Shipping Container Market Revenue (US$ Mn) (2016-2032)
- Table 107: Middle East & Africa Shipping Container Market Revenue (US$ Mn) Comparison by Country (2016-2032)
- Table 108: Middle East & Africa Shipping Container Market Revenue (US$ Mn) Comparison by By Product Type (2016-2032)
- Table 109: Middle East & Africa Shipping Container Market Revenue (US$ Mn) Comparison by Size of Container (2016-2032)
- Table 110: Middle East & Africa Shipping Container Market Revenue (US$ Mn) Comparison by End-Use Analysis (2016-2032)
- Table 111: Middle East & Africa Shipping Container Market Y-o-Y Growth Rate Comparison by Country (2016-2032)
- Table 112: Middle East & Africa Shipping Container Market Y-o-Y Growth Rate Comparison by By Product Type (2016-2032)
- Table 113: Middle East & Africa Shipping Container Market Y-o-Y Growth Rate Comparison by Size of Container (2016-2032)
- Table 114: Middle East & Africa Shipping Container Market Y-o-Y Growth Rate Comparison by End-Use Analysis (2016-2032)
- Table 115: Middle East & Africa Shipping Container Market Share Comparison by Country (2016-2032)
- Table 116: Middle East & Africa Shipping Container Market Share Comparison by By Product Type (2016-2032)
- Table 117: Middle East & Africa Shipping Container Market Share Comparison by Size of Container (2016-2032)
- Table 118: Middle East & Africa Shipping Container Market Share Comparison by End-Use Analysis (2016-2032)
- 1. Executive Summary
-
- China International Marine Containers (Group) Ltd.
- TLS Offshore Containers International
- Cxic Group Containers Co Ltd
- P. MOLLER - MAERSK GROUP
- Singamas Container Holdings Limited
- Dong Fang International Asset Management Ltd.
- W&K Containers, Inc.
- YMC Container Solutions
- China Shipping Container Lines Co. Ltd.
- Jindo Co. Ltd.
Our Clients


View Our Licence Options
