
Secure Access Services Edge Market By Offering (Security as a Service, Security as a Service), By Organization Size (Large Enterprises, SMEs), By Vertical(Government, BFSI, Retail and eCommerce, IT and ITeS, Other Verticals), By Component(Solution, Service), By Region And Companies - Industry Segment Outlook, Market Assessment, Competition Scenario, Trends, And Forecast 2024-2033
-
51404
-
Sept 2024
-
170
-


-
This report was compiled by Vishwa Gaul Vishwa is an experienced market research and consulting professional with over 8 years of expertise in the ICT industry, contributing to over 700 reports across telecommunications, software, hardware, and digital solutions. Correspondence Team Lead- ICT Linkedin | Detailed Market research Methodology Our methodology involves a mix of primary research, including interviews with leading mental health experts, and secondary research from reputable medical journals and databases. View Detailed Methodology Page
-
Quick Navigation
Report Overview
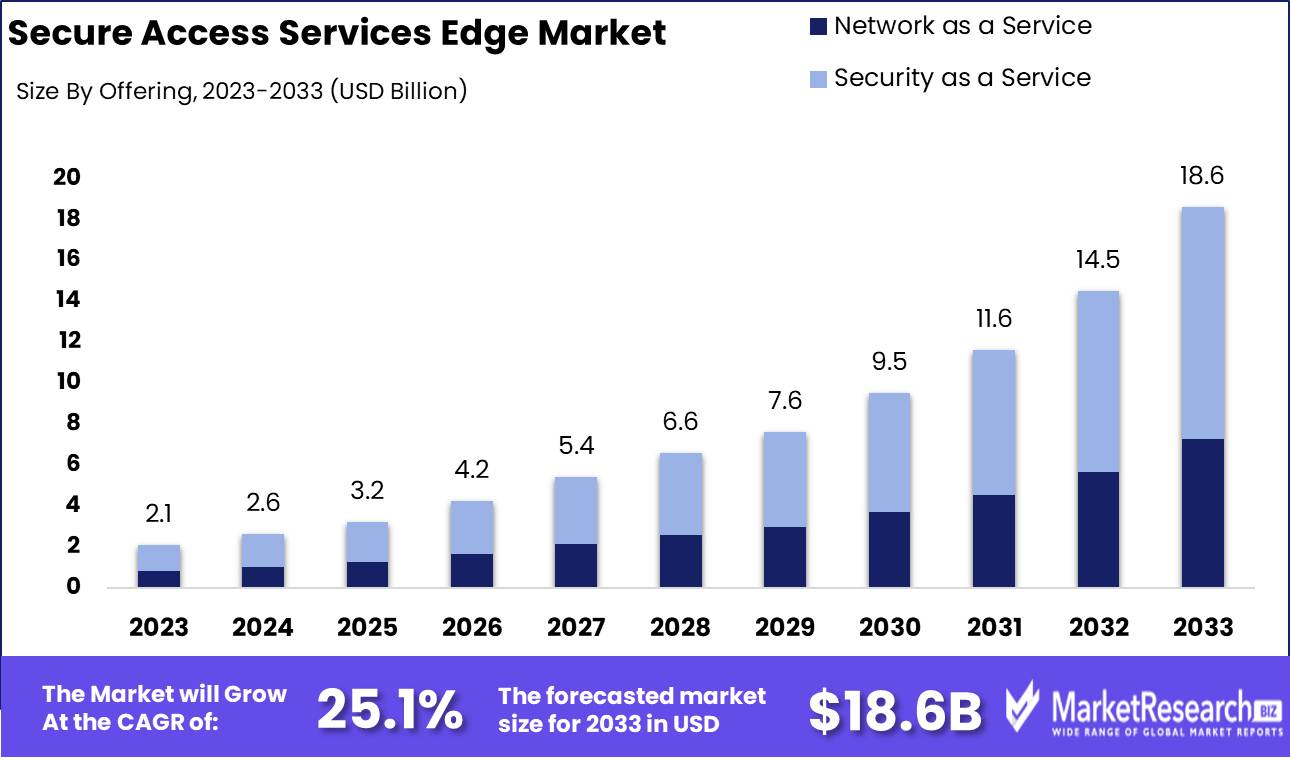
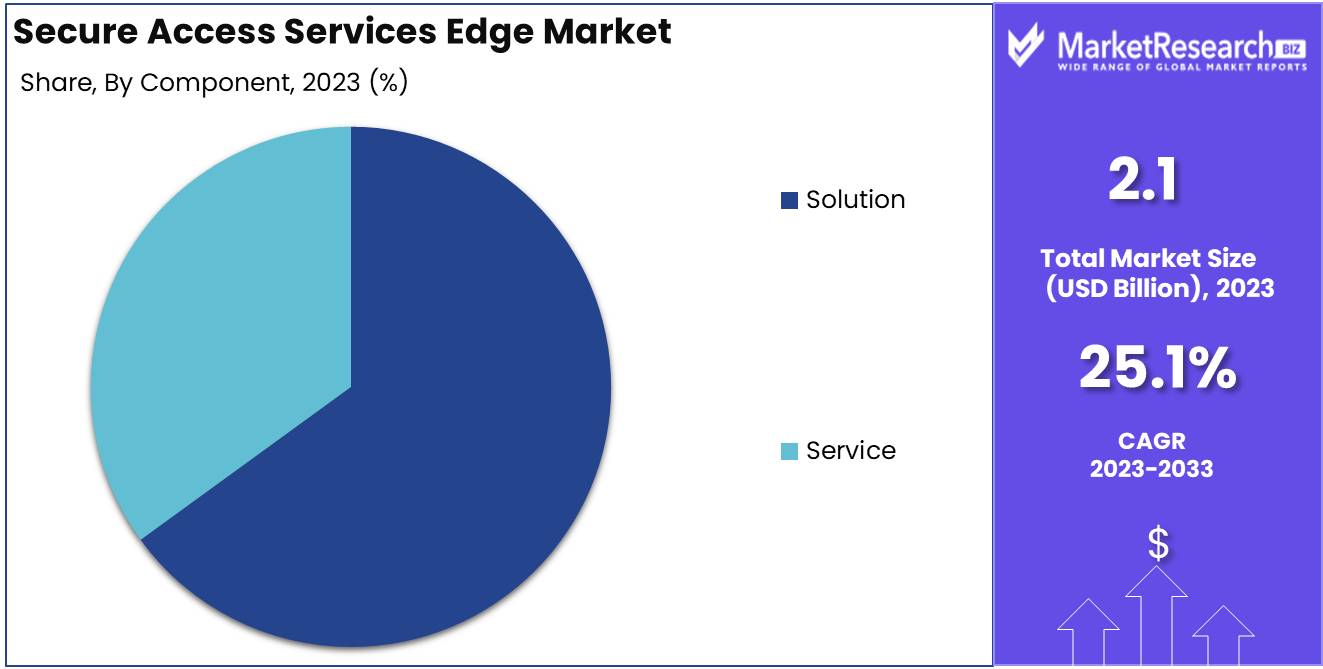
The Secure Access Services Edge Market was valued at USD 2.1 billion in 2023. It is expected to reach USD 18.6 billion by 2033, with a Compound annual growth rate (CAGR) of 25.1% during the forecast period from 2024 to 2033.
The Secure Access Services Edge (SASE) market refers to a framework that integrates network security and wide area networking (WAN) into a single cloud-based service. It delivers secure, seamless, and scalable access to corporate resources, regardless of user location. SASE combines elements such as Zero Trust Network Access (ZTNA), Secure Web Gateway (SWG), Cloud Access Security Broker (CASB), and firewall as a service (FWaaS). With the increasing shift to remote work and cloud adoption, SASE addresses the demand for secure, low-latency connectivity, while reducing complexity and costs associated with managing traditional networking and security infrastructure.
The Secure Access Services Edge (SASE) market is poised for significant growth as enterprises increasingly prioritize secure, scalable, and efficient networking solutions to support cloud environments and hybrid workforces. SASE, which integrates network security functions with wide-area networking (WAN) capabilities, has become a critical framework for businesses navigating the complexities of digital transformation. The convergence of security and networking in a unified platform addresses the growing need for seamless, real-time access to data and applications, while ensuring robust protection against evolving cyber threats.
Rising cybersecurity concerns, regulatory mandates, and the shift to cloud-native operations are driving enterprises to adopt SASE solutions that offer both flexibility and enhanced security. This market is expected to witness rapid expansion, with key players like Tata Communications, Cloudflare, Cisco, and Hewlett Packard Enterprise (HPE) actively positioning themselves as innovators in the space.
Recent strategic developments highlight the momentum behind SASE adoption. Tata Communications' launch of its Unified/Single-Vendor Hosted SASE, developed in collaboration with Versa Networks, exemplifies the trend toward integrated, cloud-based solutions that enhance both security and performance. Similarly, Cloudflare's Cloudflare One platform, designed to simplify network and security transformation, underscores the demand for streamlined, comprehensive offerings.
Moreover, Cisco’s $1B AI investment fund, aimed at bolstering AI-driven security innovations, along with HPE’s acquisition of Axis Security to expand its edge-to-cloud security capabilities, reflects the growing importance of SASE as a cornerstone of enterprise IT strategies. As cyber threats intensify and remote work persists, enterprises will increasingly seek comprehensive, AI-powered SASE solutions to protect their operations, driving further market growth.
Key Takeaways
- Market Growth: The Secure Access Services Edge (SASE) market is expected to grow from USD 2.1 billion in 2023 to USD 18.6 billion by 2033, at a 25.1% CAGR, driven by increased cloud adoption and the shift toward secure remote work models.
- Analyst Viewpoint Summary: SASE is becoming a critical solution for enterprises facing digital transformation, with strong growth fueled by rising cybersecurity risks and the need for seamless, cloud-based security. Key players are focusing on AI-driven security innovations to gain a competitive edge.
- By Offering: Security as a Service dominated the market with 61% in 2023 due to the demand for scalable cloud-based security solutions.
- By Organization Size: Large Enterprises held 71.2% of the market share in 2023, driven by the complexity of their IT environments and need for integrated security and networking solutions.
- By Vertical Analysis: The BFSI sector led with 34.1% market share in 2023, driven by high security needs, regulatory compliance, and digital banking innovations.
- By Component Analysis: The Solution component held 65.1% of the market in 2023, as enterprises seek end-to-end security frameworks to streamline management across hybrid environments.
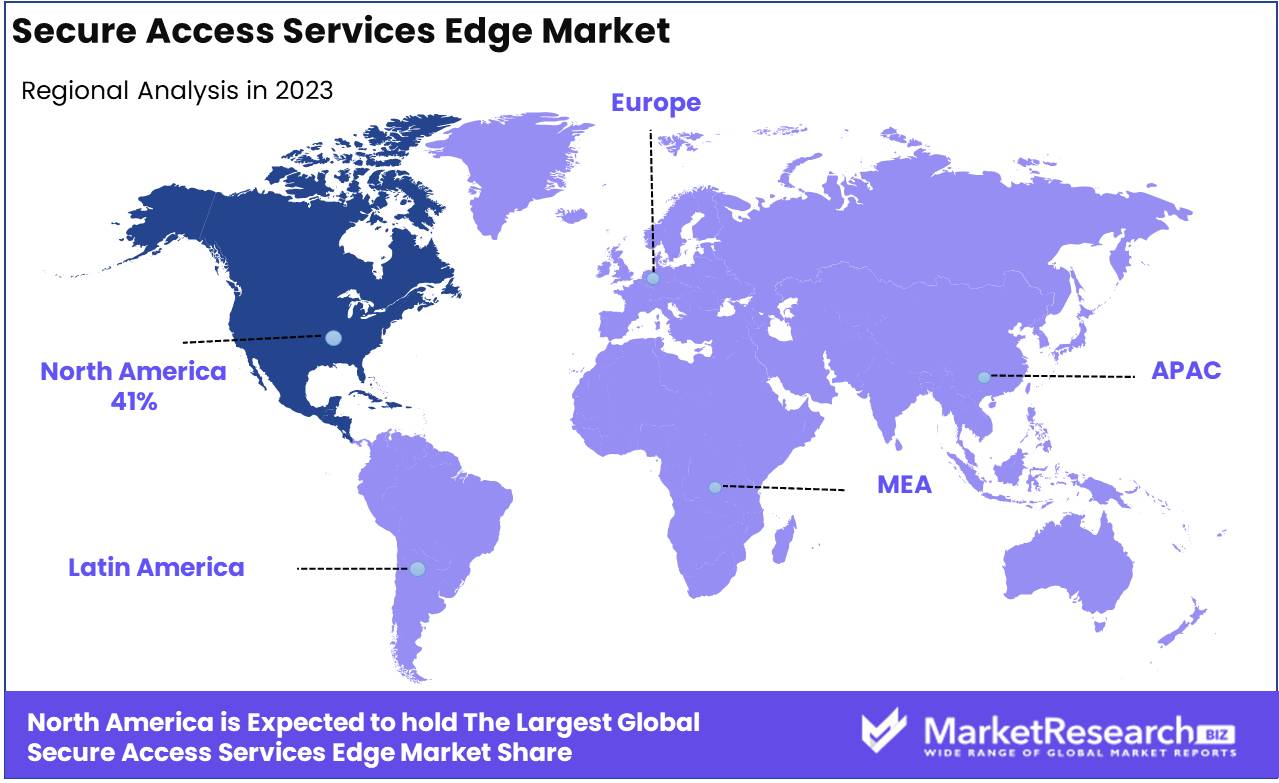
- Regional Growth: North America led the market with 41% share in 2023, driven by cloud adoption and stringent data protection laws in the US and Canada.
- Growth Opportunity: By 2024, global cloud spending is projected to exceed $1 trillion, creating significant demand for SASE solutions to secure cloud environments.
- Restraining Factor: Customer education and migration challenges, particularly the knowledge gap about SASE solutions, are slowing adoption.
Driving Factors
User-Centric Security Models
The growing importance of user-centric security models is a key driver of the Secure Access Service Edge (SASE) market, as organizations shift towards more flexible, user-focused cybersecurity frameworks. Traditional perimeter-based security models are proving inadequate in an environment where remote work, cloud applications, and mobile devices are the norm. As a result, businesses are increasingly adopting SASE, which combines network security and wide-area networking (WAN) into a single cloud-delivered service that focuses on securing users rather than locations.
This transition reflects the increasing complexity of digital infrastructures, where endpoint security, zero-trust network access (ZTNA), and identity-centric approaches are pivotal. By focusing on individual user profiles and contextual factors (such as device type, network location, and access time), SASE ensures that security policies are tailored, dynamic, and scalable. This reduces the attack surface in highly distributed environments, facilitating secure access to cloud services, which has become critical post-pandemic.
According to Gartner, by 2025, at least 60% of enterprises will have explicit strategies and timelines for adopting SASE, up from less than 10% in 2020. This underlines how user-centric models are becoming integral to modern enterprise security architectures. Moreover, user-centric security models are inherently aligned with other trends such as zero-trust architecture and adaptive access management, both of which are gaining momentum and further accelerating SASE market growth.
Digital Transformation Initiatives
Digital transformation initiatives are a primary accelerator of SASE adoption, as enterprises undergo large-scale migrations to cloud environments, modernize legacy systems, and re-engineer business models around digital platforms. The increasing reliance on cloud applications, software-as-a-service (SaaS), and edge computing demands a security model that is agile, scalable, and integrated. SASE meets these needs by providing unified security and networking solutions tailored for digital-first organizations.
This transformation is not just an operational imperative but also a strategic shift for businesses looking to remain competitive. The global spending on digital transformation technologies is projected to reach $3.4 trillion by 2026, highlighting the scale and significance of this trend. As organizations embrace cloud-first and remote-first strategies, the need for a unified, cloud-native security approach has become paramount.
In this context, SASE offers enterprises a way to maintain robust security across their distributed environments while reducing complexity and cost. Traditional security tools, often fragmented across different vendors and platforms, struggle to keep pace with the dynamic nature of digital infrastructure. In contrast, SASE’s cloud-native architecture supports agile deployment, centralized management, and seamless integration with modern cloud applications, making it an essential component of digital transformation strategies.
The interplay between digital transformation and cloud migration intensifies the demand for SASE solutions. As businesses rearchitect their operations around cloud technologies, the risks associated with broader attack surfaces, data breaches, and compliance become more pronounced. SASE addresses these challenges by delivering secure, optimized access to cloud-based resources, ensuring that digital transformation initiatives are both secure and scalable.
In conclusion, both user-centric security models and digital transformation initiatives are critical forces driving the growth of the SASE market. As businesses continue to adopt more decentralized, cloud-based operational models, the need for a cohesive, scalable, and secure access framework will only increase, positioning SASE as a key enabler of modern enterprise security.
Restraining Factors
Customer Education and Migration
One of the key restraining factors for the growth of the Secure Access Service Edge (SASE) market is the challenge of customer education and migration. Despite the clear benefits of SASE, many enterprises lack sufficient understanding of its capabilities, and often confuse it with existing security and networking solutions. This knowledge gap makes organizations hesitant to transition from legacy systems to a fully integrated SASE framework.
Migrating to a SASE model requires a rethinking of security architectures and the consolidation of traditionally separate network and security functions. Many businesses still rely on disjointed systems and are often reluctant to overhaul these familiar setups, especially given the complexity and costs associated with such transformations. A 2022 study revealed that 64% of businesses cited a lack of expertise as a significant barrier to implementing advanced security technologies like SASE, underscoring the critical need for education and training.
Moreover, the shift to SASE involves migrating from on-premises solutions to cloud-based services, which can be technically challenging, particularly for organizations with complex IT environments or those in highly regulated industries. This migration often requires a phased approach, which can delay adoption and slow market expansion. In response, vendors and service providers are investing heavily in educational resources and professional services to bridge the knowledge gap, but these efforts take time to yield widespread results.
This challenge is intertwined with organizational inertia, where enterprises, particularly smaller or mid-sized firms, prefer incremental changes over radical shifts. As a result, the growth of the SASE market may be tempered until enterprises overcome these educational and migration hurdles.
Evolving Threat Landscape and Compliance Requirements
The evolving threat landscape and increasingly stringent compliance requirements present both opportunities and challenges for the SASE market. On one hand, the rising sophistication of cyberattacks and the growing number of endpoints in modern, decentralized work environments demand a robust, unified security solution like SASE. The need to protect distributed networks from advanced threats, such as ransomware and supply chain attacks, is pushing enterprises toward more comprehensive, cloud-based security frameworks that can adapt in real time to changing risks.
However, these same dynamics also introduce complexity. As the threat landscape becomes more diverse and compliance regulations more stringent, organizations face mounting pressure to ensure their SASE solutions meet various legal and industry-specific standards. For instance, global regulations such as the General Data Protection Regulation (GDPR), and regional frameworks like the California Consumer Privacy Act (CCPA), demand stringent data protection measures. Companies are often unsure how well SASE platforms align with these evolving regulatory requirements, which can slow adoption due to concerns over compliance risks and potential fines.
This compliance burden is especially acute for industries like finance, healthcare, and government, where regulatory frameworks are particularly rigid. The need to ensure SASE platforms offer adequate reporting, auditing, and security controls in line with these standards can delay the decision-making process for businesses considering SASE adoption.
Additionally, the rapidly shifting threat landscape forces organizations to continually update and evolve their security strategies. While SASE offers a flexible and adaptive security framework, some businesses are concerned that its cloud-native approach may not yet be fully mature enough to counteract emerging threats in real time. This hesitation, paired with compliance concerns, can act as a restraining factor on market growth.
However, this restraint is likely temporary. As vendors improve their platforms to address specific compliance requirements and demonstrate SASE’s ability to respond dynamically to evolving threats, the market is expected to gain momentum. For instance, ongoing advancements in zero-trust architecture and AI-driven threat detection are steadily enhancing SASE's ability to manage sophisticated cyberattacks, which will likely ease concerns and accelerate adoption in the long term.
By Offering Analysis
Security as a Service Dominating the SASE Market with 61% Largest Share in 2023
In 2023, Security as a Service (SECaaS) held a dominant position within the "By Offering" segment of the Secure Access Services Edge (SASE) market, capturing over 61% of the total market share. This commanding presence can be attributed to the increasing demand for scalable, cloud-based security solutions that address the growing complexities of cyber threats, hybrid work environments, and the need for seamless integration across various network infrastructures.
The adoption of Security as a Service is being driven by its ability to provide cost-effective, real-time protection and centralized management, making it a preferred choice for enterprises aiming to enhance their security postures without substantial capital expenditure. Furthermore, the rise of remote working and the decentralization of traditional IT infrastructure have further amplified the need for robust security services that can be deployed rapidly and maintained with agility.
In contrast, Network as a Service (NaaS), although a growing area, held a smaller share within the same segment. However, NaaS is projected to see accelerated growth in the coming years due to its capability to offer dynamic, flexible, and cost-efficient network management solutions, particularly in cloud-native and hybrid-cloud environments. While NaaS lags behind SECaaS in terms of current market share, it is positioned as a critical enabler of digital transformation, supporting organizations in building and managing adaptive network environments that align with evolving business needs.
As enterprises continue to prioritize security in their IT strategies, the Security as a Service segment is expected to maintain its lead, driven by the increasing sophistication of cyberattacks, regulatory compliance requirements, and the adoption of zero-trust security frameworks.
By Organization Size
Large Enterprises Leading the SASE Market with a 71.2% Largest Share in 2023
In 2023, Large Enterprises held a dominant position within the "By Organization Size" segment of the Secure Access Services Edge (SASE) market, capturing over 71.2% of the total market share. The significant adoption of SASE solutions by large enterprises is driven by the complexity and scale of their IT infrastructures, which demand advanced, integrated security and networking solutions to manage increasingly distributed workforces and evolving cyber threats. These enterprises prioritize robust, scalable solutions that can offer comprehensive security, compliance, and performance benefits across global operations.
Large enterprises tend to invest heavily in SASE frameworks due to their ability to centralize and streamline security policies while maintaining high levels of network performance across multiple locations. The integration of cloud-native security services, including zero-trust architectures and secure web gateways, has become crucial as organizations deal with growing volumes of data and heightened regulatory requirements. Moreover, large enterprises are well-positioned to leverage the full suite of SASE functionalities, including Security as a Service (SECaaS) and Network as a Service (NaaS), ensuring seamless and secure access for their remote and hybrid workforces.
On the other hand, Small and Medium-sized Enterprises (SMEs), while representing a smaller market share in this segment, are gradually increasing their adoption of SASE solutions as they seek to enhance security in a cost-effective manner. SMEs face unique challenges, such as limited IT resources and the need for flexible, scalable solutions, making SASE an attractive option for future growth. However, their share in 2023 remained significantly lower due to budget constraints and less complex network requirements compared to large enterprises.
Looking ahead, large enterprises are expected to continue driving demand in the SASE market, bolstered by the need for advanced security solutions and increased investment in digital transformation initiatives.
By Vertical Analysis
BFSI: Leading the SASE Market with 34.1% Share in 2023
In 2023, the Banking, Financial Services, and Insurance (BFSI) sector held a dominant position within the "By Vertical" segment of the Secure Access Services Edge (SASE) market, capturing over 34.1% of the total market share. The BFSI sector’s leading market share is driven by its heightened need for secure, scalable, and reliable network infrastructure to protect sensitive financial data, ensure regulatory compliance, and mitigate the growing risks of sophisticated cyberattacks.
Given the critical nature of financial transactions and the increasing trend of digital banking and fintech innovations, BFSI organizations prioritize SASE solutions for their ability to provide seamless integration of security and networking. The rise of online banking, remote work, and cloud adoption has intensified the demand for robust security frameworks, including zero-trust architectures and encrypted communications, positioning BFSI as a leading adopter of SASE technologies.
Government and Retail and eCommerce sectors followed as significant verticals, though each lagged behind BFSI in market share. The Government sector, dealing with vast amounts of sensitive citizen data, is increasingly adopting SASE to protect against cyber threats and ensure compliance with stringent data privacy regulations. Meanwhile, the Retail and eCommerce sector is leveraging SASE to safeguard customer data and secure online transactions as it navigates the growing complexities of omnichannel operations and cybersecurity concerns.
Additionally, IT and ITeS and Other Verticals, such as healthcare and manufacturing, are steadily increasing their SASE adoption as they seek to secure hybrid environments, protect intellectual property, and support digital transformation initiatives. However, these verticals captured a comparatively smaller share in 2023 due to varying levels of security maturity and budgetary constraints.
The BFSI sector’s robust demand for comprehensive security solutions is expected to continue driving its leadership in the SASE market, particularly as cyber risks evolve and financial institutions intensify their focus on protecting digital assets and maintaining regulatory compliance.
By Component Analysis
Solution: Dominating the SASE Market with 65.1%Largest Share in 2023
In 2023, Solution held a dominant position within the "By Component" segment of the Secure Access Services Edge (SASE) market, capturing more than 65.1% of the total market share. This significant share can be attributed to the growing preference for integrated SASE solutions, which combine essential security and networking functionalities, such as secure web gateways (SWG), cloud access security brokers (CASB), and zero-trust network access (ZTNA), into a unified offering. The shift towards cloud-native environments and the need for centralized management of security policies across hybrid infrastructures have driven enterprises to invest heavily in comprehensive SASE solutions.
The Solution component appeals to organizations looking for scalable, end-to-end security frameworks that address complex challenges, including remote workforce security, secure cloud access, and real-time threat detection and mitigation. These pre-packaged solutions provide enterprises with the ability to reduce operational overhead by streamlining their security architectures, making them a preferred choice in the current market landscape.
In contrast, the Service component, while representing a smaller portion of the market, is growing in significance as companies increasingly seek professional and managed services to support the deployment, customization, and ongoing maintenance of SASE solutions. Services such as consulting, integration, and technical support are critical for enterprises that lack in-house expertise or the resources needed to manage complex SASE environments.
As businesses continue to prioritize the adoption of cloud-based security models, the Solution component is expected to maintain its dominant position, driven by the need for holistic, flexible, and cost-efficient SASE frameworks that can scale alongside evolving enterprise needs.
Key Market Segments
Based on Offering
- Network as a Service
- Security as a Service
Based on Organization
- Large Enterprises
- SMEs
Based on Vertical
- BFSI
- Government
- Retail and eCommerce
- IT and ITeS
- Other Verticals
Based on Component
- Solution
- Service
Growth Opportunity
Increased Cloud Adoption and Digital Transformation
By 2024, global cloud spending is projected to reach over $1 trillion, reflecting the rapid adoption of cloud-native applications and infrastructure. This shift creates significant opportunities for SASE solutions, which are designed to secure cloud environments by integrating network and security services into a single platform. As enterprises prioritize agility and scalability in their IT strategies, SASE frameworks will become indispensable for securing multi-cloud environments and managing dynamic workloads.
Expansion of Remote and Hybrid Work Models
The continuation of remote and hybrid work trends will also be a major growth driver. In 2023, 45% of the global workforce operated in a hybrid capacity, a figure expected to increase in 2024. SASE’s ability to ensure secure, consistent access to corporate resources from any location positions it as a critical solution for companies navigating the complexities of distributed workforces. The demand for secure remote access and seamless connectivity will drive enterprises to adopt SASE to enhance productivity without compromising security.
Latest Trends
Increased Adoption of Zero-Trust Architectures
In 2024, zero-trust security models are expected to become a foundational component of SASE frameworks. With the rise of remote work and cloud adoption, traditional perimeter-based security models are becoming obsolete. Zero-trust architectures assume that threats exist both outside and inside the network, continuously verifying user identities and devices before granting access. This approach is critical for securing distributed environments, and its growing adoption is driven by the need for stronger protection against insider threats and lateral movement within networks. SASE solutions that incorporate zero-trust principles offer granular control over access, making them highly attractive for organizations across industries.
Artificial Intelligence (AI) and Machine Learning (ML) for Threat Detection
The integration of Artificial Intelligence (AI) and Machine Learning (ML) into SASE solutions is revolutionizing how organizations detect and respond to cyber threats. In 2024, the use of AI/ML for real-time threat detection, anomaly analysis, and automated responses will be a key differentiator for SASE providers. AI-driven security capabilities allow for faster identification of emerging threats and reduce manual intervention, improving overall security posture. As cyberattacks become more sophisticated, the ability to deploy AI-enhanced, automated security measures will become essential for staying ahead of evolving threats.
Regional Analysis
Secure Access Services Edge (SASE) Market North America Dominates with 41% Largest Market Share
The Secure Access Services Edge (SASE) market is witnessing significant growth across multiple regions, driven by the rising demand for cloud-based security solutions, the expansion of remote work, and increasing regulatory standards for data protection. Below is a detailed regional analysis of the SASE market by major geographical segments:
North America dominates the global SASE market, accounting for approximately 41% of the global market share. This leadership is driven by the robust adoption of cloud services and digital transformation initiatives, particularly in the US and Canada. The presence of key market players such as Cisco, Palo Alto Networks, and Zscaler further strengthens this region's position. Furthermore, stringent data protection laws like the California Consumer Privacy Act (CCPA) and Canada’s Personal Information Protection and Electronic Documents Act (PIPEDA) are encouraging businesses to adopt secure network frameworks, fueling market growth. The region's significant market size is expected to continue growing as more organizations transition to hybrid work environments.
The SASE market in Europe is expanding rapidly, with leading markets such as Germany, France, and the UK driving the adoption of secure access services edge solutions. Germany, in particular, has emerged as a key market due to its strong manufacturing base and rapid digitalization efforts. Europe is characterized by strict data protection regulations such as the General Data Protection Regulation (GDPR), which mandates enhanced cybersecurity measures, thus accelerating the demand for SASE solutions. The European market is also supported by a growing number of SMEs adopting cloud services to enhance operational efficiency, with key players focusing on expanding their footprint in countries like Spain, Italy, and the Netherlands.
Asia-Pacific is projected to witness the fastest growth in the SASE market due to increasing investments in cloud infrastructure and cybersecurity across key countries such as China, Japan, India, and South Korea. China and Japan are leading the region’s adoption of SASE, driven by government initiatives to enhance cybersecurity frameworks and large-scale digital transformation projects. In India, the rapid proliferation of digital services and the growing IT sector are contributing to significant market growth. Additionally, emerging markets like Singapore, Vietnam, and Thailand are increasingly adopting SASE solutions to address data privacy concerns and meet evolving regulatory standards, making Asia-Pacific a major growth engine for the global SASE industry.
Latin America, particularly Brazil and Mexico, is gradually embracing secure access services edge technologies, driven by rising concerns over cybersecurity threats and data privacy. Brazil stands out as a leading market in this region, benefiting from robust industrial and financial sectors that are investing heavily in advanced security solutions. Meanwhile, Mexico is experiencing steady growth due to the increasing digitalization of businesses and the enforcement of data protection laws, such as the General Law on the Protection of Personal Data (LGPDP). The demand for SASE in South America is expected to grow as organizations in the region seek to secure their networks in response to rising cyber threats.
The Middle East & Africa (MEA) region is showing moderate growth in the SASE market, with countries such as Saudi Arabia, South Africa, and the UAE leading adoption. In Saudi Arabia, the government's Vision 2030 initiative, which emphasizes digital transformation and cybersecurity, is a key driver of SASE market growth. Similarly, the UAE has positioned itself as a technological hub, with increasing investments in cloud infrastructure and security services. In South Africa, the Protection of Personal Information Act (POPIA) has catalyzed the adoption of advanced security solutions to safeguard sensitive data. The rest of the MEA region is expected to see slower growth, with demand primarily concentrated in urbanized and economically advanced regions.
Key Regions and Countries
North America
- The US
- Canada
- Rest of North America
Europe
- Germany
- France
- The UK
- Spain
- Netherlands
- Russia
- Italy
- Rest of Europe
Asia-Pacific
- China
- Japan
- Singapore
- Thailand
- South Korea
- Vietnam
- India
- New Zealand
- Rest of Asia Pacific
Latin America
- Mexico
- Brazil
- Rest of Latin America
Middle East & Africa
- Saudi Arabia
- South Africa
- UAE
- Rest of the Middle East & Africa
Key Players Analysis
In 2024, the Secure Access Services Edge (SASE) market is characterized by fierce competition among key players, each leveraging their unique capabilities to address the convergence of networking and security demands in a digital-first world. Cisco Systems Inc., a leader in network infrastructure, is enhancing its SASE portfolio to align with growing demand for secure network traffic management and cybersecurity risk mitigation. Its comprehensive solutions, coupled with its large customer base, position it as a key player in the market.
Cloudflare Inc. and Zscaler Inc. are pioneering cloud-native approaches to SASE, focusing on scaling secure access solutions for the digital workforce. These companies’ ability to handle massive volumes of network traffic while ensuring cybersecurity is critical in supporting ongoing digital business transformations. VMware Inc. and Fortinet Inc. are similarly well-positioned, with strong expertise in integrating SASE into hybrid IT environments, addressing both networking and security needs.
Palo Alto Networks Inc. and Akamai Technologies Inc. offer advanced security solutions, with a particular focus on cybersecurity risk management. They are favored by enterprises undergoing rapid digital transformation, as their SASE solutions offer robust, scalable protection across distributed networks. Cato Networks Ltd. and Versa Networks Inc. continue to gain market share due to their specialized focus on cloud security and SD-WAN technologies, key drivers in the SASE ecosystem.
Traditional cybersecurity leaders like Broadcom Corporation, Checkpoint Software Technologies Ltd, and McAfee Corp. are evolving their offerings to stay competitive, while Aryaka Networks Inc. and Juniper Networks focus on cloud-first, digital workforce solutions. Collectively, these players are shaping the future of secure access in an increasingly digital and distributed business landscape.
Market Key Players
- Cisco Systems Inc
- Cloudflare Inc
- VMware Inc
- Fortinet Inc
- Palo Alto Networks Inc
- Akamai Technologies Inc
- Zscaler Inc
- Cato Networks Ltd
- Versa Networks Inc
- Forcepoint
- Broadcom Corporation
- Checkpoint Software Technologies Ltd
- McAfee Corp
- Citrix systems inc.
- juniper network
- Aryaka Networks Inc
Recent Development
- In 2024, Tata Communications launched a Unified SASE solution, developed with Versa Networks, combining SD-WAN and secure service edge (SSE) for global enterprises, offering secure, scalable networking and zero-trust security.
- In 2024,Cisco Investments launched a $1 billion AI investment fund, with $200 million already committed, to support AI startups like Cohere, Mistral AI, and Scale AI, enhancing Cisco's AI strategy.
- In 2024, Palo Alto Networks and IBM formed a partnership to deliver AI-powered security solutions, leveraging both companies' expertise in cybersecurity and cloud innovation.
- In, 2023,Hewlett Packard Enterprise (HPE) announced the acquisition of Axis Security to strengthen its edge-to-cloud security capabilities by offering a unified SASE solution to improve application performance and network security.
- In 2023,Cloudflare announced the full availability of its single-vendor SASE platform, Cloudflare One, addressing security and networking needs for the hybrid workforce while minimizing complexity.
Report Scope
Report Features Description Market Value (2023) USD 2.1 Bn Forecast Revenue (2033) USD 18.6 Bn CAGR (2024-2032) 25.1% Base Year for Estimation 2023 Historic Period 2016-2023 Forecast Period 2024-2033 Report Coverage Revenue Forecast, Market Dynamics, COVID-19 Impact, Competitive Landscape, Recent Developments Segments Covered Based on Offering (Security as a Service, Security as a Service), Based on Organization Size (Large Enterprises, SMEs), Based on Vertical(Government, BFSI, Retail and eCommerce, IT and ITeS, Other Verticals), Based on Component(Solution, Service), By Region And Companies - Industry Segment Outlook, Market Assessment, Competition Scenario, Trends, And Forecast 2024-2033 Regional Analysis North America - The US, Canada, Rest of North America, Europe - Germany, France, The UK, Spain, Italy, Russia, Netherlands, Rest of Europe, Asia-Pacific - China, Japan, South Korea, India, New Zealand, Singapore, Thailand, Vietnam, Rest of Asia Pacific, Latin America - Brazil, Mexico, Rest of Latin America, Middle East & Africa - South Africa, Saudi Arabia, UAE, Rest of Middle East & Africa Competitive Landscape Cisco Systems Inc, Cloudflare Inc, VMware Inc, Fortinet Inc, Palo Alto Networks Inc, Akamai Technologies Inc, Zscaler Inc, Cato Networks Ltd, Versa Networks Inc, Forcepoint, Broadcom Corporation, Checkpoint Software Technologies Ltd, McAfee Corp, citrix systems inc., juniper network, Aryaka Networks Inc Customization Scope Customization for segments, region/country-level will be provided. Moreover, additional customization can be done based on the requirements. Purchase Options We have three licenses to opt for Single User License, Multi-User License (Up to 5 Users), Corporate Use License (Unlimited User and Printable PDF) -
- 1. Executive Summary
- 1.1. Definition
- 1.2. Taxonomy
- 1.3. Research Scope
- 1.4. Key Analysis
- 1.5. Key Findings by Major Segments
- 1.6. Top strategies by Major Players
- 2. Global Secure Access Services Edge Marke Overview
- 2.1. Secure Access Services Edge Marke Dynamics
- 2.1.1. Drivers
- 2.1.2. Opportunities
- 2.1.3. Restraints
- 2.1.4. Challenges
- 2.2. Macro-economic Factors
- 2.3. Regulatory Framework
- 2.4. Market Investment Feasibility Index
- 2.5. PEST Analysis
- 2.6. PORTER’S Five Force Analysis
- 2.7. Drivers & Restraints Impact Analysis
- 2.8. Industry Chain Analysis
- 2.9. Cost Structure Analysis
- 2.10. Marketing Strategy
- 2.11. Russia-Ukraine War Impact Analysis
- 2.12. Opportunity Map Analysis
- 2.13. Market Competition Scenario Analysis
- 2.14. Product Life Cycle Analysis
- 2.15. Opportunity Orbits
- 2.16. Manufacturer Intensity Map
- 2.17. Major Companies sales by Value & Volume
- 2.1. Secure Access Services Edge Marke Dynamics
- 3. Global Secure Access Services Edge Marke Analysis, Opportunity and Forecast, 2016-2032
- 3.1. Global Secure Access Services Edge Marke Analysis, 2016-2021
- 3.2. Global Secure Access Services Edge Marke Opportunity and Forecast, 2023-2032
- 3.3. Global Secure Access Services Edge Marke Analysis, Opportunity and Forecast, By Based On Offering , 2016-2032
- 3.3.1. Global Secure Access Services Edge Marke Analysis by Based On Offering : Introduction
- 3.3.2. Market Size Absolute $ Opportunity Analysis and Forecast, By Based On Offering , 2016-2032
- 3.3.3. Network as a Service
- 3.3.4. Security as a Service
- 3.4. Global Secure Access Services Edge Marke Analysis, Opportunity and Forecast, By Based on Organization Size, 2016-2032
- 3.4.1. Global Secure Access Services Edge Marke Analysis by Based on Organization Size: Introduction
- 3.4.2. Market Size Absolute $ Opportunity Analysis and Forecast, By Based on Organization Size, 2016-2032
- 3.4.3. Large Enterprises
- 3.4.4. SMEs
- 3.5. Global Secure Access Services Edge Marke Analysis, Opportunity and Forecast, By Based on Vertical, 2016-2032
- 3.5.1. Global Secure Access Services Edge Marke Analysis by Based on Vertical: Introduction
- 3.5.2. Market Size Absolute $ Opportunity Analysis and Forecast, By Based on Vertical, 2016-2032
- 3.5.3. Government
- 3.5.4. BFSI
- 3.5.5. Retail and eCommerce
- 3.5.6. IT and ITeS
- 3.5.7. Other Verticals
- 3.6. Global Secure Access Services Edge Marke Analysis, Opportunity and Forecast, By Based on Component, 2016-2032
- 3.6.1. Global Secure Access Services Edge Marke Analysis by Based on Component: Introduction
- 3.6.2. Market Size Absolute $ Opportunity Analysis and Forecast, By Based on Component, 2016-2032
- 3.6.3. Solution
- 3.6.4. Service
- 4. North America Secure Access Services Edge Marke Analysis, Opportunity and Forecast, 2016-2032
- 4.1. North America Secure Access Services Edge Marke Analysis, 2016-2021
- 4.2. North America Secure Access Services Edge Marke Opportunity and Forecast, 2023-2032
- 4.3. North America Secure Access Services Edge Marke Analysis, Opportunity and Forecast, By Based On Offering , 2016-2032
- 4.3.1. North America Secure Access Services Edge Marke Analysis by Based On Offering : Introduction
- 4.3.2. Market Size Absolute $ Opportunity Analysis and Forecast, By Based On Offering , 2016-2032
- 4.3.3. Network as a Service
- 4.3.4. Security as a Service
- 4.4. North America Secure Access Services Edge Marke Analysis, Opportunity and Forecast, By Based on Organization Size, 2016-2032
- 4.4.1. North America Secure Access Services Edge Marke Analysis by Based on Organization Size: Introduction
- 4.4.2. Market Size Absolute $ Opportunity Analysis and Forecast, By Based on Organization Size, 2016-2032
- 4.4.3. Large Enterprises
- 4.4.4. SMEs
- 4.5. North America Secure Access Services Edge Marke Analysis, Opportunity and Forecast, By Based on Vertical, 2016-2032
- 4.5.1. North America Secure Access Services Edge Marke Analysis by Based on Vertical: Introduction
- 4.5.2. Market Size Absolute $ Opportunity Analysis and Forecast, By Based on Vertical, 2016-2032
- 4.5.3. Government
- 4.5.4. BFSI
- 4.5.5. Retail and eCommerce
- 4.5.6. IT and ITeS
- 4.5.7. Other Verticals
- 4.6. North America Secure Access Services Edge Marke Analysis, Opportunity and Forecast, By Based on Component, 2016-2032
- 4.6.1. North America Secure Access Services Edge Marke Analysis by Based on Component: Introduction
- 4.6.2. Market Size Absolute $ Opportunity Analysis and Forecast, By Based on Component, 2016-2032
- 4.6.3. Solution
- 4.6.4. Service
- 4.7. North America Secure Access Services Edge Marke Analysis, Opportunity and Forecast, By Country , 2016-2032
- 4.7.1. North America Secure Access Services Edge Marke Analysis by Country : Introduction
- 4.7.2. Market Size Absolute $ Opportunity Analysis and Forecast, Country , 2016-2032
- 4.7.2.1. The US
- 4.7.2.2. Canada
- 4.7.2.3. Mexico
- 5. Western Europe Secure Access Services Edge Marke Analysis, Opportunity and Forecast, 2016-2032
- 5.1. Western Europe Secure Access Services Edge Marke Analysis, 2016-2021
- 5.2. Western Europe Secure Access Services Edge Marke Opportunity and Forecast, 2023-2032
- 5.3. Western Europe Secure Access Services Edge Marke Analysis, Opportunity and Forecast, By Based On Offering , 2016-2032
- 5.3.1. Western Europe Secure Access Services Edge Marke Analysis by Based On Offering : Introduction
- 5.3.2. Market Size Absolute $ Opportunity Analysis and Forecast, By Based On Offering , 2016-2032
- 5.3.3. Network as a Service
- 5.3.4. Security as a Service
- 5.4. Western Europe Secure Access Services Edge Marke Analysis, Opportunity and Forecast, By Based on Organization Size, 2016-2032
- 5.4.1. Western Europe Secure Access Services Edge Marke Analysis by Based on Organization Size: Introduction
- 5.4.2. Market Size Absolute $ Opportunity Analysis and Forecast, By Based on Organization Size, 2016-2032
- 5.4.3. Large Enterprises
- 5.4.4. SMEs
- 5.5. Western Europe Secure Access Services Edge Marke Analysis, Opportunity and Forecast, By Based on Vertical, 2016-2032
- 5.5.1. Western Europe Secure Access Services Edge Marke Analysis by Based on Vertical: Introduction
- 5.5.2. Market Size Absolute $ Opportunity Analysis and Forecast, By Based on Vertical, 2016-2032
- 5.5.3. Government
- 5.5.4. BFSI
- 5.5.5. Retail and eCommerce
- 5.5.6. IT and ITeS
- 5.5.7. Other Verticals
- 5.6. Western Europe Secure Access Services Edge Marke Analysis, Opportunity and Forecast, By Based on Component, 2016-2032
- 5.6.1. Western Europe Secure Access Services Edge Marke Analysis by Based on Component: Introduction
- 5.6.2. Market Size Absolute $ Opportunity Analysis and Forecast, By Based on Component, 2016-2032
- 5.6.3. Solution
- 5.6.4. Service
- 5.7. Western Europe Secure Access Services Edge Marke Analysis, Opportunity and Forecast, By Country , 2016-2032
- 5.7.1. Western Europe Secure Access Services Edge Marke Analysis by Country : Introduction
- 5.7.2. Market Size Absolute $ Opportunity Analysis and Forecast, Country , 2016-2032
- 5.7.2.1. Germany
- 5.7.2.2. France
- 5.7.2.3. The UK
- 5.7.2.4. Spain
- 5.7.2.5. Italy
- 5.7.2.6. Portugal
- 5.7.2.7. Ireland
- 5.7.2.8. Austria
- 5.7.2.9. Switzerland
- 5.7.2.10. Benelux
- 5.7.2.11. Nordic
- 5.7.2.12. Rest of Western Europe
- 6. Eastern Europe Secure Access Services Edge Marke Analysis, Opportunity and Forecast, 2016-2032
- 6.1. Eastern Europe Secure Access Services Edge Marke Analysis, 2016-2021
- 6.2. Eastern Europe Secure Access Services Edge Marke Opportunity and Forecast, 2023-2032
- 6.3. Eastern Europe Secure Access Services Edge Marke Analysis, Opportunity and Forecast, By Based On Offering , 2016-2032
- 6.3.1. Eastern Europe Secure Access Services Edge Marke Analysis by Based On Offering : Introduction
- 6.3.2. Market Size Absolute $ Opportunity Analysis and Forecast, By Based On Offering , 2016-2032
- 6.3.3. Network as a Service
- 6.3.4. Security as a Service
- 6.4. Eastern Europe Secure Access Services Edge Marke Analysis, Opportunity and Forecast, By Based on Organization Size, 2016-2032
- 6.4.1. Eastern Europe Secure Access Services Edge Marke Analysis by Based on Organization Size: Introduction
- 6.4.2. Market Size Absolute $ Opportunity Analysis and Forecast, By Based on Organization Size, 2016-2032
- 6.4.3. Large Enterprises
- 6.4.4. SMEs
- 6.5. Eastern Europe Secure Access Services Edge Marke Analysis, Opportunity and Forecast, By Based on Vertical, 2016-2032
- 6.5.1. Eastern Europe Secure Access Services Edge Marke Analysis by Based on Vertical: Introduction
- 6.5.2. Market Size Absolute $ Opportunity Analysis and Forecast, By Based on Vertical, 2016-2032
- 6.5.3. Government
- 6.5.4. BFSI
- 6.5.5. Retail and eCommerce
- 6.5.6. IT and ITeS
- 6.5.7. Other Verticals
- 6.6. Eastern Europe Secure Access Services Edge Marke Analysis, Opportunity and Forecast, By Based on Component, 2016-2032
- 6.6.1. Eastern Europe Secure Access Services Edge Marke Analysis by Based on Component: Introduction
- 6.6.2. Market Size Absolute $ Opportunity Analysis and Forecast, By Based on Component, 2016-2032
- 6.6.3. Solution
- 6.6.4. Service
- 6.7. Eastern Europe Secure Access Services Edge Marke Analysis, Opportunity and Forecast, By Country , 2016-2032
- 6.7.1. Eastern Europe Secure Access Services Edge Marke Analysis by Country : Introduction
- 6.7.2. Market Size Absolute $ Opportunity Analysis and Forecast, Country , 2016-2032
- 6.7.2.1. Russia
- 6.7.2.2. Poland
- 6.7.2.3. The Czech Republic
- 6.7.2.4. Greece
- 6.7.2.5. Rest of Eastern Europe
- 7. APAC Secure Access Services Edge Marke Analysis, Opportunity and Forecast, 2016-2032
- 7.1. APAC Secure Access Services Edge Marke Analysis, 2016-2021
- 7.2. APAC Secure Access Services Edge Marke Opportunity and Forecast, 2023-2032
- 7.3. APAC Secure Access Services Edge Marke Analysis, Opportunity and Forecast, By Based On Offering , 2016-2032
- 7.3.1. APAC Secure Access Services Edge Marke Analysis by Based On Offering : Introduction
- 7.3.2. Market Size Absolute $ Opportunity Analysis and Forecast, By Based On Offering , 2016-2032
- 7.3.3. Network as a Service
- 7.3.4. Security as a Service
- 7.4. APAC Secure Access Services Edge Marke Analysis, Opportunity and Forecast, By Based on Organization Size, 2016-2032
- 7.4.1. APAC Secure Access Services Edge Marke Analysis by Based on Organization Size: Introduction
- 7.4.2. Market Size Absolute $ Opportunity Analysis and Forecast, By Based on Organization Size, 2016-2032
- 7.4.3. Large Enterprises
- 7.4.4. SMEs
- 7.5. APAC Secure Access Services Edge Marke Analysis, Opportunity and Forecast, By Based on Vertical, 2016-2032
- 7.5.1. APAC Secure Access Services Edge Marke Analysis by Based on Vertical: Introduction
- 7.5.2. Market Size Absolute $ Opportunity Analysis and Forecast, By Based on Vertical, 2016-2032
- 7.5.3. Government
- 7.5.4. BFSI
- 7.5.5. Retail and eCommerce
- 7.5.6. IT and ITeS
- 7.5.7. Other Verticals
- 7.6. APAC Secure Access Services Edge Marke Analysis, Opportunity and Forecast, By Based on Component, 2016-2032
- 7.6.1. APAC Secure Access Services Edge Marke Analysis by Based on Component: Introduction
- 7.6.2. Market Size Absolute $ Opportunity Analysis and Forecast, By Based on Component, 2016-2032
- 7.6.3. Solution
- 7.6.4. Service
- 7.7. APAC Secure Access Services Edge Marke Analysis, Opportunity and Forecast, By Country , 2016-2032
- 7.7.1. APAC Secure Access Services Edge Marke Analysis by Country : Introduction
- 7.7.2. Market Size Absolute $ Opportunity Analysis and Forecast, Country , 2016-2032
- 7.7.2.1. China
- 7.7.2.2. Japan
- 7.7.2.3. South Korea
- 7.7.2.4. India
- 7.7.2.5. Australia & New Zeland
- 7.7.2.6. Indonesia
- 7.7.2.7. Malaysia
- 7.7.2.8. Philippines
- 7.7.2.9. Singapore
- 7.7.2.10. Thailand
- 7.7.2.11. Vietnam
- 7.7.2.12. Rest of APAC
- 8. Latin America Secure Access Services Edge Marke Analysis, Opportunity and Forecast, 2016-2032
- 8.1. Latin America Secure Access Services Edge Marke Analysis, 2016-2021
- 8.2. Latin America Secure Access Services Edge Marke Opportunity and Forecast, 2023-2032
- 8.3. Latin America Secure Access Services Edge Marke Analysis, Opportunity and Forecast, By Based On Offering , 2016-2032
- 8.3.1. Latin America Secure Access Services Edge Marke Analysis by Based On Offering : Introduction
- 8.3.2. Market Size Absolute $ Opportunity Analysis and Forecast, By Based On Offering , 2016-2032
- 8.3.3. Network as a Service
- 8.3.4. Security as a Service
- 8.4. Latin America Secure Access Services Edge Marke Analysis, Opportunity and Forecast, By Based on Organization Size, 2016-2032
- 8.4.1. Latin America Secure Access Services Edge Marke Analysis by Based on Organization Size: Introduction
- 8.4.2. Market Size Absolute $ Opportunity Analysis and Forecast, By Based on Organization Size, 2016-2032
- 8.4.3. Large Enterprises
- 8.4.4. SMEs
- 8.5. Latin America Secure Access Services Edge Marke Analysis, Opportunity and Forecast, By Based on Vertical, 2016-2032
- 8.5.1. Latin America Secure Access Services Edge Marke Analysis by Based on Vertical: Introduction
- 8.5.2. Market Size Absolute $ Opportunity Analysis and Forecast, By Based on Vertical, 2016-2032
- 8.5.3. Government
- 8.5.4. BFSI
- 8.5.5. Retail and eCommerce
- 8.5.6. IT and ITeS
- 8.5.7. Other Verticals
- 8.6. Latin America Secure Access Services Edge Marke Analysis, Opportunity and Forecast, By Based on Component, 2016-2032
- 8.6.1. Latin America Secure Access Services Edge Marke Analysis by Based on Component: Introduction
- 8.6.2. Market Size Absolute $ Opportunity Analysis and Forecast, By Based on Component, 2016-2032
- 8.6.3. Solution
- 8.6.4. Service
- 8.7. Latin America Secure Access Services Edge Marke Analysis, Opportunity and Forecast, By Country , 2016-2032
- 8.7.1. Latin America Secure Access Services Edge Marke Analysis by Country : Introduction
- 8.7.2. Market Size Absolute $ Opportunity Analysis and Forecast, Country , 2016-2032
- 8.7.2.1. Brazil
- 8.7.2.2. Colombia
- 8.7.2.3. Chile
- 8.7.2.4. Argentina
- 8.7.2.5. Costa Rica
- 8.7.2.6. Rest of Latin America
- 9. Middle East & Africa Secure Access Services Edge Marke Analysis, Opportunity and Forecast, 2016-2032
- 9.1. Middle East & Africa Secure Access Services Edge Marke Analysis, 2016-2021
- 9.2. Middle East & Africa Secure Access Services Edge Marke Opportunity and Forecast, 2023-2032
- 9.3. Middle East & Africa Secure Access Services Edge Marke Analysis, Opportunity and Forecast, By Based On Offering , 2016-2032
- 9.3.1. Middle East & Africa Secure Access Services Edge Marke Analysis by Based On Offering : Introduction
- 9.3.2. Market Size Absolute $ Opportunity Analysis and Forecast, By Based On Offering , 2016-2032
- 9.3.3. Network as a Service
- 9.3.4. Security as a Service
- 9.4. Middle East & Africa Secure Access Services Edge Marke Analysis, Opportunity and Forecast, By Based on Organization Size, 2016-2032
- 9.4.1. Middle East & Africa Secure Access Services Edge Marke Analysis by Based on Organization Size: Introduction
- 9.4.2. Market Size Absolute $ Opportunity Analysis and Forecast, By Based on Organization Size, 2016-2032
- 9.4.3. Large Enterprises
- 9.4.4. SMEs
- 9.5. Middle East & Africa Secure Access Services Edge Marke Analysis, Opportunity and Forecast, By Based on Vertical, 2016-2032
- 9.5.1. Middle East & Africa Secure Access Services Edge Marke Analysis by Based on Vertical: Introduction
- 9.5.2. Market Size Absolute $ Opportunity Analysis and Forecast, By Based on Vertical, 2016-2032
- 9.5.3. Government
- 9.5.4. BFSI
- 9.5.5. Retail and eCommerce
- 9.5.6. IT and ITeS
- 9.5.7. Other Verticals
- 9.6. Middle East & Africa Secure Access Services Edge Marke Analysis, Opportunity and Forecast, By Based on Component, 2016-2032
- 9.6.1. Middle East & Africa Secure Access Services Edge Marke Analysis by Based on Component: Introduction
- 9.6.2. Market Size Absolute $ Opportunity Analysis and Forecast, By Based on Component, 2016-2032
- 9.6.3. Solution
- 9.6.4. Service
- 9.7. Middle East & Africa Secure Access Services Edge Marke Analysis, Opportunity and Forecast, By Country , 2016-2032
- 9.7.1. Middle East & Africa Secure Access Services Edge Marke Analysis by Country : Introduction
- 9.7.2. Market Size Absolute $ Opportunity Analysis and Forecast, Country , 2016-2032
- 9.7.2.1. Algeria
- 9.7.2.2. Egypt
- 9.7.2.3. Israel
- 9.7.2.4. Kuwait
- 9.7.2.5. Nigeria
- 9.7.2.6. Saudi Arabia
- 9.7.2.7. South Africa
- 9.7.2.8. Turkey
- 9.7.2.9. The UAE
- 9.7.2.10. Rest of MEA
- 10. Global Secure Access Services Edge Marke Analysis, Opportunity and Forecast, By Region , 2016-2032
- 10.1. Global Secure Access Services Edge Marke Analysis by Region : Introduction
- 10.2. Market Size Absolute $ Opportunity Analysis and Forecast, By Region , 2016-2032
- 10.2.1. North America
- 10.2.2. Western Europe
- 10.2.3. Eastern Europe
- 10.2.4. APAC
- 10.2.5. Latin America
- 10.2.6. Middle East & Africa
- 11. Global Secure Access Services Edge Marke Competitive Landscape, Market Share Analysis, and Company Profiles
- 11.1. Market Share Analysis
- 11.2. Company Profiles
- 11.3. Cisco Systems Inc
- 11.3.1. Company Overview
- 11.3.2. Financial Highlights
- 11.3.3. Product Portfolio
- 11.3.4. SWOT Analysis
- 11.3.5. Key Strategies and Developments
- 11.4. Cloudflare Inc
- 11.4.1. Company Overview
- 11.4.2. Financial Highlights
- 11.4.3. Product Portfolio
- 11.4.4. SWOT Analysis
- 11.4.5. Key Strategies and Developments
- 11.5. VMware Inc
- 11.5.1. Company Overview
- 11.5.2. Financial Highlights
- 11.5.3. Product Portfolio
- 11.5.4. SWOT Analysis
- 11.5.5. Key Strategies and Developments
- 11.6. Fortinet Inc
- 11.6.1. Company Overview
- 11.6.2. Financial Highlights
- 11.6.3. Product Portfolio
- 11.6.4. SWOT Analysis
- 11.6.5. Key Strategies and Developments
- 11.7. Palo Alto Networks Inc
- 11.7.1. Company Overview
- 11.7.2. Financial Highlights
- 11.7.3. Product Portfolio
- 11.7.4. SWOT Analysis
- 11.7.5. Key Strategies and Developments
- 11.8. Akamai Technologies Inc
- 11.8.1. Company Overview
- 11.8.2. Financial Highlights
- 11.8.3. Product Portfolio
- 11.8.4. SWOT Analysis
- 11.8.5. Key Strategies and Developments
- 11.9. Zscaler Inc
- 11.9.1. Company Overview
- 11.9.2. Financial Highlights
- 11.9.3. Product Portfolio
- 11.9.4. SWOT Analysis
- 11.9.5. Key Strategies and Developments
- 11.10. Cato Networks Ltd
- 11.10.1. Company Overview
- 11.10.2. Financial Highlights
- 11.10.3. Product Portfolio
- 11.10.4. SWOT Analysis
- 11.10.5. Key Strategies and Developments
- 11.11. Versa Networks Inc
- 11.11.1. Company Overview
- 11.11.2. Financial Highlights
- 11.11.3. Product Portfolio
- 11.11.4. SWOT Analysis
- 11.11.5. Key Strategies and Developments
- 11.12. Forcepoint
- 11.12.1. Company Overview
- 11.12.2. Financial Highlights
- 11.12.3. Product Portfolio
- 11.12.4. SWOT Analysis
- 11.12.5. Key Strategies and Developments
- 11.13.1. Company Overview
- 11.13.2. Financial Highlights
- 11.13.3. Product Portfolio
- 11.13.4. SWOT Analysis
- 11.13.5. Key Strategies and Developments
- 11.14. Broadcom Corporation
- 11.14.1. Company Overview
- 11.14.2. Financial Highlights
- 11.14.3. Product Portfolio
- 11.14.4. SWOT Analysis
- 11.14.5. Key Strategies and Developments
- 11.15. McAfee Corp
- 11.15.1. Company Overview
- 11.15.2. Financial Highlights
- 11.15.3. Product Portfolio
- 11.15.4. SWOT Analysis
- 11.15.5. Key Strategies and Developments
- 11.16. citrix systems inc.
- 11.16.1. Company Overview
- 11.16.2. Financial Highlights
- 11.16.3. Product Portfolio
- 11.16.4. SWOT Analysis
- 11.16.5. Key Strategies and Developments
- 11.17. juniper network
- 11.17.1. Company Overview
- 11.17.2. Financial Highlights
- 11.17.3. Product Portfolio
- 11.17.4. SWOT Analysis
- 11.17.5. Key Strategies and Developments
- 11.18. Aryaka Networks Inc
- 11.18.1. Company Overview
- 11.18.2. Financial Highlights
- 11.18.3. Product Portfolio
- 11.18.4. SWOT Analysis
- 11.18.5. Key Strategies and Developments
- 12. Assumptions and Acronyms
- 13. Research Methodology
- 14. Contact
- List of Figures
- Figure 1: Global Secure Access Services Edge Marke Revenue (US$ Mn) Market Share by Based On Offering in 2022
- Figure 2: Global Secure Access Services Edge Marke Market Attractiveness Analysis by Based On Offering , 2016-2032
- Figure 3: Global Secure Access Services Edge Marke Revenue (US$ Mn) Market Share by Based on Organization Sizein 2022
- Figure 4: Global Secure Access Services Edge Marke Market Attractiveness Analysis by Based on Organization Size, 2016-2032
- Figure 5: Global Secure Access Services Edge Marke Revenue (US$ Mn) Market Share by Based on Verticalin 2022
- Figure 6: Global Secure Access Services Edge Marke Market Attractiveness Analysis by Based on Vertical, 2016-2032
- Figure 7: Global Secure Access Services Edge Marke Revenue (US$ Mn) Market Share by Based on Componentin 2022
- Figure 8: Global Secure Access Services Edge Marke Market Attractiveness Analysis by Based on Component, 2016-2032
- Figure 9: Global Secure Access Services Edge Marke Revenue (US$ Mn) Market Share by Region in 2022
- Figure 10: Global Secure Access Services Edge Marke Market Attractiveness Analysis by Region, 2016-2032
- Figure 11: Global Secure Access Services Edge Marke Market Revenue (US$ Mn) (2016-2032)
- Figure 12: Global Secure Access Services Edge Marke Market Revenue (US$ Mn) Comparison by Region (2016-2032)
- Figure 13: Global Secure Access Services Edge Marke Market Revenue (US$ Mn) Comparison by Based On Offering (2016-2032)
- Figure 14: Global Secure Access Services Edge Marke Market Revenue (US$ Mn) Comparison by Based on Organization Size (2016-2032)
- Figure 15: Global Secure Access Services Edge Marke Market Revenue (US$ Mn) Comparison by Based on Vertical (2016-2032)
- Figure 16: Global Secure Access Services Edge Marke Market Revenue (US$ Mn) Comparison by Based on Component (2016-2032)
- Figure 17: Global Secure Access Services Edge Marke Market Y-o-Y Growth Rate Comparison by Region (2016-2032)
- Figure 18: Global Secure Access Services Edge Marke Market Y-o-Y Growth Rate Comparison by Based On Offering (2016-2032)
- Figure 19: Global Secure Access Services Edge Marke Market Y-o-Y Growth Rate Comparison by Based on Organization Size (2016-2032)
- Figure 20: Global Secure Access Services Edge Marke Market Y-o-Y Growth Rate Comparison by Based on Vertical (2016-2032)
- Figure 21: Global Secure Access Services Edge Marke Market Y-o-Y Growth Rate Comparison by Based on Component (2016-2032)
- Figure 22: Global Secure Access Services Edge Marke Market Share Comparison by Region (2016-2032)
- Figure 23: Global Secure Access Services Edge Marke Market Share Comparison by Based On Offering (2016-2032)
- Figure 24: Global Secure Access Services Edge Marke Market Share Comparison by Based on Organization Size (2016-2032)
- Figure 25: Global Secure Access Services Edge Marke Market Share Comparison by Based on Vertical (2016-2032)
- Figure 26: Global Secure Access Services Edge Marke Market Share Comparison by Based on Component (2016-2032)
- Figure 27: North America Secure Access Services Edge Marke Revenue (US$ Mn) Market Share by Based On Offering in 2022
- Figure 28: North America Secure Access Services Edge Marke Market Attractiveness Analysis by Based On Offering , 2016-2032
- Figure 29: North America Secure Access Services Edge Marke Revenue (US$ Mn) Market Share by Based on Organization Sizein 2022
- Figure 30: North America Secure Access Services Edge Marke Market Attractiveness Analysis by Based on Organization Size, 2016-2032
- Figure 31: North America Secure Access Services Edge Marke Revenue (US$ Mn) Market Share by Based on Verticalin 2022
- Figure 32: North America Secure Access Services Edge Marke Market Attractiveness Analysis by Based on Vertical, 2016-2032
- Figure 33: North America Secure Access Services Edge Marke Revenue (US$ Mn) Market Share by Based on Componentin 2022
- Figure 34: North America Secure Access Services Edge Marke Market Attractiveness Analysis by Based on Component, 2016-2032
- Figure 35: North America Secure Access Services Edge Marke Revenue (US$ Mn) Market Share by Country in 2022
- Figure 36: North America Secure Access Services Edge Marke Market Attractiveness Analysis by Country, 2016-2032
- Figure 37: North America Secure Access Services Edge Marke Market Revenue (US$ Mn) (2016-2032)
- Figure 38: North America Secure Access Services Edge Marke Market Revenue (US$ Mn) Comparison by Country (2016-2032)
- Figure 39: North America Secure Access Services Edge Marke Market Revenue (US$ Mn) Comparison by Based On Offering (2016-2032)
- Figure 40: North America Secure Access Services Edge Marke Market Revenue (US$ Mn) Comparison by Based on Organization Size (2016-2032)
- Figure 41: North America Secure Access Services Edge Marke Market Revenue (US$ Mn) Comparison by Based on Vertical (2016-2032)
- Figure 42: North America Secure Access Services Edge Marke Market Revenue (US$ Mn) Comparison by Based on Component (2016-2032)
- Figure 43: North America Secure Access Services Edge Marke Market Y-o-Y Growth Rate Comparison by Country (2016-2032)
- Figure 44: North America Secure Access Services Edge Marke Market Y-o-Y Growth Rate Comparison by Based On Offering (2016-2032)
- Figure 45: North America Secure Access Services Edge Marke Market Y-o-Y Growth Rate Comparison by Based on Organization Size (2016-2032)
- Figure 46: North America Secure Access Services Edge Marke Market Y-o-Y Growth Rate Comparison by Based on Vertical (2016-2032)
- Figure 47: North America Secure Access Services Edge Marke Market Y-o-Y Growth Rate Comparison by Based on Component (2016-2032)
- Figure 48: North America Secure Access Services Edge Marke Market Share Comparison by Country (2016-2032)
- Figure 49: North America Secure Access Services Edge Marke Market Share Comparison by Based On Offering (2016-2032)
- Figure 50: North America Secure Access Services Edge Marke Market Share Comparison by Based on Organization Size (2016-2032)
- Figure 51: North America Secure Access Services Edge Marke Market Share Comparison by Based on Vertical (2016-2032)
- Figure 52: North America Secure Access Services Edge Marke Market Share Comparison by Based on Component (2016-2032)
- Figure 53: Western Europe Secure Access Services Edge Marke Revenue (US$ Mn) Market Share by Based On Offering in 2022
- Figure 54: Western Europe Secure Access Services Edge Marke Market Attractiveness Analysis by Based On Offering , 2016-2032
- Figure 55: Western Europe Secure Access Services Edge Marke Revenue (US$ Mn) Market Share by Based on Organization Sizein 2022
- Figure 56: Western Europe Secure Access Services Edge Marke Market Attractiveness Analysis by Based on Organization Size, 2016-2032
- Figure 57: Western Europe Secure Access Services Edge Marke Revenue (US$ Mn) Market Share by Based on Verticalin 2022
- Figure 58: Western Europe Secure Access Services Edge Marke Market Attractiveness Analysis by Based on Vertical, 2016-2032
- Figure 59: Western Europe Secure Access Services Edge Marke Revenue (US$ Mn) Market Share by Based on Componentin 2022
- Figure 60: Western Europe Secure Access Services Edge Marke Market Attractiveness Analysis by Based on Component, 2016-2032
- Figure 61: Western Europe Secure Access Services Edge Marke Revenue (US$ Mn) Market Share by Country in 2022
- Figure 62: Western Europe Secure Access Services Edge Marke Market Attractiveness Analysis by Country, 2016-2032
- Figure 63: Western Europe Secure Access Services Edge Marke Market Revenue (US$ Mn) (2016-2032)
- Figure 64: Western Europe Secure Access Services Edge Marke Market Revenue (US$ Mn) Comparison by Country (2016-2032)
- Figure 65: Western Europe Secure Access Services Edge Marke Market Revenue (US$ Mn) Comparison by Based On Offering (2016-2032)
- Figure 66: Western Europe Secure Access Services Edge Marke Market Revenue (US$ Mn) Comparison by Based on Organization Size (2016-2032)
- Figure 67: Western Europe Secure Access Services Edge Marke Market Revenue (US$ Mn) Comparison by Based on Vertical (2016-2032)
- Figure 68: Western Europe Secure Access Services Edge Marke Market Revenue (US$ Mn) Comparison by Based on Component (2016-2032)
- Figure 69: Western Europe Secure Access Services Edge Marke Market Y-o-Y Growth Rate Comparison by Country (2016-2032)
- Figure 70: Western Europe Secure Access Services Edge Marke Market Y-o-Y Growth Rate Comparison by Based On Offering (2016-2032)
- Figure 71: Western Europe Secure Access Services Edge Marke Market Y-o-Y Growth Rate Comparison by Based on Organization Size (2016-2032)
- Figure 72: Western Europe Secure Access Services Edge Marke Market Y-o-Y Growth Rate Comparison by Based on Vertical (2016-2032)
- Figure 73: Western Europe Secure Access Services Edge Marke Market Y-o-Y Growth Rate Comparison by Based on Component (2016-2032)
- Figure 74: Western Europe Secure Access Services Edge Marke Market Share Comparison by Country (2016-2032)
- Figure 75: Western Europe Secure Access Services Edge Marke Market Share Comparison by Based On Offering (2016-2032)
- Figure 76: Western Europe Secure Access Services Edge Marke Market Share Comparison by Based on Organization Size (2016-2032)
- Figure 77: Western Europe Secure Access Services Edge Marke Market Share Comparison by Based on Vertical (2016-2032)
- Figure 78: Western Europe Secure Access Services Edge Marke Market Share Comparison by Based on Component (2016-2032)
- Figure 79: Eastern Europe Secure Access Services Edge Marke Revenue (US$ Mn) Market Share by Based On Offering in 2022
- Figure 80: Eastern Europe Secure Access Services Edge Marke Market Attractiveness Analysis by Based On Offering , 2016-2032
- Figure 81: Eastern Europe Secure Access Services Edge Marke Revenue (US$ Mn) Market Share by Based on Organization Sizein 2022
- Figure 82: Eastern Europe Secure Access Services Edge Marke Market Attractiveness Analysis by Based on Organization Size, 2016-2032
- Figure 83: Eastern Europe Secure Access Services Edge Marke Revenue (US$ Mn) Market Share by Based on Verticalin 2022
- Figure 84: Eastern Europe Secure Access Services Edge Marke Market Attractiveness Analysis by Based on Vertical, 2016-2032
- Figure 85: Eastern Europe Secure Access Services Edge Marke Revenue (US$ Mn) Market Share by Based on Componentin 2022
- Figure 86: Eastern Europe Secure Access Services Edge Marke Market Attractiveness Analysis by Based on Component, 2016-2032
- Figure 87: Eastern Europe Secure Access Services Edge Marke Revenue (US$ Mn) Market Share by Country in 2022
- Figure 88: Eastern Europe Secure Access Services Edge Marke Market Attractiveness Analysis by Country, 2016-2032
- Figure 89: Eastern Europe Secure Access Services Edge Marke Market Revenue (US$ Mn) (2016-2032)
- Figure 90: Eastern Europe Secure Access Services Edge Marke Market Revenue (US$ Mn) Comparison by Country (2016-2032)
- Figure 91: Eastern Europe Secure Access Services Edge Marke Market Revenue (US$ Mn) Comparison by Based On Offering (2016-2032)
- Figure 92: Eastern Europe Secure Access Services Edge Marke Market Revenue (US$ Mn) Comparison by Based on Organization Size (2016-2032)
- Figure 93: Eastern Europe Secure Access Services Edge Marke Market Revenue (US$ Mn) Comparison by Based on Vertical (2016-2032)
- Figure 94: Eastern Europe Secure Access Services Edge Marke Market Revenue (US$ Mn) Comparison by Based on Component (2016-2032)
- Figure 95: Eastern Europe Secure Access Services Edge Marke Market Y-o-Y Growth Rate Comparison by Country (2016-2032)
- Figure 96: Eastern Europe Secure Access Services Edge Marke Market Y-o-Y Growth Rate Comparison by Based On Offering (2016-2032)
- Figure 97: Eastern Europe Secure Access Services Edge Marke Market Y-o-Y Growth Rate Comparison by Based on Organization Size (2016-2032)
- Figure 98: Eastern Europe Secure Access Services Edge Marke Market Y-o-Y Growth Rate Comparison by Based on Vertical (2016-2032)
- Figure 99: Eastern Europe Secure Access Services Edge Marke Market Y-o-Y Growth Rate Comparison by Based on Component (2016-2032)
- Figure 100: Eastern Europe Secure Access Services Edge Marke Market Share Comparison by Country (2016-2032)
- Figure 101: Eastern Europe Secure Access Services Edge Marke Market Share Comparison by Based On Offering (2016-2032)
- Figure 102: Eastern Europe Secure Access Services Edge Marke Market Share Comparison by Based on Organization Size (2016-2032)
- Figure 103: Eastern Europe Secure Access Services Edge Marke Market Share Comparison by Based on Vertical (2016-2032)
- Figure 104: Eastern Europe Secure Access Services Edge Marke Market Share Comparison by Based on Component (2016-2032)
- Figure 105: APAC Secure Access Services Edge Marke Revenue (US$ Mn) Market Share by Based On Offering in 2022
- Figure 106: APAC Secure Access Services Edge Marke Market Attractiveness Analysis by Based On Offering , 2016-2032
- Figure 107: APAC Secure Access Services Edge Marke Revenue (US$ Mn) Market Share by Based on Organization Sizein 2022
- Figure 108: APAC Secure Access Services Edge Marke Market Attractiveness Analysis by Based on Organization Size, 2016-2032
- Figure 109: APAC Secure Access Services Edge Marke Revenue (US$ Mn) Market Share by Based on Verticalin 2022
- Figure 110: APAC Secure Access Services Edge Marke Market Attractiveness Analysis by Based on Vertical, 2016-2032
- Figure 111: APAC Secure Access Services Edge Marke Revenue (US$ Mn) Market Share by Based on Componentin 2022
- Figure 112: APAC Secure Access Services Edge Marke Market Attractiveness Analysis by Based on Component, 2016-2032
- Figure 113: APAC Secure Access Services Edge Marke Revenue (US$ Mn) Market Share by Country in 2022
- Figure 114: APAC Secure Access Services Edge Marke Market Attractiveness Analysis by Country, 2016-2032
- Figure 115: APAC Secure Access Services Edge Marke Market Revenue (US$ Mn) (2016-2032)
- Figure 116: APAC Secure Access Services Edge Marke Market Revenue (US$ Mn) Comparison by Country (2016-2032)
- Figure 117: APAC Secure Access Services Edge Marke Market Revenue (US$ Mn) Comparison by Based On Offering (2016-2032)
- Figure 118: APAC Secure Access Services Edge Marke Market Revenue (US$ Mn) Comparison by Based on Organization Size (2016-2032)
- Figure 119: APAC Secure Access Services Edge Marke Market Revenue (US$ Mn) Comparison by Based on Vertical (2016-2032)
- Figure 120: APAC Secure Access Services Edge Marke Market Revenue (US$ Mn) Comparison by Based on Component (2016-2032)
- Figure 121: APAC Secure Access Services Edge Marke Market Y-o-Y Growth Rate Comparison by Country (2016-2032)
- Figure 122: APAC Secure Access Services Edge Marke Market Y-o-Y Growth Rate Comparison by Based On Offering (2016-2032)
- Figure 123: APAC Secure Access Services Edge Marke Market Y-o-Y Growth Rate Comparison by Based on Organization Size (2016-2032)
- Figure 124: APAC Secure Access Services Edge Marke Market Y-o-Y Growth Rate Comparison by Based on Vertical (2016-2032)
- Figure 125: APAC Secure Access Services Edge Marke Market Y-o-Y Growth Rate Comparison by Based on Component (2016-2032)
- Figure 126: APAC Secure Access Services Edge Marke Market Share Comparison by Country (2016-2032)
- Figure 127: APAC Secure Access Services Edge Marke Market Share Comparison by Based On Offering (2016-2032)
- Figure 128: APAC Secure Access Services Edge Marke Market Share Comparison by Based on Organization Size (2016-2032)
- Figure 129: APAC Secure Access Services Edge Marke Market Share Comparison by Based on Vertical (2016-2032)
- Figure 130: APAC Secure Access Services Edge Marke Market Share Comparison by Based on Component (2016-2032)
- Figure 131: Latin America Secure Access Services Edge Marke Revenue (US$ Mn) Market Share by Based On Offering in 2022
- Figure 132: Latin America Secure Access Services Edge Marke Market Attractiveness Analysis by Based On Offering , 2016-2032
- Figure 133: Latin America Secure Access Services Edge Marke Revenue (US$ Mn) Market Share by Based on Organization Sizein 2022
- Figure 134: Latin America Secure Access Services Edge Marke Market Attractiveness Analysis by Based on Organization Size, 2016-2032
- Figure 135: Latin America Secure Access Services Edge Marke Revenue (US$ Mn) Market Share by Based on Verticalin 2022
- Figure 136: Latin America Secure Access Services Edge Marke Market Attractiveness Analysis by Based on Vertical, 2016-2032
- Figure 137: Latin America Secure Access Services Edge Marke Revenue (US$ Mn) Market Share by Based on Componentin 2022
- Figure 138: Latin America Secure Access Services Edge Marke Market Attractiveness Analysis by Based on Component, 2016-2032
- Figure 139: Latin America Secure Access Services Edge Marke Revenue (US$ Mn) Market Share by Country in 2022
- Figure 140: Latin America Secure Access Services Edge Marke Market Attractiveness Analysis by Country, 2016-2032
- Figure 141: Latin America Secure Access Services Edge Marke Market Revenue (US$ Mn) (2016-2032)
- Figure 142: Latin America Secure Access Services Edge Marke Market Revenue (US$ Mn) Comparison by Country (2016-2032)
- Figure 143: Latin America Secure Access Services Edge Marke Market Revenue (US$ Mn) Comparison by Based On Offering (2016-2032)
- Figure 144: Latin America Secure Access Services Edge Marke Market Revenue (US$ Mn) Comparison by Based on Organization Size (2016-2032)
- Figure 145: Latin America Secure Access Services Edge Marke Market Revenue (US$ Mn) Comparison by Based on Vertical (2016-2032)
- Figure 146: Latin America Secure Access Services Edge Marke Market Revenue (US$ Mn) Comparison by Based on Component (2016-2032)
- Figure 147: Latin America Secure Access Services Edge Marke Market Y-o-Y Growth Rate Comparison by Country (2016-2032)
- Figure 148: Latin America Secure Access Services Edge Marke Market Y-o-Y Growth Rate Comparison by Based On Offering (2016-2032)
- Figure 149: Latin America Secure Access Services Edge Marke Market Y-o-Y Growth Rate Comparison by Based on Organization Size (2016-2032)
- Figure 150: Latin America Secure Access Services Edge Marke Market Y-o-Y Growth Rate Comparison by Based on Vertical (2016-2032)
- Figure 151: Latin America Secure Access Services Edge Marke Market Y-o-Y Growth Rate Comparison by Based on Component (2016-2032)
- Figure 152: Latin America Secure Access Services Edge Marke Market Share Comparison by Country (2016-2032)
- Figure 153: Latin America Secure Access Services Edge Marke Market Share Comparison by Based On Offering (2016-2032)
- Figure 154: Latin America Secure Access Services Edge Marke Market Share Comparison by Based on Organization Size (2016-2032)
- Figure 155: Latin America Secure Access Services Edge Marke Market Share Comparison by Based on Vertical (2016-2032)
- Figure 156: Latin America Secure Access Services Edge Marke Market Share Comparison by Based on Component (2016-2032)
- Figure 157: Middle East & Africa Secure Access Services Edge Marke Revenue (US$ Mn) Market Share by Based On Offering in 2022
- Figure 158: Middle East & Africa Secure Access Services Edge Marke Market Attractiveness Analysis by Based On Offering , 2016-2032
- Figure 159: Middle East & Africa Secure Access Services Edge Marke Revenue (US$ Mn) Market Share by Based on Organization Sizein 2022
- Figure 160: Middle East & Africa Secure Access Services Edge Marke Market Attractiveness Analysis by Based on Organization Size, 2016-2032
- Figure 161: Middle East & Africa Secure Access Services Edge Marke Revenue (US$ Mn) Market Share by Based on Verticalin 2022
- Figure 162: Middle East & Africa Secure Access Services Edge Marke Market Attractiveness Analysis by Based on Vertical, 2016-2032
- Figure 163: Middle East & Africa Secure Access Services Edge Marke Revenue (US$ Mn) Market Share by Based on Componentin 2022
- Figure 164: Middle East & Africa Secure Access Services Edge Marke Market Attractiveness Analysis by Based on Component, 2016-2032
- Figure 165: Middle East & Africa Secure Access Services Edge Marke Revenue (US$ Mn) Market Share by Country in 2022
- Figure 166: Middle East & Africa Secure Access Services Edge Marke Market Attractiveness Analysis by Country, 2016-2032
- Figure 167: Middle East & Africa Secure Access Services Edge Marke Market Revenue (US$ Mn) (2016-2032)
- Figure 168: Middle East & Africa Secure Access Services Edge Marke Market Revenue (US$ Mn) Comparison by Country (2016-2032)
- Figure 169: Middle East & Africa Secure Access Services Edge Marke Market Revenue (US$ Mn) Comparison by Based On Offering (2016-2032)
- Figure 170: Middle East & Africa Secure Access Services Edge Marke Market Revenue (US$ Mn) Comparison by Based on Organization Size (2016-2032)
- Figure 171: Middle East & Africa Secure Access Services Edge Marke Market Revenue (US$ Mn) Comparison by Based on Vertical (2016-2032)
- Figure 172: Middle East & Africa Secure Access Services Edge Marke Market Revenue (US$ Mn) Comparison by Based on Component (2016-2032)
- Figure 173: Middle East & Africa Secure Access Services Edge Marke Market Y-o-Y Growth Rate Comparison by Country (2016-2032)
- Figure 174: Middle East & Africa Secure Access Services Edge Marke Market Y-o-Y Growth Rate Comparison by Based On Offering (2016-2032)
- Figure 175: Middle East & Africa Secure Access Services Edge Marke Market Y-o-Y Growth Rate Comparison by Based on Organization Size (2016-2032)
- Figure 176: Middle East & Africa Secure Access Services Edge Marke Market Y-o-Y Growth Rate Comparison by Based on Vertical (2016-2032)
- Figure 177: Middle East & Africa Secure Access Services Edge Marke Market Y-o-Y Growth Rate Comparison by Based on Component (2016-2032)
- Figure 178: Middle East & Africa Secure Access Services Edge Marke Market Share Comparison by Country (2016-2032)
- Figure 179: Middle East & Africa Secure Access Services Edge Marke Market Share Comparison by Based On Offering (2016-2032)
- Figure 180: Middle East & Africa Secure Access Services Edge Marke Market Share Comparison by Based on Organization Size (2016-2032)
- Figure 181: Middle East & Africa Secure Access Services Edge Marke Market Share Comparison by Based on Vertical (2016-2032)
- Figure 182: Middle East & Africa Secure Access Services Edge Marke Market Share Comparison by Based on Component (2016-2032)
List of Tables
- Table 1: Global Secure Access Services Edge Marke Market Comparison by Based On Offering (2016-2032)
- Table 2: Global Secure Access Services Edge Marke Market Comparison by Based on Organization Size (2016-2032)
- Table 3: Global Secure Access Services Edge Marke Market Comparison by Based on Vertical (2016-2032)
- Table 4: Global Secure Access Services Edge Marke Market Comparison by Based on Component (2016-2032)
- Table 5: Global Secure Access Services Edge Marke Revenue (US$ Mn) Comparison by Region (2016-2032)
- Table 6: Global Secure Access Services Edge Marke Market Revenue (US$ Mn) (2016-2032)
- Table 7: Global Secure Access Services Edge Marke Market Revenue (US$ Mn) Comparison by Region (2016-2032)
- Table 8: Global Secure Access Services Edge Marke Market Revenue (US$ Mn) Comparison by Based On Offering (2016-2032)
- Table 9: Global Secure Access Services Edge Marke Market Revenue (US$ Mn) Comparison by Based on Organization Size (2016-2032)
- Table 10: Global Secure Access Services Edge Marke Market Revenue (US$ Mn) Comparison by Based on Vertical (2016-2032)
- Table 11: Global Secure Access Services Edge Marke Market Revenue (US$ Mn) Comparison by Based on Component (2016-2032)
- Table 12: Global Secure Access Services Edge Marke Market Y-o-Y Growth Rate Comparison by Region (2016-2032)
- Table 13: Global Secure Access Services Edge Marke Market Y-o-Y Growth Rate Comparison by Based On Offering (2016-2032)
- Table 14: Global Secure Access Services Edge Marke Market Y-o-Y Growth Rate Comparison by Based on Organization Size (2016-2032)
- Table 15: Global Secure Access Services Edge Marke Market Y-o-Y Growth Rate Comparison by Based on Vertical (2016-2032)
- Table 16: Global Secure Access Services Edge Marke Market Y-o-Y Growth Rate Comparison by Based on Component (2016-2032)
- Table 17: Global Secure Access Services Edge Marke Market Share Comparison by Region (2016-2032)
- Table 18: Global Secure Access Services Edge Marke Market Share Comparison by Based On Offering (2016-2032)
- Table 19: Global Secure Access Services Edge Marke Market Share Comparison by Based on Organization Size (2016-2032)
- Table 20: Global Secure Access Services Edge Marke Market Share Comparison by Based on Vertical (2016-2032)
- Table 21: Global Secure Access Services Edge Marke Market Share Comparison by Based on Component (2016-2032)
- Table 22: North America Secure Access Services Edge Marke Market Comparison by Based on Organization Size (2016-2032)
- Table 23: North America Secure Access Services Edge Marke Market Comparison by Based on Vertical (2016-2032)
- Table 24: North America Secure Access Services Edge Marke Market Comparison by Based on Component (2016-2032)
- Table 25: North America Secure Access Services Edge Marke Revenue (US$ Mn) Comparison by Country (2016-2032)
- Table 26: North America Secure Access Services Edge Marke Market Revenue (US$ Mn) (2016-2032)
- Table 27: North America Secure Access Services Edge Marke Market Revenue (US$ Mn) Comparison by Country (2016-2032)
- Table 28: North America Secure Access Services Edge Marke Market Revenue (US$ Mn) Comparison by Based On Offering (2016-2032)
- Table 29: North America Secure Access Services Edge Marke Market Revenue (US$ Mn) Comparison by Based on Organization Size (2016-2032)
- Table 30: North America Secure Access Services Edge Marke Market Revenue (US$ Mn) Comparison by Based on Vertical (2016-2032)
- Table 31: North America Secure Access Services Edge Marke Market Revenue (US$ Mn) Comparison by Based on Component (2016-2032)
- Table 32: North America Secure Access Services Edge Marke Market Y-o-Y Growth Rate Comparison by Country (2016-2032)
- Table 33: North America Secure Access Services Edge Marke Market Y-o-Y Growth Rate Comparison by Based On Offering (2016-2032)
- Table 34: North America Secure Access Services Edge Marke Market Y-o-Y Growth Rate Comparison by Based on Organization Size (2016-2032)
- Table 35: North America Secure Access Services Edge Marke Market Y-o-Y Growth Rate Comparison by Based on Vertical (2016-2032)
- Table 36: North America Secure Access Services Edge Marke Market Y-o-Y Growth Rate Comparison by Based on Component (2016-2032)
- Table 37: North America Secure Access Services Edge Marke Market Share Comparison by Country (2016-2032)
- Table 38: North America Secure Access Services Edge Marke Market Share Comparison by Based On Offering (2016-2032)
- Table 39: North America Secure Access Services Edge Marke Market Share Comparison by Based on Organization Size (2016-2032)
- Table 40: North America Secure Access Services Edge Marke Market Share Comparison by Based on Vertical (2016-2032)
- Table 41: North America Secure Access Services Edge Marke Market Share Comparison by Based on Component (2016-2032)
- Table 42: Western Europe Secure Access Services Edge Marke Market Comparison by Based On Offering (2016-2032)
- Table 43: Western Europe Secure Access Services Edge Marke Market Comparison by Based on Organization Size (2016-2032)
- Table 44: Western Europe Secure Access Services Edge Marke Market Comparison by Based on Vertical (2016-2032)
- Table 45: Western Europe Secure Access Services Edge Marke Market Comparison by Based on Component (2016-2032)
- Table 46: Western Europe Secure Access Services Edge Marke Revenue (US$ Mn) Comparison by Country (2016-2032)
- Table 47: Western Europe Secure Access Services Edge Marke Market Revenue (US$ Mn) (2016-2032)
- Table 48: Western Europe Secure Access Services Edge Marke Market Revenue (US$ Mn) Comparison by Country (2016-2032)
- Table 49: Western Europe Secure Access Services Edge Marke Market Revenue (US$ Mn) Comparison by Based On Offering (2016-2032)
- Table 50: Western Europe Secure Access Services Edge Marke Market Revenue (US$ Mn) Comparison by Based on Organization Size (2016-2032)
- Table 51: Western Europe Secure Access Services Edge Marke Market Revenue (US$ Mn) Comparison by Based on Vertical (2016-2032)
- Table 52: Western Europe Secure Access Services Edge Marke Market Revenue (US$ Mn) Comparison by Based on Component (2016-2032)
- Table 53: Western Europe Secure Access Services Edge Marke Market Y-o-Y Growth Rate Comparison by Country (2016-2032)
- Table 54: Western Europe Secure Access Services Edge Marke Market Y-o-Y Growth Rate Comparison by Based On Offering (2016-2032)
- Table 55: Western Europe Secure Access Services Edge Marke Market Y-o-Y Growth Rate Comparison by Based on Organization Size (2016-2032)
- Table 56: Western Europe Secure Access Services Edge Marke Market Y-o-Y Growth Rate Comparison by Based on Vertical (2016-2032)
- Table 57: Western Europe Secure Access Services Edge Marke Market Y-o-Y Growth Rate Comparison by Based on Component (2016-2032)
- Table 58: Western Europe Secure Access Services Edge Marke Market Share Comparison by Country (2016-2032)
- Table 59: Western Europe Secure Access Services Edge Marke Market Share Comparison by Based On Offering (2016-2032)
- Table 60: Western Europe Secure Access Services Edge Marke Market Share Comparison by Based on Organization Size (2016-2032)
- Table 61: Western Europe Secure Access Services Edge Marke Market Share Comparison by Based on Vertical (2016-2032)
- Table 62: Western Europe Secure Access Services Edge Marke Market Share Comparison by Based on Component (2016-2032)
- Table 63: Eastern Europe Secure Access Services Edge Marke Market Comparison by Based On Offering (2016-2032)
- Table 64: Eastern Europe Secure Access Services Edge Marke Market Comparison by Based on Organization Size (2016-2032)
- Table 65: Eastern Europe Secure Access Services Edge Marke Market Comparison by Based on Vertical (2016-2032)
- Table 66: Eastern Europe Secure Access Services Edge Marke Market Comparison by Based on Component (2016-2032)
- Table 67: Eastern Europe Secure Access Services Edge Marke Revenue (US$ Mn) Comparison by Country (2016-2032)
- Table 68: Eastern Europe Secure Access Services Edge Marke Market Revenue (US$ Mn) (2016-2032)
- Table 69: Eastern Europe Secure Access Services Edge Marke Market Revenue (US$ Mn) Comparison by Country (2016-2032)
- Table 70: Eastern Europe Secure Access Services Edge Marke Market Revenue (US$ Mn) Comparison by Based On Offering (2016-2032)
- Table 71: Eastern Europe Secure Access Services Edge Marke Market Revenue (US$ Mn) Comparison by Based on Organization Size (2016-2032)
- Table 72: Eastern Europe Secure Access Services Edge Marke Market Revenue (US$ Mn) Comparison by Based on Vertical (2016-2032)
- Table 73: Eastern Europe Secure Access Services Edge Marke Market Revenue (US$ Mn) Comparison by Based on Component (2016-2032)
- Table 74: Eastern Europe Secure Access Services Edge Marke Market Y-o-Y Growth Rate Comparison by Country (2016-2032)
- Table 75: Eastern Europe Secure Access Services Edge Marke Market Y-o-Y Growth Rate Comparison by Based On Offering (2016-2032)
- Table 76: Eastern Europe Secure Access Services Edge Marke Market Y-o-Y Growth Rate Comparison by Based on Organization Size (2016-2032)
- Table 77: Eastern Europe Secure Access Services Edge Marke Market Y-o-Y Growth Rate Comparison by Based on Vertical (2016-2032)
- Table 78: Eastern Europe Secure Access Services Edge Marke Market Y-o-Y Growth Rate Comparison by Based on Component (2016-2032)
- Table 79: Eastern Europe Secure Access Services Edge Marke Market Share Comparison by Country (2016-2032)
- Table 80: Eastern Europe Secure Access Services Edge Marke Market Share Comparison by Based On Offering (2016-2032)
- Table 81: Eastern Europe Secure Access Services Edge Marke Market Share Comparison by Based on Organization Size (2016-2032)
- Table 82: Eastern Europe Secure Access Services Edge Marke Market Share Comparison by Based on Vertical (2016-2032)
- Table 83: Eastern Europe Secure Access Services Edge Marke Market Share Comparison by Based on Component (2016-2032)
- Table 84: APAC Secure Access Services Edge Marke Market Comparison by Based On Offering (2016-2032)
- Table 85: APAC Secure Access Services Edge Marke Market Comparison by Based on Organization Size (2016-2032)
- Table 86: APAC Secure Access Services Edge Marke Market Comparison by Based on Vertical (2016-2032)
- Table 87: APAC Secure Access Services Edge Marke Market Comparison by Based on Component (2016-2032)
- Table 88: APAC Secure Access Services Edge Marke Revenue (US$ Mn) Comparison by Country (2016-2032)
- Table 89: APAC Secure Access Services Edge Marke Market Revenue (US$ Mn) (2016-2032)
- Table 90: APAC Secure Access Services Edge Marke Market Revenue (US$ Mn) Comparison by Country (2016-2032)
- Table 91: APAC Secure Access Services Edge Marke Market Revenue (US$ Mn) Comparison by Based On Offering (2016-2032)
- Table 92: APAC Secure Access Services Edge Marke Market Revenue (US$ Mn) Comparison by Based on Organization Size (2016-2032)
- Table 93: APAC Secure Access Services Edge Marke Market Revenue (US$ Mn) Comparison by Based on Vertical (2016-2032)
- Table 94: APAC Secure Access Services Edge Marke Market Revenue (US$ Mn) Comparison by Based on Component (2016-2032)
- Table 95: APAC Secure Access Services Edge Marke Market Y-o-Y Growth Rate Comparison by Country (2016-2032)
- Table 96: APAC Secure Access Services Edge Marke Market Y-o-Y Growth Rate Comparison by Based On Offering (2016-2032)
- Table 97: APAC Secure Access Services Edge Marke Market Y-o-Y Growth Rate Comparison by Based on Organization Size (2016-2032)
- Table 98: APAC Secure Access Services Edge Marke Market Y-o-Y Growth Rate Comparison by Based on Vertical (2016-2032)
- Table 99: APAC Secure Access Services Edge Marke Market Y-o-Y Growth Rate Comparison by Based on Component (2016-2032)
- Table 100: APAC Secure Access Services Edge Marke Market Share Comparison by Country (2016-2032)
- Table 101: APAC Secure Access Services Edge Marke Market Share Comparison by Based On Offering (2016-2032)
- Table 102: APAC Secure Access Services Edge Marke Market Share Comparison by Based on Organization Size (2016-2032)
- Table 103: APAC Secure Access Services Edge Marke Market Share Comparison by Based on Vertical (2016-2032)
- Table 104: APAC Secure Access Services Edge Marke Market Share Comparison by Based on Component (2016-2032)
- Table 105: Latin America Secure Access Services Edge Marke Market Comparison by Based On Offering (2016-2032)
- Table 106: Latin America Secure Access Services Edge Marke Market Comparison by Based on Organization Size (2016-2032)
- Table 107: Latin America Secure Access Services Edge Marke Market Comparison by Based on Vertical (2016-2032)
- Table 108: Latin America Secure Access Services Edge Marke Market Comparison by Based on Component (2016-2032)
- Table 109: Latin America Secure Access Services Edge Marke Revenue (US$ Mn) Comparison by Country (2016-2032)
- Table 110: Latin America Secure Access Services Edge Marke Market Revenue (US$ Mn) (2016-2032)
- Table 111: Latin America Secure Access Services Edge Marke Market Revenue (US$ Mn) Comparison by Country (2016-2032)
- Table 112: Latin America Secure Access Services Edge Marke Market Revenue (US$ Mn) Comparison by Based On Offering (2016-2032)
- Table 113: Latin America Secure Access Services Edge Marke Market Revenue (US$ Mn) Comparison by Based on Organization Size (2016-2032)
- Table 114: Latin America Secure Access Services Edge Marke Market Revenue (US$ Mn) Comparison by Based on Vertical (2016-2032)
- Table 115: Latin America Secure Access Services Edge Marke Market Revenue (US$ Mn) Comparison by Based on Component (2016-2032)
- Table 116: Latin America Secure Access Services Edge Marke Market Y-o-Y Growth Rate Comparison by Country (2016-2032)
- Table 117: Latin America Secure Access Services Edge Marke Market Y-o-Y Growth Rate Comparison by Based On Offering (2016-2032)
- Table 118: Latin America Secure Access Services Edge Marke Market Y-o-Y Growth Rate Comparison by Based on Organization Size (2016-2032)
- Table 119: Latin America Secure Access Services Edge Marke Market Y-o-Y Growth Rate Comparison by Based on Vertical (2016-2032)
- Table 120: Latin America Secure Access Services Edge Marke Market Y-o-Y Growth Rate Comparison by Based on Component (2016-2032)
- Table 121: Latin America Secure Access Services Edge Marke Market Share Comparison by Country (2016-2032)
- Table 122: Latin America Secure Access Services Edge Marke Market Share Comparison by Based On Offering (2016-2032)
- Table 123: Latin America Secure Access Services Edge Marke Market Share Comparison by Based on Organization Size (2016-2032)
- Table 124: Latin America Secure Access Services Edge Marke Market Share Comparison by Based on Vertical (2016-2032)
- Table 125: Latin America Secure Access Services Edge Marke Market Share Comparison by Based on Component (2016-2032)
- Table 126: Middle East & Africa Secure Access Services Edge Marke Market Comparison by Based On Offering (2016-2032)
- Table 127: Middle East & Africa Secure Access Services Edge Marke Market Comparison by Based on Organization Size (2016-2032)
- Table 128: Middle East & Africa Secure Access Services Edge Marke Market Comparison by Based on Vertical (2016-2032)
- Table 129: Middle East & Africa Secure Access Services Edge Marke Market Comparison by Based on Component (2016-2032)
- Table 130: Middle East & Africa Secure Access Services Edge Marke Revenue (US$ Mn) Comparison by Country (2016-2032)
- Table 131: Middle East & Africa Secure Access Services Edge Marke Market Revenue (US$ Mn) (2016-2032)
- Table 132: Middle East & Africa Secure Access Services Edge Marke Market Revenue (US$ Mn) Comparison by Country (2016-2032)
- Table 133: Middle East & Africa Secure Access Services Edge Marke Market Revenue (US$ Mn) Comparison by Based On Offering (2016-2032)
- Table 134: Middle East & Africa Secure Access Services Edge Marke Market Revenue (US$ Mn) Comparison by Based on Organization Size (2016-2032)
- Table 135: Middle East & Africa Secure Access Services Edge Marke Market Revenue (US$ Mn) Comparison by Based on Vertical (2016-2032)
- Table 136: Middle East & Africa Secure Access Services Edge Marke Market Revenue (US$ Mn) Comparison by Based on Component (2016-2032)
- Table 137: Middle East & Africa Secure Access Services Edge Marke Market Y-o-Y Growth Rate Comparison by Country (2016-2032)
- Table 138: Middle East & Africa Secure Access Services Edge Marke Market Y-o-Y Growth Rate Comparison by Based On Offering (2016-2032)
- Table 139: Middle East & Africa Secure Access Services Edge Marke Market Y-o-Y Growth Rate Comparison by Based on Organization Size (2016-2032)
- Table 140: Middle East & Africa Secure Access Services Edge Marke Market Y-o-Y Growth Rate Comparison by Based on Vertical (2016-2032)
- Table 141: Middle East & Africa Secure Access Services Edge Marke Market Y-o-Y Growth Rate Comparison by Based on Component (2016-2032)
- Table 142: Middle East & Africa Secure Access Services Edge Marke Market Share Comparison by Country (2016-2032)
- Table 143: Middle East & Africa Secure Access Services Edge Marke Market Share Comparison by Based On Offering (2016-2032)
- Table 144: Middle East & Africa Secure Access Services Edge Marke Market Share Comparison by Based on Organization Size (2016-2032)
- Table 145: Middle East & Africa Secure Access Services Edge Marke Market Share Comparison by Based on Vertical (2016-2032)
- Table 146: Middle East & Africa Secure Access Services Edge Marke Market Share Comparison by Based on Component (2016-2032)
- 1. Executive Summary
-
- Cisco Systems Inc
- Cloudflare Inc
- VMware Inc
- Fortinet Inc
- Palo Alto Networks Inc
- Akamai Technologies Inc
- Zscaler Inc
- Cato Networks Ltd
- Versa Networks Inc
- Forcepoint
- Broadcom Corporation
- Checkpoint Software Technologies Ltd
- McAfee Corp
- Citrix systems inc.
- juniper network
- Aryaka Networks Inc
Our Clients


View Our Licence Options
