Safari Tourism Market By Type (Adventure Safari, Private Safari, Others), By Accommodation Type (Safari Resorts & Lodges, Safari Camps, Treehouses, Others), By Group (Friends, Families, Couples, Solos), By Booking Mode(Marketplace Booking, Direct Booking, Agents and Affiliates Account), By Region And Companies - Industry Segment Outlook, Market Assessment, Competition Scenario, Trends, And Forecast 2024-2033
-
42691
-
Jan 2024
-
152
-


-
This report was compiled by Research Team Research team of over 50 passionate professionals leverages advanced research methodologies and analytical expertise to deliver insightful, data-driven market intelligence that empowers businesses across diverse industries to make strategic, well-informed Correspondence Research Team Linkedin | Detailed Market research Methodology Our methodology involves a mix of primary research, including interviews with leading mental health experts, and secondary research from reputable medical journals and databases. View Detailed Methodology Page
-
Quick Navigation
- Safari Tourism Market Size, Share, Trends Analysis
- Safari Tourism Market Dynamics
- Safari Tourism Market Segmentation Analysis
- Safari Tourism Industry Segments
- Safari Tourism Market Growth Opportunity
- Safari Tourism Market Regional Analysis
- Safari Tourism Industry By Region
- Safari Tourism Market Share Analysis
- Safari Tourism Industry Key Players
- Safari Tourism Market Recent Development
- Report Scope
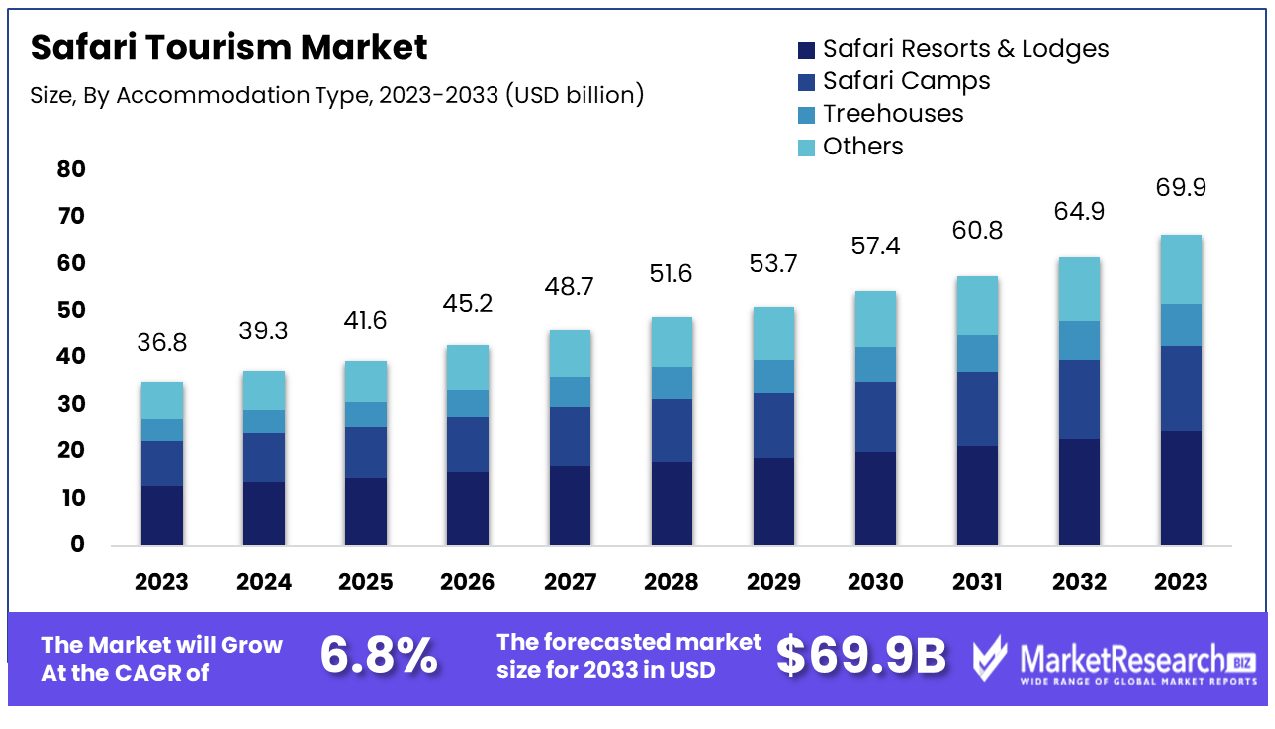
The safari tourism market was valued at USD 36.8 billion in 2023. It is expected to reach USD 69.9 billion by 2033, with a CAGR of 6.8% during the forecast period from 2024 to 2033.
Safari tourism's expansion is driven by rising tourism industry demand and holiday traveler arrivals; millions of travelers flock to safari industry tours every year worldwide.
"Safari" is an East African term for travel in Swahili. The word originated from European hunters and discoverers during the colonial age to describe their adventures in African wilderness areas. Today it is typically associated with wildlife photography, sustainable tourism, and traditional hunter-gatherer adventures once part of African heritage; and among the top choices for travelers seeking thrilling travel experiences. These experiences continue to inspire pictures that portray excitement and exploration.
The rapid expansion of safari tourism has spurred increased concern over wildlife preservation and protection of natural habitats, leading to a greater focus on ecotourism strategies to ensure future generations can enjoy them safely. Due to COVID-19's impactful legislation limiting travelers from enjoying available opportunities. Over the last two to three years tourism businesses have seen an upsurge as more travelers book exotic vacations or safari park tours across various regions.
As reported by the United Nations World Tourism Organization (UNWTO) in 2023, the international tourism industry had doubled in travelers as compared to its predecessor year of 2022. Furthermore, the second UNWTO Barometer revealed that the tourism industry slowly improve in 2023.
Overall, international tourist travel has increased by 80% of pre-pandemic levels in the first quarter of 2023. It is estimated that 235 million tourists traveled internationally in the first three months and more than doubled during the same forecast period in 2022. As per the new data for 2022, it shows more than 960 million people were traveling last year, which means that 2/3 (66%) of pre-pandemic numbers has been increased.
Many travelers are inclined towards safari tourism as it promotes conservative efforts. This has brought the tourists close to the natural environment and it also creates awareness about the requirement of protecting the animals and their surroundings. The demand will rapidly increase due to the demand for tourism and traveling, this will increase the market expansion in the coming years. Moreover, the luxury segment of the safari tourism market caters to discerning travelers seeking both adventure and comfort.
Safari Tourism Market Dynamics
Supportive Policies Enhance Safari Tourism
The combined efforts of government and private sectors in wildlife conservation, infrastructure development, and promotional campaigns are pivotal in driving the safari tourism market. A notable example is the large-scale conservation project in South Sudan by African Parks, an NGO, which spans an area of 200,000km². These initiatives not only improve the tourist experience but also uphold sustainable tourism practices. This holistic approach, integrating both conservation and tourism development, is essential for the long-term growth and viability of the safari tourism market, simultaneously fostering environmental preservation and economic benefits.
Digital Platforms Propel Market Visibility
The influence of social media and digital platforms is significantly shaping the safari tourism market. With 75% of travelers influenced by social media for destination choices, platforms like Instagram and Facebook play a crucial role in elevating the visibility and allure of safari experiences. Additionally, the increased accessibility through online booking platforms and virtual tours further stimulates market growth. Adventure packages are increasingly popular, offering tourists exhilarating encounters with wildlife and untouched landscapes. This digital engagement, especially prevalent among younger generations, is expected to persist as a major driver for the market, continuously enhancing its reach and appeal.
Photographic Opportunities Attract Tourists
The allure of capturing stunning wildlife and landscape imagery is a significant draw for the safari tourism market, especially with 40% of Millennials prioritizing travel destinations based on their 'Instagrammability'. Safari destinations like the Serengeti National Park and Okavango Delta offer unparalleled photographic opportunities, attracting both amateur and professional photographers. This trend not only satisfies creative aspirations but also amplifies the market's visibility, as shared images inspire more people to seek similar experiences. The market is poised to grow with the increasing demand for these unique photographic adventures, enhancing both the demand and supply in the safari tourism sector.
Limited Infrastructure and Accessibility Restrain Safari Tourism Market Growth
Safari tourism's growth is significantly limited by inadequate facilities and access to various safari destinations. Remote and underdeveloped regions that often provide the most enjoyable experiences may lack adequate roads, smart airports, and accommodations to host large numbers of visitors.
Accessibility can deter tourists who prefer more laidback holidays or who require certain amenities and comforts. Enhancing infrastructure within these regions to make safari tourism more accessible is vital to its growth, yet must also be done sustainably so as not to harm habitat and wildlife.
Political Instability and Security Concerns Limit Safari Tourism Market Expansion
Security concerns and instability present a challenge to expanding the safari market. Regions experiencing political unrest or conflict, and high crime rates could be seen by tourists as potentially hazardous destinations. Perceived risks could discourage travelers from visiting safari tourist areas even though the actual sites are safe.
Tourists tend to emphasize safety issues when choosing vacation destinations; preferring alternative destinations with more stable political environments may be better options for them. Effective communication regarding the security of safari tourist areas is critical to dispelling fears and drawing skeptical travelers to areas with ongoing security issues; however, this can sometimes prove challenging.
Safari Tourism Market Segmentation Analysis
By Type Analysis
Adventure tourism Safari segment stands as the dominant segment within the safari tourism market. Adventure draws tourists looking for an engaging nature experience and wildlife encounter. This safari travel industry provides visitors with an exhilarating and fulfilling encounter with nature and its wonders. Adventure typically involves guided walks, tracking wildlife, and nights that give participants new perspectives and deeper connections to nature.
Adventure Safari's rising popularity can be attributed to an increase in experiential travel and tourists' desire for activities that provide exciting learning and entertainment experiences. Although Adventure Safari remains the leader, other types such as the Private Safari segment offer customized and exclusive experiences; in addition, unique forms add variety and attraction.
By Accommodation Type Analysis
Safari Resorts & Lodges are the preferred accommodation type for safari tourists, dominating the market. These hotels are designed to offer luxurious, comfortable, and an authentic experience, often situated near wildlife reserves to make accessing activities easier. Lodges and resorts range from affordable options to more lavish options and cater to an assortment of tourists.
Safari Resorts & Lodges provide additional amenities like guided tours, culinary experiences, and cultural interactions that add an extra dimension to a safari traveler's stay. While resorts and lodges remain the go-to option, other accommodations such as Camps offer an authentic camping experience; whilst Treehouses can also offer unique lodging choices that continue to meet travelers' individual preferences on trips.
By Group Analysis
The Friends group emerges as the dominant segment among travel-goers. An adventurous trip with friends is the perfect combination of sharing adventure and exploration, creating lasting memories along the way. Groups of friends typically look for experiences that provide both thrills and memories - an increasingly popular option due to young travelers seeking special and memorable bonding experiences.
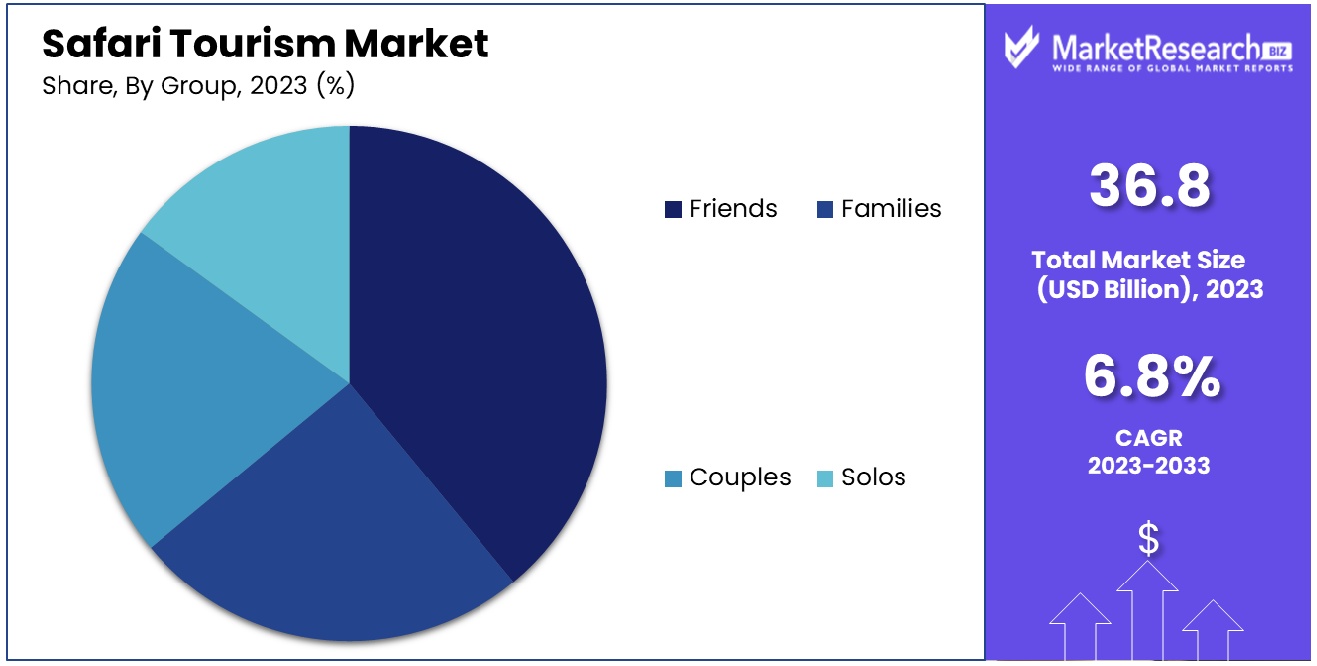
Though Friends segment leads, Families, Couples, and Solo travelers also play significant roles. Families tend to prefer educational and fun-based trips while couples segment and solo travelers tend towards romantic or solo getaways respectively.
By Booking Mode Analysis
Marketplace Booking is the predominant booking mode in the safari tourism market. Online travel and marketplace platforms offer travelers a vast array of choices, user reviews, and simple comparisons that make them extremely popular choices for travelers. Their accessibility, convenience, and often more competitive pricing make these platforms all the more desirable for travelers. The integration of travel and expense management software is revolutionizing the safari tourism market.
The growth of this market can be attributed to increasing online penetration, the proliferation of online travel companies (OTAs), and consumers' trust in online bookings. Although Marketplace Booking leads the pack, Direct Booking gives customers more control to customize their experiences with service suppliers directly; agents and Affiliate Accounts play a crucial role in providing personalized advice specifically for custom or luxury bookings.
Safari Tourism Industry Segments
By Type
- Adventure Safari
- Private Safari
- Others
By Accommodation Type
- Safari Resorts & Lodges
- Safari Camps
- Treehouses
- Others
By Group
- Friends
- Families
- Couples
- Solos
By Booking Mode
- Marketplace Booking
- Direct Booking
- Agents and Affiliates Account
Safari Tourism Market Growth Opportunity
Growing Interest in Sustainable Tourism Fuels Safari Tourism Market Growth
Safari tourism's rapid expansion can be traced directly back to an increase in demand for eco-friendly and responsible travel, particularly by travelers more conscious about their impact on the environment and how their travel impacts conservation efforts and local communities.
Safari major companies that focus on wildlife preservation also tend to align themselves closely with these values; their eco-friendly experiences draw more eco-conscious tourists, representing an excellent expansion opportunity for this market segment.
Increasing Popularity of Micro Trips Boosts the Safari Tourism Market
Micro-trips - short leisure excursions that allow travelers to experience adventures within a short period - have seen an increased market for safari tourism. Micro trips offer travelers an easy yet satisfying escape from modern life's hectic pace and safari tourism is becoming more appealing as more people seek unforgettable and unique experiences they can complete within one or two days. With micro trips becoming more prevalent than ever, safari tourism is experiencing rapid expansion.
Safari Tourism Market Regional Analysis
Middle East & Africa Dominates with 50.30% Market Share in Safari Tourism Market
The Middle East and Africa hold a dominant 50.30% market share for safari tourism due to their abundance of biodiversity, diverse ecosystems, and unique cultural heritage. Africa particularly is famous for iconic spots like Serengeti, Masai Mara, and Kruger National Park - with vast expanses of landscapes as well as Big Five (lion, elephant buffalo leopard rhinoceros) wildlife all living together naturally in their environments which draw visitors from around the globe. Furthermore, efforts taken by this region in protecting wildlife and encouraging sustainable tourism practices also contribute immensely towards growing this market share.
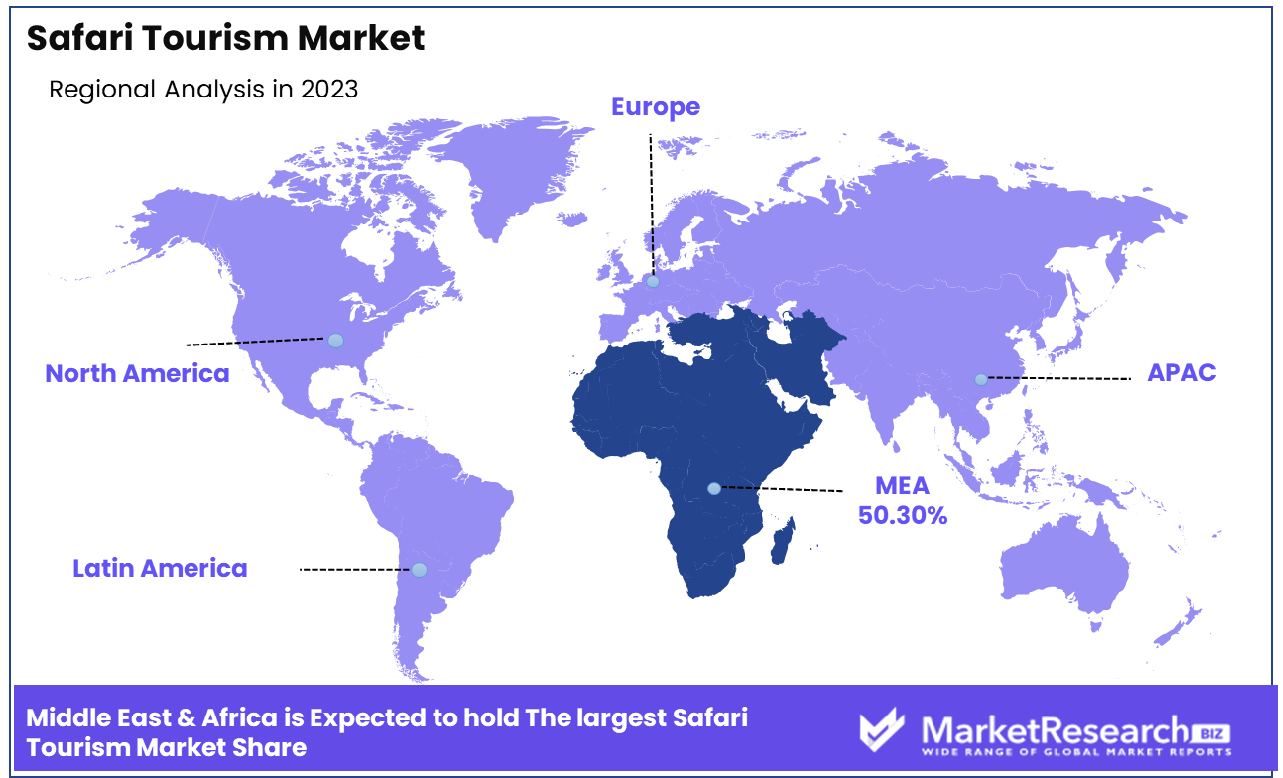
Middle East & Africa market dynamics are determined by the growth of tourism infrastructure such as luxurious lodges and guided tours that enhance experiences. Government initiatives and international collaborations that focus on the conservation of wildlife while encouraging tourism are also major influences in market dynamics, while rich culture and adventure travel trends draw travelers looking for authentic experiences.
Europe: Increasing Demand for Adventure and Wildlife Experiences
The European safari tourism market is expanding, driven by increasing consumer desire for adventure and outdoor experiences. European tourists increasingly seeking trips in the Middle East & Africa for trips. Additionally, this market boasts excellent air connectivity as well as strong partnerships between travel companies that focus on responsible and sustainable tourism practices.
North America: A Market Driven by Experiential Travelers
More than 63% of all safari bookings came from the US in 2022, making America the most safari-loving nation in the world. North American tourism market for safari travel is expanding quickly due to an increase in people wanting unforgettable and unique experiences. This market is supported by a thriving tourism industry and population with high disposable income; North American travelers' increasing interest in conservation, wildlife viewing, and cultural events contributes significantly to demand across Africa and the Middle East & Africa.
Safari Tourism Industry By Region
North America
- The US
- Canada
- Rest of North America
Europe
- Germany
- France
- The UK
- Spain
- Italy
- Russia
- Netherlands
- Rest of Europe
Asia-Pacific
- China
- Japan
- South Korea
- India
- New Zealand
- Singapore
- Thailand
- Vietnam
- Rest of Asia Pacific
Latin America
- Brazil
- Mexico
- Rest of Latin America
Middle East & Africa
- South Africa
- Saudi Arabia
- UAE
- Rest of Middle East & Africa
In the dynamic landscape of safari tourism, key players shape market trends and customer experiences. These companies, from Wilderness to TUI Group, each bring distinct strategies and impacts to the sector.
Wilderness and Singita, renowned for their exclusive and luxurious experiences, set a high standard in eco-friendly and sustainable practices. Their strategic positioning as premium providers attracts a niche, high-spending clientele, influencing market trends towards sustainable luxury.
Thomas Cook Group and TUI Group, with their vast resources and global reach, dominate in terms of market share. Their broad range of offerings and strategic partnerships allow them to cater to a diverse customer base, from budget to luxury, making safari tourism accessible to a wider audience.
&Beyond and Rothschild Safaris, known for their bespoke and conservation-focused experiences, impact the market by promoting responsible tourism. Their focus on personalized journeys and conservation efforts resonates with environmentally conscious travelers.
Safari Tourism Industry Key Players
- Wilderness
- Thomas Cook Group
- Singita
- Scott Dunn Ltd.
- Rothschild Safaris
- &Beyond
- Travcoa Tours & Safaris
- Abercrombie & Kent USA, LLC
- Gamewatchers Safaris Ltd.
- Backroads
- TUI Group
Safari Tourism Market Recent Development
- In May 2023, &Beyond announced the renovation of their Phinda Forest Lodge located within their Phinda Private Game Reserve in KwaZulu Natal South Africa. To minimize disruption to its delicate ecosystem, renovation plans utilize existing structures rather than total rebuilds; this allows the preservation of their "Zulu Zen" design while adding modern design features.
- In April 2023, Singita announced its latest wellness model, "Wholeness," - featuring customized spa experiences tailored specifically for summer guests. Local-sourced products like riverbank sand are used for revitalizing foot scrubs on Singita Sabi Sand beach; guests can expect more plant-based options at lodges and camps; Mara River Tented Camp will undergo renovation and relaunched with its fresh new style.
- In April 2023, Wilderness announced the establishment of Wilderness Mokete Tented Camp in Botswana's Mbabe Concession, covering 124,000 acres between Okavango Delta and Chobe National Park. This remote oasis is home to various forms of wildlife such as buffalos, elephants, hyenas, and even lions; making this camp unique as it features its region.
Report Scope
Report Features Description Market Value (2023) USD 36.8 Billion Forecast Revenue (2033) USD 69.9 Billion CAGR (2024-2032) 6.8% Base Year for Estimation 2023 Historic Period 2016-2023 Forecast Period 2024-2033 Report Coverage Revenue Forecast, Market Dynamics, COVID-19 Impact, Competitive Landscape, Recent Developments Segments Covered By Type (Adventure Safari, Private Safari, Others), By Accommodation Type (Safari Resorts & Lodges, Safari Camps, Treehouses, Others), By Group (Friends, Families, Couples, Solos), By Booking Mode(Marketplace Booking, Direct Booking, Agents and Affiliates Account) Regional Analysis North America - The US, Canada, Rest of North America, Europe - Germany, France, The UK, Spain, Italy, Russia, Netherlands, Rest of Europe, Asia-Pacific - China, Japan, South Korea, India, New Zealand, Singapore, Thailand, Vietnam, Rest of Asia Pacific, Latin America - Brazil, Mexico, Rest of Latin America, Middle East & Africa - South Africa, Saudi Arabia, UAE, Rest of Middle East & Africa Competitive Landscape Wilderness, Thomas Cook Group, Singita, Scott Dunn Ltd., Rothschild Safaris, &Beyond, Travcoa Tours & Safaris, Abercrombie & Kent USA, LLC, Gamewatchers Safaris Ltd., Backroads, TUI Group Customization Scope Customization for segments, region/country-level will be provided. Moreover, additional customization can be done based on the requirements. Purchase Options We have three licenses to opt for Single User License, Multi-User License (Up to 5 Users), Corporate Use License (Unlimited User and Printable PDF) -
- 1. Executive Summary
- 1.1. Definition
- 1.2. Taxonomy
- 1.3. Research Scope
- 1.4. Key Analysis
- 1.5. Key Findings by Major Segments
- 1.6. Top strategies by Major Players
- 2. Global Safari Tourism Market Overview
- 2.1. Safari Tourism Market Dynamics
- 2.1.1. Drivers
- 2.1.2. Opportunities
- 2.1.3. Restraints
- 2.1.4. Challenges
- 2.2. Macro-economic Factors
- 2.3. Regulatory Framework
- 2.4. Market Investment Feasibility Index
- 2.5. PEST Analysis
- 2.6. PORTER’S Five Force Analysis
- 2.7. Drivers & Restraints Impact Analysis
- 2.8. Industry Chain Analysis
- 2.9. Cost Structure Analysis
- 2.10. Marketing Strategy
- 2.11. Russia-Ukraine War Impact Analysis
- 2.12. Opportunity Map Analysis
- 2.13. Market Competition Scenario Analysis
- 2.14. Product Life Cycle Analysis
- 2.15. Opportunity Orbits
- 2.16. Manufacturer Intensity Map
- 2.17. Major Companies sales by Value & Volume
- 2.1. Safari Tourism Market Dynamics
- 3. Global Safari Tourism Market Analysis, Opportunity and Forecast, 2016-2032
- 3.1. Global Safari Tourism Market Analysis, 2016-2021
- 3.2. Global Safari Tourism Market Opportunity and Forecast, 2023-2032
- 3.3. Global Safari Tourism Market Analysis, Opportunity and Forecast, By By Type, 2016-2032
- 3.3.1. Global Safari Tourism Market Analysis by By Type: Introduction
- 3.3.2. Market Size Absolute $ Opportunity Analysis and Forecast, By By Type, 2016-2032
- 3.3.3. Adventure Safari
- 3.3.4. Private Safari
- 3.3.5. Others
- 3.4. Global Safari Tourism Market Analysis, Opportunity and Forecast, By By Accommodation Type , 2016-2032
- 3.4.1. Global Safari Tourism Market Analysis by By Accommodation Type : Introduction
- 3.4.2. Market Size Absolute $ Opportunity Analysis and Forecast, By By Accommodation Type , 2016-2032
- 3.4.3. Safari Resorts & Lodges
- 3.4.4. Safari Camps
- 3.4.5. Treehouses
- 3.4.6. Others
- 3.5. Global Safari Tourism Market Analysis, Opportunity and Forecast, By By Group, 2016-2032
- 3.5.1. Global Safari Tourism Market Analysis by By Group: Introduction
- 3.5.2. Market Size Absolute $ Opportunity Analysis and Forecast, By By Group, 2016-2032
- 3.5.3. Friends
- 3.5.4. Families
- 3.5.5. Couples
- 3.5.6. Solos
- 3.6. Global Safari Tourism Market Analysis, Opportunity and Forecast, By By Booking Mode , 2016-2032
- 3.6.1. Global Safari Tourism Market Analysis by By Booking Mode : Introduction
- 3.6.2. Market Size Absolute $ Opportunity Analysis and Forecast, By By Booking Mode , 2016-2032
- 3.6.3. Marketplace Booking
- 3.6.4. Direct Booking
- 3.6.5. Agents and Affiliates Account
- 4. North America Safari Tourism Market Analysis, Opportunity and Forecast, 2016-2032
- 4.1. North America Safari Tourism Market Analysis, 2016-2021
- 4.2. North America Safari Tourism Market Opportunity and Forecast, 2023-2032
- 4.3. North America Safari Tourism Market Analysis, Opportunity and Forecast, By By Type, 2016-2032
- 4.3.1. North America Safari Tourism Market Analysis by By Type: Introduction
- 4.3.2. Market Size Absolute $ Opportunity Analysis and Forecast, By By Type, 2016-2032
- 4.3.3. Adventure Safari
- 4.3.4. Private Safari
- 4.3.5. Others
- 4.4. North America Safari Tourism Market Analysis, Opportunity and Forecast, By By Accommodation Type , 2016-2032
- 4.4.1. North America Safari Tourism Market Analysis by By Accommodation Type : Introduction
- 4.4.2. Market Size Absolute $ Opportunity Analysis and Forecast, By By Accommodation Type , 2016-2032
- 4.4.3. Safari Resorts & Lodges
- 4.4.4. Safari Camps
- 4.4.5. Treehouses
- 4.4.6. Others
- 4.5. North America Safari Tourism Market Analysis, Opportunity and Forecast, By By Group, 2016-2032
- 4.5.1. North America Safari Tourism Market Analysis by By Group: Introduction
- 4.5.2. Market Size Absolute $ Opportunity Analysis and Forecast, By By Group, 2016-2032
- 4.5.3. Friends
- 4.5.4. Families
- 4.5.5. Couples
- 4.5.6. Solos
- 4.6. North America Safari Tourism Market Analysis, Opportunity and Forecast, By By Booking Mode , 2016-2032
- 4.6.1. North America Safari Tourism Market Analysis by By Booking Mode : Introduction
- 4.6.2. Market Size Absolute $ Opportunity Analysis and Forecast, By By Booking Mode , 2016-2032
- 4.6.3. Marketplace Booking
- 4.6.4. Direct Booking
- 4.6.5. Agents and Affiliates Account
- 4.7. North America Safari Tourism Market Analysis, Opportunity and Forecast, By Country , 2016-2032
- 4.7.1. North America Safari Tourism Market Analysis by Country : Introduction
- 4.7.2. Market Size Absolute $ Opportunity Analysis and Forecast, Country , 2016-2032
- 4.7.2.1. The US
- 4.7.2.2. Canada
- 4.7.2.3. Mexico
- 5. Western Europe Safari Tourism Market Analysis, Opportunity and Forecast, 2016-2032
- 5.1. Western Europe Safari Tourism Market Analysis, 2016-2021
- 5.2. Western Europe Safari Tourism Market Opportunity and Forecast, 2023-2032
- 5.3. Western Europe Safari Tourism Market Analysis, Opportunity and Forecast, By By Type, 2016-2032
- 5.3.1. Western Europe Safari Tourism Market Analysis by By Type: Introduction
- 5.3.2. Market Size Absolute $ Opportunity Analysis and Forecast, By By Type, 2016-2032
- 5.3.3. Adventure Safari
- 5.3.4. Private Safari
- 5.3.5. Others
- 5.4. Western Europe Safari Tourism Market Analysis, Opportunity and Forecast, By By Accommodation Type , 2016-2032
- 5.4.1. Western Europe Safari Tourism Market Analysis by By Accommodation Type : Introduction
- 5.4.2. Market Size Absolute $ Opportunity Analysis and Forecast, By By Accommodation Type , 2016-2032
- 5.4.3. Safari Resorts & Lodges
- 5.4.4. Safari Camps
- 5.4.5. Treehouses
- 5.4.6. Others
- 5.5. Western Europe Safari Tourism Market Analysis, Opportunity and Forecast, By By Group, 2016-2032
- 5.5.1. Western Europe Safari Tourism Market Analysis by By Group: Introduction
- 5.5.2. Market Size Absolute $ Opportunity Analysis and Forecast, By By Group, 2016-2032
- 5.5.3. Friends
- 5.5.4. Families
- 5.5.5. Couples
- 5.5.6. Solos
- 5.6. Western Europe Safari Tourism Market Analysis, Opportunity and Forecast, By By Booking Mode , 2016-2032
- 5.6.1. Western Europe Safari Tourism Market Analysis by By Booking Mode : Introduction
- 5.6.2. Market Size Absolute $ Opportunity Analysis and Forecast, By By Booking Mode , 2016-2032
- 5.6.3. Marketplace Booking
- 5.6.4. Direct Booking
- 5.6.5. Agents and Affiliates Account
- 5.7. Western Europe Safari Tourism Market Analysis, Opportunity and Forecast, By Country , 2016-2032
- 5.7.1. Western Europe Safari Tourism Market Analysis by Country : Introduction
- 5.7.2. Market Size Absolute $ Opportunity Analysis and Forecast, Country , 2016-2032
- 5.7.2.1. Germany
- 5.7.2.2. France
- 5.7.2.3. The UK
- 5.7.2.4. Spain
- 5.7.2.5. Italy
- 5.7.2.6. Portugal
- 5.7.2.7. Ireland
- 5.7.2.8. Austria
- 5.7.2.9. Switzerland
- 5.7.2.10. Benelux
- 5.7.2.11. Nordic
- 5.7.2.12. Rest of Western Europe
- 6. Eastern Europe Safari Tourism Market Analysis, Opportunity and Forecast, 2016-2032
- 6.1. Eastern Europe Safari Tourism Market Analysis, 2016-2021
- 6.2. Eastern Europe Safari Tourism Market Opportunity and Forecast, 2023-2032
- 6.3. Eastern Europe Safari Tourism Market Analysis, Opportunity and Forecast, By By Type, 2016-2032
- 6.3.1. Eastern Europe Safari Tourism Market Analysis by By Type: Introduction
- 6.3.2. Market Size Absolute $ Opportunity Analysis and Forecast, By By Type, 2016-2032
- 6.3.3. Adventure Safari
- 6.3.4. Private Safari
- 6.3.5. Others
- 6.4. Eastern Europe Safari Tourism Market Analysis, Opportunity and Forecast, By By Accommodation Type , 2016-2032
- 6.4.1. Eastern Europe Safari Tourism Market Analysis by By Accommodation Type : Introduction
- 6.4.2. Market Size Absolute $ Opportunity Analysis and Forecast, By By Accommodation Type , 2016-2032
- 6.4.3. Safari Resorts & Lodges
- 6.4.4. Safari Camps
- 6.4.5. Treehouses
- 6.4.6. Others
- 6.5. Eastern Europe Safari Tourism Market Analysis, Opportunity and Forecast, By By Group, 2016-2032
- 6.5.1. Eastern Europe Safari Tourism Market Analysis by By Group: Introduction
- 6.5.2. Market Size Absolute $ Opportunity Analysis and Forecast, By By Group, 2016-2032
- 6.5.3. Friends
- 6.5.4. Families
- 6.5.5. Couples
- 6.5.6. Solos
- 6.6. Eastern Europe Safari Tourism Market Analysis, Opportunity and Forecast, By By Booking Mode , 2016-2032
- 6.6.1. Eastern Europe Safari Tourism Market Analysis by By Booking Mode : Introduction
- 6.6.2. Market Size Absolute $ Opportunity Analysis and Forecast, By By Booking Mode , 2016-2032
- 6.6.3. Marketplace Booking
- 6.6.4. Direct Booking
- 6.6.5. Agents and Affiliates Account
- 6.7. Eastern Europe Safari Tourism Market Analysis, Opportunity and Forecast, By Country , 2016-2032
- 6.7.1. Eastern Europe Safari Tourism Market Analysis by Country : Introduction
- 6.7.2. Market Size Absolute $ Opportunity Analysis and Forecast, Country , 2016-2032
- 6.7.2.1. Russia
- 6.7.2.2. Poland
- 6.7.2.3. The Czech Republic
- 6.7.2.4. Greece
- 6.7.2.5. Rest of Eastern Europe
- 7. APAC Safari Tourism Market Analysis, Opportunity and Forecast, 2016-2032
- 7.1. APAC Safari Tourism Market Analysis, 2016-2021
- 7.2. APAC Safari Tourism Market Opportunity and Forecast, 2023-2032
- 7.3. APAC Safari Tourism Market Analysis, Opportunity and Forecast, By By Type, 2016-2032
- 7.3.1. APAC Safari Tourism Market Analysis by By Type: Introduction
- 7.3.2. Market Size Absolute $ Opportunity Analysis and Forecast, By By Type, 2016-2032
- 7.3.3. Adventure Safari
- 7.3.4. Private Safari
- 7.3.5. Others
- 7.4. APAC Safari Tourism Market Analysis, Opportunity and Forecast, By By Accommodation Type , 2016-2032
- 7.4.1. APAC Safari Tourism Market Analysis by By Accommodation Type : Introduction
- 7.4.2. Market Size Absolute $ Opportunity Analysis and Forecast, By By Accommodation Type , 2016-2032
- 7.4.3. Safari Resorts & Lodges
- 7.4.4. Safari Camps
- 7.4.5. Treehouses
- 7.4.6. Others
- 7.5. APAC Safari Tourism Market Analysis, Opportunity and Forecast, By By Group, 2016-2032
- 7.5.1. APAC Safari Tourism Market Analysis by By Group: Introduction
- 7.5.2. Market Size Absolute $ Opportunity Analysis and Forecast, By By Group, 2016-2032
- 7.5.3. Friends
- 7.5.4. Families
- 7.5.5. Couples
- 7.5.6. Solos
- 7.6. APAC Safari Tourism Market Analysis, Opportunity and Forecast, By By Booking Mode , 2016-2032
- 7.6.1. APAC Safari Tourism Market Analysis by By Booking Mode : Introduction
- 7.6.2. Market Size Absolute $ Opportunity Analysis and Forecast, By By Booking Mode , 2016-2032
- 7.6.3. Marketplace Booking
- 7.6.4. Direct Booking
- 7.6.5. Agents and Affiliates Account
- 7.7. APAC Safari Tourism Market Analysis, Opportunity and Forecast, By Country , 2016-2032
- 7.7.1. APAC Safari Tourism Market Analysis by Country : Introduction
- 7.7.2. Market Size Absolute $ Opportunity Analysis and Forecast, Country , 2016-2032
- 7.7.2.1. China
- 7.7.2.2. Japan
- 7.7.2.3. South Korea
- 7.7.2.4. India
- 7.7.2.5. Australia & New Zeland
- 7.7.2.6. Indonesia
- 7.7.2.7. Malaysia
- 7.7.2.8. Philippines
- 7.7.2.9. Singapore
- 7.7.2.10. Thailand
- 7.7.2.11. Vietnam
- 7.7.2.12. Rest of APAC
- 8. Latin America Safari Tourism Market Analysis, Opportunity and Forecast, 2016-2032
- 8.1. Latin America Safari Tourism Market Analysis, 2016-2021
- 8.2. Latin America Safari Tourism Market Opportunity and Forecast, 2023-2032
- 8.3. Latin America Safari Tourism Market Analysis, Opportunity and Forecast, By By Type, 2016-2032
- 8.3.1. Latin America Safari Tourism Market Analysis by By Type: Introduction
- 8.3.2. Market Size Absolute $ Opportunity Analysis and Forecast, By By Type, 2016-2032
- 8.3.3. Adventure Safari
- 8.3.4. Private Safari
- 8.3.5. Others
- 8.4. Latin America Safari Tourism Market Analysis, Opportunity and Forecast, By By Accommodation Type , 2016-2032
- 8.4.1. Latin America Safari Tourism Market Analysis by By Accommodation Type : Introduction
- 8.4.2. Market Size Absolute $ Opportunity Analysis and Forecast, By By Accommodation Type , 2016-2032
- 8.4.3. Safari Resorts & Lodges
- 8.4.4. Safari Camps
- 8.4.5. Treehouses
- 8.4.6. Others
- 8.5. Latin America Safari Tourism Market Analysis, Opportunity and Forecast, By By Group, 2016-2032
- 8.5.1. Latin America Safari Tourism Market Analysis by By Group: Introduction
- 8.5.2. Market Size Absolute $ Opportunity Analysis and Forecast, By By Group, 2016-2032
- 8.5.3. Friends
- 8.5.4. Families
- 8.5.5. Couples
- 8.5.6. Solos
- 8.6. Latin America Safari Tourism Market Analysis, Opportunity and Forecast, By By Booking Mode , 2016-2032
- 8.6.1. Latin America Safari Tourism Market Analysis by By Booking Mode : Introduction
- 8.6.2. Market Size Absolute $ Opportunity Analysis and Forecast, By By Booking Mode , 2016-2032
- 8.6.3. Marketplace Booking
- 8.6.4. Direct Booking
- 8.6.5. Agents and Affiliates Account
- 8.7. Latin America Safari Tourism Market Analysis, Opportunity and Forecast, By Country , 2016-2032
- 8.7.1. Latin America Safari Tourism Market Analysis by Country : Introduction
- 8.7.2. Market Size Absolute $ Opportunity Analysis and Forecast, Country , 2016-2032
- 8.7.2.1. Brazil
- 8.7.2.2. Colombia
- 8.7.2.3. Chile
- 8.7.2.4. Argentina
- 8.7.2.5. Costa Rica
- 8.7.2.6. Rest of Latin America
- 9. Middle East & Africa Safari Tourism Market Analysis, Opportunity and Forecast, 2016-2032
- 9.1. Middle East & Africa Safari Tourism Market Analysis, 2016-2021
- 9.2. Middle East & Africa Safari Tourism Market Opportunity and Forecast, 2023-2032
- 9.3. Middle East & Africa Safari Tourism Market Analysis, Opportunity and Forecast, By By Type, 2016-2032
- 9.3.1. Middle East & Africa Safari Tourism Market Analysis by By Type: Introduction
- 9.3.2. Market Size Absolute $ Opportunity Analysis and Forecast, By By Type, 2016-2032
- 9.3.3. Adventure Safari
- 9.3.4. Private Safari
- 9.3.5. Others
- 9.4. Middle East & Africa Safari Tourism Market Analysis, Opportunity and Forecast, By By Accommodation Type , 2016-2032
- 9.4.1. Middle East & Africa Safari Tourism Market Analysis by By Accommodation Type : Introduction
- 9.4.2. Market Size Absolute $ Opportunity Analysis and Forecast, By By Accommodation Type , 2016-2032
- 9.4.3. Safari Resorts & Lodges
- 9.4.4. Safari Camps
- 9.4.5. Treehouses
- 9.4.6. Others
- 9.5. Middle East & Africa Safari Tourism Market Analysis, Opportunity and Forecast, By By Group, 2016-2032
- 9.5.1. Middle East & Africa Safari Tourism Market Analysis by By Group: Introduction
- 9.5.2. Market Size Absolute $ Opportunity Analysis and Forecast, By By Group, 2016-2032
- 9.5.3. Friends
- 9.5.4. Families
- 9.5.5. Couples
- 9.5.6. Solos
- 9.6. Middle East & Africa Safari Tourism Market Analysis, Opportunity and Forecast, By By Booking Mode , 2016-2032
- 9.6.1. Middle East & Africa Safari Tourism Market Analysis by By Booking Mode : Introduction
- 9.6.2. Market Size Absolute $ Opportunity Analysis and Forecast, By By Booking Mode , 2016-2032
- 9.6.3. Marketplace Booking
- 9.6.4. Direct Booking
- 9.6.5. Agents and Affiliates Account
- 9.7. Middle East & Africa Safari Tourism Market Analysis, Opportunity and Forecast, By Country , 2016-2032
- 9.7.1. Middle East & Africa Safari Tourism Market Analysis by Country : Introduction
- 9.7.2. Market Size Absolute $ Opportunity Analysis and Forecast, Country , 2016-2032
- 9.7.2.1. Algeria
- 9.7.2.2. Egypt
- 9.7.2.3. Israel
- 9.7.2.4. Kuwait
- 9.7.2.5. Nigeria
- 9.7.2.6. Saudi Arabia
- 9.7.2.7. South Africa
- 9.7.2.8. Turkey
- 9.7.2.9. The UAE
- 9.7.2.10. Rest of MEA
- 10. Global Safari Tourism Market Analysis, Opportunity and Forecast, By Region , 2016-2032
- 10.1. Global Safari Tourism Market Analysis by Region : Introduction
- 10.2. Market Size Absolute $ Opportunity Analysis and Forecast, By Region , 2016-2032
- 10.2.1. North America
- 10.2.2. Western Europe
- 10.2.3. Eastern Europe
- 10.2.4. APAC
- 10.2.5. Latin America
- 10.2.6. Middle East & Africa
- 11. Global Safari Tourism Market Competitive Landscape, Market Share Analysis, and Company Profiles
- 11.1. Market Share Analysis
- 11.2. Company Profiles
- 11.3. Wilderness
- 11.3.1. Company Overview
- 11.3.2. Financial Highlights
- 11.3.3. Product Portfolio
- 11.3.4. SWOT Analysis
- 11.3.5. Key Strategies and Developments
- 11.4. Thomas Cook Group
- 11.4.1. Company Overview
- 11.4.2. Financial Highlights
- 11.4.3. Product Portfolio
- 11.4.4. SWOT Analysis
- 11.4.5. Key Strategies and Developments
- 11.5. Singita
- 11.5.1. Company Overview
- 11.5.2. Financial Highlights
- 11.5.3. Product Portfolio
- 11.5.4. SWOT Analysis
- 11.5.5. Key Strategies and Developments
- 11.6. Scott Dunn Ltd.
- 11.6.1. Company Overview
- 11.6.2. Financial Highlights
- 11.6.3. Product Portfolio
- 11.6.4. SWOT Analysis
- 11.6.5. Key Strategies and Developments
- 11.7. Rothschild Safaris
- 11.7.1. Company Overview
- 11.7.2. Financial Highlights
- 11.7.3. Product Portfolio
- 11.7.4. SWOT Analysis
- 11.7.5. Key Strategies and Developments
- 11.8. &Beyond
- 11.8.1. Company Overview
- 11.8.2. Financial Highlights
- 11.8.3. Product Portfolio
- 11.8.4. SWOT Analysis
- 11.8.5. Key Strategies and Developments
- 11.9. Travcoa Tours & Safaris
- 11.9.1. Company Overview
- 11.9.2. Financial Highlights
- 11.9.3. Product Portfolio
- 11.9.4. SWOT Analysis
- 11.9.5. Key Strategies and Developments
- 11.10. Abercrombie & Kent USA, LLC
- 11.10.1. Company Overview
- 11.10.2. Financial Highlights
- 11.10.3. Product Portfolio
- 11.10.4. SWOT Analysis
- 11.10.5. Key Strategies and Developments
- 11.11. Gamewatchers Safaris Ltd.
- 11.11.1. Company Overview
- 11.11.2. Financial Highlights
- 11.11.3. Product Portfolio
- 11.11.4. SWOT Analysis
- 11.11.5. Key Strategies and Developments
- 11.12. Backroads
- 11.12.1. Company Overview
- 11.12.2. Financial Highlights
- 11.12.3. Product Portfolio
- 11.12.4. SWOT Analysis
- 11.12.5. Key Strategies and Developments
- 11.13.1. Company Overview
- 11.13.2. Financial Highlights
- 11.13.3. Product Portfolio
- 11.13.4. SWOT Analysis
- 11.13.5. Key Strategies and Developments
- 11.14. TUI Group
- 11.14.1. Company Overview
- 11.14.2. Financial Highlights
- 11.14.3. Product Portfolio
- 11.14.4. SWOT Analysis
- 11.14.5. Key Strategies and Developments
- 12. Assumptions and Acronyms
- 13. Research Methodology
- 14. Contact
"
- List of Figures
- "
- Figure 1: Global Safari Tourism Market Revenue (US$ Mn) Market Share by By Type in 2022
- Figure 2: Global Safari Tourism Market Market Attractiveness Analysis by By Type, 2016-2032
- Figure 3: Global Safari Tourism Market Revenue (US$ Mn) Market Share by By Accommodation Type in 2022
- Figure 4: Global Safari Tourism Market Market Attractiveness Analysis by By Accommodation Type , 2016-2032
- Figure 5: Global Safari Tourism Market Revenue (US$ Mn) Market Share by By Groupin 2022
- Figure 6: Global Safari Tourism Market Market Attractiveness Analysis by By Group, 2016-2032
- Figure 7: Global Safari Tourism Market Revenue (US$ Mn) Market Share by By Booking Mode in 2022
- Figure 8: Global Safari Tourism Market Market Attractiveness Analysis by By Booking Mode , 2016-2032
- Figure 9: Global Safari Tourism Market Revenue (US$ Mn) Market Share by Region in 2022
- Figure 10: Global Safari Tourism Market Market Attractiveness Analysis by Region, 2016-2032
- Figure 11: Global Safari Tourism Market Market Revenue (US$ Mn) (2016-2032)
- Figure 12: Global Safari Tourism Market Market Revenue (US$ Mn) Comparison by Region (2016-2032)
- Figure 13: Global Safari Tourism Market Market Revenue (US$ Mn) Comparison by By Type (2016-2032)
- Figure 14: Global Safari Tourism Market Market Revenue (US$ Mn) Comparison by By Accommodation Type (2016-2032)
- Figure 15: Global Safari Tourism Market Market Revenue (US$ Mn) Comparison by By Group (2016-2032)
- Figure 16: Global Safari Tourism Market Market Revenue (US$ Mn) Comparison by By Booking Mode (2016-2032)
- Figure 17: Global Safari Tourism Market Market Y-o-Y Growth Rate Comparison by Region (2016-2032)
- Figure 18: Global Safari Tourism Market Market Y-o-Y Growth Rate Comparison by By Type (2016-2032)
- Figure 19: Global Safari Tourism Market Market Y-o-Y Growth Rate Comparison by By Accommodation Type (2016-2032)
- Figure 20: Global Safari Tourism Market Market Y-o-Y Growth Rate Comparison by By Group (2016-2032)
- Figure 21: Global Safari Tourism Market Market Y-o-Y Growth Rate Comparison by By Booking Mode (2016-2032)
- Figure 22: Global Safari Tourism Market Market Share Comparison by Region (2016-2032)
- Figure 23: Global Safari Tourism Market Market Share Comparison by By Type (2016-2032)
- Figure 24: Global Safari Tourism Market Market Share Comparison by By Accommodation Type (2016-2032)
- Figure 25: Global Safari Tourism Market Market Share Comparison by By Group (2016-2032)
- Figure 26: Global Safari Tourism Market Market Share Comparison by By Booking Mode (2016-2032)
- Figure 27: North America Safari Tourism Market Revenue (US$ Mn) Market Share by By Typein 2022
- Figure 28: North America Safari Tourism Market Market Attractiveness Analysis by By Type, 2016-2032
- Figure 29: North America Safari Tourism Market Revenue (US$ Mn) Market Share by By Accommodation Type in 2022
- Figure 30: North America Safari Tourism Market Market Attractiveness Analysis by By Accommodation Type , 2016-2032
- Figure 31: North America Safari Tourism Market Revenue (US$ Mn) Market Share by By Groupin 2022
- Figure 32: North America Safari Tourism Market Market Attractiveness Analysis by By Group, 2016-2032
- Figure 33: North America Safari Tourism Market Revenue (US$ Mn) Market Share by By Booking Mode in 2022
- Figure 34: North America Safari Tourism Market Market Attractiveness Analysis by By Booking Mode , 2016-2032
- Figure 35: North America Safari Tourism Market Revenue (US$ Mn) Market Share by Country in 2022
- Figure 36: North America Safari Tourism Market Market Attractiveness Analysis by Country, 2016-2032
- Figure 37: North America Safari Tourism Market Market Revenue (US$ Mn) (2016-2032)
- Figure 38: North America Safari Tourism Market Market Revenue (US$ Mn) Comparison by Country (2016-2032)
- Figure 39: North America Safari Tourism Market Market Revenue (US$ Mn) Comparison by By Type (2016-2032)
- Figure 40: North America Safari Tourism Market Market Revenue (US$ Mn) Comparison by By Accommodation Type (2016-2032)
- Figure 41: North America Safari Tourism Market Market Revenue (US$ Mn) Comparison by By Group (2016-2032)
- Figure 42: North America Safari Tourism Market Market Revenue (US$ Mn) Comparison by By Booking Mode (2016-2032)
- Figure 43: North America Safari Tourism Market Market Y-o-Y Growth Rate Comparison by Country (2016-2032)
- Figure 44: North America Safari Tourism Market Market Y-o-Y Growth Rate Comparison by By Type (2016-2032)
- Figure 45: North America Safari Tourism Market Market Y-o-Y Growth Rate Comparison by By Accommodation Type (2016-2032)
- Figure 46: North America Safari Tourism Market Market Y-o-Y Growth Rate Comparison by By Group (2016-2032)
- Figure 47: North America Safari Tourism Market Market Y-o-Y Growth Rate Comparison by By Booking Mode (2016-2032)
- Figure 48: North America Safari Tourism Market Market Share Comparison by Country (2016-2032)
- Figure 49: North America Safari Tourism Market Market Share Comparison by By Type (2016-2032)
- Figure 50: North America Safari Tourism Market Market Share Comparison by By Accommodation Type (2016-2032)
- Figure 51: North America Safari Tourism Market Market Share Comparison by By Group (2016-2032)
- Figure 52: North America Safari Tourism Market Market Share Comparison by By Booking Mode (2016-2032)
- Figure 53: Western Europe Safari Tourism Market Revenue (US$ Mn) Market Share by By Typein 2022
- Figure 54: Western Europe Safari Tourism Market Market Attractiveness Analysis by By Type, 2016-2032
- Figure 55: Western Europe Safari Tourism Market Revenue (US$ Mn) Market Share by By Accommodation Type in 2022
- Figure 56: Western Europe Safari Tourism Market Market Attractiveness Analysis by By Accommodation Type , 2016-2032
- Figure 57: Western Europe Safari Tourism Market Revenue (US$ Mn) Market Share by By Groupin 2022
- Figure 58: Western Europe Safari Tourism Market Market Attractiveness Analysis by By Group, 2016-2032
- Figure 59: Western Europe Safari Tourism Market Revenue (US$ Mn) Market Share by By Booking Mode in 2022
- Figure 60: Western Europe Safari Tourism Market Market Attractiveness Analysis by By Booking Mode , 2016-2032
- Figure 61: Western Europe Safari Tourism Market Revenue (US$ Mn) Market Share by Country in 2022
- Figure 62: Western Europe Safari Tourism Market Market Attractiveness Analysis by Country, 2016-2032
- Figure 63: Western Europe Safari Tourism Market Market Revenue (US$ Mn) (2016-2032)
- Figure 64: Western Europe Safari Tourism Market Market Revenue (US$ Mn) Comparison by Country (2016-2032)
- Figure 65: Western Europe Safari Tourism Market Market Revenue (US$ Mn) Comparison by By Type (2016-2032)
- Figure 66: Western Europe Safari Tourism Market Market Revenue (US$ Mn) Comparison by By Accommodation Type (2016-2032)
- Figure 67: Western Europe Safari Tourism Market Market Revenue (US$ Mn) Comparison by By Group (2016-2032)
- Figure 68: Western Europe Safari Tourism Market Market Revenue (US$ Mn) Comparison by By Booking Mode (2016-2032)
- Figure 69: Western Europe Safari Tourism Market Market Y-o-Y Growth Rate Comparison by Country (2016-2032)
- Figure 70: Western Europe Safari Tourism Market Market Y-o-Y Growth Rate Comparison by By Type (2016-2032)
- Figure 71: Western Europe Safari Tourism Market Market Y-o-Y Growth Rate Comparison by By Accommodation Type (2016-2032)
- Figure 72: Western Europe Safari Tourism Market Market Y-o-Y Growth Rate Comparison by By Group (2016-2032)
- Figure 73: Western Europe Safari Tourism Market Market Y-o-Y Growth Rate Comparison by By Booking Mode (2016-2032)
- Figure 74: Western Europe Safari Tourism Market Market Share Comparison by Country (2016-2032)
- Figure 75: Western Europe Safari Tourism Market Market Share Comparison by By Type (2016-2032)
- Figure 76: Western Europe Safari Tourism Market Market Share Comparison by By Accommodation Type (2016-2032)
- Figure 77: Western Europe Safari Tourism Market Market Share Comparison by By Group (2016-2032)
- Figure 78: Western Europe Safari Tourism Market Market Share Comparison by By Booking Mode (2016-2032)
- Figure 79: Eastern Europe Safari Tourism Market Revenue (US$ Mn) Market Share by By Typein 2022
- Figure 80: Eastern Europe Safari Tourism Market Market Attractiveness Analysis by By Type, 2016-2032
- Figure 81: Eastern Europe Safari Tourism Market Revenue (US$ Mn) Market Share by By Accommodation Type in 2022
- Figure 82: Eastern Europe Safari Tourism Market Market Attractiveness Analysis by By Accommodation Type , 2016-2032
- Figure 83: Eastern Europe Safari Tourism Market Revenue (US$ Mn) Market Share by By Groupin 2022
- Figure 84: Eastern Europe Safari Tourism Market Market Attractiveness Analysis by By Group, 2016-2032
- Figure 85: Eastern Europe Safari Tourism Market Revenue (US$ Mn) Market Share by By Booking Mode in 2022
- Figure 86: Eastern Europe Safari Tourism Market Market Attractiveness Analysis by By Booking Mode , 2016-2032
- Figure 87: Eastern Europe Safari Tourism Market Revenue (US$ Mn) Market Share by Country in 2022
- Figure 88: Eastern Europe Safari Tourism Market Market Attractiveness Analysis by Country, 2016-2032
- Figure 89: Eastern Europe Safari Tourism Market Market Revenue (US$ Mn) (2016-2032)
- Figure 90: Eastern Europe Safari Tourism Market Market Revenue (US$ Mn) Comparison by Country (2016-2032)
- Figure 91: Eastern Europe Safari Tourism Market Market Revenue (US$ Mn) Comparison by By Type (2016-2032)
- Figure 92: Eastern Europe Safari Tourism Market Market Revenue (US$ Mn) Comparison by By Accommodation Type (2016-2032)
- Figure 93: Eastern Europe Safari Tourism Market Market Revenue (US$ Mn) Comparison by By Group (2016-2032)
- Figure 94: Eastern Europe Safari Tourism Market Market Revenue (US$ Mn) Comparison by By Booking Mode (2016-2032)
- Figure 95: Eastern Europe Safari Tourism Market Market Y-o-Y Growth Rate Comparison by Country (2016-2032)
- Figure 96: Eastern Europe Safari Tourism Market Market Y-o-Y Growth Rate Comparison by By Type (2016-2032)
- Figure 97: Eastern Europe Safari Tourism Market Market Y-o-Y Growth Rate Comparison by By Accommodation Type (2016-2032)
- Figure 98: Eastern Europe Safari Tourism Market Market Y-o-Y Growth Rate Comparison by By Group (2016-2032)
- Figure 99: Eastern Europe Safari Tourism Market Market Y-o-Y Growth Rate Comparison by By Booking Mode (2016-2032)
- Figure 100: Eastern Europe Safari Tourism Market Market Share Comparison by Country (2016-2032)
- Figure 101: Eastern Europe Safari Tourism Market Market Share Comparison by By Type (2016-2032)
- Figure 102: Eastern Europe Safari Tourism Market Market Share Comparison by By Accommodation Type (2016-2032)
- Figure 103: Eastern Europe Safari Tourism Market Market Share Comparison by By Group (2016-2032)
- Figure 104: Eastern Europe Safari Tourism Market Market Share Comparison by By Booking Mode (2016-2032)
- Figure 105: APAC Safari Tourism Market Revenue (US$ Mn) Market Share by By Typein 2022
- Figure 106: APAC Safari Tourism Market Market Attractiveness Analysis by By Type, 2016-2032
- Figure 107: APAC Safari Tourism Market Revenue (US$ Mn) Market Share by By Accommodation Type in 2022
- Figure 108: APAC Safari Tourism Market Market Attractiveness Analysis by By Accommodation Type , 2016-2032
- Figure 109: APAC Safari Tourism Market Revenue (US$ Mn) Market Share by By Groupin 2022
- Figure 110: APAC Safari Tourism Market Market Attractiveness Analysis by By Group, 2016-2032
- Figure 111: APAC Safari Tourism Market Revenue (US$ Mn) Market Share by By Booking Mode in 2022
- Figure 112: APAC Safari Tourism Market Market Attractiveness Analysis by By Booking Mode , 2016-2032
- Figure 113: APAC Safari Tourism Market Revenue (US$ Mn) Market Share by Country in 2022
- Figure 114: APAC Safari Tourism Market Market Attractiveness Analysis by Country, 2016-2032
- Figure 115: APAC Safari Tourism Market Market Revenue (US$ Mn) (2016-2032)
- Figure 116: APAC Safari Tourism Market Market Revenue (US$ Mn) Comparison by Country (2016-2032)
- Figure 117: APAC Safari Tourism Market Market Revenue (US$ Mn) Comparison by By Type (2016-2032)
- Figure 118: APAC Safari Tourism Market Market Revenue (US$ Mn) Comparison by By Accommodation Type (2016-2032)
- Figure 119: APAC Safari Tourism Market Market Revenue (US$ Mn) Comparison by By Group (2016-2032)
- Figure 120: APAC Safari Tourism Market Market Revenue (US$ Mn) Comparison by By Booking Mode (2016-2032)
- Figure 121: APAC Safari Tourism Market Market Y-o-Y Growth Rate Comparison by Country (2016-2032)
- Figure 122: APAC Safari Tourism Market Market Y-o-Y Growth Rate Comparison by By Type (2016-2032)
- Figure 123: APAC Safari Tourism Market Market Y-o-Y Growth Rate Comparison by By Accommodation Type (2016-2032)
- Figure 124: APAC Safari Tourism Market Market Y-o-Y Growth Rate Comparison by By Group (2016-2032)
- Figure 125: APAC Safari Tourism Market Market Y-o-Y Growth Rate Comparison by By Booking Mode (2016-2032)
- Figure 126: APAC Safari Tourism Market Market Share Comparison by Country (2016-2032)
- Figure 127: APAC Safari Tourism Market Market Share Comparison by By Type (2016-2032)
- Figure 128: APAC Safari Tourism Market Market Share Comparison by By Accommodation Type (2016-2032)
- Figure 129: APAC Safari Tourism Market Market Share Comparison by By Group (2016-2032)
- Figure 130: APAC Safari Tourism Market Market Share Comparison by By Booking Mode (2016-2032)
- Figure 131: Latin America Safari Tourism Market Revenue (US$ Mn) Market Share by By Typein 2022
- Figure 132: Latin America Safari Tourism Market Market Attractiveness Analysis by By Type, 2016-2032
- Figure 133: Latin America Safari Tourism Market Revenue (US$ Mn) Market Share by By Accommodation Type in 2022
- Figure 134: Latin America Safari Tourism Market Market Attractiveness Analysis by By Accommodation Type , 2016-2032
- Figure 135: Latin America Safari Tourism Market Revenue (US$ Mn) Market Share by By Groupin 2022
- Figure 136: Latin America Safari Tourism Market Market Attractiveness Analysis by By Group, 2016-2032
- Figure 137: Latin America Safari Tourism Market Revenue (US$ Mn) Market Share by By Booking Mode in 2022
- Figure 138: Latin America Safari Tourism Market Market Attractiveness Analysis by By Booking Mode , 2016-2032
- Figure 139: Latin America Safari Tourism Market Revenue (US$ Mn) Market Share by Country in 2022
- Figure 140: Latin America Safari Tourism Market Market Attractiveness Analysis by Country, 2016-2032
- Figure 141: Latin America Safari Tourism Market Market Revenue (US$ Mn) (2016-2032)
- Figure 142: Latin America Safari Tourism Market Market Revenue (US$ Mn) Comparison by Country (2016-2032)
- Figure 143: Latin America Safari Tourism Market Market Revenue (US$ Mn) Comparison by By Type (2016-2032)
- Figure 144: Latin America Safari Tourism Market Market Revenue (US$ Mn) Comparison by By Accommodation Type (2016-2032)
- Figure 145: Latin America Safari Tourism Market Market Revenue (US$ Mn) Comparison by By Group (2016-2032)
- Figure 146: Latin America Safari Tourism Market Market Revenue (US$ Mn) Comparison by By Booking Mode (2016-2032)
- Figure 147: Latin America Safari Tourism Market Market Y-o-Y Growth Rate Comparison by Country (2016-2032)
- Figure 148: Latin America Safari Tourism Market Market Y-o-Y Growth Rate Comparison by By Type (2016-2032)
- Figure 149: Latin America Safari Tourism Market Market Y-o-Y Growth Rate Comparison by By Accommodation Type (2016-2032)
- Figure 150: Latin America Safari Tourism Market Market Y-o-Y Growth Rate Comparison by By Group (2016-2032)
- Figure 151: Latin America Safari Tourism Market Market Y-o-Y Growth Rate Comparison by By Booking Mode (2016-2032)
- Figure 152: Latin America Safari Tourism Market Market Share Comparison by Country (2016-2032)
- Figure 153: Latin America Safari Tourism Market Market Share Comparison by By Type (2016-2032)
- Figure 154: Latin America Safari Tourism Market Market Share Comparison by By Accommodation Type (2016-2032)
- Figure 155: Latin America Safari Tourism Market Market Share Comparison by By Group (2016-2032)
- Figure 156: Latin America Safari Tourism Market Market Share Comparison by By Booking Mode (2016-2032)
- Figure 157: Middle East & Africa Safari Tourism Market Revenue (US$ Mn) Market Share by By Typein 2022
- Figure 158: Middle East & Africa Safari Tourism Market Market Attractiveness Analysis by By Type, 2016-2032
- Figure 159: Middle East & Africa Safari Tourism Market Revenue (US$ Mn) Market Share by By Accommodation Type in 2022
- Figure 160: Middle East & Africa Safari Tourism Market Market Attractiveness Analysis by By Accommodation Type , 2016-2032
- Figure 161: Middle East & Africa Safari Tourism Market Revenue (US$ Mn) Market Share by By Groupin 2022
- Figure 162: Middle East & Africa Safari Tourism Market Market Attractiveness Analysis by By Group, 2016-2032
- Figure 163: Middle East & Africa Safari Tourism Market Revenue (US$ Mn) Market Share by By Booking Mode in 2022
- Figure 164: Middle East & Africa Safari Tourism Market Market Attractiveness Analysis by By Booking Mode , 2016-2032
- Figure 165: Middle East & Africa Safari Tourism Market Revenue (US$ Mn) Market Share by Country in 2022
- Figure 166: Middle East & Africa Safari Tourism Market Market Attractiveness Analysis by Country, 2016-2032
- Figure 167: Middle East & Africa Safari Tourism Market Market Revenue (US$ Mn) (2016-2032)
- Figure 168: Middle East & Africa Safari Tourism Market Market Revenue (US$ Mn) Comparison by Country (2016-2032)
- Figure 169: Middle East & Africa Safari Tourism Market Market Revenue (US$ Mn) Comparison by By Type (2016-2032)
- Figure 170: Middle East & Africa Safari Tourism Market Market Revenue (US$ Mn) Comparison by By Accommodation Type (2016-2032)
- Figure 171: Middle East & Africa Safari Tourism Market Market Revenue (US$ Mn) Comparison by By Group (2016-2032)
- Figure 172: Middle East & Africa Safari Tourism Market Market Revenue (US$ Mn) Comparison by By Booking Mode (2016-2032)
- Figure 173: Middle East & Africa Safari Tourism Market Market Y-o-Y Growth Rate Comparison by Country (2016-2032)
- Figure 174: Middle East & Africa Safari Tourism Market Market Y-o-Y Growth Rate Comparison by By Type (2016-2032)
- Figure 175: Middle East & Africa Safari Tourism Market Market Y-o-Y Growth Rate Comparison by By Accommodation Type (2016-2032)
- Figure 176: Middle East & Africa Safari Tourism Market Market Y-o-Y Growth Rate Comparison by By Group (2016-2032)
- Figure 177: Middle East & Africa Safari Tourism Market Market Y-o-Y Growth Rate Comparison by By Booking Mode (2016-2032)
- Figure 178: Middle East & Africa Safari Tourism Market Market Share Comparison by Country (2016-2032)
- Figure 179: Middle East & Africa Safari Tourism Market Market Share Comparison by By Type (2016-2032)
- Figure 180: Middle East & Africa Safari Tourism Market Market Share Comparison by By Accommodation Type (2016-2032)
- Figure 181: Middle East & Africa Safari Tourism Market Market Share Comparison by By Group (2016-2032)
- Figure 182: Middle East & Africa Safari Tourism Market Market Share Comparison by By Booking Mode (2016-2032)
"
- List of Tables
- "
- Table 1: Global Safari Tourism Market Market Comparison by By Type (2016-2032)
- Table 2: Global Safari Tourism Market Market Comparison by By Accommodation Type (2016-2032)
- Table 3: Global Safari Tourism Market Market Comparison by By Group (2016-2032)
- Table 4: Global Safari Tourism Market Market Comparison by By Booking Mode (2016-2032)
- Table 5: Global Safari Tourism Market Revenue (US$ Mn) Comparison by Region (2016-2032)
- Table 6: Global Safari Tourism Market Market Revenue (US$ Mn) (2016-2032)
- Table 7: Global Safari Tourism Market Market Revenue (US$ Mn) Comparison by Region (2016-2032)
- Table 8: Global Safari Tourism Market Market Revenue (US$ Mn) Comparison by By Type (2016-2032)
- Table 9: Global Safari Tourism Market Market Revenue (US$ Mn) Comparison by By Accommodation Type (2016-2032)
- Table 10: Global Safari Tourism Market Market Revenue (US$ Mn) Comparison by By Group (2016-2032)
- Table 11: Global Safari Tourism Market Market Revenue (US$ Mn) Comparison by By Booking Mode (2016-2032)
- Table 12: Global Safari Tourism Market Market Y-o-Y Growth Rate Comparison by Region (2016-2032)
- Table 13: Global Safari Tourism Market Market Y-o-Y Growth Rate Comparison by By Type (2016-2032)
- Table 14: Global Safari Tourism Market Market Y-o-Y Growth Rate Comparison by By Accommodation Type (2016-2032)
- Table 15: Global Safari Tourism Market Market Y-o-Y Growth Rate Comparison by By Group (2016-2032)
- Table 16: Global Safari Tourism Market Market Y-o-Y Growth Rate Comparison by By Booking Mode (2016-2032)
- Table 17: Global Safari Tourism Market Market Share Comparison by Region (2016-2032)
- Table 18: Global Safari Tourism Market Market Share Comparison by By Type (2016-2032)
- Table 19: Global Safari Tourism Market Market Share Comparison by By Accommodation Type (2016-2032)
- Table 20: Global Safari Tourism Market Market Share Comparison by By Group (2016-2032)
- Table 21: Global Safari Tourism Market Market Share Comparison by By Booking Mode (2016-2032)
- Table 22: North America Safari Tourism Market Market Comparison by By Accommodation Type (2016-2032)
- Table 23: North America Safari Tourism Market Market Comparison by By Group (2016-2032)
- Table 24: North America Safari Tourism Market Market Comparison by By Booking Mode (2016-2032)
- Table 25: North America Safari Tourism Market Revenue (US$ Mn) Comparison by Country (2016-2032)
- Table 26: North America Safari Tourism Market Market Revenue (US$ Mn) (2016-2032)
- Table 27: North America Safari Tourism Market Market Revenue (US$ Mn) Comparison by Country (2016-2032)
- Table 28: North America Safari Tourism Market Market Revenue (US$ Mn) Comparison by By Type (2016-2032)
- Table 29: North America Safari Tourism Market Market Revenue (US$ Mn) Comparison by By Accommodation Type (2016-2032)
- Table 30: North America Safari Tourism Market Market Revenue (US$ Mn) Comparison by By Group (2016-2032)
- Table 31: North America Safari Tourism Market Market Revenue (US$ Mn) Comparison by By Booking Mode (2016-2032)
- Table 32: North America Safari Tourism Market Market Y-o-Y Growth Rate Comparison by Country (2016-2032)
- Table 33: North America Safari Tourism Market Market Y-o-Y Growth Rate Comparison by By Type (2016-2032)
- Table 34: North America Safari Tourism Market Market Y-o-Y Growth Rate Comparison by By Accommodation Type (2016-2032)
- Table 35: North America Safari Tourism Market Market Y-o-Y Growth Rate Comparison by By Group (2016-2032)
- Table 36: North America Safari Tourism Market Market Y-o-Y Growth Rate Comparison by By Booking Mode (2016-2032)
- Table 37: North America Safari Tourism Market Market Share Comparison by Country (2016-2032)
- Table 38: North America Safari Tourism Market Market Share Comparison by By Type (2016-2032)
- Table 39: North America Safari Tourism Market Market Share Comparison by By Accommodation Type (2016-2032)
- Table 40: North America Safari Tourism Market Market Share Comparison by By Group (2016-2032)
- Table 41: North America Safari Tourism Market Market Share Comparison by By Booking Mode (2016-2032)
- Table 42: Western Europe Safari Tourism Market Market Comparison by By Type (2016-2032)
- Table 43: Western Europe Safari Tourism Market Market Comparison by By Accommodation Type (2016-2032)
- Table 44: Western Europe Safari Tourism Market Market Comparison by By Group (2016-2032)
- Table 45: Western Europe Safari Tourism Market Market Comparison by By Booking Mode (2016-2032)
- Table 46: Western Europe Safari Tourism Market Revenue (US$ Mn) Comparison by Country (2016-2032)
- Table 47: Western Europe Safari Tourism Market Market Revenue (US$ Mn) (2016-2032)
- Table 48: Western Europe Safari Tourism Market Market Revenue (US$ Mn) Comparison by Country (2016-2032)
- Table 49: Western Europe Safari Tourism Market Market Revenue (US$ Mn) Comparison by By Type (2016-2032)
- Table 50: Western Europe Safari Tourism Market Market Revenue (US$ Mn) Comparison by By Accommodation Type (2016-2032)
- Table 51: Western Europe Safari Tourism Market Market Revenue (US$ Mn) Comparison by By Group (2016-2032)
- Table 52: Western Europe Safari Tourism Market Market Revenue (US$ Mn) Comparison by By Booking Mode (2016-2032)
- Table 53: Western Europe Safari Tourism Market Market Y-o-Y Growth Rate Comparison by Country (2016-2032)
- Table 54: Western Europe Safari Tourism Market Market Y-o-Y Growth Rate Comparison by By Type (2016-2032)
- Table 55: Western Europe Safari Tourism Market Market Y-o-Y Growth Rate Comparison by By Accommodation Type (2016-2032)
- Table 56: Western Europe Safari Tourism Market Market Y-o-Y Growth Rate Comparison by By Group (2016-2032)
- Table 57: Western Europe Safari Tourism Market Market Y-o-Y Growth Rate Comparison by By Booking Mode (2016-2032)
- Table 58: Western Europe Safari Tourism Market Market Share Comparison by Country (2016-2032)
- Table 59: Western Europe Safari Tourism Market Market Share Comparison by By Type (2016-2032)
- Table 60: Western Europe Safari Tourism Market Market Share Comparison by By Accommodation Type (2016-2032)
- Table 61: Western Europe Safari Tourism Market Market Share Comparison by By Group (2016-2032)
- Table 62: Western Europe Safari Tourism Market Market Share Comparison by By Booking Mode (2016-2032)
- Table 63: Eastern Europe Safari Tourism Market Market Comparison by By Type (2016-2032)
- Table 64: Eastern Europe Safari Tourism Market Market Comparison by By Accommodation Type (2016-2032)
- Table 65: Eastern Europe Safari Tourism Market Market Comparison by By Group (2016-2032)
- Table 66: Eastern Europe Safari Tourism Market Market Comparison by By Booking Mode (2016-2032)
- Table 67: Eastern Europe Safari Tourism Market Revenue (US$ Mn) Comparison by Country (2016-2032)
- Table 68: Eastern Europe Safari Tourism Market Market Revenue (US$ Mn) (2016-2032)
- Table 69: Eastern Europe Safari Tourism Market Market Revenue (US$ Mn) Comparison by Country (2016-2032)
- Table 70: Eastern Europe Safari Tourism Market Market Revenue (US$ Mn) Comparison by By Type (2016-2032)
- Table 71: Eastern Europe Safari Tourism Market Market Revenue (US$ Mn) Comparison by By Accommodation Type (2016-2032)
- Table 72: Eastern Europe Safari Tourism Market Market Revenue (US$ Mn) Comparison by By Group (2016-2032)
- Table 73: Eastern Europe Safari Tourism Market Market Revenue (US$ Mn) Comparison by By Booking Mode (2016-2032)
- Table 74: Eastern Europe Safari Tourism Market Market Y-o-Y Growth Rate Comparison by Country (2016-2032)
- Table 75: Eastern Europe Safari Tourism Market Market Y-o-Y Growth Rate Comparison by By Type (2016-2032)
- Table 76: Eastern Europe Safari Tourism Market Market Y-o-Y Growth Rate Comparison by By Accommodation Type (2016-2032)
- Table 77: Eastern Europe Safari Tourism Market Market Y-o-Y Growth Rate Comparison by By Group (2016-2032)
- Table 78: Eastern Europe Safari Tourism Market Market Y-o-Y Growth Rate Comparison by By Booking Mode (2016-2032)
- Table 79: Eastern Europe Safari Tourism Market Market Share Comparison by Country (2016-2032)
- Table 80: Eastern Europe Safari Tourism Market Market Share Comparison by By Type (2016-2032)
- Table 81: Eastern Europe Safari Tourism Market Market Share Comparison by By Accommodation Type (2016-2032)
- Table 82: Eastern Europe Safari Tourism Market Market Share Comparison by By Group (2016-2032)
- Table 83: Eastern Europe Safari Tourism Market Market Share Comparison by By Booking Mode (2016-2032)
- Table 84: APAC Safari Tourism Market Market Comparison by By Type (2016-2032)
- Table 85: APAC Safari Tourism Market Market Comparison by By Accommodation Type (2016-2032)
- Table 86: APAC Safari Tourism Market Market Comparison by By Group (2016-2032)
- Table 87: APAC Safari Tourism Market Market Comparison by By Booking Mode (2016-2032)
- Table 88: APAC Safari Tourism Market Revenue (US$ Mn) Comparison by Country (2016-2032)
- Table 89: APAC Safari Tourism Market Market Revenue (US$ Mn) (2016-2032)
- Table 90: APAC Safari Tourism Market Market Revenue (US$ Mn) Comparison by Country (2016-2032)
- Table 91: APAC Safari Tourism Market Market Revenue (US$ Mn) Comparison by By Type (2016-2032)
- Table 92: APAC Safari Tourism Market Market Revenue (US$ Mn) Comparison by By Accommodation Type (2016-2032)
- Table 93: APAC Safari Tourism Market Market Revenue (US$ Mn) Comparison by By Group (2016-2032)
- Table 94: APAC Safari Tourism Market Market Revenue (US$ Mn) Comparison by By Booking Mode (2016-2032)
- Table 95: APAC Safari Tourism Market Market Y-o-Y Growth Rate Comparison by Country (2016-2032)
- Table 96: APAC Safari Tourism Market Market Y-o-Y Growth Rate Comparison by By Type (2016-2032)
- Table 97: APAC Safari Tourism Market Market Y-o-Y Growth Rate Comparison by By Accommodation Type (2016-2032)
- Table 98: APAC Safari Tourism Market Market Y-o-Y Growth Rate Comparison by By Group (2016-2032)
- Table 99: APAC Safari Tourism Market Market Y-o-Y Growth Rate Comparison by By Booking Mode (2016-2032)
- Table 100: APAC Safari Tourism Market Market Share Comparison by Country (2016-2032)
- Table 101: APAC Safari Tourism Market Market Share Comparison by By Type (2016-2032)
- Table 102: APAC Safari Tourism Market Market Share Comparison by By Accommodation Type (2016-2032)
- Table 103: APAC Safari Tourism Market Market Share Comparison by By Group (2016-2032)
- Table 104: APAC Safari Tourism Market Market Share Comparison by By Booking Mode (2016-2032)
- Table 105: Latin America Safari Tourism Market Market Comparison by By Type (2016-2032)
- Table 106: Latin America Safari Tourism Market Market Comparison by By Accommodation Type (2016-2032)
- Table 107: Latin America Safari Tourism Market Market Comparison by By Group (2016-2032)
- Table 108: Latin America Safari Tourism Market Market Comparison by By Booking Mode (2016-2032)
- Table 109: Latin America Safari Tourism Market Revenue (US$ Mn) Comparison by Country (2016-2032)
- Table 110: Latin America Safari Tourism Market Market Revenue (US$ Mn) (2016-2032)
- Table 111: Latin America Safari Tourism Market Market Revenue (US$ Mn) Comparison by Country (2016-2032)
- Table 112: Latin America Safari Tourism Market Market Revenue (US$ Mn) Comparison by By Type (2016-2032)
- Table 113: Latin America Safari Tourism Market Market Revenue (US$ Mn) Comparison by By Accommodation Type (2016-2032)
- Table 114: Latin America Safari Tourism Market Market Revenue (US$ Mn) Comparison by By Group (2016-2032)
- Table 115: Latin America Safari Tourism Market Market Revenue (US$ Mn) Comparison by By Booking Mode (2016-2032)
- Table 116: Latin America Safari Tourism Market Market Y-o-Y Growth Rate Comparison by Country (2016-2032)
- Table 117: Latin America Safari Tourism Market Market Y-o-Y Growth Rate Comparison by By Type (2016-2032)
- Table 118: Latin America Safari Tourism Market Market Y-o-Y Growth Rate Comparison by By Accommodation Type (2016-2032)
- Table 119: Latin America Safari Tourism Market Market Y-o-Y Growth Rate Comparison by By Group (2016-2032)
- Table 120: Latin America Safari Tourism Market Market Y-o-Y Growth Rate Comparison by By Booking Mode (2016-2032)
- Table 121: Latin America Safari Tourism Market Market Share Comparison by Country (2016-2032)
- Table 122: Latin America Safari Tourism Market Market Share Comparison by By Type (2016-2032)
- Table 123: Latin America Safari Tourism Market Market Share Comparison by By Accommodation Type (2016-2032)
- Table 124: Latin America Safari Tourism Market Market Share Comparison by By Group (2016-2032)
- Table 125: Latin America Safari Tourism Market Market Share Comparison by By Booking Mode (2016-2032)
- Table 126: Middle East & Africa Safari Tourism Market Market Comparison by By Type (2016-2032)
- Table 127: Middle East & Africa Safari Tourism Market Market Comparison by By Accommodation Type (2016-2032)
- Table 128: Middle East & Africa Safari Tourism Market Market Comparison by By Group (2016-2032)
- Table 129: Middle East & Africa Safari Tourism Market Market Comparison by By Booking Mode (2016-2032)
- Table 130: Middle East & Africa Safari Tourism Market Revenue (US$ Mn) Comparison by Country (2016-2032)
- Table 131: Middle East & Africa Safari Tourism Market Market Revenue (US$ Mn) (2016-2032)
- Table 132: Middle East & Africa Safari Tourism Market Market Revenue (US$ Mn) Comparison by Country (2016-2032)
- Table 133: Middle East & Africa Safari Tourism Market Market Revenue (US$ Mn) Comparison by By Type (2016-2032)
- Table 134: Middle East & Africa Safari Tourism Market Market Revenue (US$ Mn) Comparison by By Accommodation Type (2016-2032)
- Table 135: Middle East & Africa Safari Tourism Market Market Revenue (US$ Mn) Comparison by By Group (2016-2032)
- Table 136: Middle East & Africa Safari Tourism Market Market Revenue (US$ Mn) Comparison by By Booking Mode (2016-2032)
- Table 137: Middle East & Africa Safari Tourism Market Market Y-o-Y Growth Rate Comparison by Country (2016-2032)
- Table 138: Middle East & Africa Safari Tourism Market Market Y-o-Y Growth Rate Comparison by By Type (2016-2032)
- Table 139: Middle East & Africa Safari Tourism Market Market Y-o-Y Growth Rate Comparison by By Accommodation Type (2016-2032)
- Table 140: Middle East & Africa Safari Tourism Market Market Y-o-Y Growth Rate Comparison by By Group (2016-2032)
- Table 141: Middle East & Africa Safari Tourism Market Market Y-o-Y Growth Rate Comparison by By Booking Mode (2016-2032)
- Table 142: Middle East & Africa Safari Tourism Market Market Share Comparison by Country (2016-2032)
- Table 143: Middle East & Africa Safari Tourism Market Market Share Comparison by By Type (2016-2032)
- Table 144: Middle East & Africa Safari Tourism Market Market Share Comparison by By Accommodation Type (2016-2032)
- Table 145: Middle East & Africa Safari Tourism Market Market Share Comparison by By Group (2016-2032)
- Table 146: Middle East & Africa Safari Tourism Market Market Share Comparison by By Booking Mode (2016-2032)
- 1. Executive Summary
-
- Wilderness
- Thomas Cook Group
- Singita
- Scott Dunn Ltd.
- Rothschild Safaris
- &Beyond
- Travcoa Tours & Safaris
- Abercrombie & Kent USA, LLC
- Gamewatchers Safaris Ltd.
- Backroads
- TUI Group
Our Clients


View Our Licence Options
