
Robo Advisory Market By Service Type (Direct Plan-based/Goal-based, Comprehensive Wealth Advisory), By Business Model (Pure Robo Advisors, Hybrid Robo Advisors), By Provider (Fintech Robo Advisors, Banks, Traditional Wealth Managers, Others), By End User (Retail Investor, High Net Worth Individuals (HNIs)), By Region And Companies - Industry Segment Outlook, Market Assessment, Competition Scenario, Trends, And Forecast 2024-2033
-
51215
-
September 2024
-
300
-


-
This report was compiled by Vishwa Gaul Vishwa is an experienced market research and consulting professional with over 8 years of expertise in the ICT industry, contributing to over 700 reports across telecommunications, software, hardware, and digital solutions. Correspondence Team Lead- ICT Linkedin | Detailed Market research Methodology Our methodology involves a mix of primary research, including interviews with leading mental health experts, and secondary research from reputable medical journals and databases. View Detailed Methodology Page
-
Quick Navigation
Report Overview
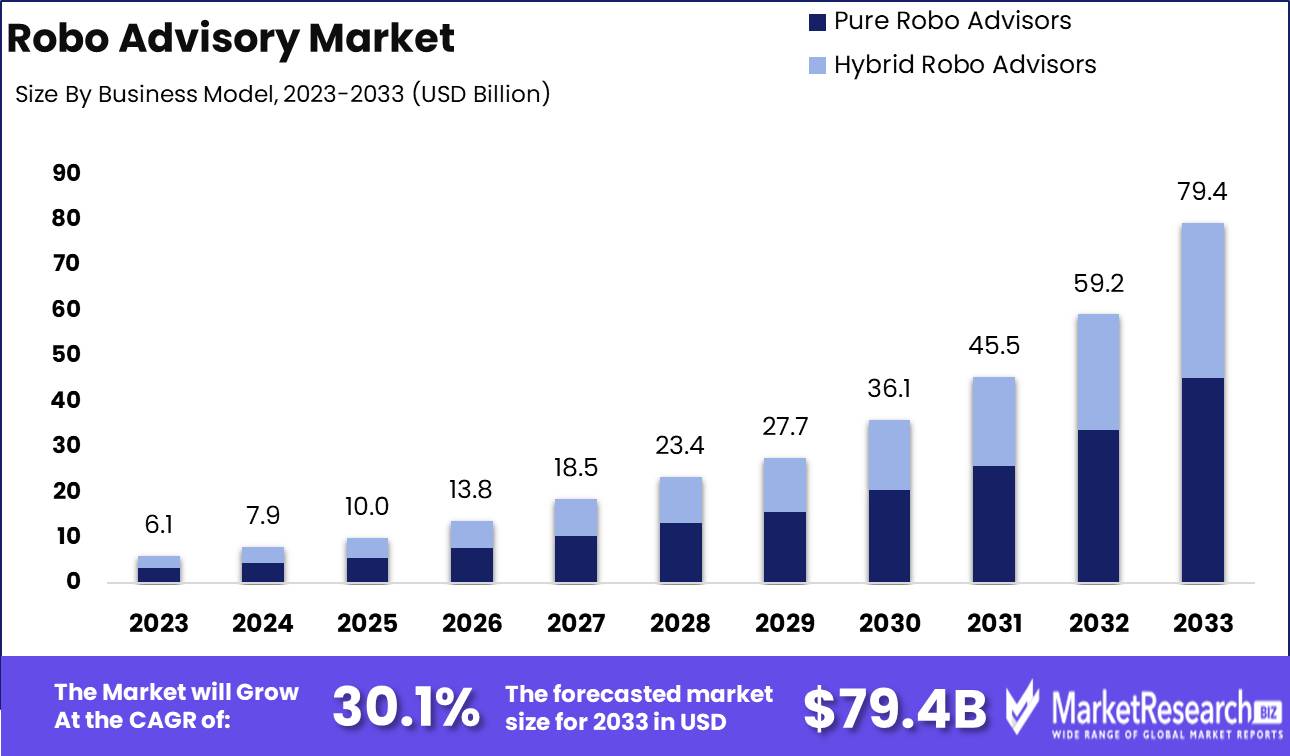
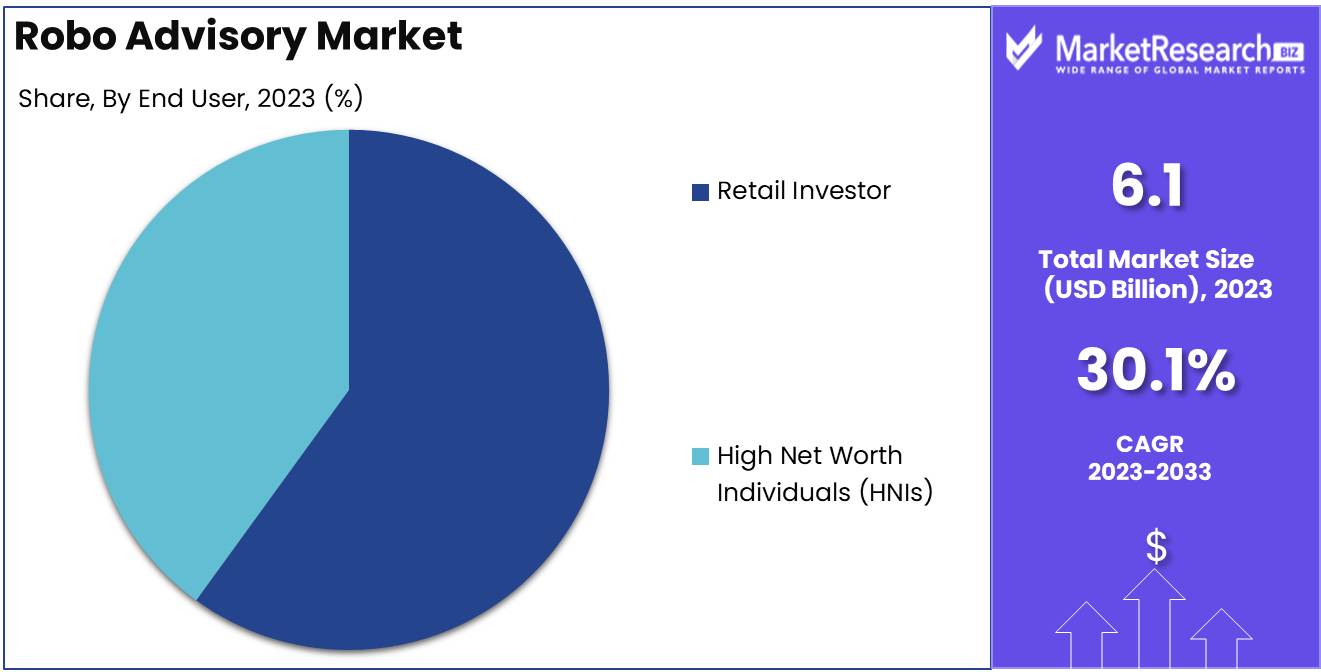
The Robo Advisory Market was valued at USD 6.1 billion in 2023. It is expected to reach USD 79.4 billion by 2033, with a CAGR of 30.1% during the forecast period from 2024 to 2033.
The Robo Advisory Market refers to the automated investment platforms that use advanced algorithms and data analytics to provide personalized financial advice and portfolio management. These platforms operate with minimal human intervention, offering cost-effective and scalable solutions for investment planning, retirement management, and wealth optimization. Leveraging AI and machine learning, robo-advisors assess individual risk tolerance, goals, and preferences to create tailored portfolios.
The Robo Advisory market is poised for significant growth, driven by increasing digital adoption and advancements in artificial intelligence (AI) and algorithmic technologies. As investors become more comfortable with digital platforms and mobile solutions, robo-advisors are gaining traction by offering personalized, cost-effective investment strategies. These platforms leverage AI to analyze vast datasets, optimize asset allocations, and deliver tailored financial advice, making them attractive to both novice and experienced investors. However, the lack of human touch remains a notable drawback, especially for clients seeking personalized attention and emotional reassurance during market volatility. To address this, hybrid models that combine automated algorithms with human advisors are expected to rise, offering a balanced solution between efficiency and personalized service.
Moreover, the growing demand for diversified financial products and services is driving robo advisors to expand their offerings, including tax-loss harvesting, retirement planning, and socially responsible investment portfolios. These new product offerings are critical as they cater to a broader range of customer preferences and financial goals. The market is expected to witness further innovation as companies strive to differentiate themselves in an increasingly competitive landscape. Overall, the confluence of digital adoption, AI advancements, and evolving customer expectations positions the Robo Advisory market for robust growth, though addressing the need for human interaction and offering diversified products will be essential to sustaining long-term success.
Key Takeaways
- Market Growth: The Robo Advisory Market was valued at USD 6.1 billion in 2023. It is expected to reach USD 79.4 billion by 2033, with a CAGR of 30.1% during the forecast period from 2024 to 2033.
- By Service Type: Direct Plan-based services dominated the Robo Advisory Market.
- By Business Model: Pure Robo Advisors dominated the market with cost-effective automation.
- By Provider: Fintech Robo Advisors dominated the diversified Robo Advisory Market.
- By End User: Retail Investors dominated the robo-advisory market by volume.
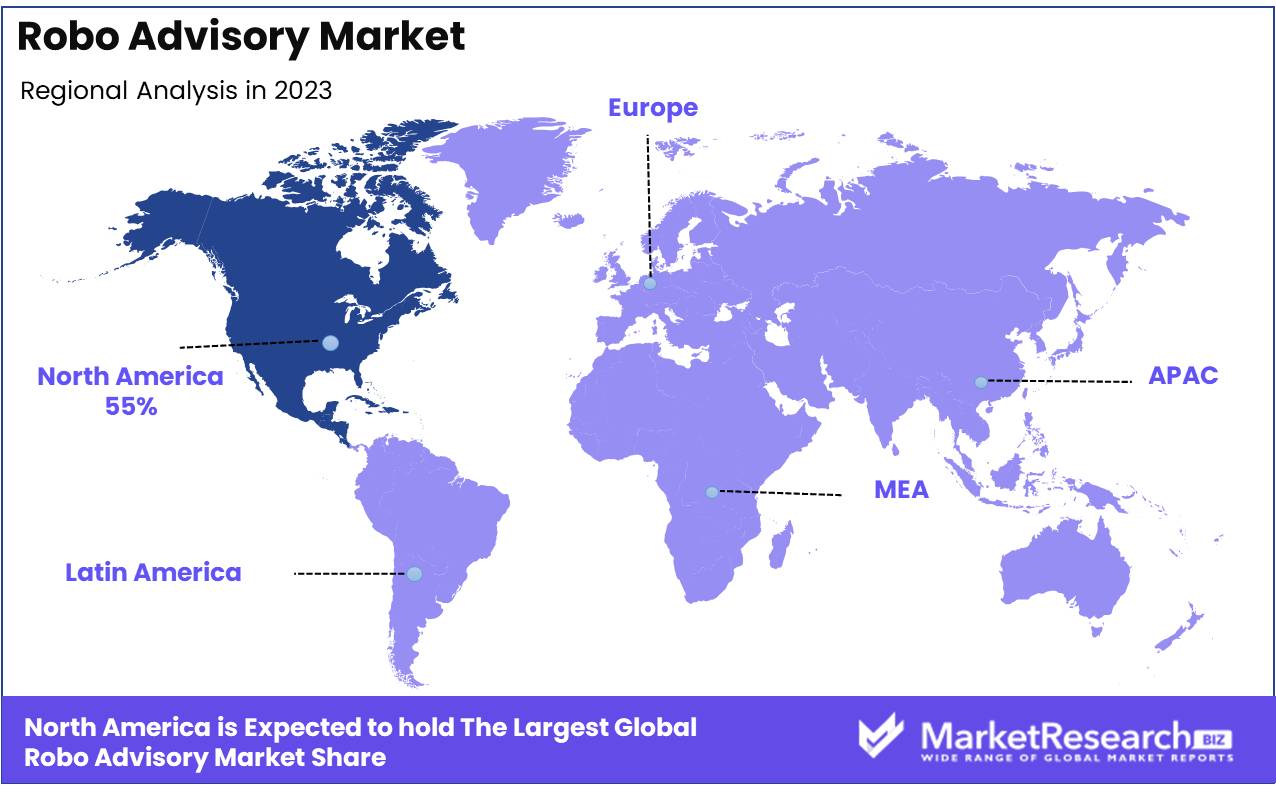
- Regional Dominance: North America dominates the robo-advisory market with a 55% largest market share.
- Growth Opportunity: The global robo-advisory market is poised for significant growth, driven by increasing retail investor demand and strategic partnerships enhancing digital advisory capabilities and customer experience.
Driving factors
Increasing Internet Penetration Fuels Wider Access to Robo-Advisory Services
The proliferation of internet access worldwide has been a key driver for expanding the robo-advisory market. As global internet penetration rises reaching 67% in 2023, according to recent studies the accessibility to digital financial platforms has significantly improved. This development allows individuals from various geographic regions and socio-economic backgrounds to engage with robo-advisory services more conveniently. By reducing the barriers to entry, more potential investors, particularly from underserved markets, can now benefit from automated financial management solutions.
In particular, emerging markets are witnessing a surge in internet usage, providing a growing base of tech-savvy consumers looking for easy-to-use, cost-effective investment tools. This expanding internet access enables providers to tap into a larger pool of customers, leading to the democratization of wealth management and fostering the broader adoption of robo-advisory platforms.
Advancements in Technology Enhance the Efficiency and Personalization of Robo-Advisors
Technological advancements have revolutionized the capabilities of robo-advisors, contributing directly to the market's growth. Integrating artificial intelligence (AI), machine learning, and big data analytics enables robo-advisory platforms to deliver more accurate and tailored financial recommendations. AI-driven algorithms can now analyze vast amounts of financial data to offer customized investment advice based on individual risk profiles, financial goals, and market conditions.
Moreover, advancements in natural language processing and automation have improved user experience by providing seamless interactions through chatbots and digital interfaces. These innovations help simplify complex investment processes, making robo-advisory platforms more appealing to a broader customer base, including less-experienced investors. As a result, technological improvements not only enhance the service quality but also reduce operational costs, further attracting investors to these platforms.
Shift Towards Digital Financial Services Drives Adoption of Robo-Advisors
The ongoing shift from traditional financial services to digital platforms has been instrumental in accelerating the growth of the robo-advisory market. The global digital banking user base is expected to reach 3.6 billion by 2024, reflecting the rapid consumer adoption of online financial services. This transformation is driven by consumer preferences for convenience, lower fees, and greater accessibility, all of which align with the core offerings of robo-advisory platforms.
Additionally, the COVID-19 pandemic has significantly boosted the demand for digital financial solutions, as lockdowns and social distancing measures pushed consumers to manage their finances online. Robo-advisors have capitalized on this trend, providing automated, 24/7 financial management services that appeal to the growing number of individuals seeking digital solutions. The shift towards digitalization also encourages traditional financial institutions to incorporate or partner with robo-advisors, further expanding the market's reach and adoption.
Restraining Factors
Security Risks: A Barrier to Adoption and Market Trust
Security risks represent a critical restraining factor in the growth of the robo-advisory market, as concerns about cyberattacks, hacking, and data breaches have heightened over time. The reliance on digital platforms for financial management makes robo-advisors highly vulnerable to cyber threats, and the financial sector is historically one of the most targeted industries. According to a 2023 report, cybercrime is expected to cost the global economy $8 trillion annually, with the financial services industry particularly at risk.
These security risks directly impact customer trust, which is essential for the adoption of robo-advisory services. Potential clients may be hesitant to transfer significant portions of their assets to digital platforms without clear assurances of data security and robust encryption measures. Additionally, frequent reports of data breaches erode trust and negatively affect brand reputation, leading to reduced adoption rates. Even existing users may reconsider their usage due to perceived vulnerabilities, creating potential customer attrition and stifling market expansion.
Data Privacy Concerns: Eroding Consumer Confidence in Robo-Advisory Platforms
Data privacy concerns further compound the security risks in the robo-advisory market, acting as another significant obstacle to market growth. The increasing demand for personalization in financial advice requires the collection of sensitive personal and financial information, which raises concerns about how this data is stored, processed, and potentially shared with third parties.
In regions such as the European Union, stringent regulations like the General Data Protection Regulation (GDPR) impose severe penalties for non-compliance, and consumers are becoming increasingly aware of their privacy rights. In fact, a 2022 survey revealed that over 60% of individuals in Europe are reluctant to share personal information with financial institutions due to privacy concerns. In the U.S., similar concerns have surfaced, with 50% of consumers expressing reservations about the transparency of data handling by financial platforms.
These privacy concerns have led to regulatory scrutiny, slowing the approval processes for new entrants into the market. Furthermore, increasing pressure from regulatory bodies to comply with data protection standards adds operational costs for robo-advisory firms, which may slow down innovation and reduce profitability. As a result, these concerns collectively act as a deterrent to new user acquisition, limiting the market's overall growth potential.
By Service Type Analysis
In 2023, Direct Plan-based services dominated the Robo Advisory Market.
In 2023, Direct Plan-based services held a dominant market position in the By Service Type segment of the Robo Advisory Market, particularly outperforming other segments in terms of adoption and user engagement. The Direct Plan-based approach, which allows users to invest directly in mutual funds without intermediaries, gained significant traction due to its cost-effectiveness and transparent fee structure. This growth can be attributed to increasing consumer awareness of low-cost investment options and the rising demand for digital financial solutions. Moreover, Direct Plan-based robo-advisors appeal to tech-savvy investors looking for simplified, self-directed investing tools that provide personalized financial recommendations.
On the other hand, Goal-based services also saw substantial growth, particularly among investors seeking long-term financial planning assistance. These platforms focus on helping users achieve specific financial goals, such as retirement or education, through personalized investment strategies. While Goal-based services offer more comprehensive wealth advisory capabilities, their slightly higher fees compared to Direct Plan-based services limited their adoption to a smaller yet loyal customer base.
Overall, the Robo Advisory Market continues to expand, driven by the increasing digitalization of financial services and growing investor preferences for cost-efficient, automated solutions.
By Business Model Analysis
In 2023, Pure Robo Advisors dominated the market with cost-effective automation.
In 2023, Pure Robo Advisors held a dominant market position in the By Business Model segment of the Robo Advisory Market, capturing significant market share due to their cost-effective, fully automated services. These advisors, which operate without human intervention, have become particularly attractive to cost-sensitive and tech-savvy investors. The scalability of their algorithms, combined with a low-fee structure, allows them to cater to a broad demographic, contributing to their widespread adoption. Additionally, the advancements in artificial intelligence and machine learning have enabled these platforms to offer increasingly sophisticated portfolio management solutions, further enhancing their appeal.
On the other hand, Hybrid Robo Advisors, which integrate human advisors with AI-driven recommendations, have also gained traction by offering a blend of automated efficiency and personalized service. This model appeals to clients seeking a more tailored financial planning experience, particularly in complex financial situations where human expertise is valued. While Hybrid models are growing, they typically cater to higher-net-worth individuals who prioritize a personalized approach, positioning Pure Robo Advisors to continue leading in the overall market by volume and accessibility.
By Provider Analysis
In 2023, Fintech Robo Advisors dominated the diversified Robo Advisory Market.
In 2023, Fintech Robo Advisors held a dominant market position in the By Provider segment of the Robo Advisory Market. This category, encompassing technology-driven platforms, benefitted from their agility, cost-efficiency, and broader market accessibility. Fintech firms capitalized on automation, AI algorithms, and data-driven insights to provide personalized wealth management at lower costs, appealing to both novice and experienced investors.
Banks, on the other hand, have increasingly integrated robo-advisory services, leveraging their existing client base and trust to offer hybrid models combining human advisory with automated solutions. Their position is bolstered by their ability to cross-sell financial services and provide stability.
Traditional Wealth Managers faced pressure from the growing fintech presence but sought to maintain competitiveness by offering tailored, high-touch services for high-net-worth individuals (HNWIs), incorporating robo-advisory tools as complementary offerings.
Lastly, Others, including independent financial advisors and niche market players, occupied a smaller share but often targeted specific market needs, such as ethical investing or niche portfolios, appealing to a unique investor segment. This diversification contributed to the competitive dynamics within the segment.
By End User Analysis
In 2023, Retail Investors dominated the robo-advisory market by volume.
In 2023, Retail Investors held a dominant market position in the By End User segment of the Robo Advisory Market. The increasing adoption of digital financial services among individual investors contributed significantly to this growth. Retail investors were attracted by the low-cost, user-friendly platforms offered by robo-advisory services, which have democratized access to sophisticated portfolio management strategies. Furthermore, the growing awareness of the benefits of automated financial planning tools, such as diversification and personalized investment strategies, positioned retail investors as key users of these technologies.
On the other hand, High Net Worth Individuals (HNWIs) exhibited steady growth in their adoption of robo-advisors, driven by the integration of hybrid models that combine automated services with human financial advisory. HNWIs, traditionally reliant on personalized financial advisors, have begun to leverage the efficiency and lower fees offered by robo-advisory solutions, particularly for portfolio diversification. However, despite increasing interest from HNWIs, retail investors continued to command a larger market share due to their sheer volume and the accessibility of robo-advisory platforms tailored to non-institutional clients.
Key Market Segments
By Service Type
- Direct Plan-based/Goal-based
- Comprehensive Wealth Advisory
By Business Model
- Pure Robo Advisors
- Hybrid Robo Advisors
By Provider
- Fintech Robo Advisors
- Banks
- Traditional Wealth Managers
- Others
By End User
- Retail Investor
- High Net Worth Individuals (HNIs)
Growth Opportunity
Increased Demand from Retail Investors
The global robo-advisory market is expected to witness significant growth driven primarily by the rising demand from retail investors. The increasing shift toward digital platforms and the democratization of financial services have made robo-advisors a popular choice among retail clients. As more investors seek low-cost, automated financial management tools, the market is poised to expand further. This trend is particularly prominent among younger generations, who prefer digital solutions for financial planning. According to industry reports, retail investors account for a growing share of assets managed by robo-advisory platforms, indicating sustained growth potential in this segment.
Partnerships and Collaborations
Strategic partnerships and collaborations are emerging as critical factors in the expansion of the global robo-advisory market. Leading financial institutions are increasingly partnering with fintech companies to enhance their digital advisory capabilities. These collaborations allow traditional banks to leverage the advanced technologies of robo-advisory platforms, providing seamless, cost-efficient services to their clientele. For example, partnerships between established asset management firms and robo-advisory startups are enabling firms to diversify their offerings and improve customer acquisition. Furthermore, collaborations with technology firms are expected to enhance the user experience, improve data analytics, and enable personalized financial solutions, further fueling market growth.
Latest Trends
Partnerships with Traditional Financial Institutions
The significant trend in the robo-advisory market is the continued partnership between robo-advisory platforms and traditional financial institutions. This collaboration is driven by the need for established banks and investment firms to offer more digital-first solutions to their clients. These partnerships provide robo-advisory firms with access to a broader customer base, while traditional institutions gain the technological infrastructure necessary to remain competitive. The result is a hybrid model where human advisors and robo-advisors coexist, catering to a diverse range of investors from high-net-worth individuals to mass-market customers. This trend is expected to strengthen as more financial institutions recognize the value of automated investment solutions.
Increased Accessibility and Affordability
The democratization of financial services continues to be a dominant trend with robo-advisors becoming more accessible and affordable to the average consumer. By leveraging advancements in artificial intelligence and machine learning, robo-advisory platforms can lower management fees and minimum investment requirements, making them appealing to younger, tech-savvy investors who prioritize cost-effectiveness. This trend is particularly evident in emerging markets where traditional financial services are less accessible. By providing low-cost, automated financial advice, robo-advisors are expanding their reach into underserved demographics, driving growth in both user adoption and assets under management (AUM).
Regional Analysis
North America dominates the robo-advisory market with a 55% largest market share.
The global robo-advisory market is segmented into key regions: North America, Europe, Asia Pacific, Latin America, and the Middle East & Africa. North America dominates the market, accounting for over 55% of the global market share in 2023, driven by the presence of advanced financial services, widespread adoption of fintech solutions, and high penetration of robo-advisors among individual investors. The U.S. leads this growth, supported by a robust technological infrastructure and an increasing preference for low-cost investment solutions.
Europe follows closely, with countries like the UK and Germany emerging as significant contributors, primarily due to regulatory advancements and the increasing inclination toward automated investment management. The region’s market share is estimated at around 25% in 2023, bolstered by rising awareness of digital financial services.
Asia Pacific is witnessing rapid growth, projected to grow at a CAGR of over 25% from 2023 to 2028. Key markets include China, Japan, and Australia, where increasing wealth management demand and digital transformation in the financial sector are key drivers. Governments’ pro-digital initiatives further enhance this expansion.
The Latin American robo-advisory market, though nascent, shows promising potential, driven by increasing smartphone penetration and financial inclusion efforts, particularly in Brazil and Mexico. The Middle East & Africa is also expanding, albeit at a slower pace, with fintech developments in the UAE and South Africa leading the regional growth.
Key Regions and Countries
North America
- The US
- Canada
- Rest of North America
Europe
- Germany
- France
- The UK
- Spain
- Netherlands
- Russia
- Italy
- Rest of Europe
Asia-Pacific
- China
- Japan
- Singapore
- Thailand
- South Korea
- Vietnam
- India
- New Zealand
- Rest of Asia Pacific
Latin America
- Mexico
- Brazil
- Rest of Latin America
Middle East & Africa
- Saudi Arabia
- South Africa
- UAE
- Rest of the Middle East & Africa
Key Players Analysis
The global Robo-Advisory market is poised for significant growth, driven by advancements in AI technologies, increasing demand for cost-effective investment solutions, and expanding financial literacy among younger demographics. Key players such as Betterment LLC and Wealthfront Corporation continue to lead the market, leveraging sophisticated algorithms and data analytics to provide personalized investment strategies. Both firms have established strong brand recognition and trust, particularly among tech-savvy investors seeking automated, low-cost portfolio management.
The Vanguard Group, Inc. and The Charles Schwab Corporation represent traditional financial giants transitioning effectively into the robo-advisory space. Their established client base, coupled with their wealth of experience in financial management, positions them as formidable competitors, particularly for investors preferring a hybrid approach combining human and automated advice.
Emerging players like Fincite GmbH, Ginmon Vermögensverwaltung GmbH, and Wealthify Limited are gaining traction in Europe, offering customized digital solutions tailored to specific regulatory environments and customer needs. Meanwhile, Ellevest, Inc. is carving out a niche by focusing on gender-based financial solutions, tapping into the underserved female investor segment.
Tech-driven firms such as SoFi Technologies, Inc. and SigFig Wealth Management, LLC are expected to drive innovation in the sector, offering integrated platforms that combine robo-advisory services with broader financial products, including loans and banking services.
Overall, the competitive landscape is dynamic, with established financial institutions and fintech startups coexisting and pushing the boundaries of automation, personalization, and affordability in wealth management.
Market Key Players
- Betterment LLC
- Fincite Gmbh
- Wealthfront Corporation
- The Vanguard Group, Inc.
- The Charles Schwab Corporation
- Ellevest, Inc.
- Ginmon Vermögensverwaltung GmbH
- Wealthify Limited
- SoFi Technologies, Inc.
- SigFig Wealth Management, LLC
- Empirica
- Social Finance, Inc.
- Axos Financial, Inc.
Recent Development
- In May 2024, J.P. Morgan launched a hybrid robo-advisor, combining digital efficiency with human financial expertise. This service, aimed at wealth management clients, provides continuous access to both algorithm-driven investment tools and personalized advice from human advisors. It targets existing banking and credit card customers, broadening J.P. Morgan’s digital wealth management offerings
- In April 2024, Revolut, a global financial super-app, introduced its robo-advisory services in the U.S. market. The platform provides cost-effective, automated investment solutions with diversified portfolios based on risk tolerance, aiming to simplify investment management for U.S. customers. This move aligns with Revolute's broader goal of expanding its financial services globally
- In February 2024, Hedgehog, a crypto-focused robo-advisor, partnered with CoinDesk Indices to offer automated investment services across multiple digital asset sectors. This collaboration integrates the CoinDesk Market Select Index, allowing users access to sectors like decentralized finance (DeFi), smart contracts, and digital currencies, expanding the options for crypto investors.
Report Scope
Report Features Description Market Value (2023) USD 6.1 Billion Forecast Revenue (2033) USD 79.4 Billion CAGR (2024-2032) 30.1% Base Year for Estimation 2023 Historic Period 2016-2023 Forecast Period 2024-2033 Report Coverage Revenue Forecast, Market Dynamics, COVID-19 Impact, Competitive Landscape, Recent Developments Segments Covered By Service Type (Direct Plan-based/Goal-based, Comprehensive Wealth Advisory), By Business Model (Pure Robo Advisors, Hybrid Robo Advisors), By Provider (Fintech Robo Advisors, Banks, Traditional Wealth Managers, Others), By End User (Retail Investor, High Net Worth Individuals (HNIs)) Regional Analysis North America - The US, Canada, Rest of North America, Europe - Germany, France, The UK, Spain, Italy, Russia, Netherlands, Rest of Europe, Asia-Pacific - China, Japan, South Korea, India, New Zealand, Singapore, Thailand, Vietnam, Rest of Asia Pacific, Latin America - Brazil, Mexico, Rest of Latin America, Middle East & Africa - South Africa, Saudi Arabia, UAE, Rest of Middle East & Africa Competitive Landscape Betterment LLC, Fincite Gmbh, Wealthfront Corporation, The Vanguard Group, Inc., The Charles Schwab Corporation, Ellevest, Inc., Ginmon Vermögensverwaltung GmbH, Wealthify Limited, SoFi Technologies, Inc., SigFig Wealth Management, LLC, Empirica, Social Finance, Inc., Axos Financial, Inc. Customization Scope Customization for segments, region/country-level will be provided. Moreover, additional customization can be done based on the requirements. Purchase Options We have three licenses to opt for Single User License, Multi-User License (Up to 5 Users), Corporate Use License (Unlimited User and Printable PDF) -
- 1. Executive Summary
- 1.1. Definition
- 1.2. Taxonomy
- 1.3. Research Scope
- 1.4. Key Analysis
- 1.5. Key Findings by Major Segments
- 1.6. Top strategies by Major Players
- 2. Global Robo Advisory Market Overview
- 2.1. Robo Advisory Market Dynamics
- 2.1.1. Drivers
- 2.1.2. Opportunities
- 2.1.3. Restraints
- 2.1.4. Challenges
- 2.2. Macro-economic Factors
- 2.3. Regulatory Framework
- 2.4. Market Investment Feasibility Index
- 2.5. PEST Analysis
- 2.6. PORTER’S Five Force Analysis
- 2.7. Drivers & Restraints Impact Analysis
- 2.8. Industry Chain Analysis
- 2.9. Cost Structure Analysis
- 2.10. Marketing Strategy
- 2.11. Russia-Ukraine War Impact Analysis
- 2.12. Opportunity Map Analysis
- 2.13. Market Competition Scenario Analysis
- 2.14. Product Life Cycle Analysis
- 2.15. Opportunity Orbits
- 2.16. Manufacturer Intensity Map
- 2.17. Major Companies sales by Value & Volume
- 2.1. Robo Advisory Market Dynamics
- 3. Global Robo Advisory Market Analysis, Opportunity and Forecast, 2016-2032
- 3.1. Global Robo Advisory Market Analysis, 2016-2021
- 3.2. Global Robo Advisory Market Opportunity and Forecast, 2023-2032
- 3.3. Global Robo Advisory Market Analysis, Opportunity and Forecast, By Service Type, 2016-2032
- 3.3.1. Global Robo Advisory Market Analysis by Service Type: Introduction
- 3.3.2. Market Size Absolute $ Opportunity Analysis and Forecast, By Service Type, 2016-2032
- 3.3.3. Direct Plan-based/Goal-based
- 3.3.4. Comprehensive Wealth Advisory
- 3.4. Global Robo Advisory Market Analysis, Opportunity and Forecast, By Business Model, 2016-2032
- 3.4.1. Global Robo Advisory Market Analysis by Business Model: Introduction
- 3.4.2. Market Size Absolute $ Opportunity Analysis and Forecast, By Business Model, 2016-2032
- 3.4.3. Pure Robo Advisors
- 3.4.4. Hybrid Robo Advisors
- 3.5. Global Robo Advisory Market Analysis, Opportunity and Forecast, By Provider, 2016-2032
- 3.5.1. Global Robo Advisory Market Analysis by Provider: Introduction
- 3.5.2. Market Size Absolute $ Opportunity Analysis and Forecast, By Provider, 2016-2032
- 3.5.3. Fintech Robo Advisors
- 3.5.4. Banks
- 3.5.5. Traditional Wealth Managers
- 3.5.6. Others
- 3.6. Global Robo Advisory Market Analysis, Opportunity and Forecast, By End User, 2016-2032
- 3.6.1. Global Robo Advisory Market Analysis by End User: Introduction
- 3.6.2. Market Size Absolute $ Opportunity Analysis and Forecast, By End User, 2016-2032
- 3.6.3. Retail Investor
- 3.6.4. High Net Worth Individuals (HNIs)
- 4. North America Robo Advisory Market Analysis, Opportunity and Forecast, 2016-2032
- 4.1. North America Robo Advisory Market Analysis, 2016-2021
- 4.2. North America Robo Advisory Market Opportunity and Forecast, 2023-2032
- 4.3. North America Robo Advisory Market Analysis, Opportunity and Forecast, By Service Type, 2016-2032
- 4.3.1. North America Robo Advisory Market Analysis by Service Type: Introduction
- 4.3.2. Market Size Absolute $ Opportunity Analysis and Forecast, By Service Type, 2016-2032
- 4.3.3. Direct Plan-based/Goal-based
- 4.3.4. Comprehensive Wealth Advisory
- 4.4. North America Robo Advisory Market Analysis, Opportunity and Forecast, By Business Model, 2016-2032
- 4.4.1. North America Robo Advisory Market Analysis by Business Model: Introduction
- 4.4.2. Market Size Absolute $ Opportunity Analysis and Forecast, By Business Model, 2016-2032
- 4.4.3. Pure Robo Advisors
- 4.4.4. Hybrid Robo Advisors
- 4.5. North America Robo Advisory Market Analysis, Opportunity and Forecast, By Provider, 2016-2032
- 4.5.1. North America Robo Advisory Market Analysis by Provider: Introduction
- 4.5.2. Market Size Absolute $ Opportunity Analysis and Forecast, By Provider, 2016-2032
- 4.5.3. Fintech Robo Advisors
- 4.5.4. Banks
- 4.5.5. Traditional Wealth Managers
- 4.5.6. Others
- 4.6. North America Robo Advisory Market Analysis, Opportunity and Forecast, By End User, 2016-2032
- 4.6.1. North America Robo Advisory Market Analysis by End User: Introduction
- 4.6.2. Market Size Absolute $ Opportunity Analysis and Forecast, By End User, 2016-2032
- 4.6.3. Retail Investor
- 4.6.4. High Net Worth Individuals (HNIs)
- 4.7. North America Robo Advisory Market Analysis, Opportunity and Forecast, By Country , 2016-2032
- 4.7.1. North America Robo Advisory Market Analysis by Country : Introduction
- 4.7.2. Market Size Absolute $ Opportunity Analysis and Forecast, Country , 2016-2032
- 4.7.2.1. The US
- 4.7.2.2. Canada
- 4.7.2.3. Mexico
- 5. Western Europe Robo Advisory Market Analysis, Opportunity and Forecast, 2016-2032
- 5.1. Western Europe Robo Advisory Market Analysis, 2016-2021
- 5.2. Western Europe Robo Advisory Market Opportunity and Forecast, 2023-2032
- 5.3. Western Europe Robo Advisory Market Analysis, Opportunity and Forecast, By Service Type, 2016-2032
- 5.3.1. Western Europe Robo Advisory Market Analysis by Service Type: Introduction
- 5.3.2. Market Size Absolute $ Opportunity Analysis and Forecast, By Service Type, 2016-2032
- 5.3.3. Direct Plan-based/Goal-based
- 5.3.4. Comprehensive Wealth Advisory
- 5.4. Western Europe Robo Advisory Market Analysis, Opportunity and Forecast, By Business Model, 2016-2032
- 5.4.1. Western Europe Robo Advisory Market Analysis by Business Model: Introduction
- 5.4.2. Market Size Absolute $ Opportunity Analysis and Forecast, By Business Model, 2016-2032
- 5.4.3. Pure Robo Advisors
- 5.4.4. Hybrid Robo Advisors
- 5.5. Western Europe Robo Advisory Market Analysis, Opportunity and Forecast, By Provider, 2016-2032
- 5.5.1. Western Europe Robo Advisory Market Analysis by Provider: Introduction
- 5.5.2. Market Size Absolute $ Opportunity Analysis and Forecast, By Provider, 2016-2032
- 5.5.3. Fintech Robo Advisors
- 5.5.4. Banks
- 5.5.5. Traditional Wealth Managers
- 5.5.6. Others
- 5.6. Western Europe Robo Advisory Market Analysis, Opportunity and Forecast, By End User, 2016-2032
- 5.6.1. Western Europe Robo Advisory Market Analysis by End User: Introduction
- 5.6.2. Market Size Absolute $ Opportunity Analysis and Forecast, By End User, 2016-2032
- 5.6.3. Retail Investor
- 5.6.4. High Net Worth Individuals (HNIs)
- 5.7. Western Europe Robo Advisory Market Analysis, Opportunity and Forecast, By Country , 2016-2032
- 5.7.1. Western Europe Robo Advisory Market Analysis by Country : Introduction
- 5.7.2. Market Size Absolute $ Opportunity Analysis and Forecast, Country , 2016-2032
- 5.7.2.1. Germany
- 5.7.2.2. France
- 5.7.2.3. The UK
- 5.7.2.4. Spain
- 5.7.2.5. Italy
- 5.7.2.6. Portugal
- 5.7.2.7. Ireland
- 5.7.2.8. Austria
- 5.7.2.9. Switzerland
- 5.7.2.10. Benelux
- 5.7.2.11. Nordic
- 5.7.2.12. Rest of Western Europe
- 6. Eastern Europe Robo Advisory Market Analysis, Opportunity and Forecast, 2016-2032
- 6.1. Eastern Europe Robo Advisory Market Analysis, 2016-2021
- 6.2. Eastern Europe Robo Advisory Market Opportunity and Forecast, 2023-2032
- 6.3. Eastern Europe Robo Advisory Market Analysis, Opportunity and Forecast, By Service Type, 2016-2032
- 6.3.1. Eastern Europe Robo Advisory Market Analysis by Service Type: Introduction
- 6.3.2. Market Size Absolute $ Opportunity Analysis and Forecast, By Service Type, 2016-2032
- 6.3.3. Direct Plan-based/Goal-based
- 6.3.4. Comprehensive Wealth Advisory
- 6.4. Eastern Europe Robo Advisory Market Analysis, Opportunity and Forecast, By Business Model, 2016-2032
- 6.4.1. Eastern Europe Robo Advisory Market Analysis by Business Model: Introduction
- 6.4.2. Market Size Absolute $ Opportunity Analysis and Forecast, By Business Model, 2016-2032
- 6.4.3. Pure Robo Advisors
- 6.4.4. Hybrid Robo Advisors
- 6.5. Eastern Europe Robo Advisory Market Analysis, Opportunity and Forecast, By Provider, 2016-2032
- 6.5.1. Eastern Europe Robo Advisory Market Analysis by Provider: Introduction
- 6.5.2. Market Size Absolute $ Opportunity Analysis and Forecast, By Provider, 2016-2032
- 6.5.3. Fintech Robo Advisors
- 6.5.4. Banks
- 6.5.5. Traditional Wealth Managers
- 6.5.6. Others
- 6.6. Eastern Europe Robo Advisory Market Analysis, Opportunity and Forecast, By End User, 2016-2032
- 6.6.1. Eastern Europe Robo Advisory Market Analysis by End User: Introduction
- 6.6.2. Market Size Absolute $ Opportunity Analysis and Forecast, By End User, 2016-2032
- 6.6.3. Retail Investor
- 6.6.4. High Net Worth Individuals (HNIs)
- 6.7. Eastern Europe Robo Advisory Market Analysis, Opportunity and Forecast, By Country , 2016-2032
- 6.7.1. Eastern Europe Robo Advisory Market Analysis by Country : Introduction
- 6.7.2. Market Size Absolute $ Opportunity Analysis and Forecast, Country , 2016-2032
- 6.7.2.1. Russia
- 6.7.2.2. Poland
- 6.7.2.3. The Czech Republic
- 6.7.2.4. Greece
- 6.7.2.5. Rest of Eastern Europe
- 7. APAC Robo Advisory Market Analysis, Opportunity and Forecast, 2016-2032
- 7.1. APAC Robo Advisory Market Analysis, 2016-2021
- 7.2. APAC Robo Advisory Market Opportunity and Forecast, 2023-2032
- 7.3. APAC Robo Advisory Market Analysis, Opportunity and Forecast, By Service Type, 2016-2032
- 7.3.1. APAC Robo Advisory Market Analysis by Service Type: Introduction
- 7.3.2. Market Size Absolute $ Opportunity Analysis and Forecast, By Service Type, 2016-2032
- 7.3.3. Direct Plan-based/Goal-based
- 7.3.4. Comprehensive Wealth Advisory
- 7.4. APAC Robo Advisory Market Analysis, Opportunity and Forecast, By Business Model, 2016-2032
- 7.4.1. APAC Robo Advisory Market Analysis by Business Model: Introduction
- 7.4.2. Market Size Absolute $ Opportunity Analysis and Forecast, By Business Model, 2016-2032
- 7.4.3. Pure Robo Advisors
- 7.4.4. Hybrid Robo Advisors
- 7.5. APAC Robo Advisory Market Analysis, Opportunity and Forecast, By Provider, 2016-2032
- 7.5.1. APAC Robo Advisory Market Analysis by Provider: Introduction
- 7.5.2. Market Size Absolute $ Opportunity Analysis and Forecast, By Provider, 2016-2032
- 7.5.3. Fintech Robo Advisors
- 7.5.4. Banks
- 7.5.5. Traditional Wealth Managers
- 7.5.6. Others
- 7.6. APAC Robo Advisory Market Analysis, Opportunity and Forecast, By End User, 2016-2032
- 7.6.1. APAC Robo Advisory Market Analysis by End User: Introduction
- 7.6.2. Market Size Absolute $ Opportunity Analysis and Forecast, By End User, 2016-2032
- 7.6.3. Retail Investor
- 7.6.4. High Net Worth Individuals (HNIs)
- 7.7. APAC Robo Advisory Market Analysis, Opportunity and Forecast, By Country , 2016-2032
- 7.7.1. APAC Robo Advisory Market Analysis by Country : Introduction
- 7.7.2. Market Size Absolute $ Opportunity Analysis and Forecast, Country , 2016-2032
- 7.7.2.1. China
- 7.7.2.2. Japan
- 7.7.2.3. South Korea
- 7.7.2.4. India
- 7.7.2.5. Australia & New Zeland
- 7.7.2.6. Indonesia
- 7.7.2.7. Malaysia
- 7.7.2.8. Philippines
- 7.7.2.9. Singapore
- 7.7.2.10. Thailand
- 7.7.2.11. Vietnam
- 7.7.2.12. Rest of APAC
- 8. Latin America Robo Advisory Market Analysis, Opportunity and Forecast, 2016-2032
- 8.1. Latin America Robo Advisory Market Analysis, 2016-2021
- 8.2. Latin America Robo Advisory Market Opportunity and Forecast, 2023-2032
- 8.3. Latin America Robo Advisory Market Analysis, Opportunity and Forecast, By Service Type, 2016-2032
- 8.3.1. Latin America Robo Advisory Market Analysis by Service Type: Introduction
- 8.3.2. Market Size Absolute $ Opportunity Analysis and Forecast, By Service Type, 2016-2032
- 8.3.3. Direct Plan-based/Goal-based
- 8.3.4. Comprehensive Wealth Advisory
- 8.4. Latin America Robo Advisory Market Analysis, Opportunity and Forecast, By Business Model, 2016-2032
- 8.4.1. Latin America Robo Advisory Market Analysis by Business Model: Introduction
- 8.4.2. Market Size Absolute $ Opportunity Analysis and Forecast, By Business Model, 2016-2032
- 8.4.3. Pure Robo Advisors
- 8.4.4. Hybrid Robo Advisors
- 8.5. Latin America Robo Advisory Market Analysis, Opportunity and Forecast, By Provider, 2016-2032
- 8.5.1. Latin America Robo Advisory Market Analysis by Provider: Introduction
- 8.5.2. Market Size Absolute $ Opportunity Analysis and Forecast, By Provider, 2016-2032
- 8.5.3. Fintech Robo Advisors
- 8.5.4. Banks
- 8.5.5. Traditional Wealth Managers
- 8.5.6. Others
- 8.6. Latin America Robo Advisory Market Analysis, Opportunity and Forecast, By End User, 2016-2032
- 8.6.1. Latin America Robo Advisory Market Analysis by End User: Introduction
- 8.6.2. Market Size Absolute $ Opportunity Analysis and Forecast, By End User, 2016-2032
- 8.6.3. Retail Investor
- 8.6.4. High Net Worth Individuals (HNIs)
- 8.7. Latin America Robo Advisory Market Analysis, Opportunity and Forecast, By Country , 2016-2032
- 8.7.1. Latin America Robo Advisory Market Analysis by Country : Introduction
- 8.7.2. Market Size Absolute $ Opportunity Analysis and Forecast, Country , 2016-2032
- 8.7.2.1. Brazil
- 8.7.2.2. Colombia
- 8.7.2.3. Chile
- 8.7.2.4. Argentina
- 8.7.2.5. Costa Rica
- 8.7.2.6. Rest of Latin America
- 9. Middle East & Africa Robo Advisory Market Analysis, Opportunity and Forecast, 2016-2032
- 9.1. Middle East & Africa Robo Advisory Market Analysis, 2016-2021
- 9.2. Middle East & Africa Robo Advisory Market Opportunity and Forecast, 2023-2032
- 9.3. Middle East & Africa Robo Advisory Market Analysis, Opportunity and Forecast, By Service Type, 2016-2032
- 9.3.1. Middle East & Africa Robo Advisory Market Analysis by Service Type: Introduction
- 9.3.2. Market Size Absolute $ Opportunity Analysis and Forecast, By Service Type, 2016-2032
- 9.3.3. Direct Plan-based/Goal-based
- 9.3.4. Comprehensive Wealth Advisory
- 9.4. Middle East & Africa Robo Advisory Market Analysis, Opportunity and Forecast, By Business Model, 2016-2032
- 9.4.1. Middle East & Africa Robo Advisory Market Analysis by Business Model: Introduction
- 9.4.2. Market Size Absolute $ Opportunity Analysis and Forecast, By Business Model, 2016-2032
- 9.4.3. Pure Robo Advisors
- 9.4.4. Hybrid Robo Advisors
- 9.5. Middle East & Africa Robo Advisory Market Analysis, Opportunity and Forecast, By Provider, 2016-2032
- 9.5.1. Middle East & Africa Robo Advisory Market Analysis by Provider: Introduction
- 9.5.2. Market Size Absolute $ Opportunity Analysis and Forecast, By Provider, 2016-2032
- 9.5.3. Fintech Robo Advisors
- 9.5.4. Banks
- 9.5.5. Traditional Wealth Managers
- 9.5.6. Others
- 9.6. Middle East & Africa Robo Advisory Market Analysis, Opportunity and Forecast, By End User, 2016-2032
- 9.6.1. Middle East & Africa Robo Advisory Market Analysis by End User: Introduction
- 9.6.2. Market Size Absolute $ Opportunity Analysis and Forecast, By End User, 2016-2032
- 9.6.3. Retail Investor
- 9.6.4. High Net Worth Individuals (HNIs)
- 9.7. Middle East & Africa Robo Advisory Market Analysis, Opportunity and Forecast, By Country , 2016-2032
- 9.7.1. Middle East & Africa Robo Advisory Market Analysis by Country : Introduction
- 9.7.2. Market Size Absolute $ Opportunity Analysis and Forecast, Country , 2016-2032
- 9.7.2.1. Algeria
- 9.7.2.2. Egypt
- 9.7.2.3. Israel
- 9.7.2.4. Kuwait
- 9.7.2.5. Nigeria
- 9.7.2.6. Saudi Arabia
- 9.7.2.7. South Africa
- 9.7.2.8. Turkey
- 9.7.2.9. The UAE
- 9.7.2.10. Rest of MEA
- 10. Global Robo Advisory Market Analysis, Opportunity and Forecast, By Region , 2016-2032
- 10.1. Global Robo Advisory Market Analysis by Region : Introduction
- 10.2. Market Size Absolute $ Opportunity Analysis and Forecast, By Region , 2016-2032
- 10.2.1. North America
- 10.2.2. Western Europe
- 10.2.3. Eastern Europe
- 10.2.4. APAC
- 10.2.5. Latin America
- 10.2.6. Middle East & Africa
- 11. Global Robo Advisory Market Competitive Landscape, Market Share Analysis, and Company Profiles
- 11.1. Market Share Analysis
- 11.2. Company Profiles
- 11.3. Betterment LLC
- 11.3.1. Company Overview
- 11.3.2. Financial Highlights
- 11.3.3. Product Portfolio
- 11.3.4. SWOT Analysis
- 11.3.5. Key Strategies and Developments
- 11.4. Fincite Gmbh
- 11.4.1. Company Overview
- 11.4.2. Financial Highlights
- 11.4.3. Product Portfolio
- 11.4.4. SWOT Analysis
- 11.4.5. Key Strategies and Developments
- 11.5. Wealthfront Corporation
- 11.5.1. Company Overview
- 11.5.2. Financial Highlights
- 11.5.3. Product Portfolio
- 11.5.4. SWOT Analysis
- 11.5.5. Key Strategies and Developments
- 11.6. The Vanguard Group, Inc.
- 11.6.1. Company Overview
- 11.6.2. Financial Highlights
- 11.6.3. Product Portfolio
- 11.6.4. SWOT Analysis
- 11.6.5. Key Strategies and Developments
- 11.7. The Charles Schwab Corporation
- 11.7.1. Company Overview
- 11.7.2. Financial Highlights
- 11.7.3. Product Portfolio
- 11.7.4. SWOT Analysis
- 11.7.5. Key Strategies and Developments
- 11.8. Ellevest, Inc.
- 11.8.1. Company Overview
- 11.8.2. Financial Highlights
- 11.8.3. Product Portfolio
- 11.8.4. SWOT Analysis
- 11.8.5. Key Strategies and Developments
- 11.9. Ginmon Vermögensverwaltung GmbH
- 11.9.1. Company Overview
- 11.9.2. Financial Highlights
- 11.9.3. Product Portfolio
- 11.9.4. SWOT Analysis
- 11.9.5. Key Strategies and Developments
- 11.10. Wealthify Limited
- 11.10.1. Company Overview
- 11.10.2. Financial Highlights
- 11.10.3. Product Portfolio
- 11.10.4. SWOT Analysis
- 11.10.5. Key Strategies and Developments
- 11.11. SoFi Technologies, Inc.
- 11.11.1. Company Overview
- 11.11.2. Financial Highlights
- 11.11.3. Product Portfolio
- 11.11.4. SWOT Analysis
- 11.11.5. Key Strategies and Developments
- 11.12. SigFig Wealth Management, LLC
- 11.12.1. Company Overview
- 11.12.2. Financial Highlights
- 11.12.3. Product Portfolio
- 11.12.4. SWOT Analysis
- 11.12.5. Key Strategies and Developments
- 11.13.1. Company Overview
- 11.13.2. Financial Highlights
- 11.13.3. Product Portfolio
- 11.13.4. SWOT Analysis
- 11.13.5. Key Strategies and Developments
- 11.14. Empirica
- 11.14.1. Company Overview
- 11.14.2. Financial Highlights
- 11.14.3. Product Portfolio
- 11.14.4. SWOT Analysis
- 11.14.5. Key Strategies and Developments
- 11.15. Axos Financial, Inc.
- 11.15.1. Company Overview
- 11.15.2. Financial Highlights
- 11.15.3. Product Portfolio
- 11.15.4. SWOT Analysis
- 11.15.5. Key Strategies and Developments
- 12. Assumptions and Acronyms
- 13. Research Methodology
- 14. Contact
"
- List of Figures
- "
- Figure 1: Global Robo Advisory Market Revenue (US$ Mn) Market Share by Service Type in 2022
- Figure 2: Global Robo Advisory Market Market Attractiveness Analysis by Service Type, 2016-2032
- Figure 3: Global Robo Advisory Market Revenue (US$ Mn) Market Share by Business Modelin 2022
- Figure 4: Global Robo Advisory Market Market Attractiveness Analysis by Business Model, 2016-2032
- Figure 5: Global Robo Advisory Market Revenue (US$ Mn) Market Share by Providerin 2022
- Figure 6: Global Robo Advisory Market Market Attractiveness Analysis by Provider, 2016-2032
- Figure 7: Global Robo Advisory Market Revenue (US$ Mn) Market Share by End Userin 2022
- Figure 8: Global Robo Advisory Market Market Attractiveness Analysis by End User, 2016-2032
- Figure 9: Global Robo Advisory Market Revenue (US$ Mn) Market Share by Region in 2022
- Figure 10: Global Robo Advisory Market Market Attractiveness Analysis by Region, 2016-2032
- Figure 11: Global Robo Advisory Market Market Revenue (US$ Mn) (2016-2032)
- Figure 12: Global Robo Advisory Market Market Revenue (US$ Mn) Comparison by Region (2016-2032)
- Figure 13: Global Robo Advisory Market Market Revenue (US$ Mn) Comparison by Service Type (2016-2032)
- Figure 14: Global Robo Advisory Market Market Revenue (US$ Mn) Comparison by Business Model (2016-2032)
- Figure 15: Global Robo Advisory Market Market Revenue (US$ Mn) Comparison by Provider (2016-2032)
- Figure 16: Global Robo Advisory Market Market Revenue (US$ Mn) Comparison by End User (2016-2032)
- Figure 17: Global Robo Advisory Market Market Y-o-Y Growth Rate Comparison by Region (2016-2032)
- Figure 18: Global Robo Advisory Market Market Y-o-Y Growth Rate Comparison by Service Type (2016-2032)
- Figure 19: Global Robo Advisory Market Market Y-o-Y Growth Rate Comparison by Business Model (2016-2032)
- Figure 20: Global Robo Advisory Market Market Y-o-Y Growth Rate Comparison by Provider (2016-2032)
- Figure 21: Global Robo Advisory Market Market Y-o-Y Growth Rate Comparison by End User (2016-2032)
- Figure 22: Global Robo Advisory Market Market Share Comparison by Region (2016-2032)
- Figure 23: Global Robo Advisory Market Market Share Comparison by Service Type (2016-2032)
- Figure 24: Global Robo Advisory Market Market Share Comparison by Business Model (2016-2032)
- Figure 25: Global Robo Advisory Market Market Share Comparison by Provider (2016-2032)
- Figure 26: Global Robo Advisory Market Market Share Comparison by End User (2016-2032)
- Figure 27: North America Robo Advisory Market Revenue (US$ Mn) Market Share by Service Typein 2022
- Figure 28: North America Robo Advisory Market Market Attractiveness Analysis by Service Type, 2016-2032
- Figure 29: North America Robo Advisory Market Revenue (US$ Mn) Market Share by Business Modelin 2022
- Figure 30: North America Robo Advisory Market Market Attractiveness Analysis by Business Model, 2016-2032
- Figure 31: North America Robo Advisory Market Revenue (US$ Mn) Market Share by Providerin 2022
- Figure 32: North America Robo Advisory Market Market Attractiveness Analysis by Provider, 2016-2032
- Figure 33: North America Robo Advisory Market Revenue (US$ Mn) Market Share by End Userin 2022
- Figure 34: North America Robo Advisory Market Market Attractiveness Analysis by End User, 2016-2032
- Figure 35: North America Robo Advisory Market Revenue (US$ Mn) Market Share by Country in 2022
- Figure 36: North America Robo Advisory Market Market Attractiveness Analysis by Country, 2016-2032
- Figure 37: North America Robo Advisory Market Market Revenue (US$ Mn) (2016-2032)
- Figure 38: North America Robo Advisory Market Market Revenue (US$ Mn) Comparison by Country (2016-2032)
- Figure 39: North America Robo Advisory Market Market Revenue (US$ Mn) Comparison by Service Type (2016-2032)
- Figure 40: North America Robo Advisory Market Market Revenue (US$ Mn) Comparison by Business Model (2016-2032)
- Figure 41: North America Robo Advisory Market Market Revenue (US$ Mn) Comparison by Provider (2016-2032)
- Figure 42: North America Robo Advisory Market Market Revenue (US$ Mn) Comparison by End User (2016-2032)
- Figure 43: North America Robo Advisory Market Market Y-o-Y Growth Rate Comparison by Country (2016-2032)
- Figure 44: North America Robo Advisory Market Market Y-o-Y Growth Rate Comparison by Service Type (2016-2032)
- Figure 45: North America Robo Advisory Market Market Y-o-Y Growth Rate Comparison by Business Model (2016-2032)
- Figure 46: North America Robo Advisory Market Market Y-o-Y Growth Rate Comparison by Provider (2016-2032)
- Figure 47: North America Robo Advisory Market Market Y-o-Y Growth Rate Comparison by End User (2016-2032)
- Figure 48: North America Robo Advisory Market Market Share Comparison by Country (2016-2032)
- Figure 49: North America Robo Advisory Market Market Share Comparison by Service Type (2016-2032)
- Figure 50: North America Robo Advisory Market Market Share Comparison by Business Model (2016-2032)
- Figure 51: North America Robo Advisory Market Market Share Comparison by Provider (2016-2032)
- Figure 52: North America Robo Advisory Market Market Share Comparison by End User (2016-2032)
- Figure 53: Western Europe Robo Advisory Market Revenue (US$ Mn) Market Share by Service Typein 2022
- Figure 54: Western Europe Robo Advisory Market Market Attractiveness Analysis by Service Type, 2016-2032
- Figure 55: Western Europe Robo Advisory Market Revenue (US$ Mn) Market Share by Business Modelin 2022
- Figure 56: Western Europe Robo Advisory Market Market Attractiveness Analysis by Business Model, 2016-2032
- Figure 57: Western Europe Robo Advisory Market Revenue (US$ Mn) Market Share by Providerin 2022
- Figure 58: Western Europe Robo Advisory Market Market Attractiveness Analysis by Provider, 2016-2032
- Figure 59: Western Europe Robo Advisory Market Revenue (US$ Mn) Market Share by End Userin 2022
- Figure 60: Western Europe Robo Advisory Market Market Attractiveness Analysis by End User, 2016-2032
- Figure 61: Western Europe Robo Advisory Market Revenue (US$ Mn) Market Share by Country in 2022
- Figure 62: Western Europe Robo Advisory Market Market Attractiveness Analysis by Country, 2016-2032
- Figure 63: Western Europe Robo Advisory Market Market Revenue (US$ Mn) (2016-2032)
- Figure 64: Western Europe Robo Advisory Market Market Revenue (US$ Mn) Comparison by Country (2016-2032)
- Figure 65: Western Europe Robo Advisory Market Market Revenue (US$ Mn) Comparison by Service Type (2016-2032)
- Figure 66: Western Europe Robo Advisory Market Market Revenue (US$ Mn) Comparison by Business Model (2016-2032)
- Figure 67: Western Europe Robo Advisory Market Market Revenue (US$ Mn) Comparison by Provider (2016-2032)
- Figure 68: Western Europe Robo Advisory Market Market Revenue (US$ Mn) Comparison by End User (2016-2032)
- Figure 69: Western Europe Robo Advisory Market Market Y-o-Y Growth Rate Comparison by Country (2016-2032)
- Figure 70: Western Europe Robo Advisory Market Market Y-o-Y Growth Rate Comparison by Service Type (2016-2032)
- Figure 71: Western Europe Robo Advisory Market Market Y-o-Y Growth Rate Comparison by Business Model (2016-2032)
- Figure 72: Western Europe Robo Advisory Market Market Y-o-Y Growth Rate Comparison by Provider (2016-2032)
- Figure 73: Western Europe Robo Advisory Market Market Y-o-Y Growth Rate Comparison by End User (2016-2032)
- Figure 74: Western Europe Robo Advisory Market Market Share Comparison by Country (2016-2032)
- Figure 75: Western Europe Robo Advisory Market Market Share Comparison by Service Type (2016-2032)
- Figure 76: Western Europe Robo Advisory Market Market Share Comparison by Business Model (2016-2032)
- Figure 77: Western Europe Robo Advisory Market Market Share Comparison by Provider (2016-2032)
- Figure 78: Western Europe Robo Advisory Market Market Share Comparison by End User (2016-2032)
- Figure 79: Eastern Europe Robo Advisory Market Revenue (US$ Mn) Market Share by Service Typein 2022
- Figure 80: Eastern Europe Robo Advisory Market Market Attractiveness Analysis by Service Type, 2016-2032
- Figure 81: Eastern Europe Robo Advisory Market Revenue (US$ Mn) Market Share by Business Modelin 2022
- Figure 82: Eastern Europe Robo Advisory Market Market Attractiveness Analysis by Business Model, 2016-2032
- Figure 83: Eastern Europe Robo Advisory Market Revenue (US$ Mn) Market Share by Providerin 2022
- Figure 84: Eastern Europe Robo Advisory Market Market Attractiveness Analysis by Provider, 2016-2032
- Figure 85: Eastern Europe Robo Advisory Market Revenue (US$ Mn) Market Share by End Userin 2022
- Figure 86: Eastern Europe Robo Advisory Market Market Attractiveness Analysis by End User, 2016-2032
- Figure 87: Eastern Europe Robo Advisory Market Revenue (US$ Mn) Market Share by Country in 2022
- Figure 88: Eastern Europe Robo Advisory Market Market Attractiveness Analysis by Country, 2016-2032
- Figure 89: Eastern Europe Robo Advisory Market Market Revenue (US$ Mn) (2016-2032)
- Figure 90: Eastern Europe Robo Advisory Market Market Revenue (US$ Mn) Comparison by Country (2016-2032)
- Figure 91: Eastern Europe Robo Advisory Market Market Revenue (US$ Mn) Comparison by Service Type (2016-2032)
- Figure 92: Eastern Europe Robo Advisory Market Market Revenue (US$ Mn) Comparison by Business Model (2016-2032)
- Figure 93: Eastern Europe Robo Advisory Market Market Revenue (US$ Mn) Comparison by Provider (2016-2032)
- Figure 94: Eastern Europe Robo Advisory Market Market Revenue (US$ Mn) Comparison by End User (2016-2032)
- Figure 95: Eastern Europe Robo Advisory Market Market Y-o-Y Growth Rate Comparison by Country (2016-2032)
- Figure 96: Eastern Europe Robo Advisory Market Market Y-o-Y Growth Rate Comparison by Service Type (2016-2032)
- Figure 97: Eastern Europe Robo Advisory Market Market Y-o-Y Growth Rate Comparison by Business Model (2016-2032)
- Figure 98: Eastern Europe Robo Advisory Market Market Y-o-Y Growth Rate Comparison by Provider (2016-2032)
- Figure 99: Eastern Europe Robo Advisory Market Market Y-o-Y Growth Rate Comparison by End User (2016-2032)
- Figure 100: Eastern Europe Robo Advisory Market Market Share Comparison by Country (2016-2032)
- Figure 101: Eastern Europe Robo Advisory Market Market Share Comparison by Service Type (2016-2032)
- Figure 102: Eastern Europe Robo Advisory Market Market Share Comparison by Business Model (2016-2032)
- Figure 103: Eastern Europe Robo Advisory Market Market Share Comparison by Provider (2016-2032)
- Figure 104: Eastern Europe Robo Advisory Market Market Share Comparison by End User (2016-2032)
- Figure 105: APAC Robo Advisory Market Revenue (US$ Mn) Market Share by Service Typein 2022
- Figure 106: APAC Robo Advisory Market Market Attractiveness Analysis by Service Type, 2016-2032
- Figure 107: APAC Robo Advisory Market Revenue (US$ Mn) Market Share by Business Modelin 2022
- Figure 108: APAC Robo Advisory Market Market Attractiveness Analysis by Business Model, 2016-2032
- Figure 109: APAC Robo Advisory Market Revenue (US$ Mn) Market Share by Providerin 2022
- Figure 110: APAC Robo Advisory Market Market Attractiveness Analysis by Provider, 2016-2032
- Figure 111: APAC Robo Advisory Market Revenue (US$ Mn) Market Share by End Userin 2022
- Figure 112: APAC Robo Advisory Market Market Attractiveness Analysis by End User, 2016-2032
- Figure 113: APAC Robo Advisory Market Revenue (US$ Mn) Market Share by Country in 2022
- Figure 114: APAC Robo Advisory Market Market Attractiveness Analysis by Country, 2016-2032
- Figure 115: APAC Robo Advisory Market Market Revenue (US$ Mn) (2016-2032)
- Figure 116: APAC Robo Advisory Market Market Revenue (US$ Mn) Comparison by Country (2016-2032)
- Figure 117: APAC Robo Advisory Market Market Revenue (US$ Mn) Comparison by Service Type (2016-2032)
- Figure 118: APAC Robo Advisory Market Market Revenue (US$ Mn) Comparison by Business Model (2016-2032)
- Figure 119: APAC Robo Advisory Market Market Revenue (US$ Mn) Comparison by Provider (2016-2032)
- Figure 120: APAC Robo Advisory Market Market Revenue (US$ Mn) Comparison by End User (2016-2032)
- Figure 121: APAC Robo Advisory Market Market Y-o-Y Growth Rate Comparison by Country (2016-2032)
- Figure 122: APAC Robo Advisory Market Market Y-o-Y Growth Rate Comparison by Service Type (2016-2032)
- Figure 123: APAC Robo Advisory Market Market Y-o-Y Growth Rate Comparison by Business Model (2016-2032)
- Figure 124: APAC Robo Advisory Market Market Y-o-Y Growth Rate Comparison by Provider (2016-2032)
- Figure 125: APAC Robo Advisory Market Market Y-o-Y Growth Rate Comparison by End User (2016-2032)
- Figure 126: APAC Robo Advisory Market Market Share Comparison by Country (2016-2032)
- Figure 127: APAC Robo Advisory Market Market Share Comparison by Service Type (2016-2032)
- Figure 128: APAC Robo Advisory Market Market Share Comparison by Business Model (2016-2032)
- Figure 129: APAC Robo Advisory Market Market Share Comparison by Provider (2016-2032)
- Figure 130: APAC Robo Advisory Market Market Share Comparison by End User (2016-2032)
- Figure 131: Latin America Robo Advisory Market Revenue (US$ Mn) Market Share by Service Typein 2022
- Figure 132: Latin America Robo Advisory Market Market Attractiveness Analysis by Service Type, 2016-2032
- Figure 133: Latin America Robo Advisory Market Revenue (US$ Mn) Market Share by Business Modelin 2022
- Figure 134: Latin America Robo Advisory Market Market Attractiveness Analysis by Business Model, 2016-2032
- Figure 135: Latin America Robo Advisory Market Revenue (US$ Mn) Market Share by Providerin 2022
- Figure 136: Latin America Robo Advisory Market Market Attractiveness Analysis by Provider, 2016-2032
- Figure 137: Latin America Robo Advisory Market Revenue (US$ Mn) Market Share by End Userin 2022
- Figure 138: Latin America Robo Advisory Market Market Attractiveness Analysis by End User, 2016-2032
- Figure 139: Latin America Robo Advisory Market Revenue (US$ Mn) Market Share by Country in 2022
- Figure 140: Latin America Robo Advisory Market Market Attractiveness Analysis by Country, 2016-2032
- Figure 141: Latin America Robo Advisory Market Market Revenue (US$ Mn) (2016-2032)
- Figure 142: Latin America Robo Advisory Market Market Revenue (US$ Mn) Comparison by Country (2016-2032)
- Figure 143: Latin America Robo Advisory Market Market Revenue (US$ Mn) Comparison by Service Type (2016-2032)
- Figure 144: Latin America Robo Advisory Market Market Revenue (US$ Mn) Comparison by Business Model (2016-2032)
- Figure 145: Latin America Robo Advisory Market Market Revenue (US$ Mn) Comparison by Provider (2016-2032)
- Figure 146: Latin America Robo Advisory Market Market Revenue (US$ Mn) Comparison by End User (2016-2032)
- Figure 147: Latin America Robo Advisory Market Market Y-o-Y Growth Rate Comparison by Country (2016-2032)
- Figure 148: Latin America Robo Advisory Market Market Y-o-Y Growth Rate Comparison by Service Type (2016-2032)
- Figure 149: Latin America Robo Advisory Market Market Y-o-Y Growth Rate Comparison by Business Model (2016-2032)
- Figure 150: Latin America Robo Advisory Market Market Y-o-Y Growth Rate Comparison by Provider (2016-2032)
- Figure 151: Latin America Robo Advisory Market Market Y-o-Y Growth Rate Comparison by End User (2016-2032)
- Figure 152: Latin America Robo Advisory Market Market Share Comparison by Country (2016-2032)
- Figure 153: Latin America Robo Advisory Market Market Share Comparison by Service Type (2016-2032)
- Figure 154: Latin America Robo Advisory Market Market Share Comparison by Business Model (2016-2032)
- Figure 155: Latin America Robo Advisory Market Market Share Comparison by Provider (2016-2032)
- Figure 156: Latin America Robo Advisory Market Market Share Comparison by End User (2016-2032)
- Figure 157: Middle East & Africa Robo Advisory Market Revenue (US$ Mn) Market Share by Service Typein 2022
- Figure 158: Middle East & Africa Robo Advisory Market Market Attractiveness Analysis by Service Type, 2016-2032
- Figure 159: Middle East & Africa Robo Advisory Market Revenue (US$ Mn) Market Share by Business Modelin 2022
- Figure 160: Middle East & Africa Robo Advisory Market Market Attractiveness Analysis by Business Model, 2016-2032
- Figure 161: Middle East & Africa Robo Advisory Market Revenue (US$ Mn) Market Share by Providerin 2022
- Figure 162: Middle East & Africa Robo Advisory Market Market Attractiveness Analysis by Provider, 2016-2032
- Figure 163: Middle East & Africa Robo Advisory Market Revenue (US$ Mn) Market Share by End Userin 2022
- Figure 164: Middle East & Africa Robo Advisory Market Market Attractiveness Analysis by End User, 2016-2032
- Figure 165: Middle East & Africa Robo Advisory Market Revenue (US$ Mn) Market Share by Country in 2022
- Figure 166: Middle East & Africa Robo Advisory Market Market Attractiveness Analysis by Country, 2016-2032
- Figure 167: Middle East & Africa Robo Advisory Market Market Revenue (US$ Mn) (2016-2032)
- Figure 168: Middle East & Africa Robo Advisory Market Market Revenue (US$ Mn) Comparison by Country (2016-2032)
- Figure 169: Middle East & Africa Robo Advisory Market Market Revenue (US$ Mn) Comparison by Service Type (2016-2032)
- Figure 170: Middle East & Africa Robo Advisory Market Market Revenue (US$ Mn) Comparison by Business Model (2016-2032)
- Figure 171: Middle East & Africa Robo Advisory Market Market Revenue (US$ Mn) Comparison by Provider (2016-2032)
- Figure 172: Middle East & Africa Robo Advisory Market Market Revenue (US$ Mn) Comparison by End User (2016-2032)
- Figure 173: Middle East & Africa Robo Advisory Market Market Y-o-Y Growth Rate Comparison by Country (2016-2032)
- Figure 174: Middle East & Africa Robo Advisory Market Market Y-o-Y Growth Rate Comparison by Service Type (2016-2032)
- Figure 175: Middle East & Africa Robo Advisory Market Market Y-o-Y Growth Rate Comparison by Business Model (2016-2032)
- Figure 176: Middle East & Africa Robo Advisory Market Market Y-o-Y Growth Rate Comparison by Provider (2016-2032)
- Figure 177: Middle East & Africa Robo Advisory Market Market Y-o-Y Growth Rate Comparison by End User (2016-2032)
- Figure 178: Middle East & Africa Robo Advisory Market Market Share Comparison by Country (2016-2032)
- Figure 179: Middle East & Africa Robo Advisory Market Market Share Comparison by Service Type (2016-2032)
- Figure 180: Middle East & Africa Robo Advisory Market Market Share Comparison by Business Model (2016-2032)
- Figure 181: Middle East & Africa Robo Advisory Market Market Share Comparison by Provider (2016-2032)
- Figure 182: Middle East & Africa Robo Advisory Market Market Share Comparison by End User (2016-2032)
"
- List of Tables
- "
- Table 1: Global Robo Advisory Market Market Comparison by Service Type (2016-2032)
- Table 2: Global Robo Advisory Market Market Comparison by Business Model (2016-2032)
- Table 3: Global Robo Advisory Market Market Comparison by Provider (2016-2032)
- Table 4: Global Robo Advisory Market Market Comparison by End User (2016-2032)
- Table 5: Global Robo Advisory Market Revenue (US$ Mn) Comparison by Region (2016-2032)
- Table 6: Global Robo Advisory Market Market Revenue (US$ Mn) (2016-2032)
- Table 7: Global Robo Advisory Market Market Revenue (US$ Mn) Comparison by Region (2016-2032)
- Table 8: Global Robo Advisory Market Market Revenue (US$ Mn) Comparison by Service Type (2016-2032)
- Table 9: Global Robo Advisory Market Market Revenue (US$ Mn) Comparison by Business Model (2016-2032)
- Table 10: Global Robo Advisory Market Market Revenue (US$ Mn) Comparison by Provider (2016-2032)
- Table 11: Global Robo Advisory Market Market Revenue (US$ Mn) Comparison by End User (2016-2032)
- Table 12: Global Robo Advisory Market Market Y-o-Y Growth Rate Comparison by Region (2016-2032)
- Table 13: Global Robo Advisory Market Market Y-o-Y Growth Rate Comparison by Service Type (2016-2032)
- Table 14: Global Robo Advisory Market Market Y-o-Y Growth Rate Comparison by Business Model (2016-2032)
- Table 15: Global Robo Advisory Market Market Y-o-Y Growth Rate Comparison by Provider (2016-2032)
- Table 16: Global Robo Advisory Market Market Y-o-Y Growth Rate Comparison by End User (2016-2032)
- Table 17: Global Robo Advisory Market Market Share Comparison by Region (2016-2032)
- Table 18: Global Robo Advisory Market Market Share Comparison by Service Type (2016-2032)
- Table 19: Global Robo Advisory Market Market Share Comparison by Business Model (2016-2032)
- Table 20: Global Robo Advisory Market Market Share Comparison by Provider (2016-2032)
- Table 21: Global Robo Advisory Market Market Share Comparison by End User (2016-2032)
- Table 22: North America Robo Advisory Market Market Comparison by Business Model (2016-2032)
- Table 23: North America Robo Advisory Market Market Comparison by Provider (2016-2032)
- Table 24: North America Robo Advisory Market Market Comparison by End User (2016-2032)
- Table 25: North America Robo Advisory Market Revenue (US$ Mn) Comparison by Country (2016-2032)
- Table 26: North America Robo Advisory Market Market Revenue (US$ Mn) (2016-2032)
- Table 27: North America Robo Advisory Market Market Revenue (US$ Mn) Comparison by Country (2016-2032)
- Table 28: North America Robo Advisory Market Market Revenue (US$ Mn) Comparison by Service Type (2016-2032)
- Table 29: North America Robo Advisory Market Market Revenue (US$ Mn) Comparison by Business Model (2016-2032)
- Table 30: North America Robo Advisory Market Market Revenue (US$ Mn) Comparison by Provider (2016-2032)
- Table 31: North America Robo Advisory Market Market Revenue (US$ Mn) Comparison by End User (2016-2032)
- Table 32: North America Robo Advisory Market Market Y-o-Y Growth Rate Comparison by Country (2016-2032)
- Table 33: North America Robo Advisory Market Market Y-o-Y Growth Rate Comparison by Service Type (2016-2032)
- Table 34: North America Robo Advisory Market Market Y-o-Y Growth Rate Comparison by Business Model (2016-2032)
- Table 35: North America Robo Advisory Market Market Y-o-Y Growth Rate Comparison by Provider (2016-2032)
- Table 36: North America Robo Advisory Market Market Y-o-Y Growth Rate Comparison by End User (2016-2032)
- Table 37: North America Robo Advisory Market Market Share Comparison by Country (2016-2032)
- Table 38: North America Robo Advisory Market Market Share Comparison by Service Type (2016-2032)
- Table 39: North America Robo Advisory Market Market Share Comparison by Business Model (2016-2032)
- Table 40: North America Robo Advisory Market Market Share Comparison by Provider (2016-2032)
- Table 41: North America Robo Advisory Market Market Share Comparison by End User (2016-2032)
- Table 42: Western Europe Robo Advisory Market Market Comparison by Service Type (2016-2032)
- Table 43: Western Europe Robo Advisory Market Market Comparison by Business Model (2016-2032)
- Table 44: Western Europe Robo Advisory Market Market Comparison by Provider (2016-2032)
- Table 45: Western Europe Robo Advisory Market Market Comparison by End User (2016-2032)
- Table 46: Western Europe Robo Advisory Market Revenue (US$ Mn) Comparison by Country (2016-2032)
- Table 47: Western Europe Robo Advisory Market Market Revenue (US$ Mn) (2016-2032)
- Table 48: Western Europe Robo Advisory Market Market Revenue (US$ Mn) Comparison by Country (2016-2032)
- Table 49: Western Europe Robo Advisory Market Market Revenue (US$ Mn) Comparison by Service Type (2016-2032)
- Table 50: Western Europe Robo Advisory Market Market Revenue (US$ Mn) Comparison by Business Model (2016-2032)
- Table 51: Western Europe Robo Advisory Market Market Revenue (US$ Mn) Comparison by Provider (2016-2032)
- Table 52: Western Europe Robo Advisory Market Market Revenue (US$ Mn) Comparison by End User (2016-2032)
- Table 53: Western Europe Robo Advisory Market Market Y-o-Y Growth Rate Comparison by Country (2016-2032)
- Table 54: Western Europe Robo Advisory Market Market Y-o-Y Growth Rate Comparison by Service Type (2016-2032)
- Table 55: Western Europe Robo Advisory Market Market Y-o-Y Growth Rate Comparison by Business Model (2016-2032)
- Table 56: Western Europe Robo Advisory Market Market Y-o-Y Growth Rate Comparison by Provider (2016-2032)
- Table 57: Western Europe Robo Advisory Market Market Y-o-Y Growth Rate Comparison by End User (2016-2032)
- Table 58: Western Europe Robo Advisory Market Market Share Comparison by Country (2016-2032)
- Table 59: Western Europe Robo Advisory Market Market Share Comparison by Service Type (2016-2032)
- Table 60: Western Europe Robo Advisory Market Market Share Comparison by Business Model (2016-2032)
- Table 61: Western Europe Robo Advisory Market Market Share Comparison by Provider (2016-2032)
- Table 62: Western Europe Robo Advisory Market Market Share Comparison by End User (2016-2032)
- Table 63: Eastern Europe Robo Advisory Market Market Comparison by Service Type (2016-2032)
- Table 64: Eastern Europe Robo Advisory Market Market Comparison by Business Model (2016-2032)
- Table 65: Eastern Europe Robo Advisory Market Market Comparison by Provider (2016-2032)
- Table 66: Eastern Europe Robo Advisory Market Market Comparison by End User (2016-2032)
- Table 67: Eastern Europe Robo Advisory Market Revenue (US$ Mn) Comparison by Country (2016-2032)
- Table 68: Eastern Europe Robo Advisory Market Market Revenue (US$ Mn) (2016-2032)
- Table 69: Eastern Europe Robo Advisory Market Market Revenue (US$ Mn) Comparison by Country (2016-2032)
- Table 70: Eastern Europe Robo Advisory Market Market Revenue (US$ Mn) Comparison by Service Type (2016-2032)
- Table 71: Eastern Europe Robo Advisory Market Market Revenue (US$ Mn) Comparison by Business Model (2016-2032)
- Table 72: Eastern Europe Robo Advisory Market Market Revenue (US$ Mn) Comparison by Provider (2016-2032)
- Table 73: Eastern Europe Robo Advisory Market Market Revenue (US$ Mn) Comparison by End User (2016-2032)
- Table 74: Eastern Europe Robo Advisory Market Market Y-o-Y Growth Rate Comparison by Country (2016-2032)
- Table 75: Eastern Europe Robo Advisory Market Market Y-o-Y Growth Rate Comparison by Service Type (2016-2032)
- Table 76: Eastern Europe Robo Advisory Market Market Y-o-Y Growth Rate Comparison by Business Model (2016-2032)
- Table 77: Eastern Europe Robo Advisory Market Market Y-o-Y Growth Rate Comparison by Provider (2016-2032)
- Table 78: Eastern Europe Robo Advisory Market Market Y-o-Y Growth Rate Comparison by End User (2016-2032)
- Table 79: Eastern Europe Robo Advisory Market Market Share Comparison by Country (2016-2032)
- Table 80: Eastern Europe Robo Advisory Market Market Share Comparison by Service Type (2016-2032)
- Table 81: Eastern Europe Robo Advisory Market Market Share Comparison by Business Model (2016-2032)
- Table 82: Eastern Europe Robo Advisory Market Market Share Comparison by Provider (2016-2032)
- Table 83: Eastern Europe Robo Advisory Market Market Share Comparison by End User (2016-2032)
- Table 84: APAC Robo Advisory Market Market Comparison by Service Type (2016-2032)
- Table 85: APAC Robo Advisory Market Market Comparison by Business Model (2016-2032)
- Table 86: APAC Robo Advisory Market Market Comparison by Provider (2016-2032)
- Table 87: APAC Robo Advisory Market Market Comparison by End User (2016-2032)
- Table 88: APAC Robo Advisory Market Revenue (US$ Mn) Comparison by Country (2016-2032)
- Table 89: APAC Robo Advisory Market Market Revenue (US$ Mn) (2016-2032)
- Table 90: APAC Robo Advisory Market Market Revenue (US$ Mn) Comparison by Country (2016-2032)
- Table 91: APAC Robo Advisory Market Market Revenue (US$ Mn) Comparison by Service Type (2016-2032)
- Table 92: APAC Robo Advisory Market Market Revenue (US$ Mn) Comparison by Business Model (2016-2032)
- Table 93: APAC Robo Advisory Market Market Revenue (US$ Mn) Comparison by Provider (2016-2032)
- Table 94: APAC Robo Advisory Market Market Revenue (US$ Mn) Comparison by End User (2016-2032)
- Table 95: APAC Robo Advisory Market Market Y-o-Y Growth Rate Comparison by Country (2016-2032)
- Table 96: APAC Robo Advisory Market Market Y-o-Y Growth Rate Comparison by Service Type (2016-2032)
- Table 97: APAC Robo Advisory Market Market Y-o-Y Growth Rate Comparison by Business Model (2016-2032)
- Table 98: APAC Robo Advisory Market Market Y-o-Y Growth Rate Comparison by Provider (2016-2032)
- Table 99: APAC Robo Advisory Market Market Y-o-Y Growth Rate Comparison by End User (2016-2032)
- Table 100: APAC Robo Advisory Market Market Share Comparison by Country (2016-2032)
- Table 101: APAC Robo Advisory Market Market Share Comparison by Service Type (2016-2032)
- Table 102: APAC Robo Advisory Market Market Share Comparison by Business Model (2016-2032)
- Table 103: APAC Robo Advisory Market Market Share Comparison by Provider (2016-2032)
- Table 104: APAC Robo Advisory Market Market Share Comparison by End User (2016-2032)
- Table 105: Latin America Robo Advisory Market Market Comparison by Service Type (2016-2032)
- Table 106: Latin America Robo Advisory Market Market Comparison by Business Model (2016-2032)
- Table 107: Latin America Robo Advisory Market Market Comparison by Provider (2016-2032)
- Table 108: Latin America Robo Advisory Market Market Comparison by End User (2016-2032)
- Table 109: Latin America Robo Advisory Market Revenue (US$ Mn) Comparison by Country (2016-2032)
- Table 110: Latin America Robo Advisory Market Market Revenue (US$ Mn) (2016-2032)
- Table 111: Latin America Robo Advisory Market Market Revenue (US$ Mn) Comparison by Country (2016-2032)
- Table 112: Latin America Robo Advisory Market Market Revenue (US$ Mn) Comparison by Service Type (2016-2032)
- Table 113: Latin America Robo Advisory Market Market Revenue (US$ Mn) Comparison by Business Model (2016-2032)
- Table 114: Latin America Robo Advisory Market Market Revenue (US$ Mn) Comparison by Provider (2016-2032)
- Table 115: Latin America Robo Advisory Market Market Revenue (US$ Mn) Comparison by End User (2016-2032)
- Table 116: Latin America Robo Advisory Market Market Y-o-Y Growth Rate Comparison by Country (2016-2032)
- Table 117: Latin America Robo Advisory Market Market Y-o-Y Growth Rate Comparison by Service Type (2016-2032)
- Table 118: Latin America Robo Advisory Market Market Y-o-Y Growth Rate Comparison by Business Model (2016-2032)
- Table 119: Latin America Robo Advisory Market Market Y-o-Y Growth Rate Comparison by Provider (2016-2032)
- Table 120: Latin America Robo Advisory Market Market Y-o-Y Growth Rate Comparison by End User (2016-2032)
- Table 121: Latin America Robo Advisory Market Market Share Comparison by Country (2016-2032)
- Table 122: Latin America Robo Advisory Market Market Share Comparison by Service Type (2016-2032)
- Table 123: Latin America Robo Advisory Market Market Share Comparison by Business Model (2016-2032)
- Table 124: Latin America Robo Advisory Market Market Share Comparison by Provider (2016-2032)
- Table 125: Latin America Robo Advisory Market Market Share Comparison by End User (2016-2032)
- Table 126: Middle East & Africa Robo Advisory Market Market Comparison by Service Type (2016-2032)
- Table 127: Middle East & Africa Robo Advisory Market Market Comparison by Business Model (2016-2032)
- Table 128: Middle East & Africa Robo Advisory Market Market Comparison by Provider (2016-2032)
- Table 129: Middle East & Africa Robo Advisory Market Market Comparison by End User (2016-2032)
- Table 130: Middle East & Africa Robo Advisory Market Revenue (US$ Mn) Comparison by Country (2016-2032)
- Table 131: Middle East & Africa Robo Advisory Market Market Revenue (US$ Mn) (2016-2032)
- Table 132: Middle East & Africa Robo Advisory Market Market Revenue (US$ Mn) Comparison by Country (2016-2032)
- Table 133: Middle East & Africa Robo Advisory Market Market Revenue (US$ Mn) Comparison by Service Type (2016-2032)
- Table 134: Middle East & Africa Robo Advisory Market Market Revenue (US$ Mn) Comparison by Business Model (2016-2032)
- Table 135: Middle East & Africa Robo Advisory Market Market Revenue (US$ Mn) Comparison by Provider (2016-2032)
- Table 136: Middle East & Africa Robo Advisory Market Market Revenue (US$ Mn) Comparison by End User (2016-2032)
- Table 137: Middle East & Africa Robo Advisory Market Market Y-o-Y Growth Rate Comparison by Country (2016-2032)
- Table 138: Middle East & Africa Robo Advisory Market Market Y-o-Y Growth Rate Comparison by Service Type (2016-2032)
- Table 139: Middle East & Africa Robo Advisory Market Market Y-o-Y Growth Rate Comparison by Business Model (2016-2032)
- Table 140: Middle East & Africa Robo Advisory Market Market Y-o-Y Growth Rate Comparison by Provider (2016-2032)
- Table 141: Middle East & Africa Robo Advisory Market Market Y-o-Y Growth Rate Comparison by End User (2016-2032)
- Table 142: Middle East & Africa Robo Advisory Market Market Share Comparison by Country (2016-2032)
- Table 143: Middle East & Africa Robo Advisory Market Market Share Comparison by Service Type (2016-2032)
- Table 144: Middle East & Africa Robo Advisory Market Market Share Comparison by Business Model (2016-2032)
- Table 145: Middle East & Africa Robo Advisory Market Market Share Comparison by Provider (2016-2032)
- Table 146: Middle East & Africa Robo Advisory Market Market Share Comparison by End User (2016-2032)
- 1. Executive Summary
-
- Betterment LLC
- Fincite Gmbh
- Wealthfront Corporation
- The Vanguard Group, Inc.
- The Charles Schwab Corporation
- Ellevest, Inc.
- Ginmon Vermögensverwaltung GmbH
- Wealthify Limited
- SoFi Technologies, Inc.
- SigFig Wealth Management, LLC
- Empirica
- Social Finance, Inc.
- Axos Financial, Inc.
Our Clients


View Our Licence Options
