
RNA Therapeutics Market Report By Product (Vaccines, Drugs), By Type (mRNA Therapeutics, RNA Interference, Antisense Oligonucleotides), By Indication (Infectious Diseases, Rare Genetic Diseases/Hereditary Diseases, Other Indications), By End User (Hospitals and Clinics, Research Settings), By Region and Companies - Industry Segment Outlook, Market Assessment, Competition Scenario, Trends and Forecast 2024-2033
-
46932
-
May 2024
-
321
-


-
This report was compiled by Trishita Deb Trishita Deb is an experienced market research and consulting professional with over 7 years of expertise across healthcare, consumer goods, and materials, contributing to over 400 healthcare-related reports. Correspondence Team Lead- Healthcare Linkedin | Detailed Market research Methodology Our methodology involves a mix of primary research, including interviews with leading mental health experts, and secondary research from reputable medical journals and databases. View Detailed Methodology Page
-
Quick Navigation
Report Overview
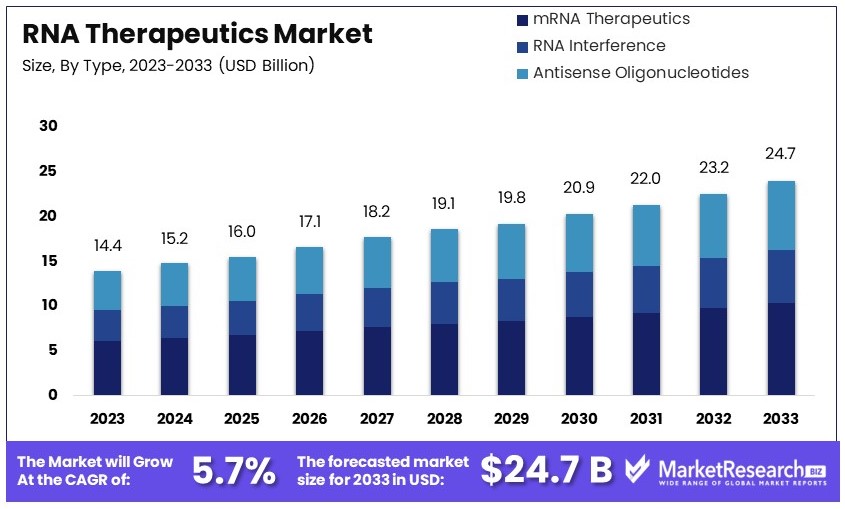
The Global RNA Therapeutics Market size is expected to be worth around USD 24.7 Billion by 2033, from USD 14.4 Billion in 2023, growing at a CAGR of 5.7% during the forecast period from 2024 to 2033.
The RNA Therapeutics Market focuses on drugs that use ribonucleic acid (RNA) to treat diseases. RNA therapeutics include mRNA vaccines, RNA interference (RNAi), and antisense oligonucleotides. They target genetic disorders, cancer, and infectious diseases. The market is growing rapidly due to recent technological advancements.
The success of mRNA COVID-19 vaccines has increased interest. Key players are investing heavily in research and development. The market is segmented by technology, application, and end-user. North America holds the largest market share, followed by Europe and Asia-Pacific. The outlook is positive with ongoing innovations and increasing demand for personalized medicine.
The RNA therapeutics market is positioned for substantial growth, driven by the rising prevalence of chronic diseases and the significant economic burden they impose. Chronic diseases are responsible for 41 million deaths annually, accounting for 63% of worldwide deaths. Major preventable diseases such as cardiovascular disease, cancer, chronic respiratory diseases, and diabetes are leading contributors.
In the United States, an estimated 129 million people suffer from at least one major chronic disease. Additionally, 42% of the population has two or more chronic conditions, and 12% have at least five. This high prevalence of chronic diseases underscores the urgent need for innovative treatments.
RNA therapeutics offer promising solutions by targeting the genetic and molecular bases of these diseases. These therapies can modulate gene expression and offer precision medicine approaches that are not possible with traditional treatments. The market is witnessing increased investment in research and development, aimed at expanding the applications of RNA-based therapies.
The economic impact of chronic diseases is immense. Globally, the cost of chronic diseases is projected to reach $47 trillion by 2030. In the United States alone, chronic diseases account for more than $1 trillion in healthcare costs annually. These figures highlight the potential savings and health benefits that effective RNA therapeutics could provide.
In summary, the RNA therapeutics market is on a growth trajectory, driven by the need to address the global burden of chronic diseases and the associated economic costs. Continued advancements in RNA technology and increased investment will likely enhance the market's growth prospects, offering new hope for patients with chronic conditions.
Key Takeaways
- Market Value: RNA Therapeutics Market was valued at USD 14.4 Billion in 2023, and is expected to reach USD 24.7 Billion in 2033, at a CAGR of 5.7%
- Product Analysis: Vaccines dominate with 56%; success of mRNA vaccines.
- Type Analysis: mRNA therapeutics dominate with 39%; versatility in vaccine development.
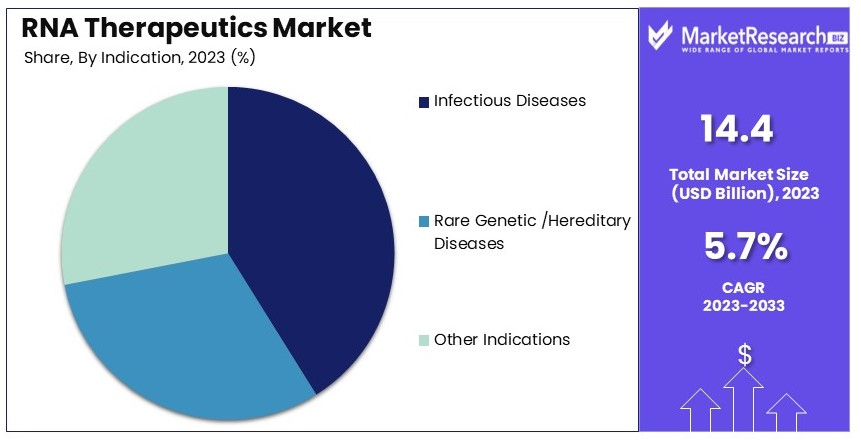
- Indication Analysis: Infectious diseases dominate with 41%; RNA-based vaccines focus.
- End User Analysis: Hospitals and clinics dominate with 57%; central role in administration.
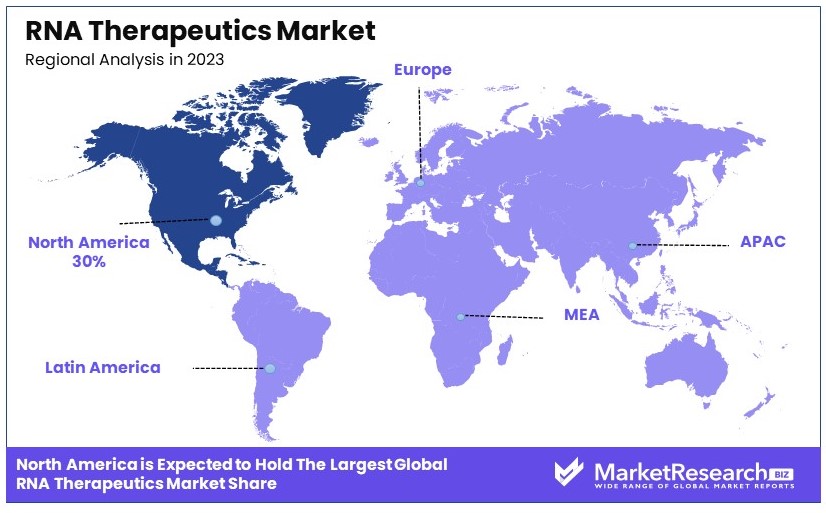
- Dominant Region: North America with 30%; strong biotech industry and research investments.
- High Growth Region: Europe with 25%; supportive government policies and pharmaceutical industry.
- Analyst Viewpoint: Market driven by mRNA vaccine success; increasing investment in RNA-based therapies.
- Growth Opportunities: Development of RNA-based drugs for genetic disorders; expanding applications in infectious diseases.
Driving Factors
Rising Prevalence of Chronic and Genetic Disorders Drives Market Growth
The increasing incidence of chronic diseases, such as cancer, cardiovascular diseases, and genetic disorders, significantly fuels the demand for RNA therapeutics. RNA therapeutics have the potential for chronic disease management at the molecular level by modulating gene expression, making them a promising area of research and development. For example, Onpattro (patisiran), an RNA interference (RNAi) therapy developed by Alnylam Pharmaceuticals, was approved by the FDA in 2018 for treating hereditary transthyretin-mediated amyloidosis (hATTR), a rare genetic disorder. This approval underscores the therapeutic potential and market growth of RNA-based treatments.
Statistics show a rising prevalence of chronic and genetic disorders globally, which correlates with the growing interest in RNA therapeutics. According to the World Health Organization, cancer alone accounted for approximately 10 million deaths in 2020, highlighting the urgent need for effective treatments. As RNA therapeutics offer targeted and personalized treatment options, their market adoption is likely to accelerate, supported by continued advancements and regulatory approvals.
The interaction of this factor with other elements, such as technological advancements and expanding applications, creates a synergistic effect, further driving market growth. As the prevalence of chronic and genetic disorders rises, the demand for innovative RNA-based therapies will continue to increase, contributing to the overall expansion of the RNA therapeutics market.
Advancements in RNA Delivery Technologies Drive Market Growth
One of the major challenges in RNA therapeutics has been the efficient delivery of RNA molecules to target tissues and cells. Recent advancements in delivery technologies, such as lipid nanoparticles, conjugates, and viral vectors, have facilitated better stability, targeting, and cellular uptake of RNA therapeutics, enhancing their therapeutic potential. For instance, Moderna Therapeutics has developed proprietary lipid nanoparticle delivery systems for its mRNA-based vaccines and therapeutics, which have shown promising results in clinical trials for various applications, including COVID-19 vaccines.
These technological innovations are pivotal in overcoming delivery barriers, a critical factor in the effective use of RNA therapeutics. The enhanced delivery systems not only improve the efficacy and safety of RNA therapeutics but also broaden their application range, thereby boosting market growth.
The advancements in delivery technologies complement other factors, such as the rising prevalence of diseases and expanding therapeutic applications, by ensuring that RNA therapeutics reach their intended targets more effectively. This integrated approach enhances the overall therapeutic outcomes, driving further growth in the RNA therapeutics market.
Expanding Applications in Oncology and Rare Diseases Drive Market Growth
RNA therapeutics have demonstrated significant potential in treating various cancers and rare diseases, where traditional therapies have been ineffective or associated with severe side effects. RNAi-based therapies, in particular, have shown promising results in targeting cancer-specific gene expression and reducing tumor growth. Onpattro (patisiran) and Givlaari (givosiran), both RNAi therapies developed by Alnylam Pharmaceuticals, have been approved for treating rare genetic disorders, hATTR and acute hepatic porphyria, respectively.
The expanding applications of RNA therapeutics in oncology drugs and rare diseases are supported by robust clinical evidence and regulatory approvals. This growth is driven by the increasing number of RNA-based therapies entering clinical trials and receiving regulatory approvals, particularly in oncology and rare diseases.
The synergy between the expanding applications and other market-driving factors, such as technological advancements and disease prevalence, enhances the overall growth trajectory. As more RNA-based therapies prove their efficacy and safety, their adoption in treating various cancers and rare diseases will likely continue to rise, further propelling the RNA therapeutics market forward.
Restraining Factors
Challenges in Stability and Delivery Restrain Market Growth
The inherent instability of RNA molecules and their susceptibility to degradation by nucleases significantly limit the growth of the RNA therapeutics market. Despite advancements in delivery technologies, ensuring efficient delivery to target tissues and cells while maintaining RNA integrity remains a challenge. The degradation of siRNA molecules by endogenous nucleases in the bloodstream can reduce their efficacy, necessitating higher doses or more frequent administration. This can increase the risk of side effects and treatment costs.
For example, siRNA molecules are often degraded before reaching their target, compromising their effectiveness. This instability restricts the broader application of RNA therapeutics, as it demands continuous improvement in delivery systems and formulations. According to a 2021 report, the global RNA therapeutics market faces significant hurdles due to these stability and delivery challenges, impacting its growth potential.
Regulatory Hurdles and Clinical Trial Complexity Restrain Market Growth
Regulatory hurdles and the complexity of clinical trials for RNA therapeutics pose significant challenges to market growth. As a relatively new class of drugs, RNA therapeutics face stringent regulatory requirements for demonstrating safety and efficacy. Conducting clinical trials is complex due to the need for specialized delivery systems, potential off-target effects, and the development of appropriate bioanalytical methods.
For example, the FDA initially placed a clinical hold on Alnylam's patisiran program due to concerns over potential safety issues related to the delivery system, delaying the drug's development and approval process. Such regulatory delays can hinder the timely introduction of RNA-based therapies to the market. According to industry reports, the regulatory landscape for RNA therapeutics remains a significant barrier, contributing to slower market growth and increased development costs.
Product Analysis
Vaccines dominate with 56% due to the success of mRNA vaccines in addressing infectious diseases and their rapid development capabilities.
The RNA therapeutics market is segmented into two main product categories: vaccines and drugs. The vaccines segment dominates the market, accounting for 56% of the market share. This dominance is primarily due to the significant success and widespread adoption of mRNA-based vaccines, particularly during the COVID-19 pandemic. mRNA vaccines, such as those developed by Pfizer-BioNTech and Moderna, have demonstrated high efficacy and rapid development timelines, making them crucial in combating infectious diseases. These vaccines have not only addressed urgent public health needs but also showcased the potential of RNA technologies, leading to increased investments and advancements in this field.
The success of mRNA vaccines has paved the way for further research and development in RNA-based vaccines for other infectious diseases, including influenza, Zika virus, and more. The ability to quickly design and produce mRNA vaccines in response to emerging pathogens positions this segment for sustained growth. Additionally, the expanding pipeline of RNA-based vaccines targeting various diseases highlights the segment's potential to address global health challenges effectively.
While vaccines hold a significant share, the drugs segment also plays a crucial role in the RNA therapeutics market. RNA-based drugs, including RNA interference (RNAi) therapies and antisense oligonucleotides, offer targeted treatments for genetic and chronic diseases. These drugs modulate gene expression and protein production at the molecular level, providing innovative solutions for conditions that are challenging to treat with traditional therapies. The approval of drugs like Onpattro (patisiran) and Spinraza (nusinersen) underscores the therapeutic potential of RNA-based drugs, driving market growth.
Type Analysis
mRNA therapeutics dominate with 39% due to their versatility in vaccine development and potential to treat various diseases.
The RNA therapeutics market is further segmented by type, with mRNA therapeutics holding the dominant position, accounting for 39% of the market share. mRNA therapeutics have gained significant attention due to their role in vaccine development and their potential to treat a wide range of diseases. The flexibility of mRNA technology allows for the rapid design and production of therapeutics, making it an attractive option for addressing emerging health threats and unmet medical needs.
mRNA therapeutics have shown promising results in various clinical trials, not only for vaccines but also for treating genetic disorders, cancer, and other diseases. The ability to encode proteins and modulate gene expression through mRNA opens new avenues for precision medicine. The success of mRNA vaccines during the COVID-19 pandemic has accelerated research and investment in this segment, leading to a robust pipeline of mRNA-based therapies in development.
Other types of RNA therapeutics, such as RNA interference (RNAi) and antisense oligonucleotides, also contribute to market growth. RNAi therapies, like Alnylam Pharmaceuticals' Onpattro, have demonstrated efficacy in treating rare genetic diseases by silencing specific genes. Antisense oligonucleotides, such as Biogen's Spinraza, provide targeted treatments for genetic disorders by binding to RNA molecules and altering protein production. These therapies offer innovative solutions for diseases that are difficult to treat with traditional methods, supporting the overall growth of the RNA therapeutics market.
Indication Analysis
Infectious diseases dominate with 41% due to the success of RNA-based vaccines and the focus on pandemic preparedness.
The RNA therapeutics market is segmented by indication, with infectious diseases being the dominant sub-segment, accounting for 41% of the market share. The success of RNA-based vaccines, particularly during the COVID-19 pandemic, has highlighted the potential of RNA therapeutics in addressing infectious diseases. mRNA vaccines, such as those developed by Pfizer-BioNTech and Moderna, have demonstrated high efficacy and rapid development timelines, making them essential tools in controlling infectious disease outbreaks.
The focus on infectious diseases extends beyond COVID-19, with ongoing research and development of RNA-based vaccines and therapies for other viral and bacterial infections. The ability to quickly design and produce RNA-based treatments in response to emerging pathogens positions this segment for continued growth. The global health community's emphasis on pandemic preparedness and the need for effective vaccines and treatments drive investments in RNA therapeutics targeting infectious diseases.
Other indications, such as rare genetic diseases and hereditary disorders, also contribute to the market's growth. RNA-based therapies, including RNA interference (RNAi) and antisense oligonucleotides, offer targeted treatments for these conditions by modulating gene expression and protein production. For instance, Alnylam Pharmaceuticals' Onpattro and Biogen's Spinraza have shown efficacy in treating rare genetic disorders, providing new treatment options for patients with limited alternatives. The expanding pipeline of RNA-based therapies for various indications supports the overall growth of the RNA therapeutics market.
End User Analysis
Hospitals and clinics dominate with 57% due to their central role in administering and distributing RNA-based therapies.
The RNA therapeutics market is segmented by end user, with hospitals and clinics being the dominant sub-segment, accounting for 57% of the market share. Hospitals and clinics play a crucial role in the administration and distribution of RNA-based therapies, including vaccines and drugs. The widespread adoption of mRNA vaccines during the COVID-19 pandemic has highlighted the importance of healthcare institutions in delivering these innovative treatments to the public.
Hospitals and clinics serve as primary points of care for patients receiving RNA-based therapies for various conditions, including infectious diseases, genetic disorders, and chronic illnesses. The integration of RNA therapeutics into standard medical practice requires healthcare professionals to be knowledgeable about these treatments and their administration. As RNA-based therapies become more prevalent, the role of hospitals and clinics in their delivery and management will continue to expand.
Research settings, including academic institutions and pharmaceutical companies, also play a significant role in the RNA therapeutics market. These settings are involved in the discovery, development, and clinical testing of RNA-based therapies. Collaborative efforts between research institutions and healthcare providers drive innovation and the translation of scientific discoveries into clinical applications. The synergy between research and clinical practice supports the growth of the RNA therapeutics market by advancing the development and implementation of new treatments.
Key Market Segments
By Product
- Vaccines
- Drugs
By Type
- mRNA Therapeutics
- RNA Interference
- Antisense Oligonucleotides
By Indication
- Infectious Diseases
- Rare Genetic Diseases/Hereditary Diseases
- Other Indications
By End User
- Hospitals and Clinics
- Research Settings
Growth Opportunities
Expanding Applications in Rare Diseases and Personalized Medicine Offers Growth Opportunity
RNA therapeutics present significant growth opportunities by addressing rare and genetic diseases that lack effective treatments. These therapies can target specific genetic mutations or modulate gene expression, enabling personalized medicine tailored to individual patients or specific disease subtypes. For instance, Ionis Pharmaceuticals and Roche are developing tominersen, an antisense oligonucleotide therapy, for Huntington's disease, a rare neurodegenerative disorder. This highlights the potential of RNA-based treatments to offer solutions for conditions with limited options.
The demand for personalized medicine is expected to grow rapidly, driven by advances in genetic research and the increasing prevalence of rare diseases. RNA therapeutics' ability to provide targeted treatments aligns well with these trends, creating a substantial opportunity for market expansion.
Combination Therapies and Synergistic Approaches Offer Growth Opportunity
Combining RNA therapeutics with other treatment modalities presents a promising growth opportunity. By leveraging RNAi therapies, small molecule drugs, antibodies, or cell therapies, synergistic effects can be achieved, enhancing treatment outcomes. Researchers are exploring combinations such as RNAi therapies with checkpoint inhibitors in cancer immunotherapy to boost the anti-tumor immune response and improve patient outcomes.
This approach can overcome resistance mechanisms and provide more comprehensive treatment strategies. The combination therapy market is projected to grow significantly, with oncology being a major focus area. The ability to integrate RNA therapeutics into combination treatments expands their application range and enhances their effectiveness, driving market growth.
Trending Factors
mRNA-based Vaccines and Therapeutics Are Trending Factors
The success of mRNA-based COVID-19 vaccines has underscored the potential of mRNA technology in both vaccine development and therapeutic applications. mRNA-based therapies offer advantages like rapid development, versatility, and the ability to encode various proteins or antigens.
This opens new avenues for infectious disease prevention and treatment, protein replacement therapy, and regenerative medicine. Companies like Moderna Therapeutics and BioNTech are expanding their mRNA platforms for various infectious diseases, rare genetic disorders, and cancer.
Strategic Collaborations and Partnerships Are Trending Factors
Collaborations and partnerships in the pharmaceutical and biotechnology sectors are accelerating the development of RNA therapeutics. These strategic alliances leverage the expertise and resources of different organizations, fostering innovation and enabling the rapid advancement of RNA-based therapies from research to commercialization. For example, Sanofi and Alnylam Pharmaceuticals have a strategic alliance to develop RNAi therapeutics for rare genetic diseases, combining Sanofi's global resources with Alnylam's RNAi technology expertise.
Such collaborations enhance the development pipeline and speed up regulatory approvals, facilitating market growth. The trend towards strategic partnerships is expected to continue, supporting the robust expansion of the RNA therapeutics market.
Regional Analysis
North America Dominates with 30% Market Share
North America's dominance in the RNA therapeutics market, with a 30% market share, is driven by several key factors. The region's advanced healthcare infrastructure and substantial investment in biotechnology and pharmaceutical research contribute significantly. Additionally, North America houses leading companies like Moderna and Alnylam Pharmaceuticals, which spearhead RNA therapeutics development. The robust regulatory framework, including the FDA's supportive policies for innovative therapies, further bolsters market growth.
Regional characteristics such as high healthcare expenditure and strong research and development capabilities positively impact the RNA therapeutics market in North America. The presence of top-tier research institutions and a collaborative environment between academia and industry enhance innovation and commercialization of RNA-based treatments. The region's focus on personalized medicine and rare disease treatment also drives market demand.
Europe Market Share and Growth
Europe holds a significant share of the RNA therapeutics market, accounting for 25%. The region benefits from a well-established pharmaceutical industry and strong government support for biotechnology research. The European Medicines Agency (EMA) plays a crucial role in facilitating market access for new therapies. Europe's market is expected to grow at a CAGR of 12% from 2021 to 2028, driven by ongoing clinical trials and increasing investment in RNA technologies.
Asia Pacific Market Share and Growth
Asia Pacific represents 20% of the RNA therapeutics market. The region is experiencing rapid growth due to increasing healthcare expenditure, a growing biotech industry, and rising awareness of RNA-based treatments. Countries like China and Japan are making significant strides in RNA research and development. The market in Asia Pacific is forecasted to grow at a CAGR of 15% from 2021 to 2028, reflecting its expanding role in the global market.
Middle East & Africa Market Share and Growth
The Middle East & Africa hold a smaller share of the RNA therapeutics market, at 10%. However, the region is witnessing gradual growth due to improving healthcare infrastructure and increased government initiatives to promote biotechnology. The market is expected to grow at a CAGR of 8% from 2021 to 2028, driven by rising investments and partnerships with global biotech firms.
Latin America Market Share and Growth
Latin America accounts for 15% of the RNA therapeutics market. The region's market growth is supported by increasing healthcare investments and the presence of emerging biotech companies. Brazil and Mexico are key players in this region, with significant advancements in RNA research. The market in Latin America is projected to grow at a CAGR of 10% from 2021 to 2028, indicating steady progress in the adoption of RNA-based therapies.
Key Regions and Countries
- North America
- The US
- Canada
- Mexico
- Western Europe
- Germany
- France
- The UK
- Spain
- Italy
- Portugal
- Ireland
- Austria
- Switzerland
- Benelux
- Nordic
- Rest of Western Europe
- Eastern Europe
- Russia
- Poland
- The Czech Republic
- Greece
- Rest of Eastern Europe
- APAC
- China
- Japan
- South Korea
- India
- Australia & New Zealand
- Indonesia
- Malaysia
- Philippines
- Singapore
- Thailand
- Vietnam
- Rest of APAC
- Latin America
- Brazil
- Colombia
- Chile
- Argentina
- Costa Rica
- Rest of Latin America
- Middle East & Africa
- Algeria
- Egypt
- Israel
- Kuwait
- Nigeria
- Saudi Arabia
- South Africa
- Turkey
- United Arab Emirates
- Rest of MEA
Key Players Analysis
In the RNA therapeutics market, several key players drive innovation and market growth through strategic positioning and substantial influence. Moderna, Inc. and BioNTech SE lead the market with their mRNA-based vaccines, notably for COVID-19, demonstrating rapid development capabilities and high efficacy. Their success has spurred further investment in RNA technologies and expanded applications beyond infectious diseases.
Alnylam Pharmaceuticals, Inc. and Ionis Pharmaceuticals, Inc. are pioneers in RNA interference (RNAi) and antisense oligonucleotide therapies, respectively. These companies have established themselves by developing treatments for rare genetic disorders, enhancing the therapeutic landscape.
Pfizer Inc. and Novartis AG leverage their extensive resources and global reach to advance RNA-based therapies, focusing on both vaccines and therapeutics. Their strategic collaborations and robust R&D investments position them as significant players in the market.
Sarepta Therapeutics, Inc. and CRISPR Therapeutics are at the forefront of gene-editing technologies, offering innovative solutions for genetic diseases. Their cutting-edge research and clinical advancements underscore their market influence.
Sanofi and Astellas Pharma Inc. engage in strategic alliances to develop RNA therapeutics, combining their expertise with innovative biotech firms to enhance their market presence. Orna Therapeutics, though newer, is making strides with its unique circular RNA technology, contributing to the dynamic landscape of RNA therapeutics.
Together, these companies shape the RNA therapeutics market, driving advancements and expanding the potential of RNA-based treatments across various medical fields.
Market Key Players
- Moderna, Inc.
- Alnylam Pharmaceuticals, Inc.
- Pfizer Inc.
- Novartis AG
- Ionis Pharmaceuticals, Inc.
- Sarepta Therapeutics, Inc.
- Sanofi
- BioNTech SE
- Orna Therapeutics
- CRISPR Therapeutics
- Astellas Pharma Inc.
Recent Developments
- May 2024: Orna Therapeutics, a pioneering biotechnology company specializing in the design and delivery of a novel class of circular RNA (oRNA) therapeutics, announced the acquisition of ReNAgade Therapeutics. ReNAgade is a trailblazer in the field of RNA therapeutics that has demonstrated industry-leading delivery to multiple extra-hepatic cells in non-human primate (NHP) models over the past 18 months.
- May 2024: Radar Therapeutics, a biotech company, emerged from stealth with an announcement that it had raised $13.4 million in an oversubscribed seed financing round led by NfX Bio. Eli Lilly & Co, Biovision, and KdT Ventures also joined the round, with participation from PearVC, BEVC, and other investors.
Report Scope
Report Features Description Market Value (2023) USD 14.4 Billion Forecast Revenue (2033) USD 24.7 Billion CAGR (2024-2033) 5.7% Base Year for Estimation 2023 Historic Period 2018-2023 Forecast Period 2024-2033 Report Coverage Revenue Forecast, Market Dynamics, Competitive Landscape, Recent Developments Segments Covered By Product (Vaccines, Drugs), By Type (mRNA Therapeutics, RNA Interference, Antisense Oligonucleotides), By Indication (Infectious Diseases, Rare Genetic Diseases/Hereditary Diseases, Other Indications), By End User (Hospitals and Clinics, Research Settings) Regional Analysis North America - The US, Canada, & Mexico; Western Europe - Germany, France, The UK, Spain, Italy, Portugal, Ireland, Austria, Switzerland, Benelux, Nordic, & Rest of Western Europe; Eastern Europe - Russia, Poland, The Czech Republic, Greece, & Rest of Eastern Europe; APAC - China, Japan, South Korea, India, Australia & New Zealand, Indonesia, Malaysia, Philippines, Singapore, Thailand, Vietnam, & Rest of APAC; Latin America - Brazil, Colombia, Chile, Argentina, Costa Rica, & Rest of Latin America; Middle East & Africa - Algeria, Egypt, Israel, Kuwait, Nigeria, Saudi Arabia, South Africa, Turkey, United Arab Emirates, & Rest of MEA Competitive Landscape Moderna, Inc., Alnylam Pharmaceuticals, Inc., Pfizer Inc., Novartis AG, Ionis Pharmaceuticals, Inc., Sarepta Therapeutics, Inc., Sanofi, BioNTech SE, Orna Therapeutics, CRISPR Therapeutics, Astellas Pharma Inc. Customization Scope Customization for segments, region/country-level will be provided. Moreover, additional customization can be done based on the requirements. Purchase Options We have three licenses to opt for: Single User License, Multi-User License (Up to 5 Users), Corporate Use License (Unlimited User and Printable PDF) -
- 1. Executive Summary
- 1.1. Definition
- 1.2. Taxonomy
- 1.3. Research Scope
- 1.4. Key Analysis
- 1.5. Key Findings by Major Segments
- 1.6. Top strategies by Major Players
- 2. Global RNA Therapeutics Market Overview
- 2.1. RNA Therapeutics Market Dynamics
- 2.1.1. Drivers
- 2.1.2. Opportunities
- 2.1.3. Restraints
- 2.1.4. Challenges
- 2.2. Macro-economic Factors
- 2.3. Regulatory Framework
- 2.4. Market Investment Feasibility Index
- 2.5. PEST Analysis
- 2.6. PORTER’S Five Force Analysis
- 2.7. Drivers & Restraints Impact Analysis
- 2.8. Industry Chain Analysis
- 2.9. Cost Structure Analysis
- 2.10. Marketing Strategy
- 2.11. Russia-Ukraine War Impact Analysis
- 2.12. Opportunity Map Analysis
- 2.13. Market Competition Scenario Analysis
- 2.14. Product Life Cycle Analysis
- 2.15. Opportunity Orbits
- 2.16. Manufacturer Intensity Map
- 2.17. Major Companies sales by Value & Volume
- 2.1. RNA Therapeutics Market Dynamics
- 3. Global RNA Therapeutics Market Analysis, Opportunity and Forecast, 2016-2032
- 3.1. Global RNA Therapeutics Market Analysis, 2016-2021
- 3.2. Global RNA Therapeutics Market Opportunity and Forecast, 2023-2032
- 3.3. Global RNA Therapeutics Market Analysis, Opportunity and Forecast, By Product, 2016-2032
- 3.3.1. Global RNA Therapeutics Market Analysis by Product: Introduction
- 3.3.2. Market Size Absolute $ Opportunity Analysis and Forecast, By Product, 2016-2032
- 3.3.3. Vaccines
- 3.3.4. Drugs
- 3.4. Global RNA Therapeutics Market Analysis, Opportunity and Forecast, By Type, 2016-2032
- 3.4.1. Global RNA Therapeutics Market Analysis by Type: Introduction
- 3.4.2. Market Size Absolute $ Opportunity Analysis and Forecast, By Type, 2016-2032
- 3.4.3. mRNA Therapeutics
- 3.4.4. RNA Interference
- 3.4.5. Antisense Oligonucleotides
- 3.5. Global RNA Therapeutics Market Analysis, Opportunity and Forecast, By Indication, 2016-2032
- 3.5.1. Global RNA Therapeutics Market Analysis by Indication: Introduction
- 3.5.2. Market Size Absolute $ Opportunity Analysis and Forecast, By Indication, 2016-2032
- 3.5.3. Infectious Diseases
- 3.5.4. Rare Genetic Diseases/Hereditary Diseases
- 3.5.5. Other Indications
- 3.6. Global RNA Therapeutics Market Analysis, Opportunity and Forecast, By End User, 2016-2032
- 3.6.1. Global RNA Therapeutics Market Analysis by End User: Introduction
- 3.6.2. Market Size Absolute $ Opportunity Analysis and Forecast, By End User, 2016-2032
- 3.6.3. Hospitals and Clinics
- 3.6.4. Research Settings
- 4. North America RNA Therapeutics Market Analysis, Opportunity and Forecast, 2016-2032
- 4.1. North America RNA Therapeutics Market Analysis, 2016-2021
- 4.2. North America RNA Therapeutics Market Opportunity and Forecast, 2023-2032
- 4.3. North America RNA Therapeutics Market Analysis, Opportunity and Forecast, By Product, 2016-2032
- 4.3.1. North America RNA Therapeutics Market Analysis by Product: Introduction
- 4.3.2. Market Size Absolute $ Opportunity Analysis and Forecast, By Product, 2016-2032
- 4.3.3. Vaccines
- 4.3.4. Drugs
- 4.4. North America RNA Therapeutics Market Analysis, Opportunity and Forecast, By Type, 2016-2032
- 4.4.1. North America RNA Therapeutics Market Analysis by Type: Introduction
- 4.4.2. Market Size Absolute $ Opportunity Analysis and Forecast, By Type, 2016-2032
- 4.4.3. mRNA Therapeutics
- 4.4.4. RNA Interference
- 4.4.5. Antisense Oligonucleotides
- 4.5. North America RNA Therapeutics Market Analysis, Opportunity and Forecast, By Indication, 2016-2032
- 4.5.1. North America RNA Therapeutics Market Analysis by Indication: Introduction
- 4.5.2. Market Size Absolute $ Opportunity Analysis and Forecast, By Indication, 2016-2032
- 4.5.3. Infectious Diseases
- 4.5.4. Rare Genetic Diseases/Hereditary Diseases
- 4.5.5. Other Indications
- 4.6. North America RNA Therapeutics Market Analysis, Opportunity and Forecast, By End User, 2016-2032
- 4.6.1. North America RNA Therapeutics Market Analysis by End User: Introduction
- 4.6.2. Market Size Absolute $ Opportunity Analysis and Forecast, By End User, 2016-2032
- 4.6.3. Hospitals and Clinics
- 4.6.4. Research Settings
- 4.7. North America RNA Therapeutics Market Analysis, Opportunity and Forecast, By Country , 2016-2032
- 4.7.1. North America RNA Therapeutics Market Analysis by Country : Introduction
- 4.7.2. Market Size Absolute $ Opportunity Analysis and Forecast, Country , 2016-2032
- 4.7.2.1. The US
- 4.7.2.2. Canada
- 4.7.2.3. Mexico
- 5. Western Europe RNA Therapeutics Market Analysis, Opportunity and Forecast, 2016-2032
- 5.1. Western Europe RNA Therapeutics Market Analysis, 2016-2021
- 5.2. Western Europe RNA Therapeutics Market Opportunity and Forecast, 2023-2032
- 5.3. Western Europe RNA Therapeutics Market Analysis, Opportunity and Forecast, By Product, 2016-2032
- 5.3.1. Western Europe RNA Therapeutics Market Analysis by Product: Introduction
- 5.3.2. Market Size Absolute $ Opportunity Analysis and Forecast, By Product, 2016-2032
- 5.3.3. Vaccines
- 5.3.4. Drugs
- 5.4. Western Europe RNA Therapeutics Market Analysis, Opportunity and Forecast, By Type, 2016-2032
- 5.4.1. Western Europe RNA Therapeutics Market Analysis by Type: Introduction
- 5.4.2. Market Size Absolute $ Opportunity Analysis and Forecast, By Type, 2016-2032
- 5.4.3. mRNA Therapeutics
- 5.4.4. RNA Interference
- 5.4.5. Antisense Oligonucleotides
- 5.5. Western Europe RNA Therapeutics Market Analysis, Opportunity and Forecast, By Indication, 2016-2032
- 5.5.1. Western Europe RNA Therapeutics Market Analysis by Indication: Introduction
- 5.5.2. Market Size Absolute $ Opportunity Analysis and Forecast, By Indication, 2016-2032
- 5.5.3. Infectious Diseases
- 5.5.4. Rare Genetic Diseases/Hereditary Diseases
- 5.5.5. Other Indications
- 5.6. Western Europe RNA Therapeutics Market Analysis, Opportunity and Forecast, By End User, 2016-2032
- 5.6.1. Western Europe RNA Therapeutics Market Analysis by End User: Introduction
- 5.6.2. Market Size Absolute $ Opportunity Analysis and Forecast, By End User, 2016-2032
- 5.6.3. Hospitals and Clinics
- 5.6.4. Research Settings
- 5.7. Western Europe RNA Therapeutics Market Analysis, Opportunity and Forecast, By Country , 2016-2032
- 5.7.1. Western Europe RNA Therapeutics Market Analysis by Country : Introduction
- 5.7.2. Market Size Absolute $ Opportunity Analysis and Forecast, Country , 2016-2032
- 5.7.2.1. Germany
- 5.7.2.2. France
- 5.7.2.3. The UK
- 5.7.2.4. Spain
- 5.7.2.5. Italy
- 5.7.2.6. Portugal
- 5.7.2.7. Ireland
- 5.7.2.8. Austria
- 5.7.2.9. Switzerland
- 5.7.2.10. Benelux
- 5.7.2.11. Nordic
- 5.7.2.12. Rest of Western Europe
- 6. Eastern Europe RNA Therapeutics Market Analysis, Opportunity and Forecast, 2016-2032
- 6.1. Eastern Europe RNA Therapeutics Market Analysis, 2016-2021
- 6.2. Eastern Europe RNA Therapeutics Market Opportunity and Forecast, 2023-2032
- 6.3. Eastern Europe RNA Therapeutics Market Analysis, Opportunity and Forecast, By Product, 2016-2032
- 6.3.1. Eastern Europe RNA Therapeutics Market Analysis by Product: Introduction
- 6.3.2. Market Size Absolute $ Opportunity Analysis and Forecast, By Product, 2016-2032
- 6.3.3. Vaccines
- 6.3.4. Drugs
- 6.4. Eastern Europe RNA Therapeutics Market Analysis, Opportunity and Forecast, By Type, 2016-2032
- 6.4.1. Eastern Europe RNA Therapeutics Market Analysis by Type: Introduction
- 6.4.2. Market Size Absolute $ Opportunity Analysis and Forecast, By Type, 2016-2032
- 6.4.3. mRNA Therapeutics
- 6.4.4. RNA Interference
- 6.4.5. Antisense Oligonucleotides
- 6.5. Eastern Europe RNA Therapeutics Market Analysis, Opportunity and Forecast, By Indication, 2016-2032
- 6.5.1. Eastern Europe RNA Therapeutics Market Analysis by Indication: Introduction
- 6.5.2. Market Size Absolute $ Opportunity Analysis and Forecast, By Indication, 2016-2032
- 6.5.3. Infectious Diseases
- 6.5.4. Rare Genetic Diseases/Hereditary Diseases
- 6.5.5. Other Indications
- 6.6. Eastern Europe RNA Therapeutics Market Analysis, Opportunity and Forecast, By End User, 2016-2032
- 6.6.1. Eastern Europe RNA Therapeutics Market Analysis by End User: Introduction
- 6.6.2. Market Size Absolute $ Opportunity Analysis and Forecast, By End User, 2016-2032
- 6.6.3. Hospitals and Clinics
- 6.6.4. Research Settings
- 6.7. Eastern Europe RNA Therapeutics Market Analysis, Opportunity and Forecast, By Country , 2016-2032
- 6.7.1. Eastern Europe RNA Therapeutics Market Analysis by Country : Introduction
- 6.7.2. Market Size Absolute $ Opportunity Analysis and Forecast, Country , 2016-2032
- 6.7.2.1. Russia
- 6.7.2.2. Poland
- 6.7.2.3. The Czech Republic
- 6.7.2.4. Greece
- 6.7.2.5. Rest of Eastern Europe
- 7. APAC RNA Therapeutics Market Analysis, Opportunity and Forecast, 2016-2032
- 7.1. APAC RNA Therapeutics Market Analysis, 2016-2021
- 7.2. APAC RNA Therapeutics Market Opportunity and Forecast, 2023-2032
- 7.3. APAC RNA Therapeutics Market Analysis, Opportunity and Forecast, By Product, 2016-2032
- 7.3.1. APAC RNA Therapeutics Market Analysis by Product: Introduction
- 7.3.2. Market Size Absolute $ Opportunity Analysis and Forecast, By Product, 2016-2032
- 7.3.3. Vaccines
- 7.3.4. Drugs
- 7.4. APAC RNA Therapeutics Market Analysis, Opportunity and Forecast, By Type, 2016-2032
- 7.4.1. APAC RNA Therapeutics Market Analysis by Type: Introduction
- 7.4.2. Market Size Absolute $ Opportunity Analysis and Forecast, By Type, 2016-2032
- 7.4.3. mRNA Therapeutics
- 7.4.4. RNA Interference
- 7.4.5. Antisense Oligonucleotides
- 7.5. APAC RNA Therapeutics Market Analysis, Opportunity and Forecast, By Indication, 2016-2032
- 7.5.1. APAC RNA Therapeutics Market Analysis by Indication: Introduction
- 7.5.2. Market Size Absolute $ Opportunity Analysis and Forecast, By Indication, 2016-2032
- 7.5.3. Infectious Diseases
- 7.5.4. Rare Genetic Diseases/Hereditary Diseases
- 7.5.5. Other Indications
- 7.6. APAC RNA Therapeutics Market Analysis, Opportunity and Forecast, By End User, 2016-2032
- 7.6.1. APAC RNA Therapeutics Market Analysis by End User: Introduction
- 7.6.2. Market Size Absolute $ Opportunity Analysis and Forecast, By End User, 2016-2032
- 7.6.3. Hospitals and Clinics
- 7.6.4. Research Settings
- 7.7. APAC RNA Therapeutics Market Analysis, Opportunity and Forecast, By Country , 2016-2032
- 7.7.1. APAC RNA Therapeutics Market Analysis by Country : Introduction
- 7.7.2. Market Size Absolute $ Opportunity Analysis and Forecast, Country , 2016-2032
- 7.7.2.1. China
- 7.7.2.2. Japan
- 7.7.2.3. South Korea
- 7.7.2.4. India
- 7.7.2.5. Australia & New Zeland
- 7.7.2.6. Indonesia
- 7.7.2.7. Malaysia
- 7.7.2.8. Philippines
- 7.7.2.9. Singapore
- 7.7.2.10. Thailand
- 7.7.2.11. Vietnam
- 7.7.2.12. Rest of APAC
- 8. Latin America RNA Therapeutics Market Analysis, Opportunity and Forecast, 2016-2032
- 8.1. Latin America RNA Therapeutics Market Analysis, 2016-2021
- 8.2. Latin America RNA Therapeutics Market Opportunity and Forecast, 2023-2032
- 8.3. Latin America RNA Therapeutics Market Analysis, Opportunity and Forecast, By Product, 2016-2032
- 8.3.1. Latin America RNA Therapeutics Market Analysis by Product: Introduction
- 8.3.2. Market Size Absolute $ Opportunity Analysis and Forecast, By Product, 2016-2032
- 8.3.3. Vaccines
- 8.3.4. Drugs
- 8.4. Latin America RNA Therapeutics Market Analysis, Opportunity and Forecast, By Type, 2016-2032
- 8.4.1. Latin America RNA Therapeutics Market Analysis by Type: Introduction
- 8.4.2. Market Size Absolute $ Opportunity Analysis and Forecast, By Type, 2016-2032
- 8.4.3. mRNA Therapeutics
- 8.4.4. RNA Interference
- 8.4.5. Antisense Oligonucleotides
- 8.5. Latin America RNA Therapeutics Market Analysis, Opportunity and Forecast, By Indication, 2016-2032
- 8.5.1. Latin America RNA Therapeutics Market Analysis by Indication: Introduction
- 8.5.2. Market Size Absolute $ Opportunity Analysis and Forecast, By Indication, 2016-2032
- 8.5.3. Infectious Diseases
- 8.5.4. Rare Genetic Diseases/Hereditary Diseases
- 8.5.5. Other Indications
- 8.6. Latin America RNA Therapeutics Market Analysis, Opportunity and Forecast, By End User, 2016-2032
- 8.6.1. Latin America RNA Therapeutics Market Analysis by End User: Introduction
- 8.6.2. Market Size Absolute $ Opportunity Analysis and Forecast, By End User, 2016-2032
- 8.6.3. Hospitals and Clinics
- 8.6.4. Research Settings
- 8.7. Latin America RNA Therapeutics Market Analysis, Opportunity and Forecast, By Country , 2016-2032
- 8.7.1. Latin America RNA Therapeutics Market Analysis by Country : Introduction
- 8.7.2. Market Size Absolute $ Opportunity Analysis and Forecast, Country , 2016-2032
- 8.7.2.1. Brazil
- 8.7.2.2. Colombia
- 8.7.2.3. Chile
- 8.7.2.4. Argentina
- 8.7.2.5. Costa Rica
- 8.7.2.6. Rest of Latin America
- 9. Middle East & Africa RNA Therapeutics Market Analysis, Opportunity and Forecast, 2016-2032
- 9.1. Middle East & Africa RNA Therapeutics Market Analysis, 2016-2021
- 9.2. Middle East & Africa RNA Therapeutics Market Opportunity and Forecast, 2023-2032
- 9.3. Middle East & Africa RNA Therapeutics Market Analysis, Opportunity and Forecast, By Product, 2016-2032
- 9.3.1. Middle East & Africa RNA Therapeutics Market Analysis by Product: Introduction
- 9.3.2. Market Size Absolute $ Opportunity Analysis and Forecast, By Product, 2016-2032
- 9.3.3. Vaccines
- 9.3.4. Drugs
- 9.4. Middle East & Africa RNA Therapeutics Market Analysis, Opportunity and Forecast, By Type, 2016-2032
- 9.4.1. Middle East & Africa RNA Therapeutics Market Analysis by Type: Introduction
- 9.4.2. Market Size Absolute $ Opportunity Analysis and Forecast, By Type, 2016-2032
- 9.4.3. mRNA Therapeutics
- 9.4.4. RNA Interference
- 9.4.5. Antisense Oligonucleotides
- 9.5. Middle East & Africa RNA Therapeutics Market Analysis, Opportunity and Forecast, By Indication, 2016-2032
- 9.5.1. Middle East & Africa RNA Therapeutics Market Analysis by Indication: Introduction
- 9.5.2. Market Size Absolute $ Opportunity Analysis and Forecast, By Indication, 2016-2032
- 9.5.3. Infectious Diseases
- 9.5.4. Rare Genetic Diseases/Hereditary Diseases
- 9.5.5. Other Indications
- 9.6. Middle East & Africa RNA Therapeutics Market Analysis, Opportunity and Forecast, By End User, 2016-2032
- 9.6.1. Middle East & Africa RNA Therapeutics Market Analysis by End User: Introduction
- 9.6.2. Market Size Absolute $ Opportunity Analysis and Forecast, By End User, 2016-2032
- 9.6.3. Hospitals and Clinics
- 9.6.4. Research Settings
- 9.7. Middle East & Africa RNA Therapeutics Market Analysis, Opportunity and Forecast, By Country , 2016-2032
- 9.7.1. Middle East & Africa RNA Therapeutics Market Analysis by Country : Introduction
- 9.7.2. Market Size Absolute $ Opportunity Analysis and Forecast, Country , 2016-2032
- 9.7.2.1. Algeria
- 9.7.2.2. Egypt
- 9.7.2.3. Israel
- 9.7.2.4. Kuwait
- 9.7.2.5. Nigeria
- 9.7.2.6. Saudi Arabia
- 9.7.2.7. South Africa
- 9.7.2.8. Turkey
- 9.7.2.9. The UAE
- 9.7.2.10. Rest of MEA
- 10. Global RNA Therapeutics Market Analysis, Opportunity and Forecast, By Region , 2016-2032
- 10.1. Global RNA Therapeutics Market Analysis by Region : Introduction
- 10.2. Market Size Absolute $ Opportunity Analysis and Forecast, By Region , 2016-2032
- 10.2.1. North America
- 10.2.2. Western Europe
- 10.2.3. Eastern Europe
- 10.2.4. APAC
- 10.2.5. Latin America
- 10.2.6. Middle East & Africa
- 11. Global RNA Therapeutics Market Competitive Landscape, Market Share Analysis, and Company Profiles
- 11.1. Market Share Analysis
- 11.2. Company Profiles
- 11.3. Nutrien Ltd.
- 11.3.1. Company Overview
- 11.3.2. Financial Highlights
- 11.3.3. Product Portfolio
- 11.3.4. SWOT Analysis
- 11.3.5. Key Strategies and Developments
- 11.4. The Mosaic Company
- 11.4.1. Company Overview
- 11.4.2. Financial Highlights
- 11.4.3. Product Portfolio
- 11.4.4. SWOT Analysis
- 11.4.5. Key Strategies and Developments
- 11.5. Yara International ASA
- 11.5.1. Company Overview
- 11.5.2. Financial Highlights
- 11.5.3. Product Portfolio
- 11.5.4. SWOT Analysis
- 11.5.5. Key Strategies and Developments
- 11.6. K+S AG
- 11.6.1. Company Overview
- 11.6.2. Financial Highlights
- 11.6.3. Product Portfolio
- 11.6.4. SWOT Analysis
- 11.6.5. Key Strategies and Developments
- 11.7. OCP Group
- 11.7.1. Company Overview
- 11.7.2. Financial Highlights
- 11.7.3. Product Portfolio
- 11.7.4. SWOT Analysis
- 11.7.5. Key Strategies and Developments
- 11.8. Tessenderlo Group
- 11.8.1. Company Overview
- 11.8.2. Financial Highlights
- 11.8.3. Product Portfolio
- 11.8.4. SWOT Analysis
- 11.8.5. Key Strategies and Developments
- 11.9. EuroChem Group AG
- 11.9.1. Company Overview
- 11.9.2. Financial Highlights
- 11.9.3. Product Portfolio
- 11.9.4. SWOT Analysis
- 11.9.5. Key Strategies and Developments
- 11.10. Coromandel International Limited
- 11.10.1. Company Overview
- 11.10.2. Financial Highlights
- 11.10.3. Product Portfolio
- 11.10.4. SWOT Analysis
- 11.10.5. Key Strategies and Developments
- 11.11. Israel Chemicals Ltd.
- 11.11.1. Company Overview
- 11.11.2. Financial Highlights
- 11.11.3. Product Portfolio
- 11.11.4. SWOT Analysis
- 11.11.5. Key Strategies and Developments
- 11.12. Deepak Fertilisers and Petrochemicals Corporation Ltd.
- 11.12.1. Company Overview
- 11.12.2. Financial Highlights
- 11.12.3. Product Portfolio
- 11.12.4. SWOT Analysis
- 11.12.5. Key Strategies and Developments
- 11.13.1. Company Overview
- 11.13.2. Financial Highlights
- 11.13.3. Product Portfolio
- 11.13.4. SWOT Analysis
- 11.13.5. Key Strategies and Developments
- 11.14. Koch Fertilizer, LLC
- 11.14.1. Company Overview
- 11.14.2. Financial Highlights
- 11.14.3. Product Portfolio
- 11.14.4. SWOT Analysis
- 11.14.5. Key Strategies and Developments
- 11.15. H.J. Baker & Bro., Inc.
- 11.15.1. Company Overview
- 11.15.2. Financial Highlights
- 11.15.3. Product Portfolio
- 11.15.4. SWOT Analysis
- 11.15.5. Key Strategies and Developments
- 11.16. ICL Group
- 11.16.1. Company Overview
- 11.16.2. Financial Highlights
- 11.16.3. Product Portfolio
- 11.16.4. SWOT Analysis
- 11.16.5. Key Strategies and Developments
- 11.17. Haifa Group
- 11.17.1. Company Overview
- 11.17.2. Financial Highlights
- 11.17.3. Product Portfolio
- 11.17.4. SWOT Analysis
- 11.17.5. Key Strategies and Developments
- 12. Assumptions and Acronyms
- 13. Research Methodology
- 14. Contact
- List of Figures
- Figure 1: Global RNA Therapeutics Market Revenue (US$ Mn) Market Share by Product in 2022
- Figure 2: Global RNA Therapeutics Market Attractiveness Analysis by Product, 2016-2032
- Figure 3: Global RNA Therapeutics Market Revenue (US$ Mn) Market Share by Typein 2022
- Figure 4: Global RNA Therapeutics Market Attractiveness Analysis by Type, 2016-2032
- Figure 5: Global RNA Therapeutics Market Revenue (US$ Mn) Market Share by Indicationin 2022
- Figure 6: Global RNA Therapeutics Market Attractiveness Analysis by Indication, 2016-2032
- Figure 7: Global RNA Therapeutics Market Revenue (US$ Mn) Market Share by End Userin 2022
- Figure 8: Global RNA Therapeutics Market Attractiveness Analysis by End User, 2016-2032
- Figure 9: Global RNA Therapeutics Market Revenue (US$ Mn) Market Share by Region in 2022
- Figure 10: Global RNA Therapeutics Market Attractiveness Analysis by Region, 2016-2032
- Figure 11: Global RNA Therapeutics Market Revenue (US$ Mn) (2016-2032)
- Figure 12: Global RNA Therapeutics Market Revenue (US$ Mn) Comparison by Region (2016-2032)
- Figure 13: Global RNA Therapeutics Market Revenue (US$ Mn) Comparison by Product (2016-2032)
- Figure 14: Global RNA Therapeutics Market Revenue (US$ Mn) Comparison by Type (2016-2032)
- Figure 15: Global RNA Therapeutics Market Revenue (US$ Mn) Comparison by Indication (2016-2032)
- Figure 16: Global RNA Therapeutics Market Revenue (US$ Mn) Comparison by End User (2016-2032)
- Figure 17: Global RNA Therapeutics Market Y-o-Y Growth Rate Comparison by Region (2016-2032)
- Figure 18: Global RNA Therapeutics Market Y-o-Y Growth Rate Comparison by Product (2016-2032)
- Figure 19: Global RNA Therapeutics Market Y-o-Y Growth Rate Comparison by Type (2016-2032)
- Figure 20: Global RNA Therapeutics Market Y-o-Y Growth Rate Comparison by Indication (2016-2032)
- Figure 21: Global RNA Therapeutics Market Y-o-Y Growth Rate Comparison by End User (2016-2032)
- Figure 22: Global RNA Therapeutics Market Share Comparison by Region (2016-2032)
- Figure 23: Global RNA Therapeutics Market Share Comparison by Product (2016-2032)
- Figure 24: Global RNA Therapeutics Market Share Comparison by Type (2016-2032)
- Figure 25: Global RNA Therapeutics Market Share Comparison by Indication (2016-2032)
- Figure 26: Global RNA Therapeutics Market Share Comparison by End User (2016-2032)
- Figure 27: North America RNA Therapeutics Market Revenue (US$ Mn) Market Share by Productin 2022
- Figure 28: North America RNA Therapeutics Market Attractiveness Analysis by Product, 2016-2032
- Figure 29: North America RNA Therapeutics Market Revenue (US$ Mn) Market Share by Typein 2022
- Figure 30: North America RNA Therapeutics Market Attractiveness Analysis by Type, 2016-2032
- Figure 31: North America RNA Therapeutics Market Revenue (US$ Mn) Market Share by Indicationin 2022
- Figure 32: North America RNA Therapeutics Market Attractiveness Analysis by Indication, 2016-2032
- Figure 33: North America RNA Therapeutics Market Revenue (US$ Mn) Market Share by End Userin 2022
- Figure 34: North America RNA Therapeutics Market Attractiveness Analysis by End User, 2016-2032
- Figure 35: North America RNA Therapeutics Market Revenue (US$ Mn) Market Share by Country in 2022
- Figure 36: North America RNA Therapeutics Market Attractiveness Analysis by Country, 2016-2032
- Figure 37: North America RNA Therapeutics Market Revenue (US$ Mn) (2016-2032)
- Figure 38: North America RNA Therapeutics Market Revenue (US$ Mn) Comparison by Country (2016-2032)
- Figure 39: North America RNA Therapeutics Market Revenue (US$ Mn) Comparison by Product (2016-2032)
- Figure 40: North America RNA Therapeutics Market Revenue (US$ Mn) Comparison by Type (2016-2032)
- Figure 41: North America RNA Therapeutics Market Revenue (US$ Mn) Comparison by Indication (2016-2032)
- Figure 42: North America RNA Therapeutics Market Revenue (US$ Mn) Comparison by End User (2016-2032)
- Figure 43: North America RNA Therapeutics Market Y-o-Y Growth Rate Comparison by Country (2016-2032)
- Figure 44: North America RNA Therapeutics Market Y-o-Y Growth Rate Comparison by Product (2016-2032)
- Figure 45: North America RNA Therapeutics Market Y-o-Y Growth Rate Comparison by Type (2016-2032)
- Figure 46: North America RNA Therapeutics Market Y-o-Y Growth Rate Comparison by Indication (2016-2032)
- Figure 47: North America RNA Therapeutics Market Y-o-Y Growth Rate Comparison by End User (2016-2032)
- Figure 48: North America RNA Therapeutics Market Share Comparison by Country (2016-2032)
- Figure 49: North America RNA Therapeutics Market Share Comparison by Product (2016-2032)
- Figure 50: North America RNA Therapeutics Market Share Comparison by Type (2016-2032)
- Figure 51: North America RNA Therapeutics Market Share Comparison by Indication (2016-2032)
- Figure 52: North America RNA Therapeutics Market Share Comparison by End User (2016-2032)
- Figure 53: Western Europe RNA Therapeutics Market Revenue (US$ Mn) Market Share by Productin 2022
- Figure 54: Western Europe RNA Therapeutics Market Attractiveness Analysis by Product, 2016-2032
- Figure 55: Western Europe RNA Therapeutics Market Revenue (US$ Mn) Market Share by Typein 2022
- Figure 56: Western Europe RNA Therapeutics Market Attractiveness Analysis by Type, 2016-2032
- Figure 57: Western Europe RNA Therapeutics Market Revenue (US$ Mn) Market Share by Indicationin 2022
- Figure 58: Western Europe RNA Therapeutics Market Attractiveness Analysis by Indication, 2016-2032
- Figure 59: Western Europe RNA Therapeutics Market Revenue (US$ Mn) Market Share by End Userin 2022
- Figure 60: Western Europe RNA Therapeutics Market Attractiveness Analysis by End User, 2016-2032
- Figure 61: Western Europe RNA Therapeutics Market Revenue (US$ Mn) Market Share by Country in 2022
- Figure 62: Western Europe RNA Therapeutics Market Attractiveness Analysis by Country, 2016-2032
- Figure 63: Western Europe RNA Therapeutics Market Revenue (US$ Mn) (2016-2032)
- Figure 64: Western Europe RNA Therapeutics Market Revenue (US$ Mn) Comparison by Country (2016-2032)
- Figure 65: Western Europe RNA Therapeutics Market Revenue (US$ Mn) Comparison by Product (2016-2032)
- Figure 66: Western Europe RNA Therapeutics Market Revenue (US$ Mn) Comparison by Type (2016-2032)
- Figure 67: Western Europe RNA Therapeutics Market Revenue (US$ Mn) Comparison by Indication (2016-2032)
- Figure 68: Western Europe RNA Therapeutics Market Revenue (US$ Mn) Comparison by End User (2016-2032)
- Figure 69: Western Europe RNA Therapeutics Market Y-o-Y Growth Rate Comparison by Country (2016-2032)
- Figure 70: Western Europe RNA Therapeutics Market Y-o-Y Growth Rate Comparison by Product (2016-2032)
- Figure 71: Western Europe RNA Therapeutics Market Y-o-Y Growth Rate Comparison by Type (2016-2032)
- Figure 72: Western Europe RNA Therapeutics Market Y-o-Y Growth Rate Comparison by Indication (2016-2032)
- Figure 73: Western Europe RNA Therapeutics Market Y-o-Y Growth Rate Comparison by End User (2016-2032)
- Figure 74: Western Europe RNA Therapeutics Market Share Comparison by Country (2016-2032)
- Figure 75: Western Europe RNA Therapeutics Market Share Comparison by Product (2016-2032)
- Figure 76: Western Europe RNA Therapeutics Market Share Comparison by Type (2016-2032)
- Figure 77: Western Europe RNA Therapeutics Market Share Comparison by Indication (2016-2032)
- Figure 78: Western Europe RNA Therapeutics Market Share Comparison by End User (2016-2032)
- Figure 79: Eastern Europe RNA Therapeutics Market Revenue (US$ Mn) Market Share by Productin 2022
- Figure 80: Eastern Europe RNA Therapeutics Market Attractiveness Analysis by Product, 2016-2032
- Figure 81: Eastern Europe RNA Therapeutics Market Revenue (US$ Mn) Market Share by Typein 2022
- Figure 82: Eastern Europe RNA Therapeutics Market Attractiveness Analysis by Type, 2016-2032
- Figure 83: Eastern Europe RNA Therapeutics Market Revenue (US$ Mn) Market Share by Indicationin 2022
- Figure 84: Eastern Europe RNA Therapeutics Market Attractiveness Analysis by Indication, 2016-2032
- Figure 85: Eastern Europe RNA Therapeutics Market Revenue (US$ Mn) Market Share by End Userin 2022
- Figure 86: Eastern Europe RNA Therapeutics Market Attractiveness Analysis by End User, 2016-2032
- Figure 87: Eastern Europe RNA Therapeutics Market Revenue (US$ Mn) Market Share by Country in 2022
- Figure 88: Eastern Europe RNA Therapeutics Market Attractiveness Analysis by Country, 2016-2032
- Figure 89: Eastern Europe RNA Therapeutics Market Revenue (US$ Mn) (2016-2032)
- Figure 90: Eastern Europe RNA Therapeutics Market Revenue (US$ Mn) Comparison by Country (2016-2032)
- Figure 91: Eastern Europe RNA Therapeutics Market Revenue (US$ Mn) Comparison by Product (2016-2032)
- Figure 92: Eastern Europe RNA Therapeutics Market Revenue (US$ Mn) Comparison by Type (2016-2032)
- Figure 93: Eastern Europe RNA Therapeutics Market Revenue (US$ Mn) Comparison by Indication (2016-2032)
- Figure 94: Eastern Europe RNA Therapeutics Market Revenue (US$ Mn) Comparison by End User (2016-2032)
- Figure 95: Eastern Europe RNA Therapeutics Market Y-o-Y Growth Rate Comparison by Country (2016-2032)
- Figure 96: Eastern Europe RNA Therapeutics Market Y-o-Y Growth Rate Comparison by Product (2016-2032)
- Figure 97: Eastern Europe RNA Therapeutics Market Y-o-Y Growth Rate Comparison by Type (2016-2032)
- Figure 98: Eastern Europe RNA Therapeutics Market Y-o-Y Growth Rate Comparison by Indication (2016-2032)
- Figure 99: Eastern Europe RNA Therapeutics Market Y-o-Y Growth Rate Comparison by End User (2016-2032)
- Figure 100: Eastern Europe RNA Therapeutics Market Share Comparison by Country (2016-2032)
- Figure 101: Eastern Europe RNA Therapeutics Market Share Comparison by Product (2016-2032)
- Figure 102: Eastern Europe RNA Therapeutics Market Share Comparison by Type (2016-2032)
- Figure 103: Eastern Europe RNA Therapeutics Market Share Comparison by Indication (2016-2032)
- Figure 104: Eastern Europe RNA Therapeutics Market Share Comparison by End User (2016-2032)
- Figure 105: APAC RNA Therapeutics Market Revenue (US$ Mn) Market Share by Productin 2022
- Figure 106: APAC RNA Therapeutics Market Attractiveness Analysis by Product, 2016-2032
- Figure 107: APAC RNA Therapeutics Market Revenue (US$ Mn) Market Share by Typein 2022
- Figure 108: APAC RNA Therapeutics Market Attractiveness Analysis by Type, 2016-2032
- Figure 109: APAC RNA Therapeutics Market Revenue (US$ Mn) Market Share by Indicationin 2022
- Figure 110: APAC RNA Therapeutics Market Attractiveness Analysis by Indication, 2016-2032
- Figure 111: APAC RNA Therapeutics Market Revenue (US$ Mn) Market Share by End Userin 2022
- Figure 112: APAC RNA Therapeutics Market Attractiveness Analysis by End User, 2016-2032
- Figure 113: APAC RNA Therapeutics Market Revenue (US$ Mn) Market Share by Country in 2022
- Figure 114: APAC RNA Therapeutics Market Attractiveness Analysis by Country, 2016-2032
- Figure 115: APAC RNA Therapeutics Market Revenue (US$ Mn) (2016-2032)
- Figure 116: APAC RNA Therapeutics Market Revenue (US$ Mn) Comparison by Country (2016-2032)
- Figure 117: APAC RNA Therapeutics Market Revenue (US$ Mn) Comparison by Product (2016-2032)
- Figure 118: APAC RNA Therapeutics Market Revenue (US$ Mn) Comparison by Type (2016-2032)
- Figure 119: APAC RNA Therapeutics Market Revenue (US$ Mn) Comparison by Indication (2016-2032)
- Figure 120: APAC RNA Therapeutics Market Revenue (US$ Mn) Comparison by End User (2016-2032)
- Figure 121: APAC RNA Therapeutics Market Y-o-Y Growth Rate Comparison by Country (2016-2032)
- Figure 122: APAC RNA Therapeutics Market Y-o-Y Growth Rate Comparison by Product (2016-2032)
- Figure 123: APAC RNA Therapeutics Market Y-o-Y Growth Rate Comparison by Type (2016-2032)
- Figure 124: APAC RNA Therapeutics Market Y-o-Y Growth Rate Comparison by Indication (2016-2032)
- Figure 125: APAC RNA Therapeutics Market Y-o-Y Growth Rate Comparison by End User (2016-2032)
- Figure 126: APAC RNA Therapeutics Market Share Comparison by Country (2016-2032)
- Figure 127: APAC RNA Therapeutics Market Share Comparison by Product (2016-2032)
- Figure 128: APAC RNA Therapeutics Market Share Comparison by Type (2016-2032)
- Figure 129: APAC RNA Therapeutics Market Share Comparison by Indication (2016-2032)
- Figure 130: APAC RNA Therapeutics Market Share Comparison by End User (2016-2032)
- Figure 131: Latin America RNA Therapeutics Market Revenue (US$ Mn) Market Share by Productin 2022
- Figure 132: Latin America RNA Therapeutics Market Attractiveness Analysis by Product, 2016-2032
- Figure 133: Latin America RNA Therapeutics Market Revenue (US$ Mn) Market Share by Typein 2022
- Figure 134: Latin America RNA Therapeutics Market Attractiveness Analysis by Type, 2016-2032
- Figure 135: Latin America RNA Therapeutics Market Revenue (US$ Mn) Market Share by Indicationin 2022
- Figure 136: Latin America RNA Therapeutics Market Attractiveness Analysis by Indication, 2016-2032
- Figure 137: Latin America RNA Therapeutics Market Revenue (US$ Mn) Market Share by End Userin 2022
- Figure 138: Latin America RNA Therapeutics Market Attractiveness Analysis by End User, 2016-2032
- Figure 139: Latin America RNA Therapeutics Market Revenue (US$ Mn) Market Share by Country in 2022
- Figure 140: Latin America RNA Therapeutics Market Attractiveness Analysis by Country, 2016-2032
- Figure 141: Latin America RNA Therapeutics Market Revenue (US$ Mn) (2016-2032)
- Figure 142: Latin America RNA Therapeutics Market Revenue (US$ Mn) Comparison by Country (2016-2032)
- Figure 143: Latin America RNA Therapeutics Market Revenue (US$ Mn) Comparison by Product (2016-2032)
- Figure 144: Latin America RNA Therapeutics Market Revenue (US$ Mn) Comparison by Type (2016-2032)
- Figure 145: Latin America RNA Therapeutics Market Revenue (US$ Mn) Comparison by Indication (2016-2032)
- Figure 146: Latin America RNA Therapeutics Market Revenue (US$ Mn) Comparison by End User (2016-2032)
- Figure 147: Latin America RNA Therapeutics Market Y-o-Y Growth Rate Comparison by Country (2016-2032)
- Figure 148: Latin America RNA Therapeutics Market Y-o-Y Growth Rate Comparison by Product (2016-2032)
- Figure 149: Latin America RNA Therapeutics Market Y-o-Y Growth Rate Comparison by Type (2016-2032)
- Figure 150: Latin America RNA Therapeutics Market Y-o-Y Growth Rate Comparison by Indication (2016-2032)
- Figure 151: Latin America RNA Therapeutics Market Y-o-Y Growth Rate Comparison by End User (2016-2032)
- Figure 152: Latin America RNA Therapeutics Market Share Comparison by Country (2016-2032)
- Figure 153: Latin America RNA Therapeutics Market Share Comparison by Product (2016-2032)
- Figure 154: Latin America RNA Therapeutics Market Share Comparison by Type (2016-2032)
- Figure 155: Latin America RNA Therapeutics Market Share Comparison by Indication (2016-2032)
- Figure 156: Latin America RNA Therapeutics Market Share Comparison by End User (2016-2032)
- Figure 157: Middle East & Africa RNA Therapeutics Market Revenue (US$ Mn) Market Share by Productin 2022
- Figure 158: Middle East & Africa RNA Therapeutics Market Attractiveness Analysis by Product, 2016-2032
- Figure 159: Middle East & Africa RNA Therapeutics Market Revenue (US$ Mn) Market Share by Typein 2022
- Figure 160: Middle East & Africa RNA Therapeutics Market Attractiveness Analysis by Type, 2016-2032
- Figure 161: Middle East & Africa RNA Therapeutics Market Revenue (US$ Mn) Market Share by Indicationin 2022
- Figure 162: Middle East & Africa RNA Therapeutics Market Attractiveness Analysis by Indication, 2016-2032
- Figure 163: Middle East & Africa RNA Therapeutics Market Revenue (US$ Mn) Market Share by End Userin 2022
- Figure 164: Middle East & Africa RNA Therapeutics Market Attractiveness Analysis by End User, 2016-2032
- Figure 165: Middle East & Africa RNA Therapeutics Market Revenue (US$ Mn) Market Share by Country in 2022
- Figure 166: Middle East & Africa RNA Therapeutics Market Attractiveness Analysis by Country, 2016-2032
- Figure 167: Middle East & Africa RNA Therapeutics Market Revenue (US$ Mn) (2016-2032)
- Figure 168: Middle East & Africa RNA Therapeutics Market Revenue (US$ Mn) Comparison by Country (2016-2032)
- Figure 169: Middle East & Africa RNA Therapeutics Market Revenue (US$ Mn) Comparison by Product (2016-2032)
- Figure 170: Middle East & Africa RNA Therapeutics Market Revenue (US$ Mn) Comparison by Type (2016-2032)
- Figure 171: Middle East & Africa RNA Therapeutics Market Revenue (US$ Mn) Comparison by Indication (2016-2032)
- Figure 172: Middle East & Africa RNA Therapeutics Market Revenue (US$ Mn) Comparison by End User (2016-2032)
- Figure 173: Middle East & Africa RNA Therapeutics Market Y-o-Y Growth Rate Comparison by Country (2016-2032)
- Figure 174: Middle East & Africa RNA Therapeutics Market Y-o-Y Growth Rate Comparison by Product (2016-2032)
- Figure 175: Middle East & Africa RNA Therapeutics Market Y-o-Y Growth Rate Comparison by Type (2016-2032)
- Figure 176: Middle East & Africa RNA Therapeutics Market Y-o-Y Growth Rate Comparison by Indication (2016-2032)
- Figure 177: Middle East & Africa RNA Therapeutics Market Y-o-Y Growth Rate Comparison by End User (2016-2032)
- Figure 178: Middle East & Africa RNA Therapeutics Market Share Comparison by Country (2016-2032)
- Figure 179: Middle East & Africa RNA Therapeutics Market Share Comparison by Product (2016-2032)
- Figure 180: Middle East & Africa RNA Therapeutics Market Share Comparison by Type (2016-2032)
- Figure 181: Middle East & Africa RNA Therapeutics Market Share Comparison by Indication (2016-2032)
- Figure 182: Middle East & Africa RNA Therapeutics Market Share Comparison by End User (2016-2032)
- List of Tables
- Table 1: Global RNA Therapeutics Market Comparison by Product (2016-2032)
- Table 2: Global RNA Therapeutics Market Comparison by Type (2016-2032)
- Table 3: Global RNA Therapeutics Market Comparison by Indication (2016-2032)
- Table 4: Global RNA Therapeutics Market Comparison by End User (2016-2032)
- Table 5: Global RNA Therapeutics Market Revenue (US$ Mn) Comparison by Region (2016-2032)
- Table 6: Global RNA Therapeutics Market Revenue (US$ Mn) (2016-2032)
- Table 7: Global RNA Therapeutics Market Revenue (US$ Mn) Comparison by Region (2016-2032)
- Table 8: Global RNA Therapeutics Market Revenue (US$ Mn) Comparison by Product (2016-2032)
- Table 9: Global RNA Therapeutics Market Revenue (US$ Mn) Comparison by Type (2016-2032)
- Table 10: Global RNA Therapeutics Market Revenue (US$ Mn) Comparison by Indication (2016-2032)
- Table 11: Global RNA Therapeutics Market Revenue (US$ Mn) Comparison by End User (2016-2032)
- Table 12: Global RNA Therapeutics Market Y-o-Y Growth Rate Comparison by Region (2016-2032)
- Table 13: Global RNA Therapeutics Market Y-o-Y Growth Rate Comparison by Product (2016-2032)
- Table 14: Global RNA Therapeutics Market Y-o-Y Growth Rate Comparison by Type (2016-2032)
- Table 15: Global RNA Therapeutics Market Y-o-Y Growth Rate Comparison by Indication (2016-2032)
- Table 16: Global RNA Therapeutics Market Y-o-Y Growth Rate Comparison by End User (2016-2032)
- Table 17: Global RNA Therapeutics Market Share Comparison by Region (2016-2032)
- Table 18: Global RNA Therapeutics Market Share Comparison by Product (2016-2032)
- Table 19: Global RNA Therapeutics Market Share Comparison by Type (2016-2032)
- Table 20: Global RNA Therapeutics Market Share Comparison by Indication (2016-2032)
- Table 21: Global RNA Therapeutics Market Share Comparison by End User (2016-2032)
- Table 22: North America RNA Therapeutics Market Comparison by Type (2016-2032)
- Table 23: North America RNA Therapeutics Market Comparison by Indication (2016-2032)
- Table 24: North America RNA Therapeutics Market Comparison by End User (2016-2032)
- Table 25: North America RNA Therapeutics Market Revenue (US$ Mn) Comparison by Country (2016-2032)
- Table 26: North America RNA Therapeutics Market Revenue (US$ Mn) (2016-2032)
- Table 27: North America RNA Therapeutics Market Revenue (US$ Mn) Comparison by Country (2016-2032)
- Table 28: North America RNA Therapeutics Market Revenue (US$ Mn) Comparison by Product (2016-2032)
- Table 29: North America RNA Therapeutics Market Revenue (US$ Mn) Comparison by Type (2016-2032)
- Table 30: North America RNA Therapeutics Market Revenue (US$ Mn) Comparison by Indication (2016-2032)
- Table 31: North America RNA Therapeutics Market Revenue (US$ Mn) Comparison by End User (2016-2032)
- Table 32: North America RNA Therapeutics Market Y-o-Y Growth Rate Comparison by Country (2016-2032)
- Table 33: North America RNA Therapeutics Market Y-o-Y Growth Rate Comparison by Product (2016-2032)
- Table 34: North America RNA Therapeutics Market Y-o-Y Growth Rate Comparison by Type (2016-2032)
- Table 35: North America RNA Therapeutics Market Y-o-Y Growth Rate Comparison by Indication (2016-2032)
- Table 36: North America RNA Therapeutics Market Y-o-Y Growth Rate Comparison by End User (2016-2032)
- Table 37: North America RNA Therapeutics Market Share Comparison by Country (2016-2032)
- Table 38: North America RNA Therapeutics Market Share Comparison by Product (2016-2032)
- Table 39: North America RNA Therapeutics Market Share Comparison by Type (2016-2032)
- Table 40: North America RNA Therapeutics Market Share Comparison by Indication (2016-2032)
- Table 41: North America RNA Therapeutics Market Share Comparison by End User (2016-2032)
- Table 42: Western Europe RNA Therapeutics Market Comparison by Product (2016-2032)
- Table 43: Western Europe RNA Therapeutics Market Comparison by Type (2016-2032)
- Table 44: Western Europe RNA Therapeutics Market Comparison by Indication (2016-2032)
- Table 45: Western Europe RNA Therapeutics Market Comparison by End User (2016-2032)
- Table 46: Western Europe RNA Therapeutics Market Revenue (US$ Mn) Comparison by Country (2016-2032)
- Table 47: Western Europe RNA Therapeutics Market Revenue (US$ Mn) (2016-2032)
- Table 48: Western Europe RNA Therapeutics Market Revenue (US$ Mn) Comparison by Country (2016-2032)
- Table 49: Western Europe RNA Therapeutics Market Revenue (US$ Mn) Comparison by Product (2016-2032)
- Table 50: Western Europe RNA Therapeutics Market Revenue (US$ Mn) Comparison by Type (2016-2032)
- Table 51: Western Europe RNA Therapeutics Market Revenue (US$ Mn) Comparison by Indication (2016-2032)
- Table 52: Western Europe RNA Therapeutics Market Revenue (US$ Mn) Comparison by End User (2016-2032)
- Table 53: Western Europe RNA Therapeutics Market Y-o-Y Growth Rate Comparison by Country (2016-2032)
- Table 54: Western Europe RNA Therapeutics Market Y-o-Y Growth Rate Comparison by Product (2016-2032)
- Table 55: Western Europe RNA Therapeutics Market Y-o-Y Growth Rate Comparison by Type (2016-2032)
- Table 56: Western Europe RNA Therapeutics Market Y-o-Y Growth Rate Comparison by Indication (2016-2032)
- Table 57: Western Europe RNA Therapeutics Market Y-o-Y Growth Rate Comparison by End User (2016-2032)
- Table 58: Western Europe RNA Therapeutics Market Share Comparison by Country (2016-2032)
- Table 59: Western Europe RNA Therapeutics Market Share Comparison by Product (2016-2032)
- Table 60: Western Europe RNA Therapeutics Market Share Comparison by Type (2016-2032)
- Table 61: Western Europe RNA Therapeutics Market Share Comparison by Indication (2016-2032)
- Table 62: Western Europe RNA Therapeutics Market Share Comparison by End User (2016-2032)
- Table 63: Eastern Europe RNA Therapeutics Market Comparison by Product (2016-2032)
- Table 64: Eastern Europe RNA Therapeutics Market Comparison by Type (2016-2032)
- Table 65: Eastern Europe RNA Therapeutics Market Comparison by Indication (2016-2032)
- Table 66: Eastern Europe RNA Therapeutics Market Comparison by End User (2016-2032)
- Table 67: Eastern Europe RNA Therapeutics Market Revenue (US$ Mn) Comparison by Country (2016-2032)
- Table 68: Eastern Europe RNA Therapeutics Market Revenue (US$ Mn) (2016-2032)
- Table 69: Eastern Europe RNA Therapeutics Market Revenue (US$ Mn) Comparison by Country (2016-2032)
- Table 70: Eastern Europe RNA Therapeutics Market Revenue (US$ Mn) Comparison by Product (2016-2032)
- Table 71: Eastern Europe RNA Therapeutics Market Revenue (US$ Mn) Comparison by Type (2016-2032)
- Table 72: Eastern Europe RNA Therapeutics Market Revenue (US$ Mn) Comparison by Indication (2016-2032)
- Table 73: Eastern Europe RNA Therapeutics Market Revenue (US$ Mn) Comparison by End User (2016-2032)
- Table 74: Eastern Europe RNA Therapeutics Market Y-o-Y Growth Rate Comparison by Country (2016-2032)
- Table 75: Eastern Europe RNA Therapeutics Market Y-o-Y Growth Rate Comparison by Product (2016-2032)
- Table 76: Eastern Europe RNA Therapeutics Market Y-o-Y Growth Rate Comparison by Type (2016-2032)
- Table 77: Eastern Europe RNA Therapeutics Market Y-o-Y Growth Rate Comparison by Indication (2016-2032)
- Table 78: Eastern Europe RNA Therapeutics Market Y-o-Y Growth Rate Comparison by End User (2016-2032)
- Table 79: Eastern Europe RNA Therapeutics Market Share Comparison by Country (2016-2032)
- Table 80: Eastern Europe RNA Therapeutics Market Share Comparison by Product (2016-2032)
- Table 81: Eastern Europe RNA Therapeutics Market Share Comparison by Type (2016-2032)
- Table 82: Eastern Europe RNA Therapeutics Market Share Comparison by Indication (2016-2032)
- Table 83: Eastern Europe RNA Therapeutics Market Share Comparison by End User (2016-2032)
- Table 84: APAC RNA Therapeutics Market Comparison by Product (2016-2032)
- Table 85: APAC RNA Therapeutics Market Comparison by Type (2016-2032)
- Table 86: APAC RNA Therapeutics Market Comparison by Indication (2016-2032)
- Table 87: APAC RNA Therapeutics Market Comparison by End User (2016-2032)
- Table 88: APAC RNA Therapeutics Market Revenue (US$ Mn) Comparison by Country (2016-2032)
- Table 89: APAC RNA Therapeutics Market Revenue (US$ Mn) (2016-2032)
- Table 90: APAC RNA Therapeutics Market Revenue (US$ Mn) Comparison by Country (2016-2032)
- Table 91: APAC RNA Therapeutics Market Revenue (US$ Mn) Comparison by Product (2016-2032)
- Table 92: APAC RNA Therapeutics Market Revenue (US$ Mn) Comparison by Type (2016-2032)
- Table 93: APAC RNA Therapeutics Market Revenue (US$ Mn) Comparison by Indication (2016-2032)
- Table 94: APAC RNA Therapeutics Market Revenue (US$ Mn) Comparison by End User (2016-2032)
- Table 95: APAC RNA Therapeutics Market Y-o-Y Growth Rate Comparison by Country (2016-2032)
- Table 96: APAC RNA Therapeutics Market Y-o-Y Growth Rate Comparison by Product (2016-2032)
- Table 97: APAC RNA Therapeutics Market Y-o-Y Growth Rate Comparison by Type (2016-2032)
- Table 98: APAC RNA Therapeutics Market Y-o-Y Growth Rate Comparison by Indication (2016-2032)
- Table 99: APAC RNA Therapeutics Market Y-o-Y Growth Rate Comparison by End User (2016-2032)
- Table 100: APAC RNA Therapeutics Market Share Comparison by Country (2016-2032)
- Table 101: APAC RNA Therapeutics Market Share Comparison by Product (2016-2032)
- Table 102: APAC RNA Therapeutics Market Share Comparison by Type (2016-2032)
- Table 103: APAC RNA Therapeutics Market Share Comparison by Indication (2016-2032)
- Table 104: APAC RNA Therapeutics Market Share Comparison by End User (2016-2032)
- Table 105: Latin America RNA Therapeutics Market Comparison by Product (2016-2032)
- Table 106: Latin America RNA Therapeutics Market Comparison by Type (2016-2032)
- Table 107: Latin America RNA Therapeutics Market Comparison by Indication (2016-2032)
- Table 108: Latin America RNA Therapeutics Market Comparison by End User (2016-2032)
- Table 109: Latin America RNA Therapeutics Market Revenue (US$ Mn) Comparison by Country (2016-2032)
- Table 110: Latin America RNA Therapeutics Market Revenue (US$ Mn) (2016-2032)
- Table 111: Latin America RNA Therapeutics Market Revenue (US$ Mn) Comparison by Country (2016-2032)
- Table 112: Latin America RNA Therapeutics Market Revenue (US$ Mn) Comparison by Product (2016-2032)
- Table 113: Latin America RNA Therapeutics Market Revenue (US$ Mn) Comparison by Type (2016-2032)
- Table 114: Latin America RNA Therapeutics Market Revenue (US$ Mn) Comparison by Indication (2016-2032)
- Table 115: Latin America RNA Therapeutics Market Revenue (US$ Mn) Comparison by End User (2016-2032)
- Table 116: Latin America RNA Therapeutics Market Y-o-Y Growth Rate Comparison by Country (2016-2032)
- Table 117: Latin America RNA Therapeutics Market Y-o-Y Growth Rate Comparison by Product (2016-2032)
- Table 118: Latin America RNA Therapeutics Market Y-o-Y Growth Rate Comparison by Type (2016-2032)
- Table 119: Latin America RNA Therapeutics Market Y-o-Y Growth Rate Comparison by Indication (2016-2032)
- Table 120: Latin America RNA Therapeutics Market Y-o-Y Growth Rate Comparison by End User (2016-2032)
- Table 121: Latin America RNA Therapeutics Market Share Comparison by Country (2016-2032)
- Table 122: Latin America RNA Therapeutics Market Share Comparison by Product (2016-2032)
- Table 123: Latin America RNA Therapeutics Market Share Comparison by Type (2016-2032)
- Table 124: Latin America RNA Therapeutics Market Share Comparison by Indication (2016-2032)
- Table 125: Latin America RNA Therapeutics Market Share Comparison by End User (2016-2032)
- Table 126: Middle East & Africa RNA Therapeutics Market Comparison by Product (2016-2032)
- Table 127: Middle East & Africa RNA Therapeutics Market Comparison by Type (2016-2032)
- Table 128: Middle East & Africa RNA Therapeutics Market Comparison by Indication (2016-2032)
- Table 129: Middle East & Africa RNA Therapeutics Market Comparison by End User (2016-2032)
- Table 130: Middle East & Africa RNA Therapeutics Market Revenue (US$ Mn) Comparison by Country (2016-2032)
- Table 131: Middle East & Africa RNA Therapeutics Market Revenue (US$ Mn) (2016-2032)
- Table 132: Middle East & Africa RNA Therapeutics Market Revenue (US$ Mn) Comparison by Country (2016-2032)
- Table 133: Middle East & Africa RNA Therapeutics Market Revenue (US$ Mn) Comparison by Product (2016-2032)
- Table 134: Middle East & Africa RNA Therapeutics Market Revenue (US$ Mn) Comparison by Type (2016-2032)
- Table 135: Middle East & Africa RNA Therapeutics Market Revenue (US$ Mn) Comparison by Indication (2016-2032)
- Table 136: Middle East & Africa RNA Therapeutics Market Revenue (US$ Mn) Comparison by End User (2016-2032)
- Table 137: Middle East & Africa RNA Therapeutics Market Y-o-Y Growth Rate Comparison by Country (2016-2032)
- Table 138: Middle East & Africa RNA Therapeutics Market Y-o-Y Growth Rate Comparison by Product (2016-2032)
- Table 139: Middle East & Africa RNA Therapeutics Market Y-o-Y Growth Rate Comparison by Type (2016-2032)
- Table 140: Middle East & Africa RNA Therapeutics Market Y-o-Y Growth Rate Comparison by Indication (2016-2032)
- Table 141: Middle East & Africa RNA Therapeutics Market Y-o-Y Growth Rate Comparison by End User (2016-2032)
- Table 142: Middle East & Africa RNA Therapeutics Market Share Comparison by Country (2016-2032)
- Table 143: Middle East & Africa RNA Therapeutics Market Share Comparison by Product (2016-2032)
- Table 144: Middle East & Africa RNA Therapeutics Market Share Comparison by Type (2016-2032)
- Table 145: Middle East & Africa RNA Therapeutics Market Share Comparison by Indication (2016-2032)
- Table 146: Middle East & Africa RNA Therapeutics Market Share Comparison by End User (2016-2032)
- 1. Executive Summary
-
- Moderna, Inc.
- Alnylam Pharmaceuticals, Inc.
- Pfizer Inc.
- Novartis AG
- Ionis Pharmaceuticals, Inc.
- Sarepta Therapeutics, Inc.
- Sanofi
- BioNTech SE
- Orna Therapeutics
- CRISPR Therapeutics
- Astellas Pharma Inc.
Our Clients


View Our Licence Options
