Reverse Vending Machines Market Report By Machine Type (Non-Refillable Type, Refillable Type, Multifunction Type), By End-User (Supermarkets, Recycling Centers, Retail Stores, Public Transport Stations, Airports, Others), By Material Accepted (Plastic Bottles, Aluminum Cans, Glass Bottles, Others), By Region and Companies - Industry Segment Outlook, Market Assessment, Competition Scenario, Trends and Forecast 2024-2033
-
17829
-
August 2024
-
322
-


-
This report was compiled by Vishwa Gaul Vishwa is an experienced market research and consulting professional with over 8 years of expertise in the ICT industry, contributing to over 700 reports across telecommunications, software, hardware, and digital solutions. Correspondence Team Lead- ICT Linkedin | Detailed Market research Methodology Our methodology involves a mix of primary research, including interviews with leading mental health experts, and secondary research from reputable medical journals and databases. View Detailed Methodology Page
-
Quick Navigation
Report Overview
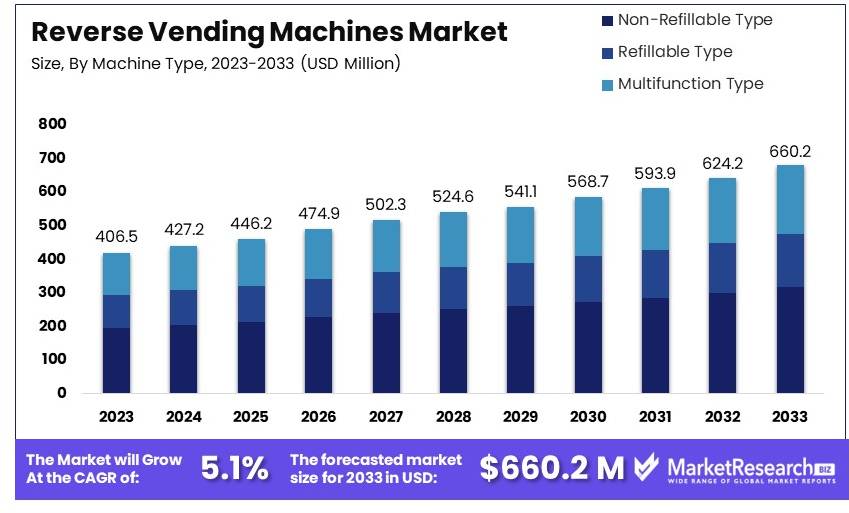
The Global Reverse Vending Machines Market size is expected to be worth around USD 660.2 Million by 2033, from USD 406.5 Million in 2023, growing at a CAGR of 5.1% during the forecast period from 2024 to 2033.
The Reverse Vending Machines (RVM) Market focuses on machines that accept used beverage containers for recycling. These machines incentivize consumers by providing rewards or refunds. They are commonly installed in supermarkets, public places, and recycling centers. The market is driven by increasing environmental awareness and government regulations on waste management.
Key players include manufacturers of RVMs and companies offering recycling services. Challenges include machine maintenance and integration with recycling systems. Growth is expected due to rising adoption of sustainable practices and technological advancements in RVMs. The market benefits from partnerships with retailers and municipalities.
The reverse vending machines (RVMs) market is expanding rapidly, driven by growing environmental awareness and the urgent need to reduce waste. Reverse vending machines play a crucial role in promoting recycling by allowing consumers to return used beverage containers in exchange for rewards. This technology is gaining traction as governments and businesses seek sustainable solutions to manage waste effectively.
Globally, the production of plastic waste has reached alarming levels, with 400 million tons generated annually, according to the World Economic Forum. In the United States, 40 million tons of plastic waste were produced in 2021, but only 5-6% (about 2 million tons) were recycled. This low recycling rate highlights the significant potential for RVMs to enhance waste management practices. Furthermore, the total bottle recycling rate in the U.S. decreased from 28.7% in 2019 to 27.2% in 2020, indicating a pressing need for improved recycling infrastructure.
The volume of waste generated is staggering, with approximately 2.5 million plastic bottles and 110 million glass bottles discarded every hour in the U.S. alone. This creates a substantial opportunity for the adoption of RVMs to boost recycling rates and reduce environmental impact. The implementation of RVMs can help increase recycling efficiency and encourage more sustainable consumer behavior.
As the market for RVMs grows, companies are focusing on technological advancements and user-friendly designs to increase consumer participation. Governments are also supporting this growth through regulations and incentives aimed at reducing waste and promoting recycling.
The reverse vending machines market is poised for significant growth, driven by environmental concerns and the need for efficient waste management solutions. By enhancing recycling rates and reducing waste, RVMs offer a promising solution for a more sustainable future. Strategic investments in technology and regulatory support will be crucial to realizing the full potential of this market.
Key Takeaways
- Market Value: The Reverse Vending Machines Market was valued at USD 406.5 million in 2023 and is expected to reach USD 660.2 million by 2033, with a CAGR of 5.1%.
- Machine Type Analysis: Non-Refillable Type machines are most common at 48%; they facilitate efficient recycling.
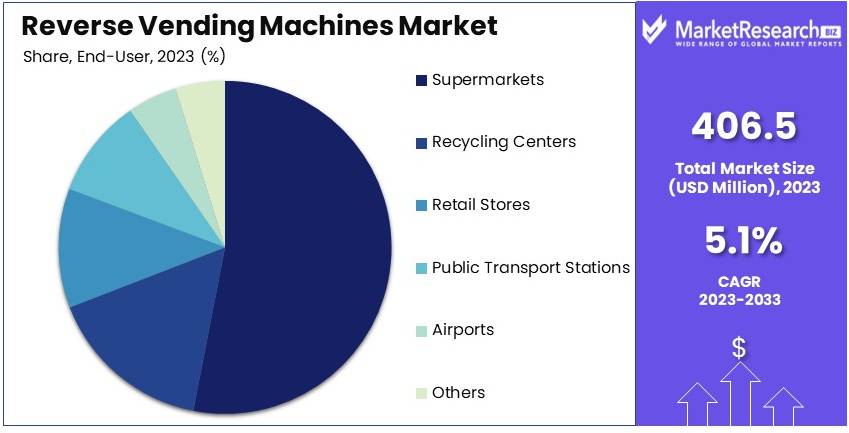
- End User Analysis: Supermarkets lead with 55%; they are key collection points.
- Material Accepted Analysis: Plastic Bottles are predominant at 60%; high usage and recycling rates.
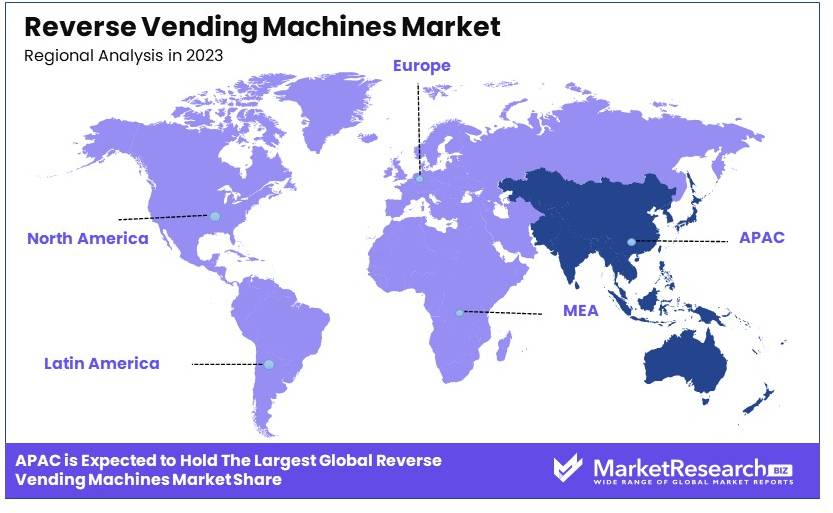
- Dominant Region: APAC dominates with 38.5%; increasing environmental concerns drive adoption.
- Analyst Viewpoint: The market for Reverse Vending Machines is growing, supported by environmental regulations and consumer recycling awareness, particularly in Asia-Pacific.
Driving Factors
Environmental Regulations and Sustainability Initiatives Drive Market Growth
Increasing government regulations and corporate sustainability goals are driving the adoption of reverse vending machines (RVMs). The European Union's Directive on Single-Use Plastics mandates a 90% separate collection target for plastic bottles by 2029, pushing many countries to implement deposit return schemes. RVMs provide an efficient way to collect and sort recyclable containers, helping businesses and municipalities meet recycling targets and reduce waste.
These regulations are critical as they compel businesses to adopt more sustainable practices, directly boosting the demand for RVMs. The interaction between regulatory requirements and corporate sustainability goals creates a strong market for RVMs, ensuring that businesses comply with environmental standards while promoting recycling.
Consumer Awareness and Eco-Friendly Behavior Drive Market Growth
Growing environmental consciousness among consumers is leading to increased participation in recycling programs. RVMs offer a convenient and often incentivized way for consumers to recycle, aligning with their desire to make eco-friendly choices. In Norway, for example, where RVMs are widely used, the bottle return rate exceeds 95% due to a combination of consumer awareness and the ease of using RVMs located in accessible places like supermarkets.
This trend is vital as it demonstrates how consumer behavior can drive market demand. The increased use of RVMs is not only promoting recycling but also encouraging manufacturers to produce more recyclable or biodegradable packaging. This synergy between consumer behavior and manufacturer practices is enhancing the market for RVMs.
Technological Advancements Drive Market Growth
Ongoing improvements in RVM technology are making these machines more efficient, user-friendly, and capable of handling a wider variety of materials. Modern RVMs can now sort materials more accurately, process containers faster, and even incorporate features like mobile apps for user engagement. For example, TOMRA's R1 model can accept up to 100 containers in one go, significantly improving the user experience and encouraging more frequent use.
These technological advancements are crucial as they enhance the efficiency and appeal of RVMs, driving greater adoption. The integration of advanced features such as mobile apps also helps in engaging users and providing incentives, further promoting recycling.
Restraining Factors
High Initial Investment Restrains Market Growth
The high initial investment required for reverse vending machines (RVMs) is a major barrier to market growth. Purchasing, installing, and maintaining RVMs can cost between USD 10,000 and USD 50,000 or more, depending on the machine's features. This substantial upfront expense can deter small retailers and municipalities with limited budgets from adopting RVMs.
In areas with underdeveloped recycling infrastructure, the economic benefits of investing in RVMs are not immediately evident. Consequently, these regions may be less inclined to invest in such technology, slowing the overall market adoption of RVMs.
Limited Space in Retail Environments Restrains Market Growth
Limited space in retail environments poses a significant challenge for the adoption of RVMs. These machines require dedicated floor space, which can be difficult to allocate in smaller stores or areas with high real estate costs.
For example, in densely populated urban areas like New York City, retail space is extremely valuable, and using it for RVMs may be seen as less profitable compared to additional product displays or sales areas. This space constraint limits the ability of retailers to install RVMs, particularly in high-density markets where the machines could have the most impact.
Machine Type Analysis
Non-Refillable Type dominates with 48% due to its wide applicability and ease of use.
Non-Refillable Type reverse vending machines lead the market with a 48% share, primarily because of their widespread use in grocery stores, shopping centers, and public areas where quick and efficient bottle and can collection is necessary. These machines are designed to accept single-use containers such as plastic bottles and aluminum cans, which are then compacted and stored for recycling. This process not only reduces the volume of waste but also simplifies the recycling process, making it more efficient.
Refillable Type machines, holding about 30% of the market, cater to environments where bottles are cleaned and reused rather than recycled. This type is prevalent in countries with strict environmental policies and high participation rates in bottle return programs.
Multifunction Type machines, which constitute about 22% of the market, are versatile as they can handle both refillable and non-refillable containers. They are becoming increasingly popular due to their ability to offer more services, including the acceptance of various types of containers and the provision of digital receipts and rewards for users.
The dominance of Non-Refillable Type machines is bolstered by the increasing global push towards sustainability and recycling, making them integral in waste management ecosystems. However, the roles of Refillable and Multifunction Types remain crucial, particularly as global markets shift towards more sustainable practices and circular economy models.
End-User Analysis
Supermarkets dominate with 55% due to high consumer traffic and convenience of location.
Supermarkets are the leading end-users of reverse vending machines, accounting for 55% of this market. Their dominance is driven by high consumer foot traffic and the convenience of returning containers during regular shopping trips. Supermarkets benefit from hosting these machines by attracting eco-conscious customers and reducing waste disposal costs.
Recycling Centers, which utilize about 20% of the market, are critical in the recycling ecosystem, serving as centralized points where collected items are further sorted and processed. Retail Stores and Public Transport Stations, each holding smaller shares of around 10% and 7% respectively, integrate these machines to enhance customer service and support community recycling efforts.
Airports and other areas such as large office buildings or educational campuses, collectively making up about 8%, are increasingly adopting reverse vending machines to manage waste and promote recycling among large populations.
The significant market share of Supermarkets is complemented by the diverse roles of other end-users, which not only expand the reach of reverse vending technology but also encourage widespread public participation in recycling initiatives.
Material Accepted Analysis
Plastic Bottles dominate with 60% due to the high volume of consumption and disposal.
Plastic Bottles are the most commonly accepted material in reverse vending machines, dominating the segment with a 60% share. This dominance is due to the high volume of plastic bottle consumption globally, coupled with increasing awareness and regulatory pressure to recycle these materials due to their environmental impact.
Aluminum Cans, holding about 25% of the accepted materials market, are also a significant focus due to their high recyclability and value in the scrap market. Glass Bottles, making up about 10% of the market, are less commonly accepted due to their weight and fragility, which pose challenges in handling and transportation.
The 'Others' category, which includes materials like tetra packs and certain types of plastics, accounts for the remaining 5%. These materials are gradually being incorporated into the recycling programs as technology in reverse vending machines advances to accommodate a broader range of recyclables.
The predominant role of Plastic Bottles in the reverse vending machine market underscores the urgency and necessity of recycling these materials, given their environmental impact. However, the importance of recycling Aluminum Cans and Glass Bottles, along with other materials, is also recognized, reflecting a comprehensive approach to waste management and recycling.
Key Market Segments
By Machine Type
- Non-Refillable Type
- Refillable Type
- Multifunction Type
By End-User
- Supermarkets
- Recycling Centers
- Retail Stores
- Public Transport Stations
- Airports
- Others
By Material Accepted
- Plastic Bottles
- Aluminum Cans
- Glass Bottles
- Others
Growth Opportunities
Integration with Smart City Initiatives Offers Growth Opportunity
The integration of Reverse Vending Machines (RVMs) with smart city initiatives presents a significant growth opportunity. Smart cities focus on using technology to enhance urban living, including waste management systems. For example, RVMs connected to a city-wide network can provide real-time data on recycling rates and container collection needs. Barcelona's smart city project already includes smart waste management systems, demonstrating the feasibility of such integrations.
Incorporating RVMs into these initiatives can drive their adoption and improve overall recycling efficiency. By leveraging smart city technology, cities can optimize their recycling programs, reduce waste, and promote sustainable living, thereby expanding the market potential for RVMs.
Diversification of Accepted Materials Offers Growth Opportunity
Diversifying the range of materials accepted by RVMs offers a promising growth opportunity. Expanding beyond traditional beverage containers to include electronic waste, textiles, or even food waste can open up new market segments. For instance, developing RVMs that process these materials addresses growing environmental concerns and taps into new revenue streams.
TerraCycle's Loop program, which focuses on reusable packaging, illustrates the potential for integrating RVM technology to handle a wider range of recyclable and reusable items. This diversification can enhance the utility of RVMs, attract more users, and support environmental sustainability, driving market expansion.
Trending Factors
Mobile App Integration Are Trending Factors
The integration of mobile apps with RVMs is a trending factor in the market. Connecting RVMs to mobile apps enhances user engagement and convenience. Apps can show nearby RVM locations, track personal recycling progress, and gamify the recycling process. For example, Tomra's ReAct app allows users to donate their bottle deposits to charities directly through the app, adding a social dimension to recycling.
This trend makes recycling more interactive and rewarding, encouraging higher participation rates. Mobile app integration can modernize recycling practices, attract tech-savvy users, and increase the overall effectiveness of RVMs, supporting market growth.
Blockchain Technology for Transparency Are Trending Factors
The use of blockchain technology in recycling is a trending factor driving the RVM market. Blockchain creates transparent and tamper-proof records of recycling activities, which is valuable for deposit return systems. Accurate tracking of containers from purchase to recycling can be ensured using blockchain. For example, the startup RecycleToCoin uses blockchain to reward recycling activities.
Integrating blockchain with RVM systems can enhance the reliability and transparency of recycling programs. This technology can foster trust among users, improve compliance, and streamline operations, thereby supporting the expansion and effectiveness of the RVM market.
Regional Analysis
APAC Dominates with 38.5% Market Share in the Reverse Vending Machines Market
APAC's leadership in the reverse vending machines market, with a 38.5% share, is primarily driven by its robust recycling initiatives and environmental policies. The region has seen significant government support for sustainability practices, including incentives for recycling technologies. High urban density in major cities across APAC increases the necessity for efficient waste management solutions like reverse vending machines. Additionally, technological advancements and local manufacturing capabilities enable the production of cost-effective and accessible machines.
The market dynamics in APAC are significantly influenced by the growing urbanization and increasing consumer awareness about environmental issues. The proliferation of retail spaces and public areas where reverse vending machines are installed supports widespread adoption. The integration of digital technologies such as IoT and machine learning in these machines enhances their appeal by providing users with interactive and rewarding recycling experiences.
The future of APAC in the reverse vending machines market looks highly positive, with expected growth due to continued urban expansion and escalating environmental concerns. As more countries in the region strengthen regulations around waste management and recycling, the demand for innovative and efficient recycling solutions like reverse vending machines is likely to surge, potentially increasing APAC’s market share further.
Regional Market Share AnalysisNorth America: This region accounts for about 25% of the global market. North America benefits from advanced technology infrastructure and strong regulatory frameworks for recycling, driving adoption of reverse vending machines, especially in the United States and Canada.
Europe: Holding approximately 30% of the market, Europe's share is bolstered by stringent EU regulations on recycling and waste management. The adoption of circular economy principles across the region supports the extensive deployment of reverse vending machines.
Middle East & Africa: With a smaller share of around 3%, the Middle East and Africa are slowly adopting reverse vending technology. Increasing environmental initiatives and growing awareness about waste pollution are expected to drive gradual market growth.
Latin America: Representing about 4% of the market, Latin America is seeing emerging growth in the sector due to improving waste management policies and the rising influence of sustainability in urban planning.
Key Regions and Countries
- North America
- The US
- Canada
- Mexico
- Western Europe
- Germany
- France
- The UK
- Spain
- Italy
- Portugal
- Ireland
- Austria
- Switzerland
- Benelux
- Nordic
- Rest of Western Europe
- Eastern Europe
- Russia
- Poland
- The Czech Republic
- Greece
- Rest of Eastern Europe
- APAC
- China
- Japan
- South Korea
- India
- Australia & New Zealand
- Indonesia
- Malaysia
- Philippines
- Singapore
- Thailand
- Vietnam
- Rest of APAC
- Latin America
- Brazil
- Colombia
- Chile
- Argentina
- Costa Rica
- Rest of Latin America
- Middle East & Africa
- Algeria
- Egypt
- Israel
- Kuwait
- Nigeria
- Saudi Arabia
- South Africa
- Turkey
- United Arab Emirates
- Rest of MEA
Key Players Analysis
In the Reverse Vending Machines (RVM) Market, TOMRA Systems ASA and Envipco Holding N.V. lead with advanced technologies and extensive global networks, setting high standards for the industry. Diebold Nixdorf, Inc. and Sielaff GmbH & Co. KG contribute with robust, user-friendly RVM solutions catering to diverse market needs. Wincor Nixdorf AG and RVM Systems AS leverage their expertise in automated systems to enhance RVM efficiency and adoption.
Kansmacker and Trautwein SB Technik GmbH focus on innovation, developing versatile machines capable of handling various recyclable materials. MEGLA GmbH and Envirobank Recycling Pty Ltd. emphasize sustainability, integrating RVMs into broader environmental initiatives. Aco Recycling and Xiamen Rongxiang Technology Co., Ltd. highlight their impact through cost-effective, scalable RVM solutions.
INCOM TOMRA Recycling Technology (Beijing) Co., Ltd. combines local market knowledge with advanced technology, enhancing RVM adoption in Asia. FlexLink Systems, Inc. and Reverse Vending Corporation contribute through strategic partnerships and innovative designs, driving market expansion. These companies collectively shape the RVM market through technological innovation, strategic positioning, and strong market influence.
Market Key Players
- Tomra Systems ASA
- Envipco Holding N.V.
- Diebold Nixdorf, Inc.
- Sielaff GmbH & Co. KG
- Wincor Nixdorf AG
- RVM Systems AS
- Kansmacker
- Trautwein SB Technik GmbH
- MEGLA GmbH
- Envirobank Recycling Pty Ltd.
- Aco Recycling
- Xiamen Rongxiang Technology Co., Ltd.
- INCOM TOMRA Recycling Technology (Beijing) Co., Ltd.
- FlexLink Systems, Inc.
- Reverse Vending Corporation
Recent Developments
2024: TOMRA has achieved a significant milestone by installing 500 TOMRA R1 multi-feed reverse vending machines across 16 countries. These RVMs allow users to recycle over 100 beverage containers in one go, making the process up to five times faster than single-feed solutions. This innovation has led to a 33% rise in consumer sessions and an 86% increase in containers returned at retail locations hosting these machines.
2024: Coca-Cola has launched a reverse vending machine at the University of Miami to support recycling efforts. For every plastic bottle or aluminum can collected, Coca-Cola donates 5 cents to the university's Marine Science Graduate Student Organization, promoting environmental awareness and sustainability. This initiative is part of Coca-Cola's World Without Waste program, aiming to recycle a bottle or can for every one sold by 2030.
Report Scope
Report Features Description Market Value (2023) USD 406.5 Million Forecast Revenue (2033) USD 660.2 Million CAGR (2024-2033) 5.1% Base Year for Estimation 2023 Historic Period 2018-2023 Forecast Period 2024-2033 Report Coverage Revenue Forecast, Market Dynamics, Competitive Landscape, Recent Developments Segments Covered By Machine Type (Non-Refillable Type, Refillable Type, Multifunction Type), By End-User (Supermarkets, Recycling Centers, Retail Stores, Public Transport Stations, Airports, Others), By Material Accepted (Plastic Bottles, Aluminum Cans, Glass Bottles, Others) Regional Analysis North America - The US, Canada, & Mexico; Western Europe - Germany, France, The UK, Spain, Italy, Portugal, Ireland, Austria, Switzerland, Benelux, Nordic, & Rest of Western Europe; Eastern Europe - Russia, Poland, The Czech Republic, Greece, & Rest of Eastern Europe; APAC - China, Japan, South Korea, India, Australia & New Zealand, Indonesia, Malaysia, Philippines, Singapore, Thailand, Vietnam, & Rest of APAC; Latin America - Brazil, Colombia, Chile, Argentina, Costa Rica, & Rest of Latin America; Middle East & Africa - Algeria, Egypt, Israel, Kuwait, Nigeria, Saudi Arabia, South Africa, Turkey, United Arab Emirates, & Rest of MEA Competitive Landscape TOMRA Systems ASA, Envipco Holding N.V., Diebold Nixdorf, Inc., Sielaff GmbH & Co. KG, Wincor Nixdorf AG, RVM Systems AS, Kansmacker, Trautwein SB Technik GmbH, MEGLA GmbH, Envirobank Recycling Pty Ltd., Aco Recycling, Xiamen Rongxiang Technology Co., Ltd., INCOM TOMRA Recycling Technology (Beijing) Co., Ltd., FlexLink Systems, Inc., Reverse Vending Corporation Customization Scope Customization for segments, region/country-level will be provided. Moreover, additional customization can be done based on the requirements. Purchase Options We have three licenses to opt for: Single User License, Multi-User License (Up to 5 Users), Corporate Use License (Unlimited User and Printable PDF) -
- 1. Executive Summary
- 1.1. Definition
- 1.2. Taxonomy
- 1.3. Research Scope
- 1.4. Key Analysis
- 1.5. Key Findings by Major Segments
- 1.6. Top Strategies by Major Players
- 2. Global Reverse Vending Machines Market Overview
- 2.1. Reverse Vending Machines Market Dynamics
- 2.1.1. Drivers
- 2.1.2. Opportunities
- 2.1.3. Restraints
- 2.1.4. Challenges
- 2.2. Macro-economic Factors
- 2.3. Regulatory Framework
- 2.4. Market Investment Feasibility Index
- 2.5. PEST Analysis
- 2.6. PORTER’S Five Force Analysis
- 2.7. Drivers & Restraints Impact Analysis
- 2.8. Industry Chain Analysis
- 2.9. Cost Structure Analysis
- 2.10. Marketing Strategy
- 2.11. Russia-Ukraine War Impact Analysis
- 2.12. Opportunity Map Analysis
- 2.13. Market Competition Scenario Analysis
- 2.14. Product Life Cycle Analysis
- 2.15. Opportunity Orbits
- 2.16. Manufacturer Intensity Map
- 2.17. Major Companies' sales by Value & Volume
- 2.1. Reverse Vending Machines Market Dynamics
- 3. Global Reverse Vending Machines Market Analysis, Opportunity, and Forecast, 2016-2032
- 3.1. Global Reverse Vending Machines Market Analysis, 2016-2021
- 3.2. Global Reverse Vending Machines Market Opportunity and Forecast, 2023-2032
- 3.3. Global Reverse Vending Machines Market Analysis, Opportunity and Forecast, By By Product Type, 2016-2032
- 3.3.1. Global Reverse Vending Machines Market Analysis by By Product Type: Introduction
- 3.3.2. Market Size Absolute $ Opportunity Analysis and Forecast, By By Product Type, 2016-2032
- 3.3.3. Refillable Type
- 3.3.4. Non-Refillable Type
- 3.3.5. Multifunction Type
- 3.4. Global Reverse Vending Machines Market Analysis, Opportunity, and Forecast, By By Application, 2016-2032
- 3.4.1. Global Reverse Vending Machines Market Analysis by By Application: Introduction
- 3.4.2. Market Size Absolute $ Opportunity Analysis and Forecast, By By Application, 2016-2032
- 3.4.3. Supermarkets
- 3.4.4. Community
- 3.4.5. Utilities
- 4. North America Reverse Vending Machines Market Analysis, Opportunity, and Forecast, 2016-2032
- 4.1. North America Reverse Vending Machines Market Analysis, 2016-2021
- 4.2. North America Reverse Vending Machines Market Opportunity and Forecast, 2023-2032
- 4.3. North America Reverse Vending Machines Market Analysis, Opportunity and Forecast, By By Product Type, 2016-2032
- 4.3.1. North America Reverse Vending Machines Market Analysis by By Product Type: Introduction
- 4.3.2. Market Size Absolute $ Opportunity Analysis and Forecast, By By Product Type, 2016-2032
- 4.3.3. Refillable Type
- 4.3.4. Non-Refillable Type
- 4.3.5. Multifunction Type
- 4.4. North America Reverse Vending Machines Market Analysis, Opportunity and Forecast, By By Application, 2016-2032
- 4.4.1. North America Reverse Vending Machines Market Analysis by By Application: Introduction
- 4.4.2. Market Size Absolute $ Opportunity Analysis and Forecast, By By Application, 2016-2032
- 4.4.3. Supermarkets
- 4.4.4. Community
- 4.4.5. Utilities
- 4.5. North America Reverse Vending Machines Market Analysis, Opportunity, and Forecast, By Country, 2016-2032
- 4.5.1. North America Reverse Vending Machines Market Analysis by Country: Introduction
- 4.5.2. Market Size Absolute $ Opportunity Analysis and Forecast, Country, 2016-2032
- 4.5.2.1. The US
- 4.5.2.2. Canada
- 4.5.2.3. Mexico
- 5. Western Europe Reverse Vending Machines Market Analysis, Opportunity, and Forecast, 2016-2032
- 5.1. Western Europe Reverse Vending Machines Market Analysis, 2016-2021
- 5.2. Western Europe Reverse Vending Machines Market Opportunity and Forecast, 2023-2032
- 5.3. Western Europe Reverse Vending Machines Market Analysis, Opportunity and Forecast, By By Product Type, 2016-2032
- 5.3.1. Western Europe Reverse Vending Machines Market Analysis by By Product Type: Introduction
- 5.3.2. Market Size Absolute $ Opportunity Analysis and Forecast, By By Product Type, 2016-2032
- 5.3.3. Refillable Type
- 5.3.4. Non-Refillable Type
- 5.3.5. Multifunction Type
- 5.4. Western Europe Reverse Vending Machines Market Analysis, Opportunity and Forecast, By By Application, 2016-2032
- 5.4.1. Western Europe Reverse Vending Machines Market Analysis by By Application: Introduction
- 5.4.2. Market Size Absolute $ Opportunity Analysis and Forecast, By By Application, 2016-2032
- 5.4.3. Supermarkets
- 5.4.4. Community
- 5.4.5. Utilities
- 5.5. Western Europe Reverse Vending Machines Market Analysis, Opportunity and Forecast, By Country, 2016-2032
- 5.5.1. Western Europe Reverse Vending Machines Market Analysis by Country: Introduction
- 5.5.2. Market Size Absolute $ Opportunity Analysis and Forecast, Country, 2016-2032
- 5.5.2.1. Germany
- 5.5.2.2. France
- 5.5.2.3. The UK
- 5.5.2.4. Spain
- 5.5.2.5. Italy
- 5.5.2.6. Portugal
- 5.5.2.7. Ireland
- 5.5.2.8. Austria
- 5.5.2.9. Switzerland
- 5.5.2.10. Benelux
- 5.5.2.11. Nordic
- 5.5.2.12. Rest of Western Europe
- 6. Eastern Europe Reverse Vending Machines Market Analysis, Opportunity and Forecast, 2016-2032
- 6.1. Eastern Europe Reverse Vending Machines Market Analysis, 2016-2021
- 6.2. Eastern Europe Reverse Vending Machines Market Opportunity and Forecast, 2023-2032
- 6.3. Eastern Europe Reverse Vending Machines Market Analysis, Opportunity and Forecast, By By Product Type, 2016-2032
- 6.3.1. Eastern Europe Reverse Vending Machines Market Analysis by By Product Type: Introduction
- 6.3.2. Market Size Absolute $ Opportunity Analysis and Forecast, By By Product Type, 2016-2032
- 6.3.3. Refillable Type
- 6.3.4. Non-Refillable Type
- 6.3.5. Multifunction Type
- 6.4. Eastern Europe Reverse Vending Machines Market Analysis, Opportunity and Forecast, By By Application, 2016-2032
- 6.4.1. Eastern Europe Reverse Vending Machines Market Analysis by By Application: Introduction
- 6.4.2. Market Size Absolute $ Opportunity Analysis and Forecast, By By Application, 2016-2032
- 6.4.3. Supermarkets
- 6.4.4. Community
- 6.4.5. Utilities
- 6.5. Eastern Europe Reverse Vending Machines Market Analysis, Opportunity and Forecast, By Country, 2016-2032
- 6.5.1. Eastern Europe Reverse Vending Machines Market Analysis by Country: Introduction
- 6.5.2. Market Size Absolute $ Opportunity Analysis and Forecast, Country, 2016-2032
- 6.5.2.1. Russia
- 6.5.2.2. Poland
- 6.5.2.3. The Czech Republic
- 6.5.2.4. Greece
- 6.5.2.5. Rest of Eastern Europe
- 7. APAC Reverse Vending Machines Market Analysis, Opportunity, and Forecast, 2016-2032
- 7.1. APAC Reverse Vending Machines Market Analysis, 2016-2021
- 7.2. APAC Reverse Vending Machines Market Opportunity and Forecast, 2023-2032
- 7.3. APAC Reverse Vending Machines Market Analysis, Opportunity and Forecast, By By Product Type, 2016-2032
- 7.3.1. APAC Reverse Vending Machines Market Analysis by By Product Type: Introduction
- 7.3.2. Market Size Absolute $ Opportunity Analysis and Forecast, By By Product Type, 2016-2032
- 7.3.3. Refillable Type
- 7.3.4. Non-Refillable Type
- 7.3.5. Multifunction Type
- 7.4. APAC Reverse Vending Machines Market Analysis, Opportunity and Forecast, By By Application, 2016-2032
- 7.4.1. APAC Reverse Vending Machines Market Analysis by By Application: Introduction
- 7.4.2. Market Size Absolute $ Opportunity Analysis and Forecast, By By Application, 2016-2032
- 7.4.3. Supermarkets
- 7.4.4. Community
- 7.4.5. Utilities
- 7.5. APAC Reverse Vending Machines Market Analysis, Opportunity and Forecast, By Country, 2016-2032
- 7.5.1. APAC Reverse Vending Machines Market Analysis by Country: Introduction
- 7.5.2. Market Size Absolute $ Opportunity Analysis and Forecast, Country, 2016-2032
- 7.5.2.1. China
- 7.5.2.2. Japan
- 7.5.2.3. South Korea
- 7.5.2.4. India
- 7.5.2.5. Australia & New Zeland
- 7.5.2.6. Indonesia
- 7.5.2.7. Malaysia
- 7.5.2.8. Philippines
- 7.5.2.9. Singapore
- 7.5.2.10. Thailand
- 7.5.2.11. Vietnam
- 7.5.2.12. Rest of APAC
- 8. Latin America Reverse Vending Machines Market Analysis, Opportunity, and Forecast, 2016-2032
- 8.1. Latin America Reverse Vending Machines Market Analysis, 2016-2021
- 8.2. Latin America Reverse Vending Machines Market Opportunity and Forecast, 2023-2032
- 8.3. Latin America Reverse Vending Machines Market Analysis, Opportunity and Forecast, By By Product Type, 2016-2032
- 8.3.1. Latin America Reverse Vending Machines Market Analysis by By Product Type: Introduction
- 8.3.2. Market Size Absolute $ Opportunity Analysis and Forecast, By By Product Type, 2016-2032
- 8.3.3. Refillable Type
- 8.3.4. Non-Refillable Type
- 8.3.5. Multifunction Type
- 8.4. Latin America Reverse Vending Machines Market Analysis, Opportunity and Forecast, By By Application, 2016-2032
- 8.4.1. Latin America Reverse Vending Machines Market Analysis by By Application: Introduction
- 8.4.2. Market Size Absolute $ Opportunity Analysis and Forecast, By By Application, 2016-2032
- 8.4.3. Supermarkets
- 8.4.4. Community
- 8.4.5. Utilities
- 8.5. Latin America Reverse Vending Machines Market Analysis, Opportunity and Forecast, By Country, 2016-2032
- 8.5.1. Latin America Reverse Vending Machines Market Analysis by Country: Introduction
- 8.5.2. Market Size Absolute $ Opportunity Analysis and Forecast, Country, 2016-2032
- 8.5.2.1. Brazil
- 8.5.2.2. Colombia
- 8.5.2.3. Chile
- 8.5.2.4. Argentina
- 8.5.2.5. Costa Rica
- 8.5.2.6. Rest of Latin America
- 9. Middle East & Africa Reverse Vending Machines Market Analysis, Opportunity, and Forecast, 2016-2032
- 9.1. Middle East & Africa Reverse Vending Machines Market Analysis, 2016-2021
- 9.2. Middle East & Africa Reverse Vending Machines Market Opportunity and Forecast, 2023-2032
- 9.3. Middle East & Africa Reverse Vending Machines Market Analysis, Opportunity and Forecast, By By Product Type, 2016-2032
- 9.3.1. Middle East & Africa Reverse Vending Machines Market Analysis by By Product Type: Introduction
- 9.3.2. Market Size Absolute $ Opportunity Analysis and Forecast, By By Product Type, 2016-2032
- 9.3.3. Refillable Type
- 9.3.4. Non-Refillable Type
- 9.3.5. Multifunction Type
- 9.4. Middle East & Africa Reverse Vending Machines Market Analysis, Opportunity and Forecast, By By Application, 2016-2032
- 9.4.1. Middle East & Africa Reverse Vending Machines Market Analysis by By Application: Introduction
- 9.4.2. Market Size Absolute $ Opportunity Analysis and Forecast, By By Application, 2016-2032
- 9.4.3. Supermarkets
- 9.4.4. Community
- 9.4.5. Utilities
- 9.5. Middle East & Africa Reverse Vending Machines Market Analysis, Opportunity and Forecast, By Country, 2016-2032
- 9.5.1. Middle East & Africa Reverse Vending Machines Market Analysis by Country: Introduction
- 9.5.2. Market Size Absolute $ Opportunity Analysis and Forecast, Country, 2016-2032
- 9.5.2.1. Algeria
- 9.5.2.2. Egypt
- 9.5.2.3. Israel
- 9.5.2.4. Kuwait
- 9.5.2.5. Nigeria
- 9.5.2.6. Saudi Arabia
- 9.5.2.7. South Africa
- 9.5.2.8. Turkey
- 9.5.2.9. The UAE
- 9.5.2.10. Rest of MEA
- 10. Global Reverse Vending Machines Market Analysis, Opportunity and Forecast, By Region, 2016-2032
- 10.1. Global Reverse Vending Machines Market Analysis by Region: Introduction
- 10.2. Market Size Absolute $ Opportunity Analysis and Forecast, By Region, 2016-2032
- 10.2.1. North America
- 10.2.2. Western Europe
- 10.2.3. Eastern Europe
- 10.2.4. APAC
- 10.2.5. Latin America
- 10.2.6. Middle East & Africa
- 11. Global Reverse Vending Machines Market Competitive Landscape, Market Share Analysis, and Company Profiles
- 11.1. Market Share Analysis
- 11.2. Company Profiles
- 11.3. Diebold Nixdorf
- 11.3.1. Company Overview
- 11.3.2. Financial Highlights
- 11.3.3. Product Portfolio
- 11.3.4. SWOT Analysis
- 11.3.5. Key Strategies and Developments
- 11.4. Tomra Systems ASA
- 11.4.1. Company Overview
- 11.4.2. Financial Highlights
- 11.4.3. Product Portfolio
- 11.4.4. SWOT Analysis
- 11.4.5. Key Strategies and Developments
- 11.5. Teraoka Seiko Co. Ltd. (TERAOKA (DIGI) Group)
- 11.5.1. Company Overview
- 11.5.2. Financial Highlights
- 11.5.3. Product Portfolio
- 11.5.4. SWOT Analysis
- 11.5.5. Key Strategies and Developments
- 11.6. Envipco Holding N.V.
- 11.6.1. Company Overview
- 11.6.2. Financial Highlights
- 11.6.3. Product Portfolio
- 11.6.4. SWOT Analysis
- 11.6.5. Key Strategies and Developments
- 11.7. Rvm Systems AB
- 11.7.1. Company Overview
- 11.7.2. Financial Highlights
- 11.7.3. Product Portfolio
- 11.7.4. SWOT Analysis
- 11.7.5. Key Strategies and Developments
- 11.8. Trautwein SB-Technik GmbH
- 11.8.1. Company Overview
- 11.8.2. Financial Highlights
- 11.8.3. Product Portfolio
- 11.8.4. SWOT Analysis
- 11.8.5. Key Strategies and Developments
- 11.9. Kansmacker Manufacturing
- 11.9.1. Company Overview
- 11.9.2. Financial Highlights
- 11.9.3. Product Portfolio
- 11.9.4. SWOT Analysis
- 11.9.5. Key Strategies and Developments
- 11.10. Incom Tomra Recycling Technology (Beijing) Co. Ltd.
- 11.10.1. Company Overview
- 11.10.2. Financial Highlights
- 11.10.3. Product Portfolio
- 11.10.4. SWOT Analysis
- 11.10.5. Key Strategies and Developments
- 11.11. Aco Recycling
- 11.11.1. Company Overview
- 11.11.2. Financial Highlights
- 11.11.3. Product Portfolio
- 11.11.4. SWOT Analysis
- 11.11.5. Key Strategies and Developments
- 11.12. Unisan UK
- 11.12.1. Company Overview
- 11.12.2. Financial Highlights
- 11.12.3. Product Portfolio
- 11.12.4. SWOT Analysis
- 11.12.5. Key Strategies and Developments
- 11.13. EREZ Thermoplastic Products
- 11.13.1. Company Overview
- 11.13.2. Financial Highlights
- 11.13.3. Product Portfolio
- 11.13.4. SWOT Analysis
- 11.13.5. Key Strategies and Developments
- 11.14. Hangzhou Chinastars Reflective Material Co.
- 11.14.1. Company Overview
- 11.14.2. Financial Highlights
- 11.14.3. Product Portfolio
- 11.14.4. SWOT Analysis
- 11.14.5. Key Strategies and Developments
- 12. Assumptions and Acronyms
- 13. Research Methodology
- 14. Contact
List of Figures
- Figure 1: Global Reverse Vending Machines Market Revenue (US Mn) Market Share by By Product Type in 2022
- Figure 2: Global Reverse Vending Machines Market Attractiveness Analysis by By Product Type, 2016-2032
- Figure 3: Global Reverse Vending Machines Market Revenue (US$ Mn) Market Share by By Applications 2022
- Figure 4: Global Reverse Vending Machines Market Attractiveness Analysis by By Application, 2016-2032
- Figure 5: Global Reverse Vending Machines Market Revenue (US$ Mn) Market Share by Region in 2022
- Figure 6: Global Reverse Vending Machines Market Attractiveness Analysis by Region, 2016-2032
- Figure 7: Global Reverse Vending Machines Market Revenue (US$ Mn) (2016-2032)
- Figure 8: Global Reverse Vending Machines Market Revenue (US$ Mn) Comparison by Region (2016-2032)
- Figure 9: Global Reverse Vending Machines Market Revenue (US$ Mn) Comparison by By Product Type (2016-2032)
- Figure 10: Global Reverse Vending Machines Market Revenue (US$ Mn) Comparison by By Application (2016-2032)
- Figure 11: Global Reverse Vending Machines Market Y-o-Y Growth Rate Comparison by Region (2016-2032)
- Figure 12: Global Reverse Vending Machines Market Y-o-Y Growth Rate Comparison by By Product Type (2016-2032)
- Figure 13: Global Reverse Vending Machines Market Y-o-Y Growth Rate Comparison by By Application (2016-2032)
- Figure 14: Global Reverse Vending Machines Market Share Comparison by Region (2016-2032)
- Figure 15: Global Reverse Vending Machines Market Share Comparison by By Product Type (2016-2032)
- Figure 16: Global Reverse Vending Machines Market Share Comparison by By Application (2016-2032)
- Figure 17: North America Reverse Vending Machines Market Revenue (US$ Mn) Market Share by By Product Type 2022
- Figure 18: North America Reverse Vending Machines Market Attractiveness Analysis by By Product Type, 2016-2032
- Figure 19: North America Reverse Vending Machines Market Revenue (US$ Mn) Market Share by By Applications 2022
- Figure 20: North America Reverse Vending Machines Market Attractiveness Analysis by By Application, 2016-2032
- Figure 21: North America Reverse Vending Machines Market Revenue (US$ Mn) Market Share by Country in 2022
- Figure 22: North America Reverse Vending Machines Market Attractiveness Analysis by Country, 2016-2032
- Figure 23: North America Reverse Vending Machines Market Revenue (US$ Mn) (2016-2032)
- Figure 24: North America Reverse Vending Machines Market Revenue (US$ Mn) Comparison by Country (2016-2032)
- Figure 25: North America Reverse Vending Machines Market Revenue (US$ Mn) Comparison by By Product Type (2016-2032)
- Figure 26: North America Reverse Vending Machines Market Revenue (US$ Mn) Comparison by By Application (2016-2032)
- Figure 27: North America Reverse Vending Machines Market Y-o-Y Growth Rate Comparison by Country (2016-2032)
- Figure 28: North America Reverse Vending Machines Market Y-o-Y Growth Rate Comparison by By Product Type (2016-2032)
- Figure 29: North America Reverse Vending Machines Market Y-o-Y Growth Rate Comparison by By Application (2016-2032)
- Figure 30: North America Reverse Vending Machines Market Share Comparison by Country (2016-2032)
- Figure 31: North America Reverse Vending Machines Market Share Comparison by By Product Type (2016-2032)
- Figure 32: North America Reverse Vending Machines Market Share Comparison by By Application (2016-2032)
- Figure 33: Western Europe Reverse Vending Machines Market Revenue (US$ Mn) Market Share by By Product Type 2022
- Figure 34: Western Europe Reverse Vending Machines Market Attractiveness Analysis by By Product Type, 2016-2032
- Figure 35: Western Europe Reverse Vending Machines Market Revenue (US$ Mn) Market Share by By Applications 2022
- Figure 36: Western Europe Reverse Vending Machines Market Attractiveness Analysis by By Application, 2016-2032
- Figure 37: Western Europe Reverse Vending Machines Market Revenue (US$ Mn) Market Share by Country in 2022
- Figure 38: Western Europe Reverse Vending Machines Market Attractiveness Analysis by Country, 2016-2032
- Figure 39: Western Europe Reverse Vending Machines Market Revenue (US$ Mn) (2016-2032)
- Figure 40: Western Europe Reverse Vending Machines Market Revenue (US$ Mn) Comparison by Country (2016-2032)
- Figure 41: Western Europe Reverse Vending Machines Market Revenue (US$ Mn) Comparison by By Product Type (2016-2032)
- Figure 42: Western Europe Reverse Vending Machines Market Revenue (US$ Mn) Comparison by By Application (2016-2032)
- Figure 43: Western Europe Reverse Vending Machines Market Y-o-Y Growth Rate Comparison by Country (2016-2032)
- Figure 44: Western Europe Reverse Vending Machines Market Y-o-Y Growth Rate Comparison by By Product Type (2016-2032)
- Figure 45: Western Europe Reverse Vending Machines Market Y-o-Y Growth Rate Comparison by By Application (2016-2032)
- Figure 46: Western Europe Reverse Vending Machines Market Share Comparison by Country (2016-2032)
- Figure 47: Western Europe Reverse Vending Machines Market Share Comparison by By Product Type (2016-2032)
- Figure 48: Western Europe Reverse Vending Machines Market Share Comparison by By Application (2016-2032)
- Figure 49: Eastern Europe Reverse Vending Machines Market Revenue (US$ Mn) Market Share by By Product Typein 2022
- Figure 50: Eastern Europe Reverse Vending Machines Market Attractiveness Analysis by By Product Type, 2016-2032
- Figure 51: Eastern Europe Reverse Vending Machines Market Revenue (US$ Mn) Market Share by By Applicationin 2022
- Figure 52: Eastern Europe Reverse Vending Machines Market Attractiveness Analysis by By Application, 2016-2032
- Figure 53: Eastern Europe Reverse Vending Machines Market Revenue (US$ Mn) Market Share by Country in 2022
- Figure 54: Eastern Europe Reverse Vending Machines Market Attractiveness Analysis by Country, 2016-2032
- Figure 55: Eastern Europe Reverse Vending Machines Market Revenue (US$ Mn) (2016-2032)
- Figure 56: Eastern Europe Reverse Vending Machines Market Revenue (US$ Mn) Comparison by Country (2016-2032)
- Figure 57: Eastern Europe Reverse Vending Machines Market Revenue (US$ Mn) Comparison by By Product Type (2016-2032)
- Figure 58: Eastern Europe Reverse Vending Machines Market Revenue (US$ Mn) Comparison by By Application (2016-2032)
- Figure 59: Eastern Europe Reverse Vending Machines Market Y-o-Y Growth Rate Comparison by Country (2016-2032)
- Figure 60: Eastern Europe Reverse Vending Machines Market Y-o-Y Growth Rate Comparison by By Product Type (2016-2032)
- Figure 61: Eastern Europe Reverse Vending Machines Market Y-o-Y Growth Rate Comparison by By Application (2016-2032)
- Figure 62: Eastern Europe Reverse Vending Machines Market Share Comparison by Country (2016-2032)
- Figure 63: Eastern Europe Reverse Vending Machines Market Share Comparison by By Product Type (2016-2032)
- Figure 64: Eastern Europe Reverse Vending Machines Market Share Comparison by By Application (2016-2032)
- Figure 65: APAC Reverse Vending Machines Market Revenue (US$ Mn) Market Share by By Product Type 2022
- Figure 66: APAC Reverse Vending Machines Market Attractiveness Analysis by By Product Type, 2016-2032
- Figure 67: APAC Reverse Vending Machines Market Revenue (US$ Mn) Market Share by By Applications 2022
- Figure 68: APAC Reverse Vending Machines Market Attractiveness Analysis by By Application, 2016-2032
- Figure 69: APAC Reverse Vending Machines Market Revenue (US$ Mn) Market Share by Country in 2022
- Figure 70: APAC Reverse Vending Machines Market Attractiveness Analysis by Country, 2016-2032
- Figure 71: APAC Reverse Vending Machines Market Revenue (US$ Mn) (2016-2032)
- Figure 72: APAC Reverse Vending Machines Market Revenue (US$ Mn) Comparison by Country (2016-2032)
- Figure 73: APAC Reverse Vending Machines Market Revenue (US$ Mn) Comparison by By Product Type (2016-2032)
- Figure 74: APAC Reverse Vending Machines Market Revenue (US$ Mn) Comparison by By Application (2016-2032)
- Figure 75: APAC Reverse Vending Machines Market Y-o-Y Growth Rate Comparison by Country (2016-2032)
- Figure 76: APAC Reverse Vending Machines Market Y-o-Y Growth Rate Comparison by By Product Type (2016-2032)
- Figure 77: APAC Reverse Vending Machines Market Y-o-Y Growth Rate Comparison by By Application (2016-2032)
- Figure 78: APAC Reverse Vending Machines Market Share Comparison by Country (2016-2032)
- Figure 79: APAC Reverse Vending Machines Market Share Comparison by By Product Type (2016-2032)
- Figure 80: APAC Reverse Vending Machines Market Share Comparison by By Application (2016-2032)
- Figure 81: Latin America Reverse Vending Machines Market Revenue (US$ Mn) Market Share by By Product Typein 2022
- Figure 82: Latin America Reverse Vending Machines Market Attractiveness Analysis by By Product Type, 2016-2032
- Figure 83: Latin America Reverse Vending Machines Market Revenue (US$ Mn) Market Share by By Applicationin 2022
- Figure 84: Latin America Reverse Vending Machines Market Attractiveness Analysis by By Application, 2016-2032
- Figure 85: Latin America Reverse Vending Machines Market Revenue (US$ Mn) Market Share by Country in 2022
- Figure 86: Latin America Reverse Vending Machines Market Attractiveness Analysis by Country, 2016-2032
- Figure 87: Latin America Reverse Vending Machines Market Revenue (US$ Mn) (2016-2032)
- Figure 88: Latin America Reverse Vending Machines Market Revenue (US$ Mn) Comparison by Country (2016-2032)
- Figure 89: Latin America Reverse Vending Machines Market Revenue (US$ Mn) Comparison by By Product Type (2016-2032)
- Figure 90: Latin America Reverse Vending Machines Market Revenue (US$ Mn) Comparison by By Application (2016-2032)
- Figure 91: Latin America Reverse Vending Machines Market Y-o-Y Growth Rate Comparison by Country (2016-2032)
- Figure 92: Latin America Reverse Vending Machines Market Y-o-Y Growth Rate Comparison by By Product Type (2016-2032)
- Figure 93: Latin America Reverse Vending Machines Market Y-o-Y Growth Rate Comparison by By Application (2016-2032)
- Figure 94: Latin America Reverse Vending Machines Market Share Comparison by Country (2016-2032)
- Figure 95: Latin America Reverse Vending Machines Market Share Comparison by By Product Type (2016-2032)
- Figure 96: Latin America Reverse Vending Machines Market Share Comparison by By Application (2016-2032)
- Figure 97: Middle East & Africa Reverse Vending Machines Market Revenue (US$ Mn) Market Share by By Product Typein 2022
- Figure 98: Middle East & Africa Reverse Vending Machines Market Attractiveness Analysis by By Product Type, 2016-2032
- Figure 99: Middle East & Africa Reverse Vending Machines Market Revenue (US$ Mn) Market Share by By Applicationin 2022
- Figure 100: Middle East & Africa Reverse Vending Machines Market Attractiveness Analysis by By Application, 2016-2032
- Figure 101: Middle East & Africa Reverse Vending Machines Market Revenue (US$ Mn) Market Share by Country in 2022
- Figure 102: Middle East & Africa Reverse Vending Machines Market Attractiveness Analysis by Country, 2016-2032
- Figure 103: Middle East & Africa Reverse Vending Machines Market Revenue (US$ Mn) (2016-2032)
- Figure 104: Middle East & Africa Reverse Vending Machines Market Revenue (US$ Mn) Comparison by Country (2016-2032)
- Figure 105: Middle East & Africa Reverse Vending Machines Market Revenue (US$ Mn) Comparison by By Product Type (2016-2032)
- Figure 106: Middle East & Africa Reverse Vending Machines Market Revenue (US$ Mn) Comparison by By Application (2016-2032)
- Figure 107: Middle East & Africa Reverse Vending Machines Market Y-o-Y Growth Rate Comparison by Country (2016-2032)
- Figure 108: Middle East & Africa Reverse Vending Machines Market Y-o-Y Growth Rate Comparison by By Product Type (2016-2032)
- Figure 109: Middle East & Africa Reverse Vending Machines Market Y-o-Y Growth Rate Comparison by By Application (2016-2032)
- Figure 110: Middle East & Africa Reverse Vending Machines Market Share Comparison by Country (2016-2032)
- Figure 111: Middle East & Africa Reverse Vending Machines Market Share Comparison by By Product Type (2016-2032)
- Figure 112: Middle East & Africa Reverse Vending Machines Market Share Comparison by By Application (2016-2032)
List of Tables
- Table 1: Global Reverse Vending Machines Market Comparison by By Product Type (2016-2032)
- Table 2: Global Reverse Vending Machines Market Comparison by By Application (2016-2032)
- Table 3: Global Reverse Vending Machines Market Revenue (US$ Mn) Comparison by Region (2016-2032)
- Table 4: Global Reverse Vending Machines Market Revenue (US$ Mn) (2016-2032)
- Table 5: Global Reverse Vending Machines Market Revenue (US$ Mn) Comparison by Region (2016-2032)
- Table 6: Global Reverse Vending Machines Market Revenue (US$ Mn) Comparison by By Product Type (2016-2032)
- Table 7: Global Reverse Vending Machines Market Revenue (US$ Mn) Comparison by By Application (2016-2032)
- Table 8: Global Reverse Vending Machines Market Y-o-Y Growth Rate Comparison by Region (2016-2032)
- Table 9: Global Reverse Vending Machines Market Y-o-Y Growth Rate Comparison by By Product Type (2016-2032)
- Table 10: Global Reverse Vending Machines Market Y-o-Y Growth Rate Comparison by By Application (2016-2032)
- Table 11: Global Reverse Vending Machines Market Share Comparison by Region (2016-2032)
- Table 12: Global Reverse Vending Machines Market Share Comparison by By Product Type (2016-2032)
- Table 13: Global Reverse Vending Machines Market Share Comparison by By Application (2016-2032)
- Table 14: North America Reverse Vending Machines Market Comparison by By Application (2016-2032)
- Table 15: North America Reverse Vending Machines Market Revenue (US$ Mn) Comparison by Country (2016-2032)
- Table 16: North America Reverse Vending Machines Market Revenue (US$ Mn) (2016-2032)
- Table 17: North America Reverse Vending Machines Market Revenue (US$ Mn) Comparison by Country (2016-2032)
- Table 18: North America Reverse Vending Machines Market Revenue (US$ Mn) Comparison by By Product Type (2016-2032)
- Table 19: North America Reverse Vending Machines Market Revenue (US$ Mn) Comparison by By Application (2016-2032)
- Table 20: North America Reverse Vending Machines Market Y-o-Y Growth Rate Comparison by Country (2016-2032)
- Table 21: North America Reverse Vending Machines Market Y-o-Y Growth Rate Comparison by By Product Type (2016-2032)
- Table 22: North America Reverse Vending Machines Market Y-o-Y Growth Rate Comparison by By Application (2016-2032)
- Table 23: North America Reverse Vending Machines Market Share Comparison by Country (2016-2032)
- Table 24: North America Reverse Vending Machines Market Share Comparison by By Product Type (2016-2032)
- Table 25: North America Reverse Vending Machines Market Share Comparison by By Application (2016-2032)
- Table 26: Western Europe Reverse Vending Machines Market Comparison by By Product Type (2016-2032)
- Table 27: Western Europe Reverse Vending Machines Market Comparison by By Application (2016-2032)
- Table 28: Western Europe Reverse Vending Machines Market Revenue (US$ Mn) Comparison by Country (2016-2032)
- Table 29: Western Europe Reverse Vending Machines Market Revenue (US$ Mn) (2016-2032)
- Table 30: Western Europe Reverse Vending Machines Market Revenue (US$ Mn) Comparison by Country (2016-2032)
- Table 31: Western Europe Reverse Vending Machines Market Revenue (US$ Mn) Comparison by By Product Type (2016-2032)
- Table 32: Western Europe Reverse Vending Machines Market Revenue (US$ Mn) Comparison by By Application (2016-2032)
- Table 33: Western Europe Reverse Vending Machines Market Y-o-Y Growth Rate Comparison by Country (2016-2032)
- Table 34: Western Europe Reverse Vending Machines Market Y-o-Y Growth Rate Comparison by By Product Type (2016-2032)
- Table 35: Western Europe Reverse Vending Machines Market Y-o-Y Growth Rate Comparison by By Application (2016-2032)
- Table 36: Western Europe Reverse Vending Machines Market Share Comparison by Country (2016-2032)
- Table 37: Western Europe Reverse Vending Machines Market Share Comparison by By Product Type (2016-2032)
- Table 38: Western Europe Reverse Vending Machines Market Share Comparison by By Application (2016-2032)
- Table 39: Eastern Europe Reverse Vending Machines Market Comparison by By Product Type (2016-2032)
- Table 40: Eastern Europe Reverse Vending Machines Market Comparison by By Application (2016-2032)
- Table 41: Eastern Europe Reverse Vending Machines Market Revenue (US$ Mn) Comparison by Country (2016-2032)
- Table 42: Eastern Europe Reverse Vending Machines Market Revenue (US$ Mn) (2016-2032)
- Table 43: Eastern Europe Reverse Vending Machines Market Revenue (US$ Mn) Comparison by Country (2016-2032)
- Table 44: Eastern Europe Reverse Vending Machines Market Revenue (US$ Mn) Comparison by By Product Type (2016-2032)
- Table 45: Eastern Europe Reverse Vending Machines Market Revenue (US$ Mn) Comparison by By Application (2016-2032)
- Table 46: Eastern Europe Reverse Vending Machines Market Y-o-Y Growth Rate Comparison by Country (2016-2032)
- Table 47: Eastern Europe Reverse Vending Machines Market Y-o-Y Growth Rate Comparison by By Product Type (2016-2032)
- Table 48: Eastern Europe Reverse Vending Machines Market Y-o-Y Growth Rate Comparison by By Application (2016-2032)
- Table 49: Eastern Europe Reverse Vending Machines Market Share Comparison by Country (2016-2032)
- Table 50: Eastern Europe Reverse Vending Machines Market Share Comparison by By Product Type (2016-2032)
- Table 51: Eastern Europe Reverse Vending Machines Market Share Comparison by By Application (2016-2032)
- Table 52: APAC Reverse Vending Machines Market Comparison by By Product Type (2016-2032)
- Table 53: APAC Reverse Vending Machines Market Comparison by By Application (2016-2032)
- Table 54: APAC Reverse Vending Machines Market Revenue (US$ Mn) Comparison by Country (2016-2032)
- Table 55: APAC Reverse Vending Machines Market Revenue (US$ Mn) (2016-2032)
- Table 56: APAC Reverse Vending Machines Market Revenue (US$ Mn) Comparison by Country (2016-2032)
- Table 57: APAC Reverse Vending Machines Market Revenue (US$ Mn) Comparison by By Product Type (2016-2032)
- Table 58: APAC Reverse Vending Machines Market Revenue (US$ Mn) Comparison by By Application (2016-2032)
- Table 59: APAC Reverse Vending Machines Market Y-o-Y Growth Rate Comparison by Country (2016-2032)
- Table 60: APAC Reverse Vending Machines Market Y-o-Y Growth Rate Comparison by By Product Type (2016-2032)
- Table 61: APAC Reverse Vending Machines Market Y-o-Y Growth Rate Comparison by By Application (2016-2032)
- Table 62: APAC Reverse Vending Machines Market Share Comparison by Country (2016-2032)
- Table 63: APAC Reverse Vending Machines Market Share Comparison by By Product Type (2016-2032)
- Table 64: APAC Reverse Vending Machines Market Share Comparison by By Application (2016-2032)
- Table 65: Latin America Reverse Vending Machines Market Comparison by By Product Type (2016-2032)
- Table 66: Latin America Reverse Vending Machines Market Comparison by By Application (2016-2032)
- Table 67: Latin America Reverse Vending Machines Market Revenue (US$ Mn) Comparison by Country (2016-2032)
- Table 68: Latin America Reverse Vending Machines Market Revenue (US$ Mn) (2016-2032)
- Table 69: Latin America Reverse Vending Machines Market Revenue (US$ Mn) Comparison by Country (2016-2032)
- Table 70: Latin America Reverse Vending Machines Market Revenue (US$ Mn) Comparison by By Product Type (2016-2032)
- Table 71: Latin America Reverse Vending Machines Market Revenue (US$ Mn) Comparison by By Application (2016-2032)
- Table 72: Latin America Reverse Vending Machines Market Y-o-Y Growth Rate Comparison by Country (2016-2032)
- Table 73: Latin America Reverse Vending Machines Market Y-o-Y Growth Rate Comparison by By Product Type (2016-2032)
- Table 74: Latin America Reverse Vending Machines Market Y-o-Y Growth Rate Comparison by By Application (2016-2032)
- Table 75: Latin America Reverse Vending Machines Market Share Comparison by Country (2016-2032)
- Table 76: Latin America Reverse Vending Machines Market Share Comparison by By Product Type (2016-2032)
- Table 77: Latin America Reverse Vending Machines Market Share Comparison by By Application (2016-2032)
- Table 78: Middle East & Africa Reverse Vending Machines Market Comparison by By Product Type (2016-2032)
- Table 79: Middle East & Africa Reverse Vending Machines Market Comparison by By Application (2016-2032)
- Table 80: Middle East & Africa Reverse Vending Machines Market Revenue (US$ Mn) Comparison by Country (2016-2032)
- Table 81: Middle East & Africa Reverse Vending Machines Market Revenue (US$ Mn) (2016-2032)
- Table 82: Middle East & Africa Reverse Vending Machines Market Revenue (US$ Mn) Comparison by Country (2016-2032)
- Table 83: Middle East & Africa Reverse Vending Machines Market Revenue (US$ Mn) Comparison by By Product Type (2016-2032)
- Table 84: Middle East & Africa Reverse Vending Machines Market Revenue (US$ Mn) Comparison by By Application (2016-2032)
- Table 85: Middle East & Africa Reverse Vending Machines Market Y-o-Y Growth Rate Comparison by Country (2016-2032)
- Table 86: Middle East & Africa Reverse Vending Machines Market Y-o-Y Growth Rate Comparison by By Product Type (2016-2032)
- Table 87: Middle East & Africa Reverse Vending Machines Market Y-o-Y Growth Rate Comparison by By Application (2016-2032)
- Table 88: Middle East & Africa Reverse Vending Machines Market Share Comparison by Country (2016-2032)
- Table 89: Middle East & Africa Reverse Vending Machines Market Share Comparison by By Product Type (2016-2032)
- Table 90: Middle East & Africa Reverse Vending Machines Market Share Comparison by By Application (2016-2032)
- 1. Executive Summary
-
- TOMRA Systems ASA
- Envipco Holding N.V.
- Diebold Nixdorf, Inc.
- Sielaff GmbH & Co. KG
- Wincor Nixdorf AG
- RVM Systems AS
- Kansmacker
- Trautwein SB Technik GmbH
- MEGLA GmbH
- Envirobank Recycling Pty Ltd.
- Aco Recycling
- Xiamen Rongxiang Technology Co., Ltd.
- INCOM TOMRA Recycling Technology (Beijing) Co., Ltd.
- FlexLink Systems, Inc.
- Reverse Vending Corporation
Our Clients


View Our Licence Options
