Reverse Vending Machines Market By Product Type (Refillable Type, Non-Refillable Type, Multifunction Type), By Application (Supermarkets, Community, Utilities), By Region And Companies - Industry Segment Outlook, Market Assessment, Competition Scenario, Trends, And Forecast 2023-2032
17829
June 2023
150
Report Overview
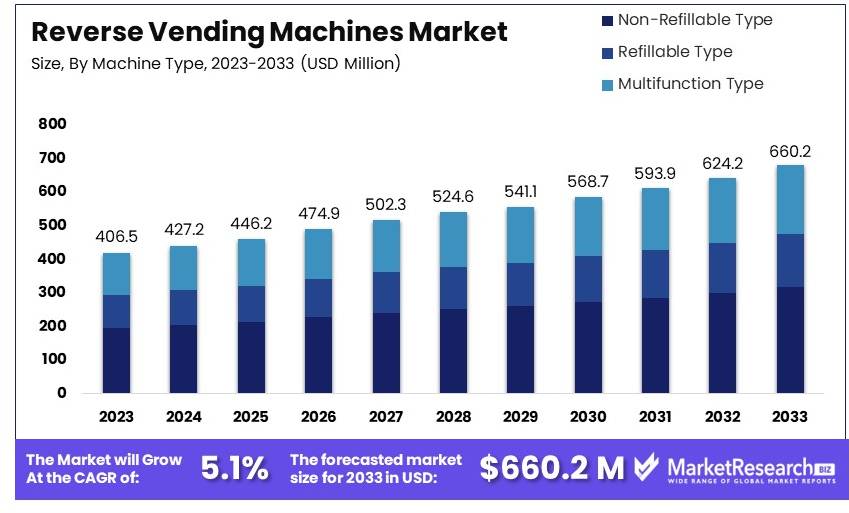
Reverse Vending Machines Market size is expected to be worth around USD 755 Mn by 2032 from USD 420 Mn in 2022, growing at a CAGR of 6.2% during the forecast period from 2023 to 2032.
It is impossible to ignore the pervasiveness of reverse vending machines in today's dynamic society. Individuals can deposit their empty bottles and cans in a convenient manner using these revolutionary devices, initiating a revolutionary sifting and recycling process. In recent years, the Reverse Vending Machines Market has experienced a meteoric rise, attributable to pressing environmental concerns, technological advancements, and the unwavering desire of businesses to adopt this cutting-edge technology.
This report contains an intricate analysis of the Reverse Vending Machines Market, meticulously elucidating the myriad of factors driving its growth and illuminating the potential obstacles that could impede its ascent. It meticulously examines market dynamics, captures the fleeting essence of emergent trends, and delves deeply into the intricate complexities that comprise the competitive landscape. This report is an indispensable resource for both seasoned participants seeking to strengthen their market presence and aspiring newcomers eager to carve out a niche.
Reverse Vending Machines, the pinnacle of technological innovation, herald a paradigm shift by empowering individuals to deposit their emptied bottles and cans, thereby reinvigorating the recycling philosophy. These enthralling machines, basking in the reflected glory of their justifiable popularity, possess an assortment of advantages that captivate the imagination. From their resolute commitment to waste reduction to their seamless proficiency in sorting materials to the enticing incentives for recycling, these devices serve as beacons of hope in a world beset by environmental challenges. The Reverse Vending Machines Market is poised to flourish, spreading its transformative wings, as technological frontiers continue to broaden and societal environmental consciousness grows.
The domain of reverse vending machines has witnessed a magnificent tapestry of innovation that pushes the boundaries of possibility. The ethereal symphony of progress resounds throughout the corridors of this landscape, with one notable crescendo stealing the show: the harmonious integration of AI technology. This masterstroke has endowed these machines with the ability to perform the complex task of material classification with unmatched efficiency. In addition, the software underlying these machines has endured a transformation, adopting a streamlined and efficient demeanor that ensures the recycling process unfolds with impeccable grace.
The surge of investments cascading down its vibrant corridors and penetrating the very core of businesses products and services is unmistakable evidence of the Reverse Vending Machines Market's meteoric ascent. Smaller businesses have succumbed to the seductive call of this technological marvel by deftly incorporating it into their offerings, thereby democratizing access, as large corporations converge in a strategic embrace with reverse vending machines and pledge their unwavering allegiance. The ubiquity of these devices in the public sphere makes them an indispensable cornerstone, readily accessible in the mazes of shopping malls, the sacred halls of educational institutions, and the bustling arenas of public spaces.
Driving Factors
Environmental sustainability is a driving force in the reverse vending machine market
The market for reverse vending machines is expanding rapidly, driven by the need for environmental sustainability. As concern for climate change and environmental pollution increases, governments, businesses, and consumers alike actively seek to reduce their carbon footprints. Reverse vending machines (RVMs) have emerged as an efficient means of recycling and disposing of empty beverage containers, thereby reducing the amount of refuse destined for landfills.
The Reverse Vending Machine Market is Accelerated by Regulatory Frameworks
Regulations play a crucial role in advancing the reverse vending machine industry. To combat environmental pollution, governments all over the world are implementing stringent waste management regulations. Notably, by 2030, the European Union aims to recycle 75% of plastic packaging detritus. In this pursuit, RVMs have emerged as a legitimate solution for contributing to the achievement of this lofty objective. Implemented in a number of nations, mandatory deposit-refund systems have substantially increased recycling rates and fostered the adoption of RVMs.
Market Driven by Incentive Programs for Reverse Vending Machines
The market for reverse vending devices is substantially driven by incentive programs. RVMs offer a novel way to encourage consumers to recycle by providing monetary rewards, store credits, or purchase discounts. These programs have proven effective at increasing recycling rates and reducing pollution. By providing tangible benefits to individuals who recycle with RVMs, these devices encourage a greater proportion of the population to engage in sustainable practices.
Innovative Technological Developments in the Initiation of the Reverse Vending Machine Market
The expansion of the market for reverse vending machines is stimulated by technological progress. The introduction of intelligent RVMs that utilize artificial intelligence, machine learning, and cloud computation has revolutionized their efficiency and precision. These intelligent devices can sort, count, and crush different types of containers, eliminating the need for human intervention during the sorting process. In addition, they provide businesses with real-time data on recycling rates, container types, and customer behavior, allowing them to tailor incentive programs to the preferences and requirements of their customer base.
Restraining Factors
Limited Infrastructure
The absence of a suitable infrastructure is one of the major factors restraining the Reverse Vending Machines Market. Installation and operation of these machines necessitate a substantial quantity of space, energy, and apparatus. The installation of these machines in remote or rural locations with limited access to electricity and other resources presents a significant challenge.
Material Challenges
The Reverse Vending Machines Market is dependent on the vast availability of recyclable materials. However, there has always been a limited supply of these materials, resulting in a constant struggle for manufacturers and operators. The quality of the materials also plays a significant role in the effectiveness of these devices, as the sensors may not detect low-quality or contaminated waste.
Very High Costs
The high cost of manufacturing, installing, and maintaining Reverse Vending Machines has limited the growth potential of the market in certain regions. Individuals or businesses who want to invest in these devices must pay a substantial up-front fee, which may deter some. In addition, these devices have high maintenance and repair costs, resulting in decreased profitability and returns.
Consumer Behaviour
Consumer behavior is crucial to the viability of the Reverse Vending Machines Market. People must be encouraged to use these machines and alter their waste disposal practices. Therefore, educating and persuading consumers to recycle and utilize these appliances is a time-consuming and difficult endeavor.
Type Analysis
The Reverse Vending Machines (RVM) market is a dynamic, swiftly expanding market that is constantly changing. Non-Refillable Type segments have assumed a commanding lead in the Reverse Vending Machines market, representing one of the market's main developments. In actuality, the Non-Refillable Type segment dominates the Reverse Vending Machines market, accounting for a substantial portion of the market.
Economic Development in Emerging Economies is one of the primary drivers of the Adoption of Non Refillable Type Segments in the Reverse Vending Machines Market. Due to the rising interest in recycling and environmental protection, Reverse Vending Machines are becoming more and more common in these nations.
Non-Refillable Type Segment consumer trends and behavior have also played a significant role in their widespread adoption. Consumers, particularly in developed nations, are becoming more environmentally conscious and searching for methods to reduce their carbon footprint. As a result, the Non-Refillable Type Segments in Reverse Vending Machines are an ideal method for them to accomplish this.
Another factor contributing to the anticipated growth of the Non-Refillable Type Segment of the Reverse Vending Machines market is the segment's affordability. Non-Refillable Type Segments are significantly less expensive to produce than Refillable Type Segments, making them an attractive option for manufacturers. Additionally, they require less maintenance, which makes them simpler to manage and keep operating efficiently.
Application Analysis
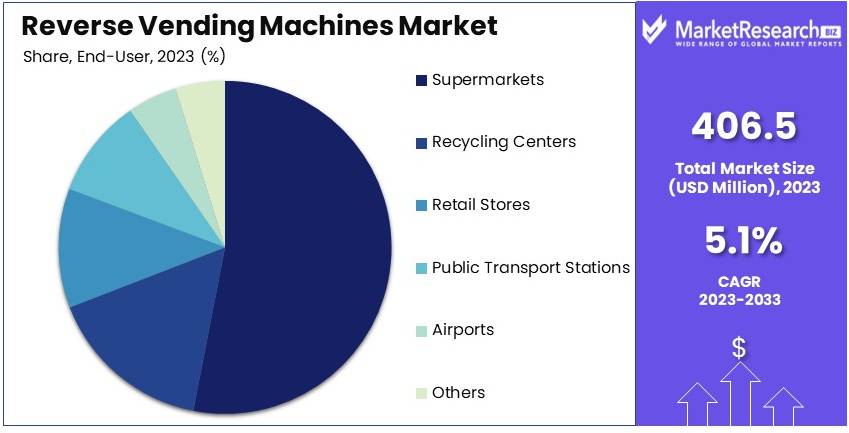
Supermarkets dominate the Reverse Vending Machines market, accounting for a sizable portion of the overall market. This dominance is due to the widespread adoption of Reverse Vending machinery in supermarkets to encourage consumers to recycle.
The Economic Development in Emerging Economies drives the adoption of Reverse Vending Machines in supermarkets. As these nations continue to develop economically, consumers are becoming more conscious of the need for environmental protection, and supermarkets are capitalizing on this by implementing Reverse Vending Machines.
Trends and behaviors of consumers toward Supermarket segments have also played a significant role in the segments' pervasive adoption. Consumers are increasingly searching for methods to reduce their carbon footprint, and supermarkets offer a simple solution. By implementing Reverse Vending Machines in their stores, supermarkets demonstrate their dedication to environmental protection and encourage customers to do the same.
Key Market Segments
By Product Type
- Refillable Type
- Non-Refillable Type
- Multifunction Type
By Application
- Supermarkets
- Community
- Utilities
Growth Opportunity
Smart features integration
The incorporation of intelligent features into Reverse Vending machinery is becoming more and more popular as technology develops. These devices now feature touch screens and sensors, making them more user-friendly, efficient, and convenient. Businesses and municipalities that want to monitor usage, collect data, and optimize recycling programs can benefit from enhanced monitoring and reporting capabilities enabled by intelligent features.
Public spaces expansion
Reverse Vending Machines are expanding into public spaces such as airports, railway stations, schools, and office buildings, in addition to traditional locations such as supermarkets. As more people are exposed to recycling and motivated to engage in appropriate waste disposal, the expansion into public spaces presents a prime opportunity for the placement of reverse vending machines. The demand for Reverse Vending machines will only rise as more businesses and institutions incorporate them into their sustainability initiatives.
Collaboration
The Reverse Vending Machines market can develop as a result of collaboration between businesses and municipalities. Partnerships between recycling companies and manufacturers of reverse vending machines can help to create incentives for users, such as loyalty programs, discounts, and prizes, which encourage appropriate recycling practices. In addition, these partnerships can help improve the efficacy of waste management systems by providing improved recycling data and insights.
AI-Based Sorting
Lastly, the incorporation of AI-based sorting technology into Reverse Vending Machines is an additional factor propelling growth in this market. AI-based sorting enables Reverse Vending Machines to analyze and classify recyclables more effectively, thereby reducing errors and boosting efficiency. The incorporation of AI-based sorting facilitates the recycling and repurposing of recyclables collected by Reverse Vending Machines.
The reverse vending machine market has significant growth potential due to the incorporation of intelligent features, expansion into public spaces, collaboration, and the use of artificial intelligence for categorizing. The demand for Reverse Vending Machines is anticipated to increase as a result of an increasing emphasis on sustainability, increased consumer awareness, and corporate responsibility in recycling.
Latest Trends
Reducing Waste and Promoting Sustainability
Global recognition has grown for the effectiveness of circular economy initiatives in combating waste and promoting sustainability. In this effort, organizations around the globe are adopting circular economy models in an effort to reduce waste production and encourage the reuse and recycling of materials. In this environment, reverse vending machines have emerged as indispensable components, integrating seamlessly with circular economy initiatives. These devices encourage consumers to recycle by offering attractive incentives such as cashback, discounts, and loyalty points. By providing incentives for recycling, reverse vending machines have substantially reduced global waste production.
Smart Technologies Revolutionizing Reverse Vending Machines
The Internet of Things (IoT), artificial intelligence (AI), and machine learning (ML) have all been integrated into reverse vending machines to improve the user experience. These revolutionary technologies have transformed the effectiveness, dependability, and interactivity of reverse vending machines. IoT sensors embedded within these devices, for example, collect data on usage patterns, performance metrics, and maintenance requirements. This data enables the optimization of machine performance, the minimization of downtime, and the reduction of maintenance costs, thereby assuring seamless operations and enhanced user satisfaction.
A Sustainable Solution for Plastic Waste
Plastic bottle recycling devices are in greater demand due to the expanding use of plastic bottles in industries such as beverages, food, and pharmaceuticals. These devices provide a viable solution for addressing the growing problem of plastic waste. Plastic bottle recycling devices use advanced recycling technologies such as pyrolysis, gasification, and catalytic depolymerization to convert used plastic bottles into valuable resources. This process converts plastic waste into fuel oil, synthetic gas, and carbon black, effectively reducing the global plastic waste problem.
Enhancing Brand Engagement and Promoting Recycling
Due to their high foot traffic and visibility, retail and public spaces have become prime locations for the proliferation of reverse vending machines. By deploying reverse vending machines, merchants seize the chance to align their brands with sustainability. They provide customers with incentives, such as redeemable points, for recycling used bottles, thereby encouraging brand loyalty and customer engagement. Reverse vending machines are utilized in public spaces, such as parks, beaches, and transportation hubs, to combat littering and raise awareness of the critical significance of recycling.
Regional Analysis
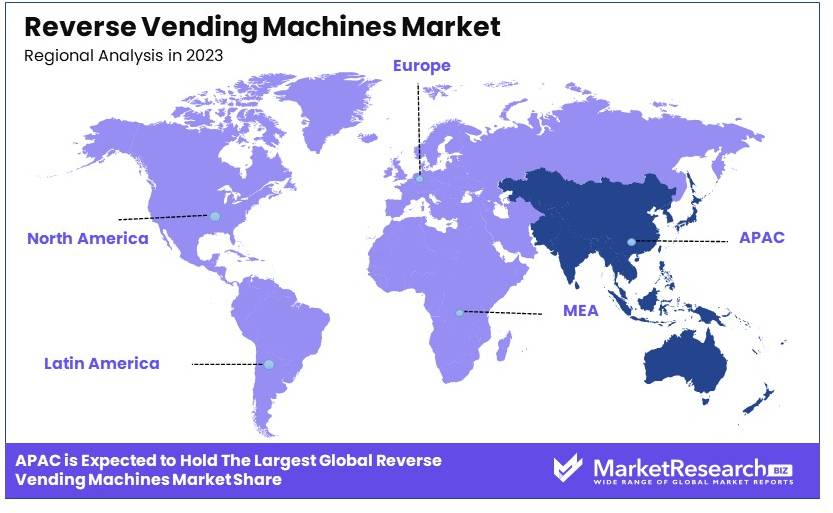
Asia-Pacific has emerged as a dominant force in the reverse vending machines market, wielding unrivaled sway and molding the future of this thriving industry. Several significant factors contribute to the region's ascendancy and leadership position in this market's transformation.
The Asia-Pacific region is experiencing a tidal tide of urbanization and population growth, which has resulted in expanding consumer markets. The demand for sustainable waste management solutions increases as urban centers grow. Individuals can contribute to recycling efforts in an efficient and convenient manner through reverse vending machines, which aligns with the region's environmental objectives and fosters a culture of sustainability.
Governments throughout the Asia-Pacific region have adopted the necessity of environmental conservation and waste reduction, resulting in the adoption of stringent policies and regulatory frameworks. These initiatives seek to encourage recycling and lessen the environmental impact of waste. Governments have fostered the development of reverse vending machines by incentivizing their use with deposit-refund systems and other supportive measures, thereby fostering their proliferation.
Companies in the Asia-Pacific region, particularly those in the food and beverage, retail, and manufacturing industries, understand the significance of corporate social responsibility (CSR) and sustainable business practices. Incorporating reverse vending machines into their operations is consistent with their CSR goals, allowing them to demonstrate their dedication to environmental stewardship. Consequently, companies invest proactively in reverse vending machines, nurturing a robust market ecosystem.
The Asia-Pacific region has witnessed a significant transition in consumer behavior, driven by a growing awareness of environmental issues and the desire to make sustainable choices. Consumers actively endeavor to reduce their ecological footprint and participate in recycling initiatives. Reverse vending machines are consistent with this mindset, offering an accessible and rewarding way for people to engage in recycling practices. The Asia-Pacific reverse vending machines market is expanding as a result of rising demand from environmentally conscious consumers.
Key Regions and Countries
North America
- US
- Canada
- Mexico
Western Europe
- Germany
- France
- The UK
- Spain
- Italy
- Portugal
- Ireland
- Austria
- Switzerland
- Benelux
- Nordic
- Rest of Western Europe
Eastern Europe
- Russia
- Poland
- The Czech Republic
- Greece
- Rest of Eastern Europe
APAC
- China
- Japan
- South Korea
- India
- Australia & New Zealand
- Indonesia
- Malaysia
- Philippines
- Singapore
- Thailand
- Vietnam
- Rest of APAC
Latin America
- Brazil
- Colombia
- Chile
- Argentina
- Costa Rica
- Rest of Latin America
Middle East & Africa
- Algeria
- Egypt
- Israel
- Kuwait
- Nigeria
- Saudi Arabia
- South Africa
- Turkey
- United Arab Emirates
- Rest of MEA
Key Players Analysis
Tomra Systems ASA dominates the global reverse vending machines market. Europe, North America, and Asia-Pacific are its strongholds.
Envipco Holdings is a major player in the reverse vending machines market in North America. Reverse Vending Machines and mobile collection units are among the company's recycling options.
NGR-Next Generation Recycling Maschinen is a leader in plastic recycling technology and equipment. The company sells Reverse Vending machines for plastic bottles, cans, and glass.
Retail technology leader Wincor Nixdorf offers beverage and food solutions. Reverse Vending Machines from the company minimize waste and increase recycling efficiency.
Top Key Players in Reverse Vending Machines Market
- Diebold Nixdorf
- Tomra Systems ASA
- Teraoka Seiko Co. Ltd. (TERAOKA (DIGI) Group)
- Envipco Holding N.V.
- Rvm Systems AB
- Trautwein SB-Technik GmbH
- Kansmacker Manufacturing
- Incom Tomra Recycling Technology (Beijing) Co. Ltd.
- Aco Recycling
- Unisan UK
- EREZ Thermoplastic Products
- Hangzhou Chinastars Reflective Material Co.
Recent Development
- In 2022, TerraCycle launched its Reverse Vending Machines Network, allowing consumers to recycle plastic bottles and other recyclables at participating businesses.
- In 2022, Loop launched Loop Reverse Vending Machines Network to compete. Users can return reusable containers to partner stores to recycle them efficiently and sustainably.
- In 2023, Reloop launched its Reverse Vending Machines Network. Participating retailers recycle plastic bottles and other recyclables like TerraCycle and Loop.
- In 2023, Enviro-Fill launched its Reverse Vending Machines Network. This initiative lets customers return reusable containers to stores.
Report Scope
Report Features Description Market Value (2022) USD 420 Mn Forecast Revenue (2032) USD 755 Bn CAGR (2023-2032) 6.2% Base Year for Estimation 2022 Historic Period 2016-2022 Forecast Period 2023-2032 Report Coverage Revenue Forecast, Market Dynamics, COVID-19 Impact, Competitive Landscape, Recent Developments Segments Covered By Product Type (Refillable Type, Non-Refillable Type, Multifunction Type)
By Application (Supermarkets, Community, Utilities)Regional Analysis North America – The US, Canada, & Mexico; Western Europe – Germany, France, The UK, Spain, Italy, Portugal, Ireland, Austria, Switzerland, Benelux, Nordic, & Rest of Western Europe; Eastern Europe – Russia, Poland, The Czech Republic, Greece, & Rest of Eastern Europe; APAC – China, Japan, South Korea, India, Australia & New Zealand, Indonesia, Malaysia, Philippines, Singapore, Thailand, Vietnam, & Rest of APAC; Latin America – Brazil, Colombia, Chile, Argentina, Costa Rica, & Rest of Latin America; Middle East & Africa – Algeria, Egypt, Israel, Kuwait, Nigeria, Saudi Arabia, South Africa, Turkey, United Arab Emirates, & Rest of MEA Competitive Landscape Diebold Nixdorf, Tomra Systems ASA, Teraoka Seiko Co. Ltd. (TERAOKA (DIGI) Group), Envipco Holding N.V., Rvm Systems AB, Trautwein SB-Technik GmbH, Kansmacker Manufacturing, Incom Tomra Recycling Technology (Beijing) Co. Ltd., Aco Recycling, Unisan UK, EREZ Thermoplastic Products, Hangzhou Chinastars Reflective Material Co. Customization Scope Customization for segments, region/country-level will be provided. Moreover, additional customization can be done based on the requirements. Purchase Options We have three licenses to opt for: Single User License, Multi-User License (Up to 5 Users), Corporate Use License (Unlimited User and Printable PDF) - Diebold Nixdorf
- Tomra Systems ASA
- Teraoka Seiko Co. Ltd. (TERAOKA (DIGI) Group)
- Envipco Holding N.V.
- Rvm Systems AB
- Trautwein SB-Technik GmbH
- Kansmacker Manufacturing
- Incom Tomra Recycling Technology (Beijing) Co. Ltd.
- Aco Recycling
- Unisan UK
- EREZ Thermoplastic Products
- Hangzhou Chinastars Reflective Material Co.
- 1. Executive Summary
- 1.1. Definition
- 1.2. Taxonomy
- 1.3. Research Scope
- 1.4. Key Analysis
- 1.5. Key Findings by Major Segments
- 1.6. Top Strategies by Major Players
- 2. Global Reverse Vending Machines Market Overview
- 2.1. Reverse Vending Machines Market Dynamics
- 2.1.1. Drivers
- 2.1.2. Opportunities
- 2.1.3. Restraints
- 2.1.4. Challenges
- 2.2. Macro-economic Factors
- 2.3. Regulatory Framework
- 2.4. Market Investment Feasibility Index
- 2.5. PEST Analysis
- 2.6. PORTER’S Five Force Analysis
- 2.7. Drivers & Restraints Impact Analysis
- 2.8. Industry Chain Analysis
- 2.9. Cost Structure Analysis
- 2.10. Marketing Strategy
- 2.11. Russia-Ukraine War Impact Analysis
- 2.12. Opportunity Map Analysis
- 2.13. Market Competition Scenario Analysis
- 2.14. Product Life Cycle Analysis
- 2.15. Opportunity Orbits
- 2.16. Manufacturer Intensity Map
- 2.17. Major Companies' sales by Value & Volume
- 2.1. Reverse Vending Machines Market Dynamics
- 3. Global Reverse Vending Machines Market Analysis, Opportunity, and Forecast, 2016-2032
- 3.1. Global Reverse Vending Machines Market Analysis, 2016-2021
- 3.2. Global Reverse Vending Machines Market Opportunity and Forecast, 2023-2032
- 3.3. Global Reverse Vending Machines Market Analysis, Opportunity and Forecast, By By Product Type, 2016-2032
- 3.3.1. Global Reverse Vending Machines Market Analysis by By Product Type: Introduction
- 3.3.2. Market Size Absolute $ Opportunity Analysis and Forecast, By By Product Type, 2016-2032
- 3.3.3. Refillable Type
- 3.3.4. Non-Refillable Type
- 3.3.5. Multifunction Type
- 3.4. Global Reverse Vending Machines Market Analysis, Opportunity, and Forecast, By By Application, 2016-2032
- 3.4.1. Global Reverse Vending Machines Market Analysis by By Application: Introduction
- 3.4.2. Market Size Absolute $ Opportunity Analysis and Forecast, By By Application, 2016-2032
- 3.4.3. Supermarkets
- 3.4.4. Community
- 3.4.5. Utilities
- 4. North America Reverse Vending Machines Market Analysis, Opportunity, and Forecast, 2016-2032
- 4.1. North America Reverse Vending Machines Market Analysis, 2016-2021
- 4.2. North America Reverse Vending Machines Market Opportunity and Forecast, 2023-2032
- 4.3. North America Reverse Vending Machines Market Analysis, Opportunity and Forecast, By By Product Type, 2016-2032
- 4.3.1. North America Reverse Vending Machines Market Analysis by By Product Type: Introduction
- 4.3.2. Market Size Absolute $ Opportunity Analysis and Forecast, By By Product Type, 2016-2032
- 4.3.3. Refillable Type
- 4.3.4. Non-Refillable Type
- 4.3.5. Multifunction Type
- 4.4. North America Reverse Vending Machines Market Analysis, Opportunity and Forecast, By By Application, 2016-2032
- 4.4.1. North America Reverse Vending Machines Market Analysis by By Application: Introduction
- 4.4.2. Market Size Absolute $ Opportunity Analysis and Forecast, By By Application, 2016-2032
- 4.4.3. Supermarkets
- 4.4.4. Community
- 4.4.5. Utilities
- 4.5. North America Reverse Vending Machines Market Analysis, Opportunity, and Forecast, By Country, 2016-2032
- 4.5.1. North America Reverse Vending Machines Market Analysis by Country: Introduction
- 4.5.2. Market Size Absolute $ Opportunity Analysis and Forecast, Country, 2016-2032
- 4.5.2.1. The US
- 4.5.2.2. Canada
- 4.5.2.3. Mexico
- 5. Western Europe Reverse Vending Machines Market Analysis, Opportunity, and Forecast, 2016-2032
- 5.1. Western Europe Reverse Vending Machines Market Analysis, 2016-2021
- 5.2. Western Europe Reverse Vending Machines Market Opportunity and Forecast, 2023-2032
- 5.3. Western Europe Reverse Vending Machines Market Analysis, Opportunity and Forecast, By By Product Type, 2016-2032
- 5.3.1. Western Europe Reverse Vending Machines Market Analysis by By Product Type: Introduction
- 5.3.2. Market Size Absolute $ Opportunity Analysis and Forecast, By By Product Type, 2016-2032
- 5.3.3. Refillable Type
- 5.3.4. Non-Refillable Type
- 5.3.5. Multifunction Type
- 5.4. Western Europe Reverse Vending Machines Market Analysis, Opportunity and Forecast, By By Application, 2016-2032
- 5.4.1. Western Europe Reverse Vending Machines Market Analysis by By Application: Introduction
- 5.4.2. Market Size Absolute $ Opportunity Analysis and Forecast, By By Application, 2016-2032
- 5.4.3. Supermarkets
- 5.4.4. Community
- 5.4.5. Utilities
- 5.5. Western Europe Reverse Vending Machines Market Analysis, Opportunity and Forecast, By Country, 2016-2032
- 5.5.1. Western Europe Reverse Vending Machines Market Analysis by Country: Introduction
- 5.5.2. Market Size Absolute $ Opportunity Analysis and Forecast, Country, 2016-2032
- 5.5.2.1. Germany
- 5.5.2.2. France
- 5.5.2.3. The UK
- 5.5.2.4. Spain
- 5.5.2.5. Italy
- 5.5.2.6. Portugal
- 5.5.2.7. Ireland
- 5.5.2.8. Austria
- 5.5.2.9. Switzerland
- 5.5.2.10. Benelux
- 5.5.2.11. Nordic
- 5.5.2.12. Rest of Western Europe
- 6. Eastern Europe Reverse Vending Machines Market Analysis, Opportunity and Forecast, 2016-2032
- 6.1. Eastern Europe Reverse Vending Machines Market Analysis, 2016-2021
- 6.2. Eastern Europe Reverse Vending Machines Market Opportunity and Forecast, 2023-2032
- 6.3. Eastern Europe Reverse Vending Machines Market Analysis, Opportunity and Forecast, By By Product Type, 2016-2032
- 6.3.1. Eastern Europe Reverse Vending Machines Market Analysis by By Product Type: Introduction
- 6.3.2. Market Size Absolute $ Opportunity Analysis and Forecast, By By Product Type, 2016-2032
- 6.3.3. Refillable Type
- 6.3.4. Non-Refillable Type
- 6.3.5. Multifunction Type
- 6.4. Eastern Europe Reverse Vending Machines Market Analysis, Opportunity and Forecast, By By Application, 2016-2032
- 6.4.1. Eastern Europe Reverse Vending Machines Market Analysis by By Application: Introduction
- 6.4.2. Market Size Absolute $ Opportunity Analysis and Forecast, By By Application, 2016-2032
- 6.4.3. Supermarkets
- 6.4.4. Community
- 6.4.5. Utilities
- 6.5. Eastern Europe Reverse Vending Machines Market Analysis, Opportunity and Forecast, By Country, 2016-2032
- 6.5.1. Eastern Europe Reverse Vending Machines Market Analysis by Country: Introduction
- 6.5.2. Market Size Absolute $ Opportunity Analysis and Forecast, Country, 2016-2032
- 6.5.2.1. Russia
- 6.5.2.2. Poland
- 6.5.2.3. The Czech Republic
- 6.5.2.4. Greece
- 6.5.2.5. Rest of Eastern Europe
- 7. APAC Reverse Vending Machines Market Analysis, Opportunity, and Forecast, 2016-2032
- 7.1. APAC Reverse Vending Machines Market Analysis, 2016-2021
- 7.2. APAC Reverse Vending Machines Market Opportunity and Forecast, 2023-2032
- 7.3. APAC Reverse Vending Machines Market Analysis, Opportunity and Forecast, By By Product Type, 2016-2032
- 7.3.1. APAC Reverse Vending Machines Market Analysis by By Product Type: Introduction
- 7.3.2. Market Size Absolute $ Opportunity Analysis and Forecast, By By Product Type, 2016-2032
- 7.3.3. Refillable Type
- 7.3.4. Non-Refillable Type
- 7.3.5. Multifunction Type
- 7.4. APAC Reverse Vending Machines Market Analysis, Opportunity and Forecast, By By Application, 2016-2032
- 7.4.1. APAC Reverse Vending Machines Market Analysis by By Application: Introduction
- 7.4.2. Market Size Absolute $ Opportunity Analysis and Forecast, By By Application, 2016-2032
- 7.4.3. Supermarkets
- 7.4.4. Community
- 7.4.5. Utilities
- 7.5. APAC Reverse Vending Machines Market Analysis, Opportunity and Forecast, By Country, 2016-2032
- 7.5.1. APAC Reverse Vending Machines Market Analysis by Country: Introduction
- 7.5.2. Market Size Absolute $ Opportunity Analysis and Forecast, Country, 2016-2032
- 7.5.2.1. China
- 7.5.2.2. Japan
- 7.5.2.3. South Korea
- 7.5.2.4. India
- 7.5.2.5. Australia & New Zeland
- 7.5.2.6. Indonesia
- 7.5.2.7. Malaysia
- 7.5.2.8. Philippines
- 7.5.2.9. Singapore
- 7.5.2.10. Thailand
- 7.5.2.11. Vietnam
- 7.5.2.12. Rest of APAC
- 8. Latin America Reverse Vending Machines Market Analysis, Opportunity, and Forecast, 2016-2032
- 8.1. Latin America Reverse Vending Machines Market Analysis, 2016-2021
- 8.2. Latin America Reverse Vending Machines Market Opportunity and Forecast, 2023-2032
- 8.3. Latin America Reverse Vending Machines Market Analysis, Opportunity and Forecast, By By Product Type, 2016-2032
- 8.3.1. Latin America Reverse Vending Machines Market Analysis by By Product Type: Introduction
- 8.3.2. Market Size Absolute $ Opportunity Analysis and Forecast, By By Product Type, 2016-2032
- 8.3.3. Refillable Type
- 8.3.4. Non-Refillable Type
- 8.3.5. Multifunction Type
- 8.4. Latin America Reverse Vending Machines Market Analysis, Opportunity and Forecast, By By Application, 2016-2032
- 8.4.1. Latin America Reverse Vending Machines Market Analysis by By Application: Introduction
- 8.4.2. Market Size Absolute $ Opportunity Analysis and Forecast, By By Application, 2016-2032
- 8.4.3. Supermarkets
- 8.4.4. Community
- 8.4.5. Utilities
- 8.5. Latin America Reverse Vending Machines Market Analysis, Opportunity and Forecast, By Country, 2016-2032
- 8.5.1. Latin America Reverse Vending Machines Market Analysis by Country: Introduction
- 8.5.2. Market Size Absolute $ Opportunity Analysis and Forecast, Country, 2016-2032
- 8.5.2.1. Brazil
- 8.5.2.2. Colombia
- 8.5.2.3. Chile
- 8.5.2.4. Argentina
- 8.5.2.5. Costa Rica
- 8.5.2.6. Rest of Latin America
- 9. Middle East & Africa Reverse Vending Machines Market Analysis, Opportunity, and Forecast, 2016-2032
- 9.1. Middle East & Africa Reverse Vending Machines Market Analysis, 2016-2021
- 9.2. Middle East & Africa Reverse Vending Machines Market Opportunity and Forecast, 2023-2032
- 9.3. Middle East & Africa Reverse Vending Machines Market Analysis, Opportunity and Forecast, By By Product Type, 2016-2032
- 9.3.1. Middle East & Africa Reverse Vending Machines Market Analysis by By Product Type: Introduction
- 9.3.2. Market Size Absolute $ Opportunity Analysis and Forecast, By By Product Type, 2016-2032
- 9.3.3. Refillable Type
- 9.3.4. Non-Refillable Type
- 9.3.5. Multifunction Type
- 9.4. Middle East & Africa Reverse Vending Machines Market Analysis, Opportunity and Forecast, By By Application, 2016-2032
- 9.4.1. Middle East & Africa Reverse Vending Machines Market Analysis by By Application: Introduction
- 9.4.2. Market Size Absolute $ Opportunity Analysis and Forecast, By By Application, 2016-2032
- 9.4.3. Supermarkets
- 9.4.4. Community
- 9.4.5. Utilities
- 9.5. Middle East & Africa Reverse Vending Machines Market Analysis, Opportunity and Forecast, By Country, 2016-2032
- 9.5.1. Middle East & Africa Reverse Vending Machines Market Analysis by Country: Introduction
- 9.5.2. Market Size Absolute $ Opportunity Analysis and Forecast, Country, 2016-2032
- 9.5.2.1. Algeria
- 9.5.2.2. Egypt
- 9.5.2.3. Israel
- 9.5.2.4. Kuwait
- 9.5.2.5. Nigeria
- 9.5.2.6. Saudi Arabia
- 9.5.2.7. South Africa
- 9.5.2.8. Turkey
- 9.5.2.9. The UAE
- 9.5.2.10. Rest of MEA
- 10. Global Reverse Vending Machines Market Analysis, Opportunity and Forecast, By Region, 2016-2032
- 10.1. Global Reverse Vending Machines Market Analysis by Region: Introduction
- 10.2. Market Size Absolute $ Opportunity Analysis and Forecast, By Region, 2016-2032
- 10.2.1. North America
- 10.2.2. Western Europe
- 10.2.3. Eastern Europe
- 10.2.4. APAC
- 10.2.5. Latin America
- 10.2.6. Middle East & Africa
- 11. Global Reverse Vending Machines Market Competitive Landscape, Market Share Analysis, and Company Profiles
- 11.1. Market Share Analysis
- 11.2. Company Profiles
- 11.3. Diebold Nixdorf
- 11.3.1. Company Overview
- 11.3.2. Financial Highlights
- 11.3.3. Product Portfolio
- 11.3.4. SWOT Analysis
- 11.3.5. Key Strategies and Developments
- 11.4. Tomra Systems ASA
- 11.4.1. Company Overview
- 11.4.2. Financial Highlights
- 11.4.3. Product Portfolio
- 11.4.4. SWOT Analysis
- 11.4.5. Key Strategies and Developments
- 11.5. Teraoka Seiko Co. Ltd. (TERAOKA (DIGI) Group)
- 11.5.1. Company Overview
- 11.5.2. Financial Highlights
- 11.5.3. Product Portfolio
- 11.5.4. SWOT Analysis
- 11.5.5. Key Strategies and Developments
- 11.6. Envipco Holding N.V.
- 11.6.1. Company Overview
- 11.6.2. Financial Highlights
- 11.6.3. Product Portfolio
- 11.6.4. SWOT Analysis
- 11.6.5. Key Strategies and Developments
- 11.7. Rvm Systems AB
- 11.7.1. Company Overview
- 11.7.2. Financial Highlights
- 11.7.3. Product Portfolio
- 11.7.4. SWOT Analysis
- 11.7.5. Key Strategies and Developments
- 11.8. Trautwein SB-Technik GmbH
- 11.8.1. Company Overview
- 11.8.2. Financial Highlights
- 11.8.3. Product Portfolio
- 11.8.4. SWOT Analysis
- 11.8.5. Key Strategies and Developments
- 11.9. Kansmacker Manufacturing
- 11.9.1. Company Overview
- 11.9.2. Financial Highlights
- 11.9.3. Product Portfolio
- 11.9.4. SWOT Analysis
- 11.9.5. Key Strategies and Developments
- 11.10. Incom Tomra Recycling Technology (Beijing) Co. Ltd.
- 11.10.1. Company Overview
- 11.10.2. Financial Highlights
- 11.10.3. Product Portfolio
- 11.10.4. SWOT Analysis
- 11.10.5. Key Strategies and Developments
- 11.11. Aco Recycling
- 11.11.1. Company Overview
- 11.11.2. Financial Highlights
- 11.11.3. Product Portfolio
- 11.11.4. SWOT Analysis
- 11.11.5. Key Strategies and Developments
- 11.12. Unisan UK
- 11.12.1. Company Overview
- 11.12.2. Financial Highlights
- 11.12.3. Product Portfolio
- 11.12.4. SWOT Analysis
- 11.12.5. Key Strategies and Developments
- 11.13. EREZ Thermoplastic Products
- 11.13.1. Company Overview
- 11.13.2. Financial Highlights
- 11.13.3. Product Portfolio
- 11.13.4. SWOT Analysis
- 11.13.5. Key Strategies and Developments
- 11.14. Hangzhou Chinastars Reflective Material Co.
- 11.14.1. Company Overview
- 11.14.2. Financial Highlights
- 11.14.3. Product Portfolio
- 11.14.4. SWOT Analysis
- 11.14.5. Key Strategies and Developments
- 12. Assumptions and Acronyms
- 13. Research Methodology
- 14. Contact
- Figure 1: Global Reverse Vending Machines Market Revenue (US Mn) Market Share by By Product Type in 2022
- Figure 2: Global Reverse Vending Machines Market Attractiveness Analysis by By Product Type, 2016-2032
- Figure 3: Global Reverse Vending Machines Market Revenue (US$ Mn) Market Share by By Applications 2022
- Figure 4: Global Reverse Vending Machines Market Attractiveness Analysis by By Application, 2016-2032
- Figure 5: Global Reverse Vending Machines Market Revenue (US$ Mn) Market Share by Region in 2022
- Figure 6: Global Reverse Vending Machines Market Attractiveness Analysis by Region, 2016-2032
- Figure 7: Global Reverse Vending Machines Market Revenue (US$ Mn) (2016-2032)
- Figure 8: Global Reverse Vending Machines Market Revenue (US$ Mn) Comparison by Region (2016-2032)
- Figure 9: Global Reverse Vending Machines Market Revenue (US$ Mn) Comparison by By Product Type (2016-2032)
- Figure 10: Global Reverse Vending Machines Market Revenue (US$ Mn) Comparison by By Application (2016-2032)
- Figure 11: Global Reverse Vending Machines Market Y-o-Y Growth Rate Comparison by Region (2016-2032)
- Figure 12: Global Reverse Vending Machines Market Y-o-Y Growth Rate Comparison by By Product Type (2016-2032)
- Figure 13: Global Reverse Vending Machines Market Y-o-Y Growth Rate Comparison by By Application (2016-2032)
- Figure 14: Global Reverse Vending Machines Market Share Comparison by Region (2016-2032)
- Figure 15: Global Reverse Vending Machines Market Share Comparison by By Product Type (2016-2032)
- Figure 16: Global Reverse Vending Machines Market Share Comparison by By Application (2016-2032)
- Figure 17: North America Reverse Vending Machines Market Revenue (US$ Mn) Market Share by By Product Type 2022
- Figure 18: North America Reverse Vending Machines Market Attractiveness Analysis by By Product Type, 2016-2032
- Figure 19: North America Reverse Vending Machines Market Revenue (US$ Mn) Market Share by By Applications 2022
- Figure 20: North America Reverse Vending Machines Market Attractiveness Analysis by By Application, 2016-2032
- Figure 21: North America Reverse Vending Machines Market Revenue (US$ Mn) Market Share by Country in 2022
- Figure 22: North America Reverse Vending Machines Market Attractiveness Analysis by Country, 2016-2032
- Figure 23: North America Reverse Vending Machines Market Revenue (US$ Mn) (2016-2032)
- Figure 24: North America Reverse Vending Machines Market Revenue (US$ Mn) Comparison by Country (2016-2032)
- Figure 25: North America Reverse Vending Machines Market Revenue (US$ Mn) Comparison by By Product Type (2016-2032)
- Figure 26: North America Reverse Vending Machines Market Revenue (US$ Mn) Comparison by By Application (2016-2032)
- Figure 27: North America Reverse Vending Machines Market Y-o-Y Growth Rate Comparison by Country (2016-2032)
- Figure 28: North America Reverse Vending Machines Market Y-o-Y Growth Rate Comparison by By Product Type (2016-2032)
- Figure 29: North America Reverse Vending Machines Market Y-o-Y Growth Rate Comparison by By Application (2016-2032)
- Figure 30: North America Reverse Vending Machines Market Share Comparison by Country (2016-2032)
- Figure 31: North America Reverse Vending Machines Market Share Comparison by By Product Type (2016-2032)
- Figure 32: North America Reverse Vending Machines Market Share Comparison by By Application (2016-2032)
- Figure 33: Western Europe Reverse Vending Machines Market Revenue (US$ Mn) Market Share by By Product Type 2022
- Figure 34: Western Europe Reverse Vending Machines Market Attractiveness Analysis by By Product Type, 2016-2032
- Figure 35: Western Europe Reverse Vending Machines Market Revenue (US$ Mn) Market Share by By Applications 2022
- Figure 36: Western Europe Reverse Vending Machines Market Attractiveness Analysis by By Application, 2016-2032
- Figure 37: Western Europe Reverse Vending Machines Market Revenue (US$ Mn) Market Share by Country in 2022
- Figure 38: Western Europe Reverse Vending Machines Market Attractiveness Analysis by Country, 2016-2032
- Figure 39: Western Europe Reverse Vending Machines Market Revenue (US$ Mn) (2016-2032)
- Figure 40: Western Europe Reverse Vending Machines Market Revenue (US$ Mn) Comparison by Country (2016-2032)
- Figure 41: Western Europe Reverse Vending Machines Market Revenue (US$ Mn) Comparison by By Product Type (2016-2032)
- Figure 42: Western Europe Reverse Vending Machines Market Revenue (US$ Mn) Comparison by By Application (2016-2032)
- Figure 43: Western Europe Reverse Vending Machines Market Y-o-Y Growth Rate Comparison by Country (2016-2032)
- Figure 44: Western Europe Reverse Vending Machines Market Y-o-Y Growth Rate Comparison by By Product Type (2016-2032)
- Figure 45: Western Europe Reverse Vending Machines Market Y-o-Y Growth Rate Comparison by By Application (2016-2032)
- Figure 46: Western Europe Reverse Vending Machines Market Share Comparison by Country (2016-2032)
- Figure 47: Western Europe Reverse Vending Machines Market Share Comparison by By Product Type (2016-2032)
- Figure 48: Western Europe Reverse Vending Machines Market Share Comparison by By Application (2016-2032)
- Figure 49: Eastern Europe Reverse Vending Machines Market Revenue (US$ Mn) Market Share by By Product Typein 2022
- Figure 50: Eastern Europe Reverse Vending Machines Market Attractiveness Analysis by By Product Type, 2016-2032
- Figure 51: Eastern Europe Reverse Vending Machines Market Revenue (US$ Mn) Market Share by By Applicationin 2022
- Figure 52: Eastern Europe Reverse Vending Machines Market Attractiveness Analysis by By Application, 2016-2032
- Figure 53: Eastern Europe Reverse Vending Machines Market Revenue (US$ Mn) Market Share by Country in 2022
- Figure 54: Eastern Europe Reverse Vending Machines Market Attractiveness Analysis by Country, 2016-2032
- Figure 55: Eastern Europe Reverse Vending Machines Market Revenue (US$ Mn) (2016-2032)
- Figure 56: Eastern Europe Reverse Vending Machines Market Revenue (US$ Mn) Comparison by Country (2016-2032)
- Figure 57: Eastern Europe Reverse Vending Machines Market Revenue (US$ Mn) Comparison by By Product Type (2016-2032)
- Figure 58: Eastern Europe Reverse Vending Machines Market Revenue (US$ Mn) Comparison by By Application (2016-2032)
- Figure 59: Eastern Europe Reverse Vending Machines Market Y-o-Y Growth Rate Comparison by Country (2016-2032)
- Figure 60: Eastern Europe Reverse Vending Machines Market Y-o-Y Growth Rate Comparison by By Product Type (2016-2032)
- Figure 61: Eastern Europe Reverse Vending Machines Market Y-o-Y Growth Rate Comparison by By Application (2016-2032)
- Figure 62: Eastern Europe Reverse Vending Machines Market Share Comparison by Country (2016-2032)
- Figure 63: Eastern Europe Reverse Vending Machines Market Share Comparison by By Product Type (2016-2032)
- Figure 64: Eastern Europe Reverse Vending Machines Market Share Comparison by By Application (2016-2032)
- Figure 65: APAC Reverse Vending Machines Market Revenue (US$ Mn) Market Share by By Product Type 2022
- Figure 66: APAC Reverse Vending Machines Market Attractiveness Analysis by By Product Type, 2016-2032
- Figure 67: APAC Reverse Vending Machines Market Revenue (US$ Mn) Market Share by By Applications 2022
- Figure 68: APAC Reverse Vending Machines Market Attractiveness Analysis by By Application, 2016-2032
- Figure 69: APAC Reverse Vending Machines Market Revenue (US$ Mn) Market Share by Country in 2022
- Figure 70: APAC Reverse Vending Machines Market Attractiveness Analysis by Country, 2016-2032
- Figure 71: APAC Reverse Vending Machines Market Revenue (US$ Mn) (2016-2032)
- Figure 72: APAC Reverse Vending Machines Market Revenue (US$ Mn) Comparison by Country (2016-2032)
- Figure 73: APAC Reverse Vending Machines Market Revenue (US$ Mn) Comparison by By Product Type (2016-2032)
- Figure 74: APAC Reverse Vending Machines Market Revenue (US$ Mn) Comparison by By Application (2016-2032)
- Figure 75: APAC Reverse Vending Machines Market Y-o-Y Growth Rate Comparison by Country (2016-2032)
- Figure 76: APAC Reverse Vending Machines Market Y-o-Y Growth Rate Comparison by By Product Type (2016-2032)
- Figure 77: APAC Reverse Vending Machines Market Y-o-Y Growth Rate Comparison by By Application (2016-2032)
- Figure 78: APAC Reverse Vending Machines Market Share Comparison by Country (2016-2032)
- Figure 79: APAC Reverse Vending Machines Market Share Comparison by By Product Type (2016-2032)
- Figure 80: APAC Reverse Vending Machines Market Share Comparison by By Application (2016-2032)
- Figure 81: Latin America Reverse Vending Machines Market Revenue (US$ Mn) Market Share by By Product Typein 2022
- Figure 82: Latin America Reverse Vending Machines Market Attractiveness Analysis by By Product Type, 2016-2032
- Figure 83: Latin America Reverse Vending Machines Market Revenue (US$ Mn) Market Share by By Applicationin 2022
- Figure 84: Latin America Reverse Vending Machines Market Attractiveness Analysis by By Application, 2016-2032
- Figure 85: Latin America Reverse Vending Machines Market Revenue (US$ Mn) Market Share by Country in 2022
- Figure 86: Latin America Reverse Vending Machines Market Attractiveness Analysis by Country, 2016-2032
- Figure 87: Latin America Reverse Vending Machines Market Revenue (US$ Mn) (2016-2032)
- Figure 88: Latin America Reverse Vending Machines Market Revenue (US$ Mn) Comparison by Country (2016-2032)
- Figure 89: Latin America Reverse Vending Machines Market Revenue (US$ Mn) Comparison by By Product Type (2016-2032)
- Figure 90: Latin America Reverse Vending Machines Market Revenue (US$ Mn) Comparison by By Application (2016-2032)
- Figure 91: Latin America Reverse Vending Machines Market Y-o-Y Growth Rate Comparison by Country (2016-2032)
- Figure 92: Latin America Reverse Vending Machines Market Y-o-Y Growth Rate Comparison by By Product Type (2016-2032)
- Figure 93: Latin America Reverse Vending Machines Market Y-o-Y Growth Rate Comparison by By Application (2016-2032)
- Figure 94: Latin America Reverse Vending Machines Market Share Comparison by Country (2016-2032)
- Figure 95: Latin America Reverse Vending Machines Market Share Comparison by By Product Type (2016-2032)
- Figure 96: Latin America Reverse Vending Machines Market Share Comparison by By Application (2016-2032)
- Figure 97: Middle East & Africa Reverse Vending Machines Market Revenue (US$ Mn) Market Share by By Product Typein 2022
- Figure 98: Middle East & Africa Reverse Vending Machines Market Attractiveness Analysis by By Product Type, 2016-2032
- Figure 99: Middle East & Africa Reverse Vending Machines Market Revenue (US$ Mn) Market Share by By Applicationin 2022
- Figure 100: Middle East & Africa Reverse Vending Machines Market Attractiveness Analysis by By Application, 2016-2032
- Figure 101: Middle East & Africa Reverse Vending Machines Market Revenue (US$ Mn) Market Share by Country in 2022
- Figure 102: Middle East & Africa Reverse Vending Machines Market Attractiveness Analysis by Country, 2016-2032
- Figure 103: Middle East & Africa Reverse Vending Machines Market Revenue (US$ Mn) (2016-2032)
- Figure 104: Middle East & Africa Reverse Vending Machines Market Revenue (US$ Mn) Comparison by Country (2016-2032)
- Figure 105: Middle East & Africa Reverse Vending Machines Market Revenue (US$ Mn) Comparison by By Product Type (2016-2032)
- Figure 106: Middle East & Africa Reverse Vending Machines Market Revenue (US$ Mn) Comparison by By Application (2016-2032)
- Figure 107: Middle East & Africa Reverse Vending Machines Market Y-o-Y Growth Rate Comparison by Country (2016-2032)
- Figure 108: Middle East & Africa Reverse Vending Machines Market Y-o-Y Growth Rate Comparison by By Product Type (2016-2032)
- Figure 109: Middle East & Africa Reverse Vending Machines Market Y-o-Y Growth Rate Comparison by By Application (2016-2032)
- Figure 110: Middle East & Africa Reverse Vending Machines Market Share Comparison by Country (2016-2032)
- Figure 111: Middle East & Africa Reverse Vending Machines Market Share Comparison by By Product Type (2016-2032)
- Figure 112: Middle East & Africa Reverse Vending Machines Market Share Comparison by By Application (2016-2032)
- Table 1: Global Reverse Vending Machines Market Comparison by By Product Type (2016-2032)
- Table 2: Global Reverse Vending Machines Market Comparison by By Application (2016-2032)
- Table 3: Global Reverse Vending Machines Market Revenue (US$ Mn) Comparison by Region (2016-2032)
- Table 4: Global Reverse Vending Machines Market Revenue (US$ Mn) (2016-2032)
- Table 5: Global Reverse Vending Machines Market Revenue (US$ Mn) Comparison by Region (2016-2032)
- Table 6: Global Reverse Vending Machines Market Revenue (US$ Mn) Comparison by By Product Type (2016-2032)
- Table 7: Global Reverse Vending Machines Market Revenue (US$ Mn) Comparison by By Application (2016-2032)
- Table 8: Global Reverse Vending Machines Market Y-o-Y Growth Rate Comparison by Region (2016-2032)
- Table 9: Global Reverse Vending Machines Market Y-o-Y Growth Rate Comparison by By Product Type (2016-2032)
- Table 10: Global Reverse Vending Machines Market Y-o-Y Growth Rate Comparison by By Application (2016-2032)
- Table 11: Global Reverse Vending Machines Market Share Comparison by Region (2016-2032)
- Table 12: Global Reverse Vending Machines Market Share Comparison by By Product Type (2016-2032)
- Table 13: Global Reverse Vending Machines Market Share Comparison by By Application (2016-2032)
- Table 14: North America Reverse Vending Machines Market Comparison by By Application (2016-2032)
- Table 15: North America Reverse Vending Machines Market Revenue (US$ Mn) Comparison by Country (2016-2032)
- Table 16: North America Reverse Vending Machines Market Revenue (US$ Mn) (2016-2032)
- Table 17: North America Reverse Vending Machines Market Revenue (US$ Mn) Comparison by Country (2016-2032)
- Table 18: North America Reverse Vending Machines Market Revenue (US$ Mn) Comparison by By Product Type (2016-2032)
- Table 19: North America Reverse Vending Machines Market Revenue (US$ Mn) Comparison by By Application (2016-2032)
- Table 20: North America Reverse Vending Machines Market Y-o-Y Growth Rate Comparison by Country (2016-2032)
- Table 21: North America Reverse Vending Machines Market Y-o-Y Growth Rate Comparison by By Product Type (2016-2032)
- Table 22: North America Reverse Vending Machines Market Y-o-Y Growth Rate Comparison by By Application (2016-2032)
- Table 23: North America Reverse Vending Machines Market Share Comparison by Country (2016-2032)
- Table 24: North America Reverse Vending Machines Market Share Comparison by By Product Type (2016-2032)
- Table 25: North America Reverse Vending Machines Market Share Comparison by By Application (2016-2032)
- Table 26: Western Europe Reverse Vending Machines Market Comparison by By Product Type (2016-2032)
- Table 27: Western Europe Reverse Vending Machines Market Comparison by By Application (2016-2032)
- Table 28: Western Europe Reverse Vending Machines Market Revenue (US$ Mn) Comparison by Country (2016-2032)
- Table 29: Western Europe Reverse Vending Machines Market Revenue (US$ Mn) (2016-2032)
- Table 30: Western Europe Reverse Vending Machines Market Revenue (US$ Mn) Comparison by Country (2016-2032)
- Table 31: Western Europe Reverse Vending Machines Market Revenue (US$ Mn) Comparison by By Product Type (2016-2032)
- Table 32: Western Europe Reverse Vending Machines Market Revenue (US$ Mn) Comparison by By Application (2016-2032)
- Table 33: Western Europe Reverse Vending Machines Market Y-o-Y Growth Rate Comparison by Country (2016-2032)
- Table 34: Western Europe Reverse Vending Machines Market Y-o-Y Growth Rate Comparison by By Product Type (2016-2032)
- Table 35: Western Europe Reverse Vending Machines Market Y-o-Y Growth Rate Comparison by By Application (2016-2032)
- Table 36: Western Europe Reverse Vending Machines Market Share Comparison by Country (2016-2032)
- Table 37: Western Europe Reverse Vending Machines Market Share Comparison by By Product Type (2016-2032)
- Table 38: Western Europe Reverse Vending Machines Market Share Comparison by By Application (2016-2032)
- Table 39: Eastern Europe Reverse Vending Machines Market Comparison by By Product Type (2016-2032)
- Table 40: Eastern Europe Reverse Vending Machines Market Comparison by By Application (2016-2032)
- Table 41: Eastern Europe Reverse Vending Machines Market Revenue (US$ Mn) Comparison by Country (2016-2032)
- Table 42: Eastern Europe Reverse Vending Machines Market Revenue (US$ Mn) (2016-2032)
- Table 43: Eastern Europe Reverse Vending Machines Market Revenue (US$ Mn) Comparison by Country (2016-2032)
- Table 44: Eastern Europe Reverse Vending Machines Market Revenue (US$ Mn) Comparison by By Product Type (2016-2032)
- Table 45: Eastern Europe Reverse Vending Machines Market Revenue (US$ Mn) Comparison by By Application (2016-2032)
- Table 46: Eastern Europe Reverse Vending Machines Market Y-o-Y Growth Rate Comparison by Country (2016-2032)
- Table 47: Eastern Europe Reverse Vending Machines Market Y-o-Y Growth Rate Comparison by By Product Type (2016-2032)
- Table 48: Eastern Europe Reverse Vending Machines Market Y-o-Y Growth Rate Comparison by By Application (2016-2032)
- Table 49: Eastern Europe Reverse Vending Machines Market Share Comparison by Country (2016-2032)
- Table 50: Eastern Europe Reverse Vending Machines Market Share Comparison by By Product Type (2016-2032)
- Table 51: Eastern Europe Reverse Vending Machines Market Share Comparison by By Application (2016-2032)
- Table 52: APAC Reverse Vending Machines Market Comparison by By Product Type (2016-2032)
- Table 53: APAC Reverse Vending Machines Market Comparison by By Application (2016-2032)
- Table 54: APAC Reverse Vending Machines Market Revenue (US$ Mn) Comparison by Country (2016-2032)
- Table 55: APAC Reverse Vending Machines Market Revenue (US$ Mn) (2016-2032)
- Table 56: APAC Reverse Vending Machines Market Revenue (US$ Mn) Comparison by Country (2016-2032)
- Table 57: APAC Reverse Vending Machines Market Revenue (US$ Mn) Comparison by By Product Type (2016-2032)
- Table 58: APAC Reverse Vending Machines Market Revenue (US$ Mn) Comparison by By Application (2016-2032)
- Table 59: APAC Reverse Vending Machines Market Y-o-Y Growth Rate Comparison by Country (2016-2032)
- Table 60: APAC Reverse Vending Machines Market Y-o-Y Growth Rate Comparison by By Product Type (2016-2032)
- Table 61: APAC Reverse Vending Machines Market Y-o-Y Growth Rate Comparison by By Application (2016-2032)
- Table 62: APAC Reverse Vending Machines Market Share Comparison by Country (2016-2032)
- Table 63: APAC Reverse Vending Machines Market Share Comparison by By Product Type (2016-2032)
- Table 64: APAC Reverse Vending Machines Market Share Comparison by By Application (2016-2032)
- Table 65: Latin America Reverse Vending Machines Market Comparison by By Product Type (2016-2032)
- Table 66: Latin America Reverse Vending Machines Market Comparison by By Application (2016-2032)
- Table 67: Latin America Reverse Vending Machines Market Revenue (US$ Mn) Comparison by Country (2016-2032)
- Table 68: Latin America Reverse Vending Machines Market Revenue (US$ Mn) (2016-2032)
- Table 69: Latin America Reverse Vending Machines Market Revenue (US$ Mn) Comparison by Country (2016-2032)
- Table 70: Latin America Reverse Vending Machines Market Revenue (US$ Mn) Comparison by By Product Type (2016-2032)
- Table 71: Latin America Reverse Vending Machines Market Revenue (US$ Mn) Comparison by By Application (2016-2032)
- Table 72: Latin America Reverse Vending Machines Market Y-o-Y Growth Rate Comparison by Country (2016-2032)
- Table 73: Latin America Reverse Vending Machines Market Y-o-Y Growth Rate Comparison by By Product Type (2016-2032)
- Table 74: Latin America Reverse Vending Machines Market Y-o-Y Growth Rate Comparison by By Application (2016-2032)
- Table 75: Latin America Reverse Vending Machines Market Share Comparison by Country (2016-2032)
- Table 76: Latin America Reverse Vending Machines Market Share Comparison by By Product Type (2016-2032)
- Table 77: Latin America Reverse Vending Machines Market Share Comparison by By Application (2016-2032)
- Table 78: Middle East & Africa Reverse Vending Machines Market Comparison by By Product Type (2016-2032)
- Table 79: Middle East & Africa Reverse Vending Machines Market Comparison by By Application (2016-2032)
- Table 80: Middle East & Africa Reverse Vending Machines Market Revenue (US$ Mn) Comparison by Country (2016-2032)
- Table 81: Middle East & Africa Reverse Vending Machines Market Revenue (US$ Mn) (2016-2032)
- Table 82: Middle East & Africa Reverse Vending Machines Market Revenue (US$ Mn) Comparison by Country (2016-2032)
- Table 83: Middle East & Africa Reverse Vending Machines Market Revenue (US$ Mn) Comparison by By Product Type (2016-2032)
- Table 84: Middle East & Africa Reverse Vending Machines Market Revenue (US$ Mn) Comparison by By Application (2016-2032)
- Table 85: Middle East & Africa Reverse Vending Machines Market Y-o-Y Growth Rate Comparison by Country (2016-2032)
- Table 86: Middle East & Africa Reverse Vending Machines Market Y-o-Y Growth Rate Comparison by By Product Type (2016-2032)
- Table 87: Middle East & Africa Reverse Vending Machines Market Y-o-Y Growth Rate Comparison by By Application (2016-2032)
- Table 88: Middle East & Africa Reverse Vending Machines Market Share Comparison by Country (2016-2032)
- Table 89: Middle East & Africa Reverse Vending Machines Market Share Comparison by By Product Type (2016-2032)
- Table 90: Middle East & Africa Reverse Vending Machines Market Share Comparison by By Application (2016-2032)
- 1. Executive Summary
Inquiry Form
Why Choose Us
- 360 Degree Approach
- Growth Consulting
- 24/7 Research Support
- Comprehensive-Level of Customization
- Competitive Intelligence
- Single-Country/ Region Intelligence
- Post-Sale Service Assistance
- Access to Lead Analysts
- Available in PDF, Excel, Word/ PPT
Request for Customization
OUR CLIENTS
Don't just take our word. We are trusted by these great companies!