Reusable Water Bottles Market By Material (Plastic, Glass, Stainless Steel, Aluminium, Others), By Distribution Channel (Supermarket/hypermarket, Departmental Store, Online Store, Others), By Region And Companies - Industry Segment Outlook, Market Assessment, Competition Scenario, Trends, And Forecast 2024-2033
-
50500
-
August 2024
-
300
-


-
This report was compiled by Research Team Research team of over 50 passionate professionals leverages advanced research methodologies and analytical expertise to deliver insightful, data-driven market intelligence that empowers businesses across diverse industries to make strategic, well-informed Correspondence Research Team Linkedin | Detailed Market research Methodology Our methodology involves a mix of primary research, including interviews with leading mental health experts, and secondary research from reputable medical journals and databases. View Detailed Methodology Page
-
Quick Navigation
Report Overview
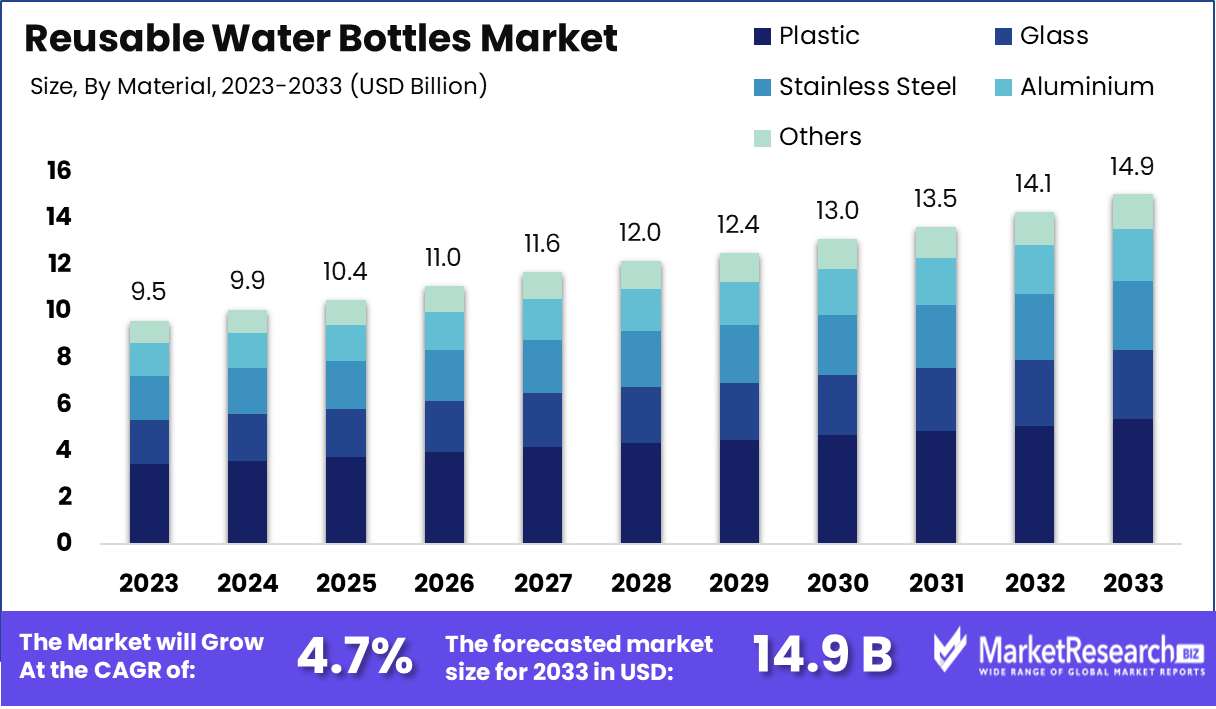
The Reusable Water Bottles Market was valued at USD 9.5 billion in 2023. It is expected to reach USD 14.9 billion by 2033, with a CAGR of 4.7% during the forecast period from 2024 to 2033.
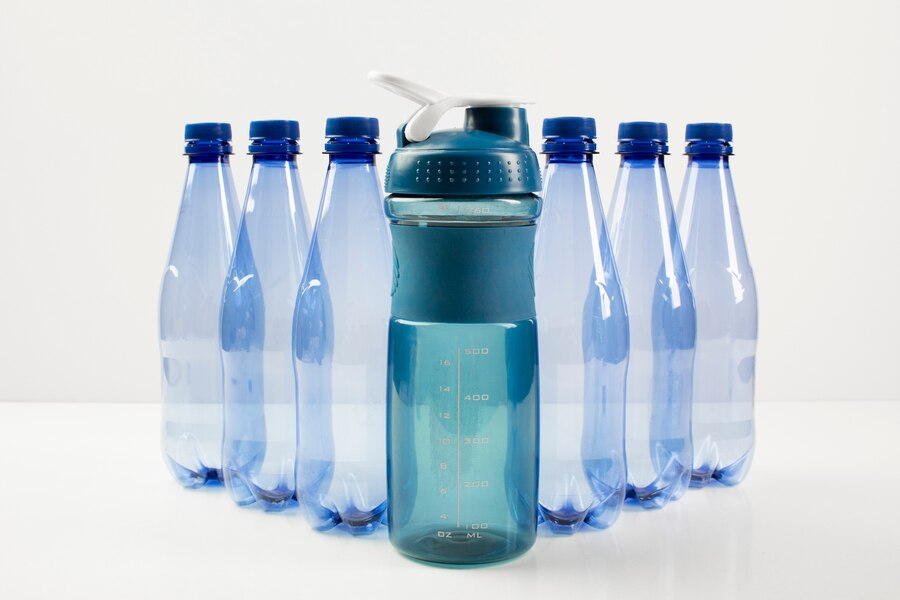
The Reusable Water Bottles Market is experiencing significant growth as sustainability and health-conscious trends drive consumer behavior. These bottles, made from durable materials like stainless steel, glass, and BPA-free plastics, offer an eco-friendly alternative to single-use plastics. The market is characterized by increasing adoption across various demographics, driven by environmental regulations and a growing awareness of the environmental impact of disposable bottles.
The Reusable Water Bottles Market is experiencing robust growth, driven primarily by rising environmental awareness and increasing health consciousness among consumers. The shift towards sustainable living has intensified as individuals become more mindful of their environmental footprint. This awareness is further supported by the alarming statistics surrounding plastic waste, which has propelled the adoption of reusable alternatives. As consumers prioritize eco-friendly choices, reusable water bottles are not only seen as a means of reducing plastic waste but also as a health-conscious decision, enabling better hydration habits. The market's growth is also bolstered by innovations in design and material, making these bottles more appealing to a broader demographic, including the younger, eco-conscious generation.
However, the market is also facing challenges, particularly in terms of market saturation. As the reusable water bottle market becomes more crowded, differentiation becomes increasingly crucial for brands to maintain a competitive edge. While the sustainability trend remains a powerful driver, companies must innovate continuously, either through product enhancements or by aligning their brand with broader environmental initiatives. This need for differentiation highlights the importance of branding and innovation in sustaining growth within the market. As consumers become more discerning, the emphasis on sustainability must evolve beyond the product itself to encompass the entire value chain, ensuring long-term market viability amidst growing competition.
Key Takeaways
- Market Growth: The Reusable Water Bottles Market was valued at USD 9.5 billion in 2023. It is expected to reach USD 14.9 billion by 2033, with a CAGR of 4.7% during the forecast period from 2024 to 2033.
- By Material: Plastic dominated reusable water bottles due to affordability and durability.
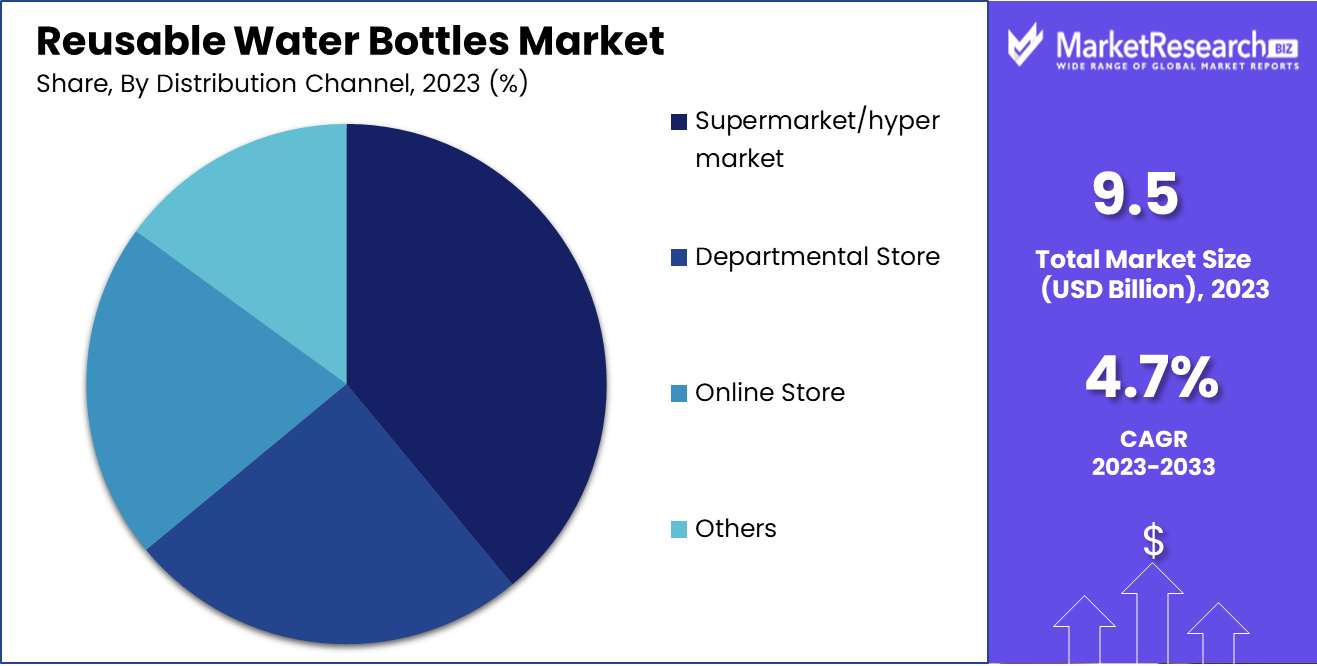
- By Distribution Channel: Supermarkets/hypermarkets dominated reusable water bottle distribution, driven by convenience.
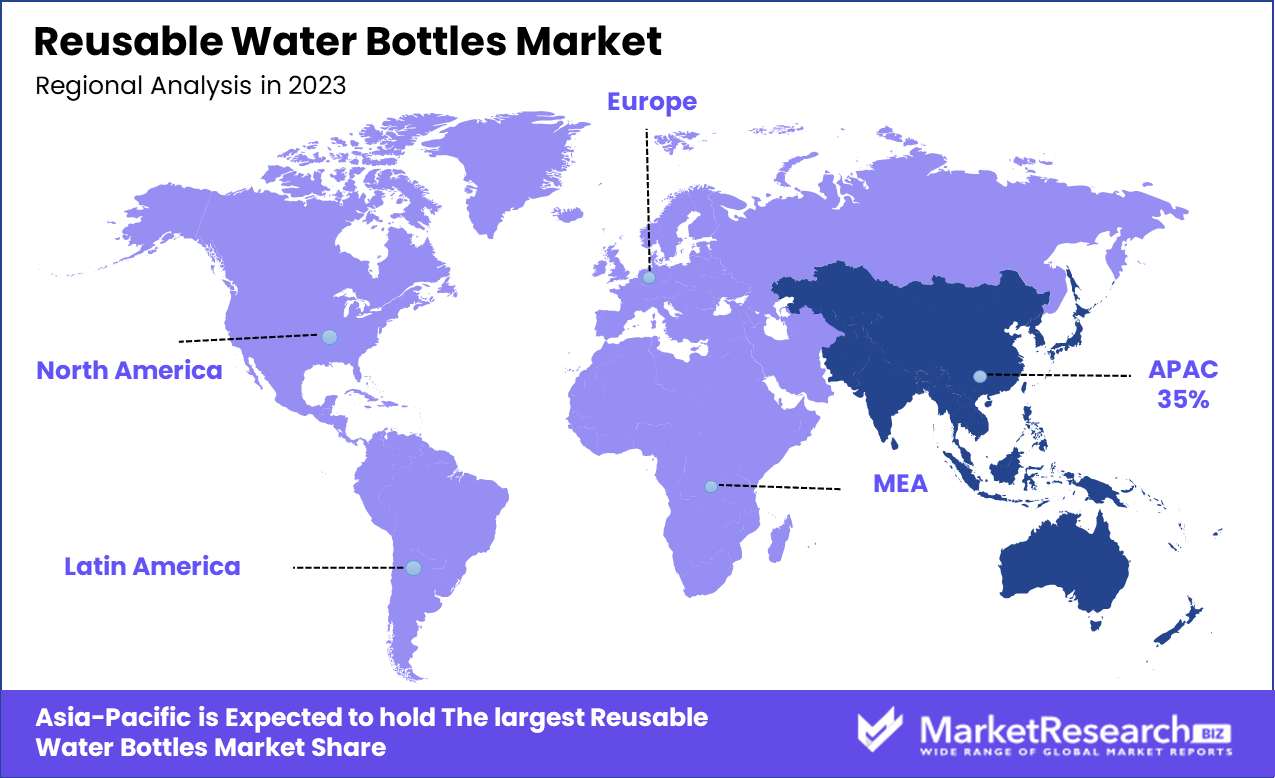
- Regional Dominance: Asia Pacific dominates the Reusable Water Bottles Market with a 45% largest share.
- Growth Opportunity: The reusable water bottles market will thrive on sustainability and personalization trends, driving growth and market expansion.
Driving factors
Environmental Awareness Drives the Shift Toward Reusable Water Bottles
The rising global awareness of environmental issues is a key driver in the growth of the reusable water bottles market. As consumers become more informed about the detrimental effects of single-use plastics on the environment, there has been a marked shift towards sustainable alternatives. This shift is further supported by governmental regulations and campaigns aimed at reducing plastic waste.
According to a recent study, the global plastic waste crisis is projected to escalate, with plastic production expected to double by 2040 if current trends continue. This has led to a significant increase in demand for reusable water bottles, as consumers seek to reduce their plastic footprint. The growing concern for environmental preservation is not only influencing individual purchasing decisions but is also prompting companies to innovate and offer eco-friendly products, further boosting market growth.
Health Consciousness Fuels Demand for Safe and Clean Hydration Solutions
Health consciousness among consumers is another critical factor driving the reusable water bottles market. As people become more aware of the importance of hydration in maintaining overall health, there is a growing preference for safe, non-toxic, and convenient hydration solutions. Reusable water bottles, often made from materials like stainless steel, glass, and BPA-free plastics, are perceived as healthier alternatives to single-use bottles that may contain harmful chemicals.
Moreover, the increasing focus on fitness and active lifestyles has further accelerated the demand for reusable water bottles, as they are essential accessories for sports and outdoor activities. Statistics indicate that the global wellness industry, valued at over $4.5 trillion, is influencing consumer behavior, leading to a surge in the adoption of products that promote health and well-being, including reusable water bottles.
Rising Demand for Sustainable Products Boosts Market Growth
The demand for sustainable products is a major trend propelling the growth of the reusable water bottles market. Consumers are increasingly prioritizing products that align with their values of sustainability and social responsibility. This shift is evident in the growing market share of reusable water bottles, which are seen as an eco-friendly and economically viable alternative to disposable bottles. Companies are responding to this demand by offering a wide range of innovative, sustainable water bottles, often emphasizing their durability, reusability, and minimal environmental impact.
According to market research, the global sustainable products market is expected to grow at a CAGR of 7.5% from 2021 to 2027, reflecting the increasing consumer preference for products that contribute to a sustainable future. This trend is significantly driving the adoption of reusable water bottles, as consumers seek to reduce their environmental impact while supporting brands that prioritize sustainability.
Restraining Factors
Fluctuating Consumer Preferences: A Double-Edged Sword in the Reusable Water Bottles Market
Fluctuating consumer preferences represent a significant restraining factor in the growth of the reusable water bottles market. While there has been a growing trend towards eco-friendly and sustainable products, consumer preferences can shift rapidly due to factors such as changes in lifestyle, emerging trends, and new product innovations. For instance, the introduction of new types of beverages, packaging innovations in single-use bottles, or even the perception of convenience can sway consumers away from reusable options. This unpredictability makes it challenging for manufacturers to maintain consistent demand, leading to potential overproduction or inventory issues.
Consequently, companies must continuously adapt their product offerings and marketing strategies to align with the evolving tastes of consumers, which can strain resources and affect profitability.
Competition and Pricing Pressures: Challenging Market Dynamics for Reusable Water Bottle Manufacturers
The reusable water bottles market is also heavily influenced by competition and pricing pressures, which serve as a significant restraining factor. The market is saturated with numerous brands offering similar products, leading to intense competition. As companies vie for market share, pricing becomes a critical lever, often leading to aggressive price cuts and discounts. This price competition can erode profit margins, especially for smaller players who may not have the economies of scale enjoyed by larger competitors.
Moreover, the presence of counterfeit and low-quality products further exacerbates pricing pressures, as consumers may opt for cheaper alternatives, undermining the market for high-quality reusable bottles. As a result, manufacturers must strike a delicate balance between pricing their products competitively and maintaining the quality and brand reputation necessary to attract discerning consumers.
By Material Analysis
In 2023, Plastic dominated reusable water bottles due to affordability and durability.
In 2023, Plastic held a dominant market position in the By Material segment of the Reusable Water Bottles Market, accounting for a significant share. Plastic bottles are widely favored due to their lightweight nature, affordability, and durability. Their versatility in design and ease of mass production also contribute to their popularity.
Glass bottles, while gaining traction for their eco-friendliness and aesthetic appeal, remained a niche segment, primarily driven by health-conscious consumers concerned about chemical leaching. Stainless Steel bottles continued to see robust growth, particularly in urban areas, where consumers value their insulation properties and longevity. These bottles are increasingly preferred in premium and outdoor activity segments. Aluminum bottles also maintained a strong presence, appealing to consumers looking for a balance between durability and lightweight characteristics, often favored for outdoor and sports activities.
The Others category, including materials like bamboo and silicone, witnessed moderate growth, driven by eco-conscious consumers seeking sustainable alternatives. However, these materials still represent a smaller portion of the market due to higher costs and limited availability. Overall, the diverse material preferences reflect the varied consumer needs in the reusable water bottles market.
By Distribution Channel Analysis
Supermarkets/hypermarkets dominated reusable water bottle distribution, driven by convenience.
In 2023, The Supermarket/hypermarket channel held a dominant position in the distribution of reusable water bottles. The widespread presence of these retail outlets, coupled with their ability to offer a wide range of products under one roof, contributed to their significant market share. Consumers prefer supermarkets and hypermarkets due to the convenience of physically examining products before purchase, access to various brands, and competitive pricing. These factors, along with the promotional activities and discounts frequently offered in these stores, have further solidified their leading position in the market.
Departmental stores also played a crucial role in the distribution of reusable water bottles, catering to a niche customer base seeking quality and premium brands. These stores often focus on providing a curated selection of products, appealing to consumers who value brand reputation and product quality.
The online store segment witnessed rapid growth, driven by the increasing adoption of e-commerce platforms. The convenience of shopping from home, a wider range of product options, and competitive pricing have made online stores a preferred choice for many consumers. Additionally, the ability to compare products and read customer reviews has boosted consumer confidence in online purchases.
Lastly, the 'Others' segment, which includes specialty stores and direct sales, continued to capture a smaller yet significant market share. Specialty stores, often focusing on eco-friendly and high-end products, attract environmentally conscious consumers. Direct sales, on the other hand, offer a personalized shopping experience, often accompanied by detailed product information and demonstrations, appealing to consumers looking for unique and tailored products.
Key Market Segments
By Material
- Plastic
- Glass
- Stainless Steel
- Aluminium
- Others
By Distribution Channel
- Supermarket/hypermarket
- Departmental Store
- Online Store
- Others
Growth Opportunity
Promoting Sustainability and Eco-Friendliness
The global reusable water bottles market is poised for significant growth, driven by increasing consumer awareness of environmental sustainability. Governments and organizations worldwide are implementing stricter regulations to reduce single-use plastic waste, encouraging the adoption of reusable alternatives. Consumers are becoming more environmentally conscious, with 65% of global consumers now prioritizing eco-friendly products. This trend is expected to boost the demand for reusable water bottles, positioning them as a viable solution to combat plastic pollution. Companies that align their product offerings with these eco-friendly trends are likely to capture a larger market share, especially as sustainability becomes a key purchasing criterion.
Offering Customization and Personalization Options
In addition to sustainability, the rising demand for personalized products presents a lucrative opportunity for the reusable water bottles market. Customization has become a significant driver of consumer preference, particularly among younger demographics. Research indicates that 70% of millennials and Gen Z are more likely to purchase products that offer personalization. By providing customizable options such as personalized engravings, color choices, and unique designs brands can differentiate themselves in a competitive market. This not only enhances customer engagement but also fosters brand loyalty, leading to increased repeat purchases. Companies that invest in personalization are well-positioned to capitalize on this trend and expand their market presence.
Latest Trends
Folding Water Bottles: A Space-Saving Innovation
The reusable water bottles market is witnessing a notable shift towards innovative, space-saving designs, with folding water bottles gaining traction. These bottles, made from flexible materials like silicone, are designed to collapse when empty, reducing their size by up to 80%. This trend is driven by the increasing consumer demand for convenience and portability, particularly among travelers, outdoor enthusiasts, and urban commuters. The compact nature of folding bottles addresses a critical pain point of carrying bulky water bottles and aligns with the broader trend of minimalism in consumer goods. As brands continue to innovate in this space, folding water bottles are expected to capture a significant share of the market, appealing to a wide range of consumers seeking both functionality and style.
Health and Wellness Focus: Driving Market Growth
The health and wellness trend continues to be a major driver in the reusable water bottle market, with consumers increasingly aware of the importance of staying hydrated for overall well-being. This focus on health is influencing the design and functionality of water bottles, with features such as built-in filters, infusers for fruit and herbs, and BPA-free materials becoming standard. Additionally, brands are emphasizing the health benefits of reusable bottles over single-use plastics, which are associated with harmful chemicals and environmental degradation. As consumers prioritize products that support a healthy lifestyle and sustainable practices, the demand for reusable water bottles is expected to grow, reinforcing the market's expansion in the coming year.
Regional Analysis
Asia Pacific dominates the Reusable Water Bottles Market with a 45% largest share.
The Reusable Water Bottles Market exhibits significant growth across various regions, with Asia Pacific leading the market. Asia Pacific accounts for the largest market share, approximately 45%, driven by the increasing awareness of environmental sustainability and the rising adoption of reusable products among consumers. Countries like China and India are at the forefront, contributing substantially to this growth due to their large populations and growing middle class, which is increasingly inclined towards eco-friendly alternatives.
In North America, the market is bolstered by stringent regulations against single-use plastics and a strong consumer preference for sustainable products. The region holds a considerable share, around 25%, as major brands focus on innovative designs and materials that appeal to environmentally conscious consumers. Europe follows closely, with a market share of approximately 20%, where government initiatives and consumer awareness about plastic pollution drive demand for reusable water bottles.
Latin America and the Middle East & Africa, though smaller markets are witnessing steady growth, supported by increasing urbanization and rising disposable incomes. Collectively, these regions hold a market share of around 10%. The growing emphasis on health and hydration further fuels the adoption of reusable water bottles globally.
Key Regions and Countries
North America
- The US
- Canada
- Rest of North America
Europe
- Germany
- France
- The UK
- Spain
- Netherlands
- Russia
- Italy
- Rest of Europe
Asia-Pacific
- China
- Japan
- Singapore
- Thailand
- South Korea
- Vietnam
- India
- New Zealand
- Rest of Asia Pacific
Latin America
- Mexico
- Brazil
- Rest of Latin America
Middle East & Africa
- Saudi Arabia
- South Africa
- UAE
- Rest of the Middle East & Africa
Key Players Analysis
The global reusable water bottles market is expected to witness significant influence from several key players, each driving innovation and growth through diverse strategies. Klean Kanteen continues to lead the market with its commitment to sustainability and environmental responsibility, appealing to a growing segment of eco-conscious consumers. Ocean Water leverages its unique selling proposition of bottles made from ocean plastics, catering to consumers who prioritize marine conservation.
Hydaway is gaining traction with its collapsible design, offering convenience to on-the-go consumers, while Nalgene maintains a strong presence through its durable, BPA-free bottles, a favorite among outdoor enthusiasts. CamelBak Products, LLC remains a dominant force, particularly in the sports and outdoor markets, where its innovative hydration solutions, including water bottle filtration systems, set it apart.
SIGG Switzerland AG continues to appeal to the premium segment with its sleek, aluminum designs, synonymous with Swiss precision and quality. Contigo and Tupperware Brands Corporation are recognized for their versatility and affordability, making them popular among everyday users.
Aquasana Inc. focuses on integrating filtration technology within its bottles, catering to health-conscious consumers. Lastly, S’well is a trendsetter in the premium market, with its stylish, insulated bottles that maintain temperature for extended periods, attracting fashion-forward users.
These companies, through innovation, brand positioning, and sustainability efforts, are collectively shaping the competitive landscape of the reusable water bottles market in 2024, driving both consumer preference and market growth.
Market Key Players
- Klean Kanteen
- Ocean Water
- Hydaway
- Nalgene
- CamelBak Products, LLC
- SIGG Switzerland AG, GmbH
- Contigo
- Tupperware Brands Corporation
- Aquasana Inc.
- S’well
Recent Development
- In April 2024, CamelBak announced a partnership with sustainability organizations to promote environmental conservation efforts. The partnership includes a commitment to using more recycled materials in its water bottles and reducing carbon emissions across its supply chain.
- In March 2024, Hydro Flask expanded its product line with the launch of new insulated stainless steel bottles designed for outdoor adventurers. This move aims to cater to the growing demand for durable and eco-friendly water bottles.
- In February 2024, S'well partnered with several fashion brands to introduce limited-edition reusable water bottles. This collaboration is part of S'well’s strategy to appeal to fashion-conscious consumers and strengthen its presence in the lifestyle segment.
Report Scope
Report Features Description Market Value (2023) USD 9.5 Billion Forecast Revenue (2033) USD 14.9 Billion CAGR (2024-2032) 4.7% Base Year for Estimation 2023 Historic Period 2016-2023 Forecast Period 2024-2033 Report Coverage Revenue Forecast, Market Dynamics, COVID-19 Impact, Competitive Landscape, Recent Developments Segments Covered By Material (Plastic, Glass, Stainless Steel, Aluminium, Others), By Distribution Channel (Supermarket/hypermarket, Departmental Store, Online Store, Others) Regional Analysis North America - The US, Canada, Rest of North America, Europe - Germany, France, The UK, Spain, Italy, Russia, Netherlands, Rest of Europe, Asia-Pacific - China, Japan, South Korea, India, New Zealand, Singapore, Thailand, Vietnam, Rest of Asia Pacific, Latin America - Brazil, Mexico, Rest of Latin America, Middle East & Africa - South Africa, Saudi Arabia, UAE, Rest of Middle East & Africa Competitive Landscape Klean Kanteen, Ocean Water, Hydaway, Nalgene, CamelBak Products, LLC, SIGG Switzerland AG, GmbH, Contigo, Tupperware Brands Corporation, Aquasana Inc., S’well Customization Scope Customization for segments, region/country-level will be provided. Moreover, additional customization can be done based on the requirements. Purchase Options We have three licenses to opt for Single User License, Multi-User License (Up to 5 Users), Corporate Use License (Unlimited User and Printable PDF) -
- 1. Executive Summary
- 1.1. Definition
- 1.2. Taxonomy
- 1.3. Research Scope
- 1.4. Key Analysis
- 1.5. Key Findings by Major Segments
- 1.6. Top strategies by Major Players
- 2. Global Reusable Water Bottles Market Overview
- 2.1. Reusable Water Bottles Market Dynamics
- 2.1.1. Drivers
- 2.1.2. Opportunities
- 2.1.3. Restraints
- 2.1.4. Challenges
- 2.2. Macro-economic Factors
- 2.3. Regulatory Framework
- 2.4. Market Investment Feasibility Index
- 2.5. PEST Analysis
- 2.6. PORTER’S Five Force Analysis
- 2.7. Drivers & Restraints Impact Analysis
- 2.8. Industry Chain Analysis
- 2.9. Cost Structure Analysis
- 2.10. Marketing Strategy
- 2.11. Russia-Ukraine War Impact Analysis
- 2.12. Opportunity Map Analysis
- 2.13. Market Competition Scenario Analysis
- 2.14. Product Life Cycle Analysis
- 2.15. Opportunity Orbits
- 2.16. Manufacturer Intensity Map
- 2.17. Major Companies sales by Value & Volume
- 2.1. Reusable Water Bottles Market Dynamics
- 3. Global Reusable Water Bottles Market Analysis, Opportunity and Forecast, 2016-2032
- 3.1. Global Reusable Water Bottles Market Analysis, 2016-2021
- 3.2. Global Reusable Water Bottles Market Opportunity and Forecast, 2023-2032
- 3.3. Global Reusable Water Bottles Market Analysis, Opportunity and Forecast, By Material, 2016-2032
- 3.3.1. Global Reusable Water Bottles Market Analysis by Material: Introduction
- 3.3.2. Market Size Absolute $ Opportunity Analysis and Forecast, By Material, 2016-2032
- 3.3.3. Plastic
- 3.3.4. Glass
- 3.3.5. Stainless Steel
- 3.3.6. Aluminium
- 3.3.7. Others
- 3.4. Global Reusable Water Bottles Market Analysis, Opportunity and Forecast, By Distribution Channel, 2016-2032
- 3.4.1. Global Reusable Water Bottles Market Analysis by Distribution Channel: Introduction
- 3.4.2. Market Size Absolute $ Opportunity Analysis and Forecast, By Distribution Channel, 2016-2032
- 3.4.3. Supermarket/hypermarket
- 3.4.4. Departmental Store
- 3.4.5. Online Store
- 3.4.6. Others
- 4. North America Reusable Water Bottles Market Analysis, Opportunity and Forecast, 2016-2032
- 4.1. North America Reusable Water Bottles Market Analysis, 2016-2021
- 4.2. North America Reusable Water Bottles Market Opportunity and Forecast, 2023-2032
- 4.3. North America Reusable Water Bottles Market Analysis, Opportunity and Forecast, By Material, 2016-2032
- 4.3.1. North America Reusable Water Bottles Market Analysis by Material: Introduction
- 4.3.2. Market Size Absolute $ Opportunity Analysis and Forecast, By Material, 2016-2032
- 4.3.3. Plastic
- 4.3.4. Glass
- 4.3.5. Stainless Steel
- 4.3.6. Aluminium
- 4.3.7. Others
- 4.4. North America Reusable Water Bottles Market Analysis, Opportunity and Forecast, By Distribution Channel, 2016-2032
- 4.4.1. North America Reusable Water Bottles Market Analysis by Distribution Channel: Introduction
- 4.4.2. Market Size Absolute $ Opportunity Analysis and Forecast, By Distribution Channel, 2016-2032
- 4.4.3. Supermarket/hypermarket
- 4.4.4. Departmental Store
- 4.4.5. Online Store
- 4.4.6. Others
- 4.5. North America Reusable Water Bottles Market Analysis, Opportunity and Forecast, By Country , 2016-2032
- 4.5.1. North America Reusable Water Bottles Market Analysis by Country : Introduction
- 4.5.2. Market Size Absolute $ Opportunity Analysis and Forecast, Country , 2016-2032
- 4.5.2.1. The US
- 4.5.2.2. Canada
- 4.5.2.3. Mexico
- 5. Western Europe Reusable Water Bottles Market Analysis, Opportunity and Forecast, 2016-2032
- 5.1. Western Europe Reusable Water Bottles Market Analysis, 2016-2021
- 5.2. Western Europe Reusable Water Bottles Market Opportunity and Forecast, 2023-2032
- 5.3. Western Europe Reusable Water Bottles Market Analysis, Opportunity and Forecast, By Material, 2016-2032
- 5.3.1. Western Europe Reusable Water Bottles Market Analysis by Material: Introduction
- 5.3.2. Market Size Absolute $ Opportunity Analysis and Forecast, By Material, 2016-2032
- 5.3.3. Plastic
- 5.3.4. Glass
- 5.3.5. Stainless Steel
- 5.3.6. Aluminium
- 5.3.7. Others
- 5.4. Western Europe Reusable Water Bottles Market Analysis, Opportunity and Forecast, By Distribution Channel, 2016-2032
- 5.4.1. Western Europe Reusable Water Bottles Market Analysis by Distribution Channel: Introduction
- 5.4.2. Market Size Absolute $ Opportunity Analysis and Forecast, By Distribution Channel, 2016-2032
- 5.4.3. Supermarket/hypermarket
- 5.4.4. Departmental Store
- 5.4.5. Online Store
- 5.4.6. Others
- 5.5. Western Europe Reusable Water Bottles Market Analysis, Opportunity and Forecast, By Country , 2016-2032
- 5.5.1. Western Europe Reusable Water Bottles Market Analysis by Country : Introduction
- 5.5.2. Market Size Absolute $ Opportunity Analysis and Forecast, Country , 2016-2032
- 5.5.2.1. Germany
- 5.5.2.2. France
- 5.5.2.3. The UK
- 5.5.2.4. Spain
- 5.5.2.5. Italy
- 5.5.2.6. Portugal
- 5.5.2.7. Ireland
- 5.5.2.8. Austria
- 5.5.2.9. Switzerland
- 5.5.2.10. Benelux
- 5.5.2.11. Nordic
- 5.5.2.12. Rest of Western Europe
- 6. Eastern Europe Reusable Water Bottles Market Analysis, Opportunity and Forecast, 2016-2032
- 6.1. Eastern Europe Reusable Water Bottles Market Analysis, 2016-2021
- 6.2. Eastern Europe Reusable Water Bottles Market Opportunity and Forecast, 2023-2032
- 6.3. Eastern Europe Reusable Water Bottles Market Analysis, Opportunity and Forecast, By Material, 2016-2032
- 6.3.1. Eastern Europe Reusable Water Bottles Market Analysis by Material: Introduction
- 6.3.2. Market Size Absolute $ Opportunity Analysis and Forecast, By Material, 2016-2032
- 6.3.3. Plastic
- 6.3.4. Glass
- 6.3.5. Stainless Steel
- 6.3.6. Aluminium
- 6.3.7. Others
- 6.4. Eastern Europe Reusable Water Bottles Market Analysis, Opportunity and Forecast, By Distribution Channel, 2016-2032
- 6.4.1. Eastern Europe Reusable Water Bottles Market Analysis by Distribution Channel: Introduction
- 6.4.2. Market Size Absolute $ Opportunity Analysis and Forecast, By Distribution Channel, 2016-2032
- 6.4.3. Supermarket/hypermarket
- 6.4.4. Departmental Store
- 6.4.5. Online Store
- 6.4.6. Others
- 6.5. Eastern Europe Reusable Water Bottles Market Analysis, Opportunity and Forecast, By Country , 2016-2032
- 6.5.1. Eastern Europe Reusable Water Bottles Market Analysis by Country : Introduction
- 6.5.2. Market Size Absolute $ Opportunity Analysis and Forecast, Country , 2016-2032
- 6.5.2.1. Russia
- 6.5.2.2. Poland
- 6.5.2.3. The Czech Republic
- 6.5.2.4. Greece
- 6.5.2.5. Rest of Eastern Europe
- 7. APAC Reusable Water Bottles Market Analysis, Opportunity and Forecast, 2016-2032
- 7.1. APAC Reusable Water Bottles Market Analysis, 2016-2021
- 7.2. APAC Reusable Water Bottles Market Opportunity and Forecast, 2023-2032
- 7.3. APAC Reusable Water Bottles Market Analysis, Opportunity and Forecast, By Material, 2016-2032
- 7.3.1. APAC Reusable Water Bottles Market Analysis by Material: Introduction
- 7.3.2. Market Size Absolute $ Opportunity Analysis and Forecast, By Material, 2016-2032
- 7.3.3. Plastic
- 7.3.4. Glass
- 7.3.5. Stainless Steel
- 7.3.6. Aluminium
- 7.3.7. Others
- 7.4. APAC Reusable Water Bottles Market Analysis, Opportunity and Forecast, By Distribution Channel, 2016-2032
- 7.4.1. APAC Reusable Water Bottles Market Analysis by Distribution Channel: Introduction
- 7.4.2. Market Size Absolute $ Opportunity Analysis and Forecast, By Distribution Channel, 2016-2032
- 7.4.3. Supermarket/hypermarket
- 7.4.4. Departmental Store
- 7.4.5. Online Store
- 7.4.6. Others
- 7.5. APAC Reusable Water Bottles Market Analysis, Opportunity and Forecast, By Country , 2016-2032
- 7.5.1. APAC Reusable Water Bottles Market Analysis by Country : Introduction
- 7.5.2. Market Size Absolute $ Opportunity Analysis and Forecast, Country , 2016-2032
- 7.5.2.1. China
- 7.5.2.2. Japan
- 7.5.2.3. South Korea
- 7.5.2.4. India
- 7.5.2.5. Australia & New Zeland
- 7.5.2.6. Indonesia
- 7.5.2.7. Malaysia
- 7.5.2.8. Philippines
- 7.5.2.9. Singapore
- 7.5.2.10. Thailand
- 7.5.2.11. Vietnam
- 7.5.2.12. Rest of APAC
- 8. Latin America Reusable Water Bottles Market Analysis, Opportunity and Forecast, 2016-2032
- 8.1. Latin America Reusable Water Bottles Market Analysis, 2016-2021
- 8.2. Latin America Reusable Water Bottles Market Opportunity and Forecast, 2023-2032
- 8.3. Latin America Reusable Water Bottles Market Analysis, Opportunity and Forecast, By Material, 2016-2032
- 8.3.1. Latin America Reusable Water Bottles Market Analysis by Material: Introduction
- 8.3.2. Market Size Absolute $ Opportunity Analysis and Forecast, By Material, 2016-2032
- 8.3.3. Plastic
- 8.3.4. Glass
- 8.3.5. Stainless Steel
- 8.3.6. Aluminium
- 8.3.7. Others
- 8.4. Latin America Reusable Water Bottles Market Analysis, Opportunity and Forecast, By Distribution Channel, 2016-2032
- 8.4.1. Latin America Reusable Water Bottles Market Analysis by Distribution Channel: Introduction
- 8.4.2. Market Size Absolute $ Opportunity Analysis and Forecast, By Distribution Channel, 2016-2032
- 8.4.3. Supermarket/hypermarket
- 8.4.4. Departmental Store
- 8.4.5. Online Store
- 8.4.6. Others
- 8.5. Latin America Reusable Water Bottles Market Analysis, Opportunity and Forecast, By Country , 2016-2032
- 8.5.1. Latin America Reusable Water Bottles Market Analysis by Country : Introduction
- 8.5.2. Market Size Absolute $ Opportunity Analysis and Forecast, Country , 2016-2032
- 8.5.2.1. Brazil
- 8.5.2.2. Colombia
- 8.5.2.3. Chile
- 8.5.2.4. Argentina
- 8.5.2.5. Costa Rica
- 8.5.2.6. Rest of Latin America
- 9. Middle East & Africa Reusable Water Bottles Market Analysis, Opportunity and Forecast, 2016-2032
- 9.1. Middle East & Africa Reusable Water Bottles Market Analysis, 2016-2021
- 9.2. Middle East & Africa Reusable Water Bottles Market Opportunity and Forecast, 2023-2032
- 9.3. Middle East & Africa Reusable Water Bottles Market Analysis, Opportunity and Forecast, By Material, 2016-2032
- 9.3.1. Middle East & Africa Reusable Water Bottles Market Analysis by Material: Introduction
- 9.3.2. Market Size Absolute $ Opportunity Analysis and Forecast, By Material, 2016-2032
- 9.3.3. Plastic
- 9.3.4. Glass
- 9.3.5. Stainless Steel
- 9.3.6. Aluminium
- 9.3.7. Others
- 9.4. Middle East & Africa Reusable Water Bottles Market Analysis, Opportunity and Forecast, By Distribution Channel, 2016-2032
- 9.4.1. Middle East & Africa Reusable Water Bottles Market Analysis by Distribution Channel: Introduction
- 9.4.2. Market Size Absolute $ Opportunity Analysis and Forecast, By Distribution Channel, 2016-2032
- 9.4.3. Supermarket/hypermarket
- 9.4.4. Departmental Store
- 9.4.5. Online Store
- 9.4.6. Others
- 9.5. Middle East & Africa Reusable Water Bottles Market Analysis, Opportunity and Forecast, By Country , 2016-2032
- 9.5.1. Middle East & Africa Reusable Water Bottles Market Analysis by Country : Introduction
- 9.5.2. Market Size Absolute $ Opportunity Analysis and Forecast, Country , 2016-2032
- 9.5.2.1. Algeria
- 9.5.2.2. Egypt
- 9.5.2.3. Israel
- 9.5.2.4. Kuwait
- 9.5.2.5. Nigeria
- 9.5.2.6. Saudi Arabia
- 9.5.2.7. South Africa
- 9.5.2.8. Turkey
- 9.5.2.9. The UAE
- 9.5.2.10. Rest of MEA
- 10. Global Reusable Water Bottles Market Analysis, Opportunity and Forecast, By Region , 2016-2032
- 10.1. Global Reusable Water Bottles Market Analysis by Region : Introduction
- 10.2. Market Size Absolute $ Opportunity Analysis and Forecast, By Region , 2016-2032
- 10.2.1. North America
- 10.2.2. Western Europe
- 10.2.3. Eastern Europe
- 10.2.4. APAC
- 10.2.5. Latin America
- 10.2.6. Middle East & Africa
- 11. Global Reusable Water Bottles Market Competitive Landscape, Market Share Analysis, and Company Profiles
- 11.1. Market Share Analysis
- 11.2. Company Profiles
- 11.3. Klean Kanteen
- 11.3.1. Company Overview
- 11.3.2. Financial Highlights
- 11.3.3. Product Portfolio
- 11.3.4. SWOT Analysis
- 11.3.5. Key Strategies and Developments
- 11.4. Ocean Water
- 11.4.1. Company Overview
- 11.4.2. Financial Highlights
- 11.4.3. Product Portfolio
- 11.4.4. SWOT Analysis
- 11.4.5. Key Strategies and Developments
- 11.5. Hydaway
- 11.5.1. Company Overview
- 11.5.2. Financial Highlights
- 11.5.3. Product Portfolio
- 11.5.4. SWOT Analysis
- 11.5.5. Key Strategies and Developments
- 11.6. Nalgene
- 11.6.1. Company Overview
- 11.6.2. Financial Highlights
- 11.6.3. Product Portfolio
- 11.6.4. SWOT Analysis
- 11.6.5. Key Strategies and Developments
- 11.7. CamelBak Products, LLC
- 11.7.1. Company Overview
- 11.7.2. Financial Highlights
- 11.7.3. Product Portfolio
- 11.7.4. SWOT Analysis
- 11.7.5. Key Strategies and Developments
- 11.8. SIGG Switzerland AG, GmbH
- 11.8.1. Company Overview
- 11.8.2. Financial Highlights
- 11.8.3. Product Portfolio
- 11.8.4. SWOT Analysis
- 11.8.5. Key Strategies and Developments
- 11.9. Contigo
- 11.9.1. Company Overview
- 11.9.2. Financial Highlights
- 11.9.3. Product Portfolio
- 11.9.4. SWOT Analysis
- 11.9.5. Key Strategies and Developments
- 11.10. Tupperware Brands Corporation
- 11.10.1. Company Overview
- 11.10.2. Financial Highlights
- 11.10.3. Product Portfolio
- 11.10.4. SWOT Analysis
- 11.10.5. Key Strategies and Developments
- 11.11. Aquasana Inc.
- 11.11.1. Company Overview
- 11.11.2. Financial Highlights
- 11.11.3. Product Portfolio
- 11.11.4. SWOT Analysis
- 11.11.5. Key Strategies and Developments
- 11.12. S’well
- 11.12.1. Company Overview
- 11.12.2. Financial Highlights
- 11.12.3. Product Portfolio
- 11.12.4. SWOT Analysis
- 11.12.5. Key Strategies and Developments
- 11.13.1. Company Overview
- 11.13.2. Financial Highlights
- 11.13.3. Product Portfolio
- 11.13.4. SWOT Analysis
- 11.13.5. Key Strategies and Developments
- 12. Assumptions and Acronyms
- 13. Research Methodology
- 14. Contact
"
- List of Figures
- "
- Figure 1: Global Reusable Water Bottles Market Revenue (US$ Mn) Market Share by Material in 2022
- Figure 2: Global Reusable Water Bottles Market Market Attractiveness Analysis by Material, 2016-2032
- Figure 3: Global Reusable Water Bottles Market Revenue (US$ Mn) Market Share by Distribution Channelin 2022
- Figure 4: Global Reusable Water Bottles Market Market Attractiveness Analysis by Distribution Channel, 2016-2032
- Figure 5: Global Reusable Water Bottles Market Revenue (US$ Mn) Market Share by Region in 2022
- Figure 6: Global Reusable Water Bottles Market Market Attractiveness Analysis by Region, 2016-2032
- Figure 7: Global Reusable Water Bottles Market Market Revenue (US$ Mn) (2016-2032)
- Figure 8: Global Reusable Water Bottles Market Market Revenue (US$ Mn) Comparison by Region (2016-2032)
- Figure 9: Global Reusable Water Bottles Market Market Revenue (US$ Mn) Comparison by Material (2016-2032)
- Figure 10: Global Reusable Water Bottles Market Market Revenue (US$ Mn) Comparison by Distribution Channel (2016-2032)
- Figure 11: Global Reusable Water Bottles Market Market Y-o-Y Growth Rate Comparison by Region (2016-2032)
- Figure 12: Global Reusable Water Bottles Market Market Y-o-Y Growth Rate Comparison by Material (2016-2032)
- Figure 13: Global Reusable Water Bottles Market Market Y-o-Y Growth Rate Comparison by Distribution Channel (2016-2032)
- Figure 14: Global Reusable Water Bottles Market Market Share Comparison by Region (2016-2032)
- Figure 15: Global Reusable Water Bottles Market Market Share Comparison by Material (2016-2032)
- Figure 16: Global Reusable Water Bottles Market Market Share Comparison by Distribution Channel (2016-2032)
- Figure 17: North America Reusable Water Bottles Market Revenue (US$ Mn) Market Share by Materialin 2022
- Figure 18: North America Reusable Water Bottles Market Market Attractiveness Analysis by Material, 2016-2032
- Figure 19: North America Reusable Water Bottles Market Revenue (US$ Mn) Market Share by Distribution Channelin 2022
- Figure 20: North America Reusable Water Bottles Market Market Attractiveness Analysis by Distribution Channel, 2016-2032
- Figure 21: North America Reusable Water Bottles Market Revenue (US$ Mn) Market Share by Country in 2022
- Figure 22: North America Reusable Water Bottles Market Market Attractiveness Analysis by Country, 2016-2032
- Figure 23: North America Reusable Water Bottles Market Market Revenue (US$ Mn) (2016-2032)
- Figure 24: North America Reusable Water Bottles Market Market Revenue (US$ Mn) Comparison by Country (2016-2032)
- Figure 25: North America Reusable Water Bottles Market Market Revenue (US$ Mn) Comparison by Material (2016-2032)
- Figure 26: North America Reusable Water Bottles Market Market Revenue (US$ Mn) Comparison by Distribution Channel (2016-2032)
- Figure 27: North America Reusable Water Bottles Market Market Y-o-Y Growth Rate Comparison by Country (2016-2032)
- Figure 28: North America Reusable Water Bottles Market Market Y-o-Y Growth Rate Comparison by Material (2016-2032)
- Figure 29: North America Reusable Water Bottles Market Market Y-o-Y Growth Rate Comparison by Distribution Channel (2016-2032)
- Figure 30: North America Reusable Water Bottles Market Market Share Comparison by Country (2016-2032)
- Figure 31: North America Reusable Water Bottles Market Market Share Comparison by Material (2016-2032)
- Figure 32: North America Reusable Water Bottles Market Market Share Comparison by Distribution Channel (2016-2032)
- Figure 33: Western Europe Reusable Water Bottles Market Revenue (US$ Mn) Market Share by Materialin 2022
- Figure 34: Western Europe Reusable Water Bottles Market Market Attractiveness Analysis by Material, 2016-2032
- Figure 35: Western Europe Reusable Water Bottles Market Revenue (US$ Mn) Market Share by Distribution Channelin 2022
- Figure 36: Western Europe Reusable Water Bottles Market Market Attractiveness Analysis by Distribution Channel, 2016-2032
- Figure 37: Western Europe Reusable Water Bottles Market Revenue (US$ Mn) Market Share by Country in 2022
- Figure 38: Western Europe Reusable Water Bottles Market Market Attractiveness Analysis by Country, 2016-2032
- Figure 39: Western Europe Reusable Water Bottles Market Market Revenue (US$ Mn) (2016-2032)
- Figure 40: Western Europe Reusable Water Bottles Market Market Revenue (US$ Mn) Comparison by Country (2016-2032)
- Figure 41: Western Europe Reusable Water Bottles Market Market Revenue (US$ Mn) Comparison by Material (2016-2032)
- Figure 42: Western Europe Reusable Water Bottles Market Market Revenue (US$ Mn) Comparison by Distribution Channel (2016-2032)
- Figure 43: Western Europe Reusable Water Bottles Market Market Y-o-Y Growth Rate Comparison by Country (2016-2032)
- Figure 44: Western Europe Reusable Water Bottles Market Market Y-o-Y Growth Rate Comparison by Material (2016-2032)
- Figure 45: Western Europe Reusable Water Bottles Market Market Y-o-Y Growth Rate Comparison by Distribution Channel (2016-2032)
- Figure 46: Western Europe Reusable Water Bottles Market Market Share Comparison by Country (2016-2032)
- Figure 47: Western Europe Reusable Water Bottles Market Market Share Comparison by Material (2016-2032)
- Figure 48: Western Europe Reusable Water Bottles Market Market Share Comparison by Distribution Channel (2016-2032)
- Figure 49: Eastern Europe Reusable Water Bottles Market Revenue (US$ Mn) Market Share by Materialin 2022
- Figure 50: Eastern Europe Reusable Water Bottles Market Market Attractiveness Analysis by Material, 2016-2032
- Figure 51: Eastern Europe Reusable Water Bottles Market Revenue (US$ Mn) Market Share by Distribution Channelin 2022
- Figure 52: Eastern Europe Reusable Water Bottles Market Market Attractiveness Analysis by Distribution Channel, 2016-2032
- Figure 53: Eastern Europe Reusable Water Bottles Market Revenue (US$ Mn) Market Share by Country in 2022
- Figure 54: Eastern Europe Reusable Water Bottles Market Market Attractiveness Analysis by Country, 2016-2032
- Figure 55: Eastern Europe Reusable Water Bottles Market Market Revenue (US$ Mn) (2016-2032)
- Figure 56: Eastern Europe Reusable Water Bottles Market Market Revenue (US$ Mn) Comparison by Country (2016-2032)
- Figure 57: Eastern Europe Reusable Water Bottles Market Market Revenue (US$ Mn) Comparison by Material (2016-2032)
- Figure 58: Eastern Europe Reusable Water Bottles Market Market Revenue (US$ Mn) Comparison by Distribution Channel (2016-2032)
- Figure 59: Eastern Europe Reusable Water Bottles Market Market Y-o-Y Growth Rate Comparison by Country (2016-2032)
- Figure 60: Eastern Europe Reusable Water Bottles Market Market Y-o-Y Growth Rate Comparison by Material (2016-2032)
- Figure 61: Eastern Europe Reusable Water Bottles Market Market Y-o-Y Growth Rate Comparison by Distribution Channel (2016-2032)
- Figure 62: Eastern Europe Reusable Water Bottles Market Market Share Comparison by Country (2016-2032)
- Figure 63: Eastern Europe Reusable Water Bottles Market Market Share Comparison by Material (2016-2032)
- Figure 64: Eastern Europe Reusable Water Bottles Market Market Share Comparison by Distribution Channel (2016-2032)
- Figure 65: APAC Reusable Water Bottles Market Revenue (US$ Mn) Market Share by Materialin 2022
- Figure 66: APAC Reusable Water Bottles Market Market Attractiveness Analysis by Material, 2016-2032
- Figure 67: APAC Reusable Water Bottles Market Revenue (US$ Mn) Market Share by Distribution Channelin 2022
- Figure 68: APAC Reusable Water Bottles Market Market Attractiveness Analysis by Distribution Channel, 2016-2032
- Figure 69: APAC Reusable Water Bottles Market Revenue (US$ Mn) Market Share by Country in 2022
- Figure 70: APAC Reusable Water Bottles Market Market Attractiveness Analysis by Country, 2016-2032
- Figure 71: APAC Reusable Water Bottles Market Market Revenue (US$ Mn) (2016-2032)
- Figure 72: APAC Reusable Water Bottles Market Market Revenue (US$ Mn) Comparison by Country (2016-2032)
- Figure 73: APAC Reusable Water Bottles Market Market Revenue (US$ Mn) Comparison by Material (2016-2032)
- Figure 74: APAC Reusable Water Bottles Market Market Revenue (US$ Mn) Comparison by Distribution Channel (2016-2032)
- Figure 75: APAC Reusable Water Bottles Market Market Y-o-Y Growth Rate Comparison by Country (2016-2032)
- Figure 76: APAC Reusable Water Bottles Market Market Y-o-Y Growth Rate Comparison by Material (2016-2032)
- Figure 77: APAC Reusable Water Bottles Market Market Y-o-Y Growth Rate Comparison by Distribution Channel (2016-2032)
- Figure 78: APAC Reusable Water Bottles Market Market Share Comparison by Country (2016-2032)
- Figure 79: APAC Reusable Water Bottles Market Market Share Comparison by Material (2016-2032)
- Figure 80: APAC Reusable Water Bottles Market Market Share Comparison by Distribution Channel (2016-2032)
- Figure 81: Latin America Reusable Water Bottles Market Revenue (US$ Mn) Market Share by Materialin 2022
- Figure 82: Latin America Reusable Water Bottles Market Market Attractiveness Analysis by Material, 2016-2032
- Figure 83: Latin America Reusable Water Bottles Market Revenue (US$ Mn) Market Share by Distribution Channelin 2022
- Figure 84: Latin America Reusable Water Bottles Market Market Attractiveness Analysis by Distribution Channel, 2016-2032
- Figure 85: Latin America Reusable Water Bottles Market Revenue (US$ Mn) Market Share by Country in 2022
- Figure 86: Latin America Reusable Water Bottles Market Market Attractiveness Analysis by Country, 2016-2032
- Figure 87: Latin America Reusable Water Bottles Market Market Revenue (US$ Mn) (2016-2032)
- Figure 88: Latin America Reusable Water Bottles Market Market Revenue (US$ Mn) Comparison by Country (2016-2032)
- Figure 89: Latin America Reusable Water Bottles Market Market Revenue (US$ Mn) Comparison by Material (2016-2032)
- Figure 90: Latin America Reusable Water Bottles Market Market Revenue (US$ Mn) Comparison by Distribution Channel (2016-2032)
- Figure 91: Latin America Reusable Water Bottles Market Market Y-o-Y Growth Rate Comparison by Country (2016-2032)
- Figure 92: Latin America Reusable Water Bottles Market Market Y-o-Y Growth Rate Comparison by Material (2016-2032)
- Figure 93: Latin America Reusable Water Bottles Market Market Y-o-Y Growth Rate Comparison by Distribution Channel (2016-2032)
- Figure 94: Latin America Reusable Water Bottles Market Market Share Comparison by Country (2016-2032)
- Figure 95: Latin America Reusable Water Bottles Market Market Share Comparison by Material (2016-2032)
- Figure 96: Latin America Reusable Water Bottles Market Market Share Comparison by Distribution Channel (2016-2032)
- Figure 97: Middle East & Africa Reusable Water Bottles Market Revenue (US$ Mn) Market Share by Materialin 2022
- Figure 98: Middle East & Africa Reusable Water Bottles Market Market Attractiveness Analysis by Material, 2016-2032
- Figure 99: Middle East & Africa Reusable Water Bottles Market Revenue (US$ Mn) Market Share by Distribution Channelin 2022
- Figure 100: Middle East & Africa Reusable Water Bottles Market Market Attractiveness Analysis by Distribution Channel, 2016-2032
- Figure 101: Middle East & Africa Reusable Water Bottles Market Revenue (US$ Mn) Market Share by Country in 2022
- Figure 102: Middle East & Africa Reusable Water Bottles Market Market Attractiveness Analysis by Country, 2016-2032
- Figure 103: Middle East & Africa Reusable Water Bottles Market Market Revenue (US$ Mn) (2016-2032)
- Figure 104: Middle East & Africa Reusable Water Bottles Market Market Revenue (US$ Mn) Comparison by Country (2016-2032)
- Figure 105: Middle East & Africa Reusable Water Bottles Market Market Revenue (US$ Mn) Comparison by Material (2016-2032)
- Figure 106: Middle East & Africa Reusable Water Bottles Market Market Revenue (US$ Mn) Comparison by Distribution Channel (2016-2032)
- Figure 107: Middle East & Africa Reusable Water Bottles Market Market Y-o-Y Growth Rate Comparison by Country (2016-2032)
- Figure 108: Middle East & Africa Reusable Water Bottles Market Market Y-o-Y Growth Rate Comparison by Material (2016-2032)
- Figure 109: Middle East & Africa Reusable Water Bottles Market Market Y-o-Y Growth Rate Comparison by Distribution Channel (2016-2032)
- Figure 110: Middle East & Africa Reusable Water Bottles Market Market Share Comparison by Country (2016-2032)
- Figure 111: Middle East & Africa Reusable Water Bottles Market Market Share Comparison by Material (2016-2032)
- Figure 112: Middle East & Africa Reusable Water Bottles Market Market Share Comparison by Distribution Channel (2016-2032)
"
- List of Tables
- "
- Table 1: Global Reusable Water Bottles Market Market Comparison by Material (2016-2032)
- Table 2: Global Reusable Water Bottles Market Market Comparison by Distribution Channel (2016-2032)
- Table 3: Global Reusable Water Bottles Market Revenue (US$ Mn) Comparison by Region (2016-2032)
- Table 4: Global Reusable Water Bottles Market Market Revenue (US$ Mn) (2016-2032)
- Table 5: Global Reusable Water Bottles Market Market Revenue (US$ Mn) Comparison by Region (2016-2032)
- Table 6: Global Reusable Water Bottles Market Market Revenue (US$ Mn) Comparison by Material (2016-2032)
- Table 7: Global Reusable Water Bottles Market Market Revenue (US$ Mn) Comparison by Distribution Channel (2016-2032)
- Table 8: Global Reusable Water Bottles Market Market Y-o-Y Growth Rate Comparison by Region (2016-2032)
- Table 9: Global Reusable Water Bottles Market Market Y-o-Y Growth Rate Comparison by Material (2016-2032)
- Table 10: Global Reusable Water Bottles Market Market Y-o-Y Growth Rate Comparison by Distribution Channel (2016-2032)
- Table 11: Global Reusable Water Bottles Market Market Share Comparison by Region (2016-2032)
- Table 12: Global Reusable Water Bottles Market Market Share Comparison by Material (2016-2032)
- Table 13: Global Reusable Water Bottles Market Market Share Comparison by Distribution Channel (2016-2032)
- Table 14: North America Reusable Water Bottles Market Market Comparison by Distribution Channel (2016-2032)
- Table 15: North America Reusable Water Bottles Market Revenue (US$ Mn) Comparison by Country (2016-2032)
- Table 16: North America Reusable Water Bottles Market Market Revenue (US$ Mn) (2016-2032)
- Table 17: North America Reusable Water Bottles Market Market Revenue (US$ Mn) Comparison by Country (2016-2032)
- Table 18: North America Reusable Water Bottles Market Market Revenue (US$ Mn) Comparison by Material (2016-2032)
- Table 19: North America Reusable Water Bottles Market Market Revenue (US$ Mn) Comparison by Distribution Channel (2016-2032)
- Table 20: North America Reusable Water Bottles Market Market Y-o-Y Growth Rate Comparison by Country (2016-2032)
- Table 21: North America Reusable Water Bottles Market Market Y-o-Y Growth Rate Comparison by Material (2016-2032)
- Table 22: North America Reusable Water Bottles Market Market Y-o-Y Growth Rate Comparison by Distribution Channel (2016-2032)
- Table 23: North America Reusable Water Bottles Market Market Share Comparison by Country (2016-2032)
- Table 24: North America Reusable Water Bottles Market Market Share Comparison by Material (2016-2032)
- Table 25: North America Reusable Water Bottles Market Market Share Comparison by Distribution Channel (2016-2032)
- Table 26: Western Europe Reusable Water Bottles Market Market Comparison by Material (2016-2032)
- Table 27: Western Europe Reusable Water Bottles Market Market Comparison by Distribution Channel (2016-2032)
- Table 28: Western Europe Reusable Water Bottles Market Revenue (US$ Mn) Comparison by Country (2016-2032)
- Table 29: Western Europe Reusable Water Bottles Market Market Revenue (US$ Mn) (2016-2032)
- Table 30: Western Europe Reusable Water Bottles Market Market Revenue (US$ Mn) Comparison by Country (2016-2032)
- Table 31: Western Europe Reusable Water Bottles Market Market Revenue (US$ Mn) Comparison by Material (2016-2032)
- Table 32: Western Europe Reusable Water Bottles Market Market Revenue (US$ Mn) Comparison by Distribution Channel (2016-2032)
- Table 33: Western Europe Reusable Water Bottles Market Market Y-o-Y Growth Rate Comparison by Country (2016-2032)
- Table 34: Western Europe Reusable Water Bottles Market Market Y-o-Y Growth Rate Comparison by Material (2016-2032)
- Table 35: Western Europe Reusable Water Bottles Market Market Y-o-Y Growth Rate Comparison by Distribution Channel (2016-2032)
- Table 36: Western Europe Reusable Water Bottles Market Market Share Comparison by Country (2016-2032)
- Table 37: Western Europe Reusable Water Bottles Market Market Share Comparison by Material (2016-2032)
- Table 38: Western Europe Reusable Water Bottles Market Market Share Comparison by Distribution Channel (2016-2032)
- Table 39: Eastern Europe Reusable Water Bottles Market Market Comparison by Material (2016-2032)
- Table 40: Eastern Europe Reusable Water Bottles Market Market Comparison by Distribution Channel (2016-2032)
- Table 41: Eastern Europe Reusable Water Bottles Market Revenue (US$ Mn) Comparison by Country (2016-2032)
- Table 42: Eastern Europe Reusable Water Bottles Market Market Revenue (US$ Mn) (2016-2032)
- Table 43: Eastern Europe Reusable Water Bottles Market Market Revenue (US$ Mn) Comparison by Country (2016-2032)
- Table 44: Eastern Europe Reusable Water Bottles Market Market Revenue (US$ Mn) Comparison by Material (2016-2032)
- Table 45: Eastern Europe Reusable Water Bottles Market Market Revenue (US$ Mn) Comparison by Distribution Channel (2016-2032)
- Table 46: Eastern Europe Reusable Water Bottles Market Market Y-o-Y Growth Rate Comparison by Country (2016-2032)
- Table 47: Eastern Europe Reusable Water Bottles Market Market Y-o-Y Growth Rate Comparison by Material (2016-2032)
- Table 48: Eastern Europe Reusable Water Bottles Market Market Y-o-Y Growth Rate Comparison by Distribution Channel (2016-2032)
- Table 49: Eastern Europe Reusable Water Bottles Market Market Share Comparison by Country (2016-2032)
- Table 50: Eastern Europe Reusable Water Bottles Market Market Share Comparison by Material (2016-2032)
- Table 51: Eastern Europe Reusable Water Bottles Market Market Share Comparison by Distribution Channel (2016-2032)
- Table 52: APAC Reusable Water Bottles Market Market Comparison by Material (2016-2032)
- Table 53: APAC Reusable Water Bottles Market Market Comparison by Distribution Channel (2016-2032)
- Table 54: APAC Reusable Water Bottles Market Revenue (US$ Mn) Comparison by Country (2016-2032)
- Table 55: APAC Reusable Water Bottles Market Market Revenue (US$ Mn) (2016-2032)
- Table 56: APAC Reusable Water Bottles Market Market Revenue (US$ Mn) Comparison by Country (2016-2032)
- Table 57: APAC Reusable Water Bottles Market Market Revenue (US$ Mn) Comparison by Material (2016-2032)
- Table 58: APAC Reusable Water Bottles Market Market Revenue (US$ Mn) Comparison by Distribution Channel (2016-2032)
- Table 59: APAC Reusable Water Bottles Market Market Y-o-Y Growth Rate Comparison by Country (2016-2032)
- Table 60: APAC Reusable Water Bottles Market Market Y-o-Y Growth Rate Comparison by Material (2016-2032)
- Table 61: APAC Reusable Water Bottles Market Market Y-o-Y Growth Rate Comparison by Distribution Channel (2016-2032)
- Table 62: APAC Reusable Water Bottles Market Market Share Comparison by Country (2016-2032)
- Table 63: APAC Reusable Water Bottles Market Market Share Comparison by Material (2016-2032)
- Table 64: APAC Reusable Water Bottles Market Market Share Comparison by Distribution Channel (2016-2032)
- Table 65: Latin America Reusable Water Bottles Market Market Comparison by Material (2016-2032)
- Table 66: Latin America Reusable Water Bottles Market Market Comparison by Distribution Channel (2016-2032)
- Table 67: Latin America Reusable Water Bottles Market Revenue (US$ Mn) Comparison by Country (2016-2032)
- Table 68: Latin America Reusable Water Bottles Market Market Revenue (US$ Mn) (2016-2032)
- Table 69: Latin America Reusable Water Bottles Market Market Revenue (US$ Mn) Comparison by Country (2016-2032)
- Table 70: Latin America Reusable Water Bottles Market Market Revenue (US$ Mn) Comparison by Material (2016-2032)
- Table 71: Latin America Reusable Water Bottles Market Market Revenue (US$ Mn) Comparison by Distribution Channel (2016-2032)
- Table 72: Latin America Reusable Water Bottles Market Market Y-o-Y Growth Rate Comparison by Country (2016-2032)
- Table 73: Latin America Reusable Water Bottles Market Market Y-o-Y Growth Rate Comparison by Material (2016-2032)
- Table 74: Latin America Reusable Water Bottles Market Market Y-o-Y Growth Rate Comparison by Distribution Channel (2016-2032)
- Table 75: Latin America Reusable Water Bottles Market Market Share Comparison by Country (2016-2032)
- Table 76: Latin America Reusable Water Bottles Market Market Share Comparison by Material (2016-2032)
- Table 77: Latin America Reusable Water Bottles Market Market Share Comparison by Distribution Channel (2016-2032)
- Table 78: Middle East & Africa Reusable Water Bottles Market Market Comparison by Material (2016-2032)
- Table 79: Middle East & Africa Reusable Water Bottles Market Market Comparison by Distribution Channel (2016-2032)
- Table 80: Middle East & Africa Reusable Water Bottles Market Revenue (US$ Mn) Comparison by Country (2016-2032)
- Table 81: Middle East & Africa Reusable Water Bottles Market Market Revenue (US$ Mn) (2016-2032)
- Table 82: Middle East & Africa Reusable Water Bottles Market Market Revenue (US$ Mn) Comparison by Country (2016-2032)
- Table 83: Middle East & Africa Reusable Water Bottles Market Market Revenue (US$ Mn) Comparison by Material (2016-2032)
- Table 84: Middle East & Africa Reusable Water Bottles Market Market Revenue (US$ Mn) Comparison by Distribution Channel (2016-2032)
- Table 85: Middle East & Africa Reusable Water Bottles Market Market Y-o-Y Growth Rate Comparison by Country (2016-2032)
- Table 86: Middle East & Africa Reusable Water Bottles Market Market Y-o-Y Growth Rate Comparison by Material (2016-2032)
- Table 87: Middle East & Africa Reusable Water Bottles Market Market Y-o-Y Growth Rate Comparison by Distribution Channel (2016-2032)
- Table 88: Middle East & Africa Reusable Water Bottles Market Market Share Comparison by Country (2016-2032)
- Table 89: Middle East & Africa Reusable Water Bottles Market Market Share Comparison by Material (2016-2032)
- Table 90: Middle East & Africa Reusable Water Bottles Market Market Share Comparison by Distribution Channel (2016-2032)
- 1. Executive Summary
-
- Klean Kanteen
- Ocean Water
- Hydaway
- Nalgene
- CamelBak Products, LLC
- SIGG Switzerland AG, GmbH
- Contigo
- Tupperware Brands Corporation
- Aquasana Inc.
- S’well
Our Clients


View Our Licence Options
