Reusable Water Bottles Market By Material Type (Plastic, Glass, Stainless Steel, Aluminum), By Distribution Network (Hypermarkets /Supermarkets, Independent Stores, Online Sales, Others), By Region And Companies - Industry Segment Outlook, Market Assessment, Competition Scenario, Trends, And Forecast 2023-2032
22276
June 2023
153
Report Overview
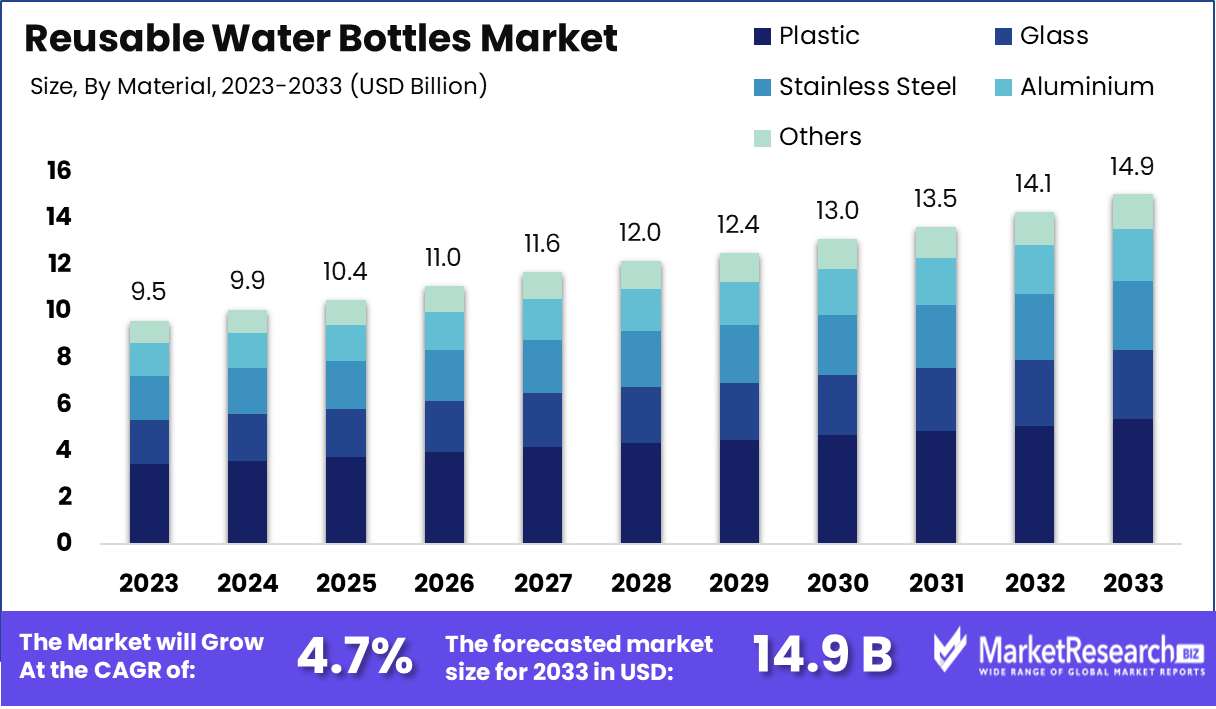
Reusable Water Bottles Market size is expected to be worth around USD 12 Bn by 2032 from USD 8.3 Bn in 2022, growing at a CAGR of 3.9% during the forecast period from 2023 to 2032.
In the realm of contemporary trends, the rise of reusable water bottles has garnered substantial attention and admiration, as individuals across the globe acknowledge the paramount significance of waste reduction and environmental preservation. The market for these reusable containers has experienced a momentous expansion, presenting a diverse array of choices for discerning consumers. In light of this context, the forthcoming research report on the reusable water bottles market aims to furnish a comprehensive overview, encompassing multifaceted aspects such as the market's definition, aspirations, trailblazing innovations, growth trajectory, driving forces, ethical considerations, and potential business applications.
Emanating as a mere subset within the overarching landscape of environmental sustainability, the reusable water bottles market encapsulates a vast panorama of options ranging from rudimentary plastic receptacles to opulent stainless steel alternatives. Over the course of recent years, this domain has burgeoned significantly, aligning with a burgeoning public consciousness regarding the ecological ramifications imposed by disposable plastic water bottles.
At their core, reusable water bottles epitomize an ingenious solution, meticulously engineered for repetitive usage, effectively diminishing the necessity for their single-use counterparts. Within this expansive market, a cornucopia of alternatives thrives, including but not limited to plastic, glass, stainless steel, and aluminum vessels. By virtue of their existence, reusable water bottles proffer a plethora of advantages over their transitory counterparts, encompassing reduced expenditure, diminished ecological footprint, and heightened satisfaction in terms of water's taste and quality.
In an era rife with ceaseless innovation, the reusable water bottles market has borne witness to a plethora of noteworthy advancements that have propelled it to unprecedented heights. Among these striking developments, one finds the advent of insulated bottles, adroitly integrating cutting-edge technology to facilitate optimal temperature retention, ensuring that beverages remain either steaming hot or refreshingly chilled over prolonged durations. Additionally, collapsible bottles have emerged as a marvel of modern engineering, exuding a lightweight disposition and facile portability to cater to the demands of those constantly on the move. Furthermore, self-cleaning bottles, ingeniously employing UV-C technology, assuage concerns surrounding manual maintenance by disinfecting both the bottle and its cap with ease.
Unswervingly bolstered by the escalating cognizance of environmental imperatives and the advantages inherent in reusable merchandise, the reusable water bottles market has perpetuated its upward trajectory, consolidating its position as an industry to be reckoned with. Consequently, its expanse has transcended diverse domains, permeating spheres such as sports and fitness, outdoor activities, travel, and domestic utility. Notably, in a resounding testament to its growing ubiquity, reusable water bottles are progressively permeating workplaces and public arenas, as commercial entities and organizations zealously espouse the cause of sustainability, thus embracing these eco-friendly alternatives.
Driving Factors
Growing Concern over Plastic Pollution and Environmentally Conscious Consumers
Significant factors influencing the demand for reusable water bottles are the growing concern about plastic pollution and the increase in environmentally conscious consumers. Individuals are actively pursuing sustainable alternatives in response to a heightened awareness of the harmful effects of plastic on our planet, resulting in an increase in the popularity of reusable water bottles.
Cost Savings and Environmental Benefits
The potential for cost savings among frequent users is a compelling factor fueling the rising popularity of reusable water bottles. By transitioning to reusable bottles, individuals eliminate their need to purchase disposable plastic bottles repeatedly. This not only results in long-term financial savings, but also contributes to a smaller footprint of plastic waste. In addition, the use of reusable bottles ensures the consumption of water free of harmful compounds such as BPA, which are commonly found in plastic water bottles, thus providing additional health benefits.
Convenience and Portability
The modern way of life, which is characterized by constant mobility and activity, necessitates water vessels that are convenient and portable. Consumers require containers that are easily transportable throughout the day and integrate with their on-the-go lifestyles. Reusable water bottles cater to these demands by providing lightweight options in a variety of sizes and designs, which are tailored to meet the requirements and preferences of a diverse population.
Potential Regulatory Changes and Technological Disruptions
The rising demand for reusable water bottles could prompt regulatory changes that would have a substantial impact on the market. Governments could institute taxes or bans on single-use plastic bottles, for instance, to encourage the adoption of reusable alternatives. In addition, emerging technologies such as smart water bottles that can monitor hydration levels and self-cleaning bottles may introduce disruptive elements to the market, thereby influencing its future trajectory.
Restraining Factors
The Lack of Consumer Awareness
Consumer ignorance is one of the most significant factors inhibiting the development of the reusable bottle market. Many consumers continue to favor single-use plastics because they are more convenient and accessible. Through well-executed marketing campaigns, the public must be made aware of the benefits of using reusable water bottles. On social media platforms, brand websites, and in stores selling reusable water bottles, the message must be reinforced. The significance of reducing plastic waste must be emphasized and made more understandable. We believe that public education and awareness-raising will result in the exponential growth of the reusable bottle market.
The cost of a new car is a major factor in the decision to buy one
The costly initial cost of reusable water bottles presents consumers with an additional significant obstacle. Reusable bottles are more expensive than single-use bottles, which may be discouraging to consumers on a limited budget. Providing discounts and incentives could increase demand for reusable bottles. Manufacturers must also offer a range of prices for reusable bottles to accommodate consumers of varying economic means, allowing everyone to purchase a reusable water bottle.
The availability of Cheap Single Use Alternatives
The availability of inexpensive alternatives for single-use is another significant factor restraining the expansion of the reusable bottle market. It is simpler and less expensive for consumers to purchase single-use plastics, resulting in consumer inertia. Governments and non-profit organizations can limit the production and distribution of single-use plastics to combat this issue. Such policies would promote the use of reusable bottles, thereby reducing plastic pollution and promoting a cleaner environment. To create a sustainable future, we must encourage the adoption of reusable water bottles.
Inconvenience of Carrying Reusable Bottles
The convenience of transporting reusable bottles has presented consumers with a problem. The bottles are typically weighty and cumbersome, making them difficult to transport. Manufacturers should create more portable and lightweight designs to address this issue. The enhanced design will make carrying bottles simpler and more convenient for consumers. In addition to being sleek and fashionable, the design should include attachable carabiners for backpacks and purses.
Material Type Analysis
The reusable water bottles market is segmented by material, with the majority of the market focusing on the following: plastic, metal, and ceramic. In recent years, the plastic material segment has dominated the market among these categories. Reasons for its dominance include lower manufacturing costs and lightweight characteristics. Plastic vessels are lightweight and inexpensive for consumers. In addition, advances in polymer technology have enabled manufacturers to create plastic vessels that are sturdy, BPA-free, and resistant to high temperatures.
The adoption of plastic materials in emerging economies such as India, China, and Brazil is driven by the economic growth of these nations. Increasing middle-class populations in these nations are leading to a rise in disposable income, which in turn is increasing the demand for consumer products such as reusable water bottles. In addition, the increasing number of health-conscious individuals is contributing to the expansion of the market.
Consumers are becoming increasingly aware of the negative environmental effects of single-use plastic bottles. This trend has caused a significant transition towards eco-friendly and sustainable alternatives, such as reusable water bottles. Increasing numbers of consumers prefer plastic bottles produced from recycled materials, resulting in an increase in the production of recycled plastic bottles.
Distribution Network Analysis
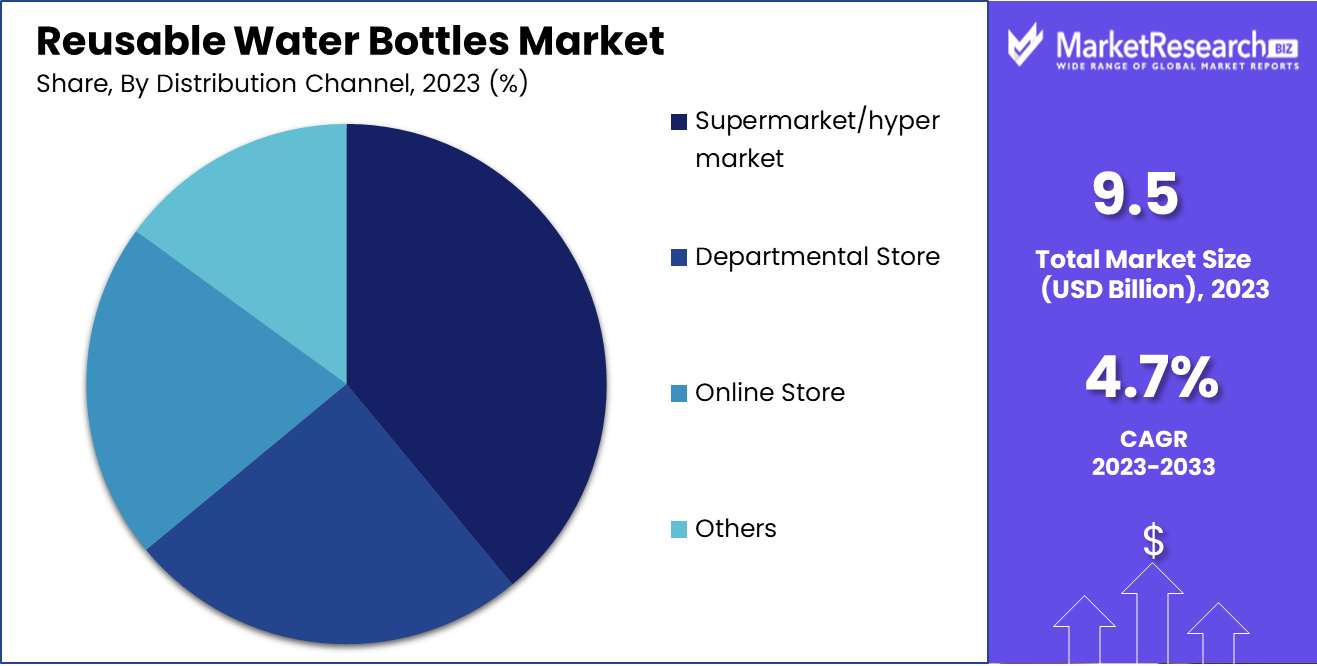
By distribution Network, including supermarkets and hypermarkets, online sales channels, and specialty stores, the reusable water bottles market is segmented. In recent years, supermarkets and hypermarkets have dominated the market due to their extensive reach and convenient accessibility. It is convenient for consumers to purchase reusable water bottles and other products at supermarkets and hypermarkets because they offer a vast selection of goods.
The adoption of the supermarkets and hypermarkets segment in emerging economies such as India, China, and Brazil is driven by their economic growth. Urbanization and the proliferation of supermarkets in these nations are driving the market's expansion. In addition, consumers are drawn to supermarkets and hypermarkets by their increasing demand for convenience and desire for one-stop purchasing solutions.
Due to the convenience of purchasing multiple products under one structure, supermarkets and hypermarkets are favored by consumers. They can discover an extensive selection of reusable water bottles and other items at affordable prices. Additionally, consumers have access to discounts and promotions in these stores, which has led to an increase in the number of consumers who prefer to purchase reusable water bottles from these establishments.
Key Market Segments
By Material Type
- Plastic
- Glass
- Stainless Steel
- Aluminum
By Distribution Network
- Hypermarkets /Supermarkets
- Independent Stores
- Online Sales
- Others
Growth Opportunity
Expanding Opportunities in the Reusable Water Bottles Market Through Customization and Sustainability
Recent years have seen rapid growth in the reusable water bottle market. The need for eco-friendly and sustainable products has led to a surge in demand for reusable water bottles, which has been fueled by an increasing concern for the environment, greater awareness of the harm caused by plastic bottles, and a desire for reusable bottles. Personalized designs and customization options for reusable water bottles have increased on the market as consumers seek to express their individuality and personal style.
Personalized Designs and Customization Options for Reusable Water Bottles
The demand for reusable water bottles with distinctive and personalized designs has increased significantly. Consumers are willing to pay a premium for a container that reflects their individuality and taste. This presents an opportunity for businesses to differentiate themselves in the marketplace by offering consumers customization options. Providing a variety of color options, designs, and even the option to add personalized messages or artwork to the bottles can attract and retain customers, thereby fostering business growth.
Expansion into Eco-Friendly and Sustainable Packaging for the Future
As the demand for sustainability grows, businesses in the reusable water bottle industry can diversify their product offerings to include eco-friendly and sustainable packaging options for other products. By providing sustainable packaging, such as bamboo or recycled materials, for cosmetics, snacks, and other small items, businesses can increase their consumer base and meet the growing demand for sustainable products.
Collaborations with Sports Teams, Organizations, and Influencers to Increase Brand Visibility
Collaboration with sports teams, organizations, and influencers is another opportunity for businesses in the reusable water bottle industry to boost their brand visibility. Partnering with prominent athletes, environmental organizations, and social media influencers can aid in brand promotion, consumer expansion, and sales growth. Additionally, it can serve to promote sustainability and reusable water bottles as a means of reducing waste and preserving the environment.
Latest Trends
Exploring the Growing Trends Shaping the Reusable Water Bottles Market
As consumers place a greater emphasis on sustainable living and eco-friendly products, the market for reusable water bottles has exploded in popularity. From increased availability and accessibility of reusable water bottles to awareness campaigns and government incentives for reducing waste, let's examine the main market trends that are driving this growth in greater detail.
Availability and Accessibility of Reusable Water Bottles
In the past, reusable water bottles were predominantly sold in specialty stores and on the Internet, but they are now widely available. Reusable water bottles are not just a niche product; they are found in grocery stores, petrol stations, workplaces, universities, and even at popular events. It is unsurprising that consumer adoption has increased substantially, given that an increasing number of retail establishments now offer an extensive selection of reusable water bottles at reasonable prices.
Trend Toward Eco-Friendly and Sustainable Products
Reusable water bottles are a prominent example of the trend that has seen consumers become more environmentally conscious in their purchasing decisions over the past decade. Not only are they a practical option for transporting beverages, but their environmental impact is significantly lower than that of single-use water bottles. As more consumers become aware of the environmental problem caused by single-use water bottles, the market for reusable water bottles will continue to expand.
The Support for Local and Small Businesses
When it comes to environmental concerns, small locally-owned enterprises are frequently overlooked. In recent years, however, there has been a shift toward supporting local businesses that promote sustainable products. By purchasing reusable water bottles from small and local businesses, consumers can not only contribute to the local economy but also significantly reduce environmental waste.
Regional Analysis
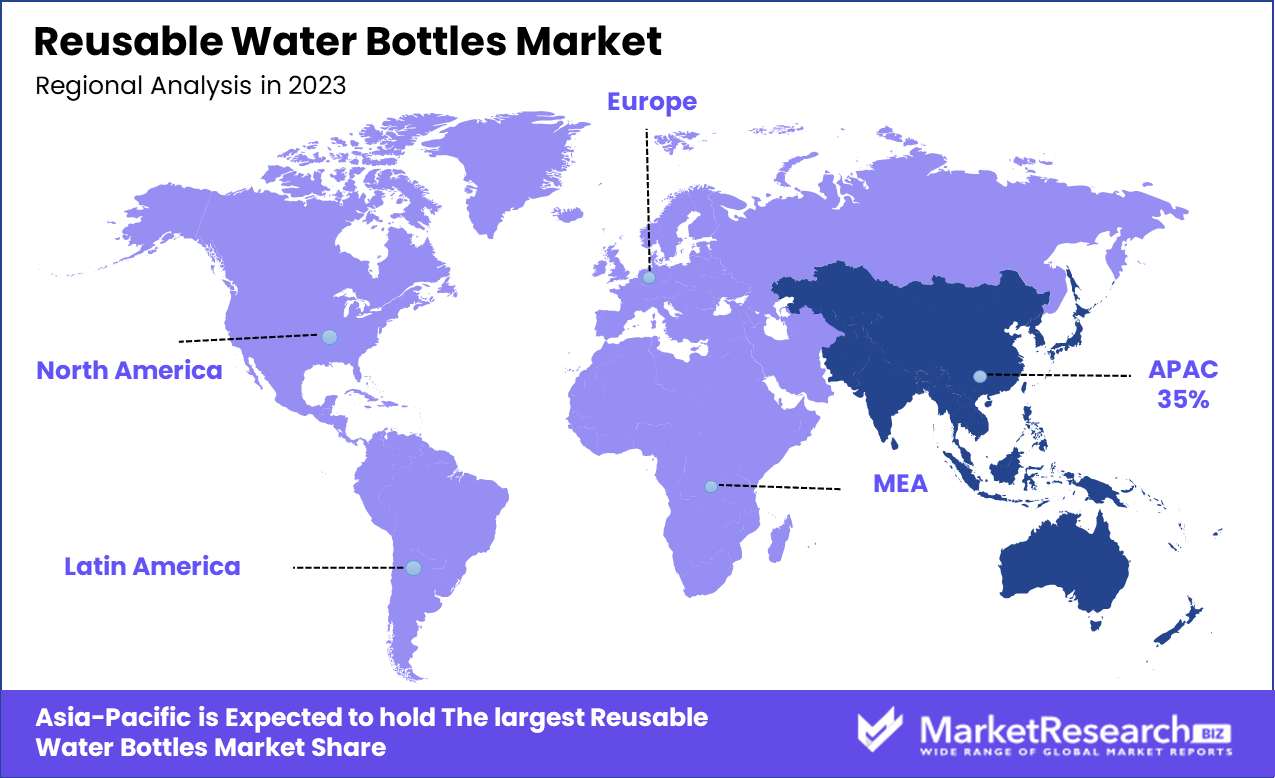
The Asia-Pacific region consists of numerous developing nations, such as China, India, Indonesia, and Vietnam, where environmental concerns have increased in recent years. The region faces a severe plastic pollution problem, with many of its cities ranking among the most polluted urban areas in the globe. The situation has inspired a newfound environmental consciousness, and more and more people are seeking greener solutions.
Furthermore, administrations in the region have been actively promoting sustainable living. For instance, China, the largest market for reusable water bottles in the world, has banned the use of single-use plastics in a number of cities, which has increased the demand for eco-friendly alternatives.
Asia-Pacific has emerged as the dominant participant in the reusable water bottle market due, in part, to the availability of inexpensive products. With a large number of manufacturers in the region, production costs are relatively low, allowing consumers to purchase reusable water bottles at a fraction of the price of their Western counterparts.
The increasing demand for reusable water bottles in Asia and the Pacific is also attributable to a shift in attitudes toward sustainable living. Numerous consumers in the region are currently prepared to pay a premium for environmentally friendly products. They actively search out products that are beneficial to both the environment and their health.
In addition, the rise of social media has led to a greater awareness of the environmental impact of plastic, which has further fueled the demand for reusable water bottles. Influencers and celebrities are increasingly endorsing eco-friendly products, which has increased the number of people switching to reusable water bottles.
Key Regions and Countries
North America
- US
- Canada
- Mexico
Western Europe
- Germany
- France
- The UK
- Spain
- Italy
- Portugal
- Ireland
- Austria
- Switzerland
- Benelux
- Nordic
- Rest of Western Europe
Eastern Europe
- Russia
- Poland
- The Czech Republic
- Greece
- Rest of Eastern Europe
APAC
- China
- Japan
- South Korea
- India
- Australia & New Zealand
- Indonesia
- Malaysia
- Philippines
- Singapore
- Thailand
- Vietnam
- Rest of APAC
Latin America
- Brazil
- Colombia
- Chile
- Argentina
- Costa Rica
- Rest of Latin America
Middle East & Africa
- Algeria
- Egypt
- Israel
- Kuwait
- Nigeria
- Saudi Arabia
- South Africa
- Turkey
- United Arab Emirates
- Rest of MEA
Key Players Analysis
Hydro Flask, a brand of reusable water bottles founded in 2009, has rapidly become one of the most popular brands. The company is known for its insulation technology, which keeps beverages cold for up to 24 hours and heated for 12 hours.
Another well-known brand in the reusable water bottle market is Nalgene, which was founded in the 1940s. Nalgene, renowned for its durable and long-lasting bottles, offers an extensive selection of sizes and styles. Additionally, the company has introduced recently eco-friendly options made from plant-based materials.
CamelBak, a company established in 1989, is well-known for its hydration backpacks and reservoirs, but it also offers reusable water bottles. The brand provides bottles with inventive characteristics, such as self-sealing valves and integrated straws.
Established in 2004, Klean Kanteen is a sustainable and environmentally conscious brand that offers a vast selection of reusable water bottles, including insulated options. The company is dedicated to reducing single-use plastic waste and employs premium materials in its products.
S'well, a company founded in 2010, has taken the reusable water bottle market by storm with its fashionable and fashionable designs. The brand is known for its triple-layered, vacuum-insulated vessels that keep drinks cold for up to 48 hours or hot for up to 24 hours.
Top Key Players in Reusable Water Bottles Market
- Hydro Flask
- Nalgene
- CamelBak
- BRITA GmbH
- Klean Kanteen Inc.
- Tupperware Brands Corporation
- Contigo
- SIGG Switzerland AG
- Aquasana Inc.
- Bulletin Brands Inc.
- Thermos L.L.C.
- Nalge Nunc International Corp
- S'well Corporation
- O2COOL LLC
- Nathan SportsInc.
- Cool Gear International LLC USA Inc.
Recent Development
- In 2022, Hydro Flask, a prominent manufacturer of reusable water bottles, announced with pride that its annual sales will surpass $1 billion. This remarkable achievement not only solidifies Hydro Flask's leadership position on the market but also highlights the increasing demand for sustainable hydration solutions.
- In 2023, S'well, an additional prominent participant in the market for reusable water bottles, announced a partnership with Disney. This collaboration combines S'well's expertise in stylish and eco-friendly designs with Disney's enchantment to create a limited-edition line of water bottles.
Report Scope
Report Features Description Market Value (2022) USD 8.3 Bn Forecast Revenue (2032) USD 12 Bn CAGR (2023-2032) 3.9% Base Year for Estimation 2022 Historic Period 2016-2022 Forecast Period 2023-2032 Report Coverage Revenue Forecast, Market Dynamics, COVID-19 Impact, Competitive Landscape, Recent Developments Segments Covered By Material Type (Plastic, Glass, Stainless Steel, Aluminum)
By Distribution Network (Hypermarkets /Supermarkets, Independent Stores, Online Sales, Others)Regional Analysis North America – The US, Canada, & Mexico; Western Europe – Germany, France, The UK, Spain, Italy, Portugal, Ireland, Austria, Switzerland, Benelux, Nordic, & Rest of Western Europe; Eastern Europe – Russia, Poland, The Czech Republic, Greece, & Rest of Eastern Europe; APAC – China, Japan, South Korea, India, Australia & New Zealand, Indonesia, Malaysia, Philippines, Singapore, Thailand, Vietnam, & Rest of APAC; Latin America – Brazil, Colombia, Chile, Argentina, Costa Rica, & Rest of Latin America; the Middle East & Africa – Algeria, Egypt, Israel, Kuwait, Nigeria, Saudi Arabia, South Africa, Turkey, United Arab Emirates, & Rest of MEA Competitive Landscape Hydro Flask, Nalgene, CamelBak, BRITA GmbH, Klean Kanteen Inc., Tupperware Brands Corporation, Contigo, SIGG Switzerland AG, Aquasana Inc., Bulletin Brands Inc., Thermos L.L.C., Nalge Nunc International Corp, S'well Corporation, O2COOL LLC, Nathan SportsInc., Cool Gear International LLC USA Inc. Customization Scope Customization for segments, region/country-level will be provided. Moreover, additional customization can be done based on the requirements. Purchase Options We have three licenses to opt for Single User License, Multi-User License (Up to 5 Users), Corporate Use License (Unlimited User and Printable PDF) - Hydro Flask
- Nalgene
- CamelBak
- BRITA GmbH
- Klean Kanteen Inc.
- Tupperware Brands Corporation
- Contigo
- SIGG Switzerland AG
- Aquasana Inc.
- Bulletin Brands Inc.
- Thermos L.L.C.
- Nalge Nunc International Corp
- S'well Corporation
- O2COOL LLC
- Nathan SportsInc.
- Cool Gear International LLC USA Inc.
- 1. Executive Summary
- 1.1. Definition
- 1.2. Taxonomy
- 1.3. Research Scope
- 1.4. Key Analysis
- 1.5. Key Findings by Major Segments
- 1.6. Top strategies by Major Players
- 2. Global Reusable Water Bottles Market Overview
- 2.1. Reusable Water Bottles Market Dynamics
- 2.1.1. Drivers
- 2.1.2. Opportunities
- 2.1.3. Restraints
- 2.1.4. Challenges
- 2.2. Macro-economic Factors
- 2.3. Regulatory Framework
- 2.4. Market Investment Feasibility Index
- 2.5. PEST Analysis
- 2.6. PORTER’S Five Force Analysis
- 2.7. Drivers & Restraints Impact Analysis
- 2.8. Industry Chain Analysis
- 2.9. Cost Structure Analysis
- 2.10. Marketing Strategy
- 2.11. Russia-Ukraine War Impact Analysis
- 2.12. Opportunity Map Analysis
- 2.13. Market Competition Scenario Analysis
- 2.14. Product Life Cycle Analysis
- 2.15. Opportunity Orbits
- 2.16. Manufacturer Intensity Map
- 2.17. Major Companies sales by Value & Volume
- 2.1. Reusable Water Bottles Market Dynamics
- 3. Global Reusable Water Bottles Market Analysis, Opportunity and Forecast, 2016-2032
- 3.1. Global Reusable Water Bottles Market Analysis, 2016-2021
- 3.2. Global Reusable Water Bottles Market Opportunity and Forecast, 2023-2032
- 3.3. Global Reusable Water Bottles Market Analysis, Opportunity and Forecast, By Material Type, 2016-2032
- 3.3.1. Global Reusable Water Bottles Market Analysis By Material Type: Introduction
- 3.3.2. Market Size Absolute $ Opportunity Analysis and Forecast, By Material Type, 2016-2032
- 3.3.3. Plastic
- 3.3.4. Glass
- 3.3.5. Stainless Steel
- 3.3.6. Aluminum
- 3.4. Global Reusable Water Bottles Market Analysis, Opportunity and Forecast, By Distribution Network, 2016-2032
- 3.4.1. Global Reusable Water Bottles Market Analysis By Distribution Network: Introduction
- 3.4.2. Market Size Absolute $ Opportunity Analysis and Forecast, By Distribution Network, 2016-2032
- 3.4.3. Hypermarkets /Supermarkets
- 3.4.4. Independent Stores
- 3.4.5. Online Sales
- 3.4.6. Others
- 4. North America Reusable Water Bottles Market Analysis, Opportunity and Forecast, 2016-2032
- 4.1. North America Reusable Water Bottles Market Analysis, 2016-2021
- 4.2. North America Reusable Water Bottles Market Opportunity and Forecast, 2023-2032
- 4.3. North America Reusable Water Bottles Market Analysis, Opportunity and Forecast, By Material Type, 2016-2032
- 4.3.1. North America Reusable Water Bottles Market Analysis By Material Type: Introduction
- 4.3.2. Market Size Absolute $ Opportunity Analysis and Forecast, By Material Type, 2016-2032
- 4.3.3. Plastic
- 4.3.4. Glass
- 4.3.5. Stainless Steel
- 4.3.6. Aluminum
- 4.4. North America Reusable Water Bottles Market Analysis, Opportunity and Forecast, By Distribution Network, 2016-2032
- 4.4.1. North America Reusable Water Bottles Market Analysis By Distribution Network: Introduction
- 4.4.2. Market Size Absolute $ Opportunity Analysis and Forecast, By Distribution Network, 2016-2032
- 4.4.3. Hypermarkets /Supermarkets
- 4.4.4. Independent Stores
- 4.4.5. Online Sales
- 4.4.6. Others
- 4.5. North America Reusable Water Bottles Market Analysis, Opportunity and Forecast, By Country, 2016-2032
- 4.5.1. North America Reusable Water Bottles Market Analysis by Country : Introduction
- 4.5.2. Market Size Absolute $ Opportunity Analysis and Forecast, Country, 2016-2032
- 4.5.2.1. The US
- 4.5.2.2. Canada
- 4.5.2.3. Mexico
- 5. Western Europe Reusable Water Bottles Market Analysis, Opportunity and Forecast, 2016-2032
- 5.1. Western Europe Reusable Water Bottles Market Analysis, 2016-2021
- 5.2. Western Europe Reusable Water Bottles Market Opportunity and Forecast, 2023-2032
- 5.3. Western Europe Reusable Water Bottles Market Analysis, Opportunity and Forecast, By Material Type, 2016-2032
- 5.3.1. Western Europe Reusable Water Bottles Market Analysis By Material Type: Introduction
- 5.3.2. Market Size Absolute $ Opportunity Analysis and Forecast, By Material Type, 2016-2032
- 5.3.3. Plastic
- 5.3.4. Glass
- 5.3.5. Stainless Steel
- 5.3.6. Aluminum
- 5.4. Western Europe Reusable Water Bottles Market Analysis, Opportunity and Forecast, By Distribution Network, 2016-2032
- 5.4.1. Western Europe Reusable Water Bottles Market Analysis By Distribution Network: Introduction
- 5.4.2. Market Size Absolute $ Opportunity Analysis and Forecast, By Distribution Network, 2016-2032
- 5.4.3. Hypermarkets /Supermarkets
- 5.4.4. Independent Stores
- 5.4.5. Online Sales
- 5.4.6. Others
- 5.5. Western Europe Reusable Water Bottles Market Analysis, Opportunity and Forecast, By Country, 2016-2032
- 5.5.1. Western Europe Reusable Water Bottles Market Analysis by Country : Introduction
- 5.5.2. Market Size Absolute $ Opportunity Analysis and Forecast, Country, 2016-2032
- 5.5.2.1. Germany
- 5.5.2.2. France
- 5.5.2.3. The UK
- 5.5.2.4. Spain
- 5.5.2.5. Italy
- 5.5.2.6. Portugal
- 5.5.2.7. Ireland
- 5.5.2.8. Austria
- 5.5.2.9. Switzerland
- 5.5.2.10. Benelux
- 5.5.2.11. Nordic
- 5.5.2.12. Rest of Western Europe
- 6. Eastern Europe Reusable Water Bottles Market Analysis, Opportunity and Forecast, 2016-2032
- 6.1. Eastern Europe Reusable Water Bottles Market Analysis, 2016-2021
- 6.2. Eastern Europe Reusable Water Bottles Market Opportunity and Forecast, 2023-2032
- 6.3. Eastern Europe Reusable Water Bottles Market Analysis, Opportunity and Forecast, By Material Type, 2016-2032
- 6.3.1. Eastern Europe Reusable Water Bottles Market Analysis By Material Type: Introduction
- 6.3.2. Market Size Absolute $ Opportunity Analysis and Forecast, By Material Type, 2016-2032
- 6.3.3. Plastic
- 6.3.4. Glass
- 6.3.5. Stainless Steel
- 6.3.6. Aluminum
- 6.4. Eastern Europe Reusable Water Bottles Market Analysis, Opportunity and Forecast, By Distribution Network, 2016-2032
- 6.4.1. Eastern Europe Reusable Water Bottles Market Analysis By Distribution Network: Introduction
- 6.4.2. Market Size Absolute $ Opportunity Analysis and Forecast, By Distribution Network, 2016-2032
- 6.4.3. Hypermarkets /Supermarkets
- 6.4.4. Independent Stores
- 6.4.5. Online Sales
- 6.4.6. Others
- 6.5. Eastern Europe Reusable Water Bottles Market Analysis, Opportunity and Forecast, By Country, 2016-2032
- 6.5.1. Eastern Europe Reusable Water Bottles Market Analysis by Country : Introduction
- 6.5.2. Market Size Absolute $ Opportunity Analysis and Forecast, Country, 2016-2032
- 6.5.2.1. Russia
- 6.5.2.2. Poland
- 6.5.2.3. The Czech Republic
- 6.5.2.4. Greece
- 6.5.2.5. Rest of Eastern Europe
- 7. APAC Reusable Water Bottles Market Analysis, Opportunity and Forecast, 2016-2032
- 7.1. APAC Reusable Water Bottles Market Analysis, 2016-2021
- 7.2. APAC Reusable Water Bottles Market Opportunity and Forecast, 2023-2032
- 7.3. APAC Reusable Water Bottles Market Analysis, Opportunity and Forecast, By Material Type, 2016-2032
- 7.3.1. APAC Reusable Water Bottles Market Analysis By Material Type: Introduction
- 7.3.2. Market Size Absolute $ Opportunity Analysis and Forecast, By Material Type, 2016-2032
- 7.3.3. Plastic
- 7.3.4. Glass
- 7.3.5. Stainless Steel
- 7.3.6. Aluminum
- 7.4. APAC Reusable Water Bottles Market Analysis, Opportunity and Forecast, By Distribution Network, 2016-2032
- 7.4.1. APAC Reusable Water Bottles Market Analysis By Distribution Network: Introduction
- 7.4.2. Market Size Absolute $ Opportunity Analysis and Forecast, By Distribution Network, 2016-2032
- 7.4.3. Hypermarkets /Supermarkets
- 7.4.4. Independent Stores
- 7.4.5. Online Sales
- 7.4.6. Others
- 7.5. APAC Reusable Water Bottles Market Analysis, Opportunity and Forecast, By Country, 2016-2032
- 7.5.1. APAC Reusable Water Bottles Market Analysis by Country : Introduction
- 7.5.2. Market Size Absolute $ Opportunity Analysis and Forecast, Country, 2016-2032
- 7.5.2.1. China
- 7.5.2.2. Japan
- 7.5.2.3. South Korea
- 7.5.2.4. India
- 7.5.2.5. Australia & New Zeland
- 7.5.2.6. Indonesia
- 7.5.2.7. Malaysia
- 7.5.2.8. Philippines
- 7.5.2.9. Singapore
- 7.5.2.10. Thailand
- 7.5.2.11. Vietnam
- 7.5.2.12. Rest of APAC
- 8. Latin America Reusable Water Bottles Market Analysis, Opportunity and Forecast, 2016-2032
- 8.1. Latin America Reusable Water Bottles Market Analysis, 2016-2021
- 8.2. Latin America Reusable Water Bottles Market Opportunity and Forecast, 2023-2032
- 8.3. Latin America Reusable Water Bottles Market Analysis, Opportunity and Forecast, By Material Type, 2016-2032
- 8.3.1. Latin America Reusable Water Bottles Market Analysis By Material Type: Introduction
- 8.3.2. Market Size Absolute $ Opportunity Analysis and Forecast, By Material Type, 2016-2032
- 8.3.3. Plastic
- 8.3.4. Glass
- 8.3.5. Stainless Steel
- 8.3.6. Aluminum
- 8.4. Latin America Reusable Water Bottles Market Analysis, Opportunity and Forecast, By Distribution Network, 2016-2032
- 8.4.1. Latin America Reusable Water Bottles Market Analysis By Distribution Network: Introduction
- 8.4.2. Market Size Absolute $ Opportunity Analysis and Forecast, By Distribution Network, 2016-2032
- 8.4.3. Hypermarkets /Supermarkets
- 8.4.4. Independent Stores
- 8.4.5. Online Sales
- 8.4.6. Others
- 8.5. Latin America Reusable Water Bottles Market Analysis, Opportunity and Forecast, By Country, 2016-2032
- 8.5.1. Latin America Reusable Water Bottles Market Analysis by Country : Introduction
- 8.5.2. Market Size Absolute $ Opportunity Analysis and Forecast, Country, 2016-2032
- 8.5.2.1. Brazil
- 8.5.2.2. Colombia
- 8.5.2.3. Chile
- 8.5.2.4. Argentina
- 8.5.2.5. Costa Rica
- 8.5.2.6. Rest of Latin America
- 9. Middle East & Africa Reusable Water Bottles Market Analysis, Opportunity and Forecast, 2016-2032
- 9.1. Middle East & Africa Reusable Water Bottles Market Analysis, 2016-2021
- 9.2. Middle East & Africa Reusable Water Bottles Market Opportunity and Forecast, 2023-2032
- 9.3. Middle East & Africa Reusable Water Bottles Market Analysis, Opportunity and Forecast, By Material Type, 2016-2032
- 9.3.1. Middle East & Africa Reusable Water Bottles Market Analysis By Material Type: Introduction
- 9.3.2. Market Size Absolute $ Opportunity Analysis and Forecast, By Material Type, 2016-2032
- 9.3.3. Plastic
- 9.3.4. Glass
- 9.3.5. Stainless Steel
- 9.3.6. Aluminum
- 9.4. Middle East & Africa Reusable Water Bottles Market Analysis, Opportunity and Forecast, By Distribution Network, 2016-2032
- 9.4.1. Middle East & Africa Reusable Water Bottles Market Analysis By Distribution Network: Introduction
- 9.4.2. Market Size Absolute $ Opportunity Analysis and Forecast, By Distribution Network, 2016-2032
- 9.4.3. Hypermarkets /Supermarkets
- 9.4.4. Independent Stores
- 9.4.5. Online Sales
- 9.4.6. Others
- 9.5. Middle East & Africa Reusable Water Bottles Market Analysis, Opportunity and Forecast, By Country, 2016-2032
- 9.5.1. Middle East & Africa Reusable Water Bottles Market Analysis by Country : Introduction
- 9.5.2. Market Size Absolute $ Opportunity Analysis and Forecast, Country, 2016-2032
- 9.5.2.1. Algeria
- 9.5.2.2. Egypt
- 9.5.2.3. Israel
- 9.5.2.4. Kuwait
- 9.5.2.5. Nigeria
- 9.5.2.6. Saudi Arabia
- 9.5.2.7. South Africa
- 9.5.2.8. Turkey
- 9.5.2.9. The UAE
- 9.5.2.10. Rest of MEA
- 10. Global Reusable Water Bottles Market Analysis, Opportunity and Forecast, By Region, 2016-2032
- 10.1. Global Reusable Water Bottles Market Analysis by Region : Introduction
- 10.2. Market Size Absolute $ Opportunity Analysis and Forecast, By Region, 2016-2032
- 10.2.1. North America
- 10.2.2. Western Europe
- 10.2.3. Eastern Europe
- 10.2.4. APAC
- 10.2.5. Latin America
- 10.2.6. Middle East & Africa
- 11. Global Reusable Water Bottles Market Competitive Landscape, Market Share Analysis, and Company Profiles
- 11.1. Market Share Analysis
- 11.2. Company Profiles
- 11.3. Hydro Flask
- 11.3.1. Company Overview
- 11.3.2. Financial Highlights
- 11.3.3. Product Portfolio
- 11.3.4. SWOT Analysis
- 11.3.5. Key Strategies and Developments
- 11.4. Nalgene
- 11.4.1. Company Overview
- 11.4.2. Financial Highlights
- 11.4.3. Product Portfolio
- 11.4.4. SWOT Analysis
- 11.4.5. Key Strategies and Developments
- 11.5. CamelBak
- 11.5.1. Company Overview
- 11.5.2. Financial Highlights
- 11.5.3. Product Portfolio
- 11.5.4. SWOT Analysis
- 11.5.5. Key Strategies and Developments
- 11.6. BRITA GmbH
- 11.6.1. Company Overview
- 11.6.2. Financial Highlights
- 11.6.3. Product Portfolio
- 11.6.4. SWOT Analysis
- 11.6.5. Key Strategies and Developments
- 11.7. Klean Kanteen Inc.
- 11.7.1. Company Overview
- 11.7.2. Financial Highlights
- 11.7.3. Product Portfolio
- 11.7.4. SWOT Analysis
- 11.7.5. Key Strategies and Developments
- 11.8. Tupperware Brands Corporation
- 11.8.1. Company Overview
- 11.8.2. Financial Highlights
- 11.8.3. Product Portfolio
- 11.8.4. SWOT Analysis
- 11.8.5. Key Strategies and Developments
- 11.9. Contigo
- 11.9.1. Company Overview
- 11.9.2. Financial Highlights
- 11.9.3. Product Portfolio
- 11.9.4. SWOT Analysis
- 11.9.5. Key Strategies and Developments
- 11.10. SIGG Switzerland AG
- 11.10.1. Company Overview
- 11.10.2. Financial Highlights
- 11.10.3. Product Portfolio
- 11.10.4. SWOT Analysis
- 11.10.5. Key Strategies and Developments
- 11.11. Aquasana Inc.
- 11.11.1. Company Overview
- 11.11.2. Financial Highlights
- 11.11.3. Product Portfolio
- 11.11.4. SWOT Analysis
- 11.11.5. Key Strategies and Developments
- 11.12. Bulletin Brands Inc.
- 11.12.1. Company Overview
- 11.12.2. Financial Highlights
- 11.12.3. Product Portfolio
- 11.12.4. SWOT Analysis
- 11.12.5. Key Strategies and Developments
- 11.13. Thermos L.L.C.
- 11.13.1. Company Overview
- 11.13.2. Financial Highlights
- 11.13.3. Product Portfolio
- 11.13.4. SWOT Analysis
- 11.13.5. Key Strategies and Developments
- 11.14. Nalge Nunc International Corp
- 11.14.1. Company Overview
- 11.14.2. Financial Highlights
- 11.14.3. Product Portfolio
- 11.14.4. SWOT Analysis
- 11.14.5. Key Strategies and Developments
- 11.15. S'well Corporation
- 11.15.1. Company Overview
- 11.15.2. Financial Highlights
- 11.15.3. Product Portfolio
- 11.15.4. SWOT Analysis
- 11.15.5. Key Strategies and Developments
- 11.16. O2COOL LLC
- 11.16.1. Company Overview
- 11.16.2. Financial Highlights
- 11.16.3. Product Portfolio
- 11.16.4. SWOT Analysis
- 11.16.5. Key Strategies and Developments
- 11.17. Nathan SportsInc.
- 11.17.1. Company Overview
- 11.17.2. Financial Highlights
- 11.17.3. Product Portfolio
- 11.17.4. SWOT Analysis
- 11.17.5. Key Strategies and Developments
- 11.18. Cool Gear International LLC USA Inc.
- 11.18.1. Company Overview
- 11.18.2. Financial Highlights
- 11.18.3. Product Portfolio
- 11.18.4. SWOT Analysis
- 11.18.5. Key Strategies and Developments
- 12. Assumptions and Acronyms
- 13. Research Methodology
- 14. Contact
- Figure 1: Global Reusable Water Bottles Market Revenue (US$ Mn) Market Share By Material Type in 2022
- Figure 2: Global Reusable Water Bottles Market Attractiveness Analysis By Material Type, 2016-2032
- Figure 3: Global Reusable Water Bottles Market Revenue (US$ Mn) Market Share By Distribution Networkin 2022
- Figure 4: Global Reusable Water Bottles Market Attractiveness Analysis By Distribution Network, 2016-2032
- Figure 5: Global Reusable Water Bottles Market Revenue (US$ Mn) Market Share by Region in 2022
- Figure 6: Global Reusable Water Bottles Market Attractiveness Analysis by Region, 2016-2032
- Figure 7: Global Reusable Water Bottles Market Revenue (US$ Mn) (2016-2032)
- Figure 8: Global Reusable Water Bottles Market Revenue (US$ Mn) Comparison by Region (2016-2032)
- Figure 9: Global Reusable Water Bottles Market Revenue (US$ Mn) Comparison By Material Type (2016-2032)
- Figure 10: Global Reusable Water Bottles Market Revenue (US$ Mn) Comparison By Distribution Network (2016-2032)
- Figure 11: Global Reusable Water Bottles Market Y-o-Y Growth Rate Comparison by Region (2016-2032)
- Figure 12: Global Reusable Water Bottles Market Y-o-Y Growth Rate Comparison By Material Type (2016-2032)
- Figure 13: Global Reusable Water Bottles Market Y-o-Y Growth Rate Comparison By Distribution Network (2016-2032)
- Figure 14: Global Reusable Water Bottles Market Share Comparison by Region (2016-2032)
- Figure 15: Global Reusable Water Bottles Market Share Comparison By Material Type (2016-2032)
- Figure 16: Global Reusable Water Bottles Market Share Comparison By Distribution Network (2016-2032)
- Figure 17: North America Reusable Water Bottles Market Revenue (US$ Mn) Market Share By Material Typein 2022
- Figure 18: North America Reusable Water Bottles Market Attractiveness Analysis By Material Type, 2016-2032
- Figure 19: North America Reusable Water Bottles Market Revenue (US$ Mn) Market Share By Distribution Networkin 2022
- Figure 20: North America Reusable Water Bottles Market Attractiveness Analysis By Distribution Network, 2016-2032
- Figure 21: North America Reusable Water Bottles Market Revenue (US$ Mn) Market Share by Country in 2022
- Figure 22: North America Reusable Water Bottles Market Attractiveness Analysis by Country, 2016-2032
- Figure 23: North America Reusable Water Bottles Market Revenue (US$ Mn) (2016-2032)
- Figure 24: North America Reusable Water Bottles Market Revenue (US$ Mn) Comparison by Country (2016-2032)
- Figure 25: North America Reusable Water Bottles Market Revenue (US$ Mn) Comparison By Material Type (2016-2032)
- Figure 26: North America Reusable Water Bottles Market Revenue (US$ Mn) Comparison By Distribution Network (2016-2032)
- Figure 27: North America Reusable Water Bottles Market Y-o-Y Growth Rate Comparison by Country (2016-2032)
- Figure 28: North America Reusable Water Bottles Market Y-o-Y Growth Rate Comparison By Material Type (2016-2032)
- Figure 29: North America Reusable Water Bottles Market Y-o-Y Growth Rate Comparison By Distribution Network (2016-2032)
- Figure 30: North America Reusable Water Bottles Market Share Comparison by Country (2016-2032)
- Figure 31: North America Reusable Water Bottles Market Share Comparison By Material Type (2016-2032)
- Figure 32: North America Reusable Water Bottles Market Share Comparison By Distribution Network (2016-2032)
- Figure 33: Western Europe Reusable Water Bottles Market Revenue (US$ Mn) Market Share By Material Typein 2022
- Figure 34: Western Europe Reusable Water Bottles Market Attractiveness Analysis By Material Type, 2016-2032
- Figure 35: Western Europe Reusable Water Bottles Market Revenue (US$ Mn) Market Share By Distribution Networkin 2022
- Figure 36: Western Europe Reusable Water Bottles Market Attractiveness Analysis By Distribution Network, 2016-2032
- Figure 37: Western Europe Reusable Water Bottles Market Revenue (US$ Mn) Market Share by Country in 2022
- Figure 38: Western Europe Reusable Water Bottles Market Attractiveness Analysis by Country, 2016-2032
- Figure 39: Western Europe Reusable Water Bottles Market Revenue (US$ Mn) (2016-2032)
- Figure 40: Western Europe Reusable Water Bottles Market Revenue (US$ Mn) Comparison by Country (2016-2032)
- Figure 41: Western Europe Reusable Water Bottles Market Revenue (US$ Mn) Comparison By Material Type (2016-2032)
- Figure 42: Western Europe Reusable Water Bottles Market Revenue (US$ Mn) Comparison By Distribution Network (2016-2032)
- Figure 43: Western Europe Reusable Water Bottles Market Y-o-Y Growth Rate Comparison by Country (2016-2032)
- Figure 44: Western Europe Reusable Water Bottles Market Y-o-Y Growth Rate Comparison By Material Type (2016-2032)
- Figure 45: Western Europe Reusable Water Bottles Market Y-o-Y Growth Rate Comparison By Distribution Network (2016-2032)
- Figure 46: Western Europe Reusable Water Bottles Market Share Comparison by Country (2016-2032)
- Figure 47: Western Europe Reusable Water Bottles Market Share Comparison By Material Type (2016-2032)
- Figure 48: Western Europe Reusable Water Bottles Market Share Comparison By Distribution Network (2016-2032)
- Figure 49: Eastern Europe Reusable Water Bottles Market Revenue (US$ Mn) Market Share By Material Typein 2022
- Figure 50: Eastern Europe Reusable Water Bottles Market Attractiveness Analysis By Material Type, 2016-2032
- Figure 51: Eastern Europe Reusable Water Bottles Market Revenue (US$ Mn) Market Share By Distribution Networkin 2022
- Figure 52: Eastern Europe Reusable Water Bottles Market Attractiveness Analysis By Distribution Network, 2016-2032
- Figure 53: Eastern Europe Reusable Water Bottles Market Revenue (US$ Mn) Market Share by Country in 2022
- Figure 54: Eastern Europe Reusable Water Bottles Market Attractiveness Analysis by Country, 2016-2032
- Figure 55: Eastern Europe Reusable Water Bottles Market Revenue (US$ Mn) (2016-2032)
- Figure 56: Eastern Europe Reusable Water Bottles Market Revenue (US$ Mn) Comparison by Country (2016-2032)
- Figure 57: Eastern Europe Reusable Water Bottles Market Revenue (US$ Mn) Comparison By Material Type (2016-2032)
- Figure 58: Eastern Europe Reusable Water Bottles Market Revenue (US$ Mn) Comparison By Distribution Network (2016-2032)
- Figure 59: Eastern Europe Reusable Water Bottles Market Y-o-Y Growth Rate Comparison by Country (2016-2032)
- Figure 60: Eastern Europe Reusable Water Bottles Market Y-o-Y Growth Rate Comparison By Material Type (2016-2032)
- Figure 61: Eastern Europe Reusable Water Bottles Market Y-o-Y Growth Rate Comparison By Distribution Network (2016-2032)
- Figure 62: Eastern Europe Reusable Water Bottles Market Share Comparison by Country (2016-2032)
- Figure 63: Eastern Europe Reusable Water Bottles Market Share Comparison By Material Type (2016-2032)
- Figure 64: Eastern Europe Reusable Water Bottles Market Share Comparison By Distribution Network (2016-2032)
- Figure 65: APAC Reusable Water Bottles Market Revenue (US$ Mn) Market Share By Material Typein 2022
- Figure 66: APAC Reusable Water Bottles Market Attractiveness Analysis By Material Type, 2016-2032
- Figure 67: APAC Reusable Water Bottles Market Revenue (US$ Mn) Market Share By Distribution Networkin 2022
- Figure 68: APAC Reusable Water Bottles Market Attractiveness Analysis By Distribution Network, 2016-2032
- Figure 69: APAC Reusable Water Bottles Market Revenue (US$ Mn) Market Share by Country in 2022
- Figure 70: APAC Reusable Water Bottles Market Attractiveness Analysis by Country, 2016-2032
- Figure 71: APAC Reusable Water Bottles Market Revenue (US$ Mn) (2016-2032)
- Figure 72: APAC Reusable Water Bottles Market Revenue (US$ Mn) Comparison by Country (2016-2032)
- Figure 73: APAC Reusable Water Bottles Market Revenue (US$ Mn) Comparison By Material Type (2016-2032)
- Figure 74: APAC Reusable Water Bottles Market Revenue (US$ Mn) Comparison By Distribution Network (2016-2032)
- Figure 75: APAC Reusable Water Bottles Market Y-o-Y Growth Rate Comparison by Country (2016-2032)
- Figure 76: APAC Reusable Water Bottles Market Y-o-Y Growth Rate Comparison By Material Type (2016-2032)
- Figure 77: APAC Reusable Water Bottles Market Y-o-Y Growth Rate Comparison By Distribution Network (2016-2032)
- Figure 78: APAC Reusable Water Bottles Market Share Comparison by Country (2016-2032)
- Figure 79: APAC Reusable Water Bottles Market Share Comparison By Material Type (2016-2032)
- Figure 80: APAC Reusable Water Bottles Market Share Comparison By Distribution Network (2016-2032)
- Figure 81: Latin America Reusable Water Bottles Market Revenue (US$ Mn) Market Share By Material Typein 2022
- Figure 82: Latin America Reusable Water Bottles Market Attractiveness Analysis By Material Type, 2016-2032
- Figure 83: Latin America Reusable Water Bottles Market Revenue (US$ Mn) Market Share By Distribution Networkin 2022
- Figure 84: Latin America Reusable Water Bottles Market Attractiveness Analysis By Distribution Network, 2016-2032
- Figure 85: Latin America Reusable Water Bottles Market Revenue (US$ Mn) Market Share by Country in 2022
- Figure 86: Latin America Reusable Water Bottles Market Attractiveness Analysis by Country, 2016-2032
- Figure 87: Latin America Reusable Water Bottles Market Revenue (US$ Mn) (2016-2032)
- Figure 88: Latin America Reusable Water Bottles Market Revenue (US$ Mn) Comparison by Country (2016-2032)
- Figure 89: Latin America Reusable Water Bottles Market Revenue (US$ Mn) Comparison By Material Type (2016-2032)
- Figure 90: Latin America Reusable Water Bottles Market Revenue (US$ Mn) Comparison By Distribution Network (2016-2032)
- Figure 91: Latin America Reusable Water Bottles Market Y-o-Y Growth Rate Comparison by Country (2016-2032)
- Figure 92: Latin America Reusable Water Bottles Market Y-o-Y Growth Rate Comparison By Material Type (2016-2032)
- Figure 93: Latin America Reusable Water Bottles Market Y-o-Y Growth Rate Comparison By Distribution Network (2016-2032)
- Figure 94: Latin America Reusable Water Bottles Market Share Comparison by Country (2016-2032)
- Figure 95: Latin America Reusable Water Bottles Market Share Comparison By Material Type (2016-2032)
- Figure 96: Latin America Reusable Water Bottles Market Share Comparison By Distribution Network (2016-2032)
- Figure 97: Middle East & Africa Reusable Water Bottles Market Revenue (US$ Mn) Market Share By Material Typein 2022
- Figure 98: Middle East & Africa Reusable Water Bottles Market Attractiveness Analysis By Material Type, 2016-2032
- Figure 99: Middle East & Africa Reusable Water Bottles Market Revenue (US$ Mn) Market Share By Distribution Networkin 2022
- Figure 100: Middle East & Africa Reusable Water Bottles Market Attractiveness Analysis By Distribution Network, 2016-2032
- Figure 101: Middle East & Africa Reusable Water Bottles Market Revenue (US$ Mn) Market Share by Country in 2022
- Figure 102: Middle East & Africa Reusable Water Bottles Market Attractiveness Analysis by Country, 2016-2032
- Figure 103: Middle East & Africa Reusable Water Bottles Market Revenue (US$ Mn) (2016-2032)
- Figure 104: Middle East & Africa Reusable Water Bottles Market Revenue (US$ Mn) Comparison by Country (2016-2032)
- Figure 105: Middle East & Africa Reusable Water Bottles Market Revenue (US$ Mn) Comparison By Material Type (2016-2032)
- Figure 106: Middle East & Africa Reusable Water Bottles Market Revenue (US$ Mn) Comparison By Distribution Network (2016-2032)
- Figure 107: Middle East & Africa Reusable Water Bottles Market Y-o-Y Growth Rate Comparison by Country (2016-2032)
- Figure 108: Middle East & Africa Reusable Water Bottles Market Y-o-Y Growth Rate Comparison By Material Type (2016-2032)
- Figure 109: Middle East & Africa Reusable Water Bottles Market Y-o-Y Growth Rate Comparison By Distribution Network (2016-2032)
- Figure 110: Middle East & Africa Reusable Water Bottles Market Share Comparison by Country (2016-2032)
- Figure 111: Middle East & Africa Reusable Water Bottles Market Share Comparison By Material Type (2016-2032)
- Figure 112: Middle East & Africa Reusable Water Bottles Market Share Comparison By Distribution Network (2016-2032)
- Table 1: Global Reusable Water Bottles Market Comparison By Material Type (2016-2032)
- Table 2: Global Reusable Water Bottles Market Comparison By Distribution Network (2016-2032)
- Table 3: Global Reusable Water Bottles Market Revenue (US$ Mn) Comparison by Region (2016-2032)
- Table 4: Global Reusable Water Bottles Market Revenue (US$ Mn) (2016-2032)
- Table 5: Global Reusable Water Bottles Market Revenue (US$ Mn) Comparison by Region (2016-2032)
- Table 6: Global Reusable Water Bottles Market Revenue (US$ Mn) Comparison By Material Type (2016-2032)
- Table 7: Global Reusable Water Bottles Market Revenue (US$ Mn) Comparison By Distribution Network (2016-2032)
- Table 8: Global Reusable Water Bottles Market Y-o-Y Growth Rate Comparison by Region (2016-2032)
- Table 9: Global Reusable Water Bottles Market Y-o-Y Growth Rate Comparison By Material Type (2016-2032)
- Table 10: Global Reusable Water Bottles Market Y-o-Y Growth Rate Comparison By Distribution Network (2016-2032)
- Table 11: Global Reusable Water Bottles Market Share Comparison by Region (2016-2032)
- Table 12: Global Reusable Water Bottles Market Share Comparison By Material Type (2016-2032)
- Table 13: Global Reusable Water Bottles Market Share Comparison By Distribution Network (2016-2032)
- Table 14: North America Reusable Water Bottles Market Comparison By Distribution Network (2016-2032)
- Table 15: North America Reusable Water Bottles Market Revenue (US$ Mn) Comparison by Country (2016-2032)
- Table 16: North America Reusable Water Bottles Market Revenue (US$ Mn) (2016-2032)
- Table 17: North America Reusable Water Bottles Market Revenue (US$ Mn) Comparison by Country (2016-2032)
- Table 18: North America Reusable Water Bottles Market Revenue (US$ Mn) Comparison By Material Type (2016-2032)
- Table 19: North America Reusable Water Bottles Market Revenue (US$ Mn) Comparison By Distribution Network (2016-2032)
- Table 20: North America Reusable Water Bottles Market Y-o-Y Growth Rate Comparison by Country (2016-2032)
- Table 21: North America Reusable Water Bottles Market Y-o-Y Growth Rate Comparison By Material Type (2016-2032)
- Table 22: North America Reusable Water Bottles Market Y-o-Y Growth Rate Comparison By Distribution Network (2016-2032)
- Table 23: North America Reusable Water Bottles Market Share Comparison by Country (2016-2032)
- Table 24: North America Reusable Water Bottles Market Share Comparison By Material Type (2016-2032)
- Table 25: North America Reusable Water Bottles Market Share Comparison By Distribution Network (2016-2032)
- Table 26: Western Europe Reusable Water Bottles Market Comparison By Material Type (2016-2032)
- Table 27: Western Europe Reusable Water Bottles Market Comparison By Distribution Network (2016-2032)
- Table 28: Western Europe Reusable Water Bottles Market Revenue (US$ Mn) Comparison by Country (2016-2032)
- Table 29: Western Europe Reusable Water Bottles Market Revenue (US$ Mn) (2016-2032)
- Table 30: Western Europe Reusable Water Bottles Market Revenue (US$ Mn) Comparison by Country (2016-2032)
- Table 31: Western Europe Reusable Water Bottles Market Revenue (US$ Mn) Comparison By Material Type (2016-2032)
- Table 32: Western Europe Reusable Water Bottles Market Revenue (US$ Mn) Comparison By Distribution Network (2016-2032)
- Table 33: Western Europe Reusable Water Bottles Market Y-o-Y Growth Rate Comparison by Country (2016-2032)
- Table 34: Western Europe Reusable Water Bottles Market Y-o-Y Growth Rate Comparison By Material Type (2016-2032)
- Table 35: Western Europe Reusable Water Bottles Market Y-o-Y Growth Rate Comparison By Distribution Network (2016-2032)
- Table 36: Western Europe Reusable Water Bottles Market Share Comparison by Country (2016-2032)
- Table 37: Western Europe Reusable Water Bottles Market Share Comparison By Material Type (2016-2032)
- Table 38: Western Europe Reusable Water Bottles Market Share Comparison By Distribution Network (2016-2032)
- Table 39: Eastern Europe Reusable Water Bottles Market Comparison By Material Type (2016-2032)
- Table 40: Eastern Europe Reusable Water Bottles Market Comparison By Distribution Network (2016-2032)
- Table 41: Eastern Europe Reusable Water Bottles Market Revenue (US$ Mn) Comparison by Country (2016-2032)
- Table 42: Eastern Europe Reusable Water Bottles Market Revenue (US$ Mn) (2016-2032)
- Table 43: Eastern Europe Reusable Water Bottles Market Revenue (US$ Mn) Comparison by Country (2016-2032)
- Table 44: Eastern Europe Reusable Water Bottles Market Revenue (US$ Mn) Comparison By Material Type (2016-2032)
- Table 45: Eastern Europe Reusable Water Bottles Market Revenue (US$ Mn) Comparison By Distribution Network (2016-2032)
- Table 46: Eastern Europe Reusable Water Bottles Market Y-o-Y Growth Rate Comparison by Country (2016-2032)
- Table 47: Eastern Europe Reusable Water Bottles Market Y-o-Y Growth Rate Comparison By Material Type (2016-2032)
- Table 48: Eastern Europe Reusable Water Bottles Market Y-o-Y Growth Rate Comparison By Distribution Network (2016-2032)
- Table 49: Eastern Europe Reusable Water Bottles Market Share Comparison by Country (2016-2032)
- Table 50: Eastern Europe Reusable Water Bottles Market Share Comparison By Material Type (2016-2032)
- Table 51: Eastern Europe Reusable Water Bottles Market Share Comparison By Distribution Network (2016-2032)
- Table 52: APAC Reusable Water Bottles Market Comparison By Material Type (2016-2032)
- Table 53: APAC Reusable Water Bottles Market Comparison By Distribution Network (2016-2032)
- Table 54: APAC Reusable Water Bottles Market Revenue (US$ Mn) Comparison by Country (2016-2032)
- Table 55: APAC Reusable Water Bottles Market Revenue (US$ Mn) (2016-2032)
- Table 56: APAC Reusable Water Bottles Market Revenue (US$ Mn) Comparison by Country (2016-2032)
- Table 57: APAC Reusable Water Bottles Market Revenue (US$ Mn) Comparison By Material Type (2016-2032)
- Table 58: APAC Reusable Water Bottles Market Revenue (US$ Mn) Comparison By Distribution Network (2016-2032)
- Table 59: APAC Reusable Water Bottles Market Y-o-Y Growth Rate Comparison by Country (2016-2032)
- Table 60: APAC Reusable Water Bottles Market Y-o-Y Growth Rate Comparison By Material Type (2016-2032)
- Table 61: APAC Reusable Water Bottles Market Y-o-Y Growth Rate Comparison By Distribution Network (2016-2032)
- Table 62: APAC Reusable Water Bottles Market Share Comparison by Country (2016-2032)
- Table 63: APAC Reusable Water Bottles Market Share Comparison By Material Type (2016-2032)
- Table 64: APAC Reusable Water Bottles Market Share Comparison By Distribution Network (2016-2032)
- Table 65: Latin America Reusable Water Bottles Market Comparison By Material Type (2016-2032)
- Table 66: Latin America Reusable Water Bottles Market Comparison By Distribution Network (2016-2032)
- Table 67: Latin America Reusable Water Bottles Market Revenue (US$ Mn) Comparison by Country (2016-2032)
- Table 68: Latin America Reusable Water Bottles Market Revenue (US$ Mn) (2016-2032)
- Table 69: Latin America Reusable Water Bottles Market Revenue (US$ Mn) Comparison by Country (2016-2032)
- Table 70: Latin America Reusable Water Bottles Market Revenue (US$ Mn) Comparison By Material Type (2016-2032)
- Table 71: Latin America Reusable Water Bottles Market Revenue (US$ Mn) Comparison By Distribution Network (2016-2032)
- Table 72: Latin America Reusable Water Bottles Market Y-o-Y Growth Rate Comparison by Country (2016-2032)
- Table 73: Latin America Reusable Water Bottles Market Y-o-Y Growth Rate Comparison By Material Type (2016-2032)
- Table 74: Latin America Reusable Water Bottles Market Y-o-Y Growth Rate Comparison By Distribution Network (2016-2032)
- Table 75: Latin America Reusable Water Bottles Market Share Comparison by Country (2016-2032)
- Table 76: Latin America Reusable Water Bottles Market Share Comparison By Material Type (2016-2032)
- Table 77: Latin America Reusable Water Bottles Market Share Comparison By Distribution Network (2016-2032)
- Table 78: Middle East & Africa Reusable Water Bottles Market Comparison By Material Type (2016-2032)
- Table 79: Middle East & Africa Reusable Water Bottles Market Comparison By Distribution Network (2016-2032)
- Table 80: Middle East & Africa Reusable Water Bottles Market Revenue (US$ Mn) Comparison by Country (2016-2032)
- Table 81: Middle East & Africa Reusable Water Bottles Market Revenue (US$ Mn) (2016-2032)
- Table 82: Middle East & Africa Reusable Water Bottles Market Revenue (US$ Mn) Comparison by Country (2016-2032)
- Table 83: Middle East & Africa Reusable Water Bottles Market Revenue (US$ Mn) Comparison By Material Type (2016-2032)
- Table 84: Middle East & Africa Reusable Water Bottles Market Revenue (US$ Mn) Comparison By Distribution Network (2016-2032)
- Table 85: Middle East & Africa Reusable Water Bottles Market Y-o-Y Growth Rate Comparison by Country (2016-2032)
- Table 86: Middle East & Africa Reusable Water Bottles Market Y-o-Y Growth Rate Comparison By Material Type (2016-2032)
- Table 87: Middle East & Africa Reusable Water Bottles Market Y-o-Y Growth Rate Comparison By Distribution Network (2016-2032)
- Table 88: Middle East & Africa Reusable Water Bottles Market Share Comparison by Country (2016-2032)
- Table 89: Middle East & Africa Reusable Water Bottles Market Share Comparison By Material Type (2016-2032)
- Table 90: Middle East & Africa Reusable Water Bottles Market Share Comparison By Distribution Network (2016-2032)
- 1. Executive Summary
Inquiry Form
Why Choose Us
- 360 Degree Approach
- Growth Consulting
- 24/7 Research Support
- Comprehensive-Level of Customization
- Competitive Intelligence
- Single-Country/ Region Intelligence
- Post-Sale Service Assistance
- Access to Lead Analysts
- Available in PDF, Excel, Word/ PPT
Request for Customization
OUR CLIENTS
Don't just take our word. We are trusted by these great companies!