
Refinery Catalysts Market By Process (FCC catalysts, Alkylation catalysts, and others), By Type (Zeolites, Metals, Chemical compounds), By Region And Companies - Industry Segment Outlook, Market Assessment, Competition Scenario, Trends, And Forecast 2023-2032
-
2686
-
May 2023
-
163
-


-
This report was compiled by Shreyas Rokade Shreyas Rokade is a seasoned Research Analyst with CMFE, bringing extensive expertise in market research and consulting, with a strong background in Chemical Engineering. Correspondence Team Lead-CMFE Linkedin | Detailed Market research Methodology Our methodology involves a mix of primary research, including interviews with leading mental health experts, and secondary research from reputable medical journals and databases. View Detailed Methodology Page
-
Quick Navigation
Report Overview
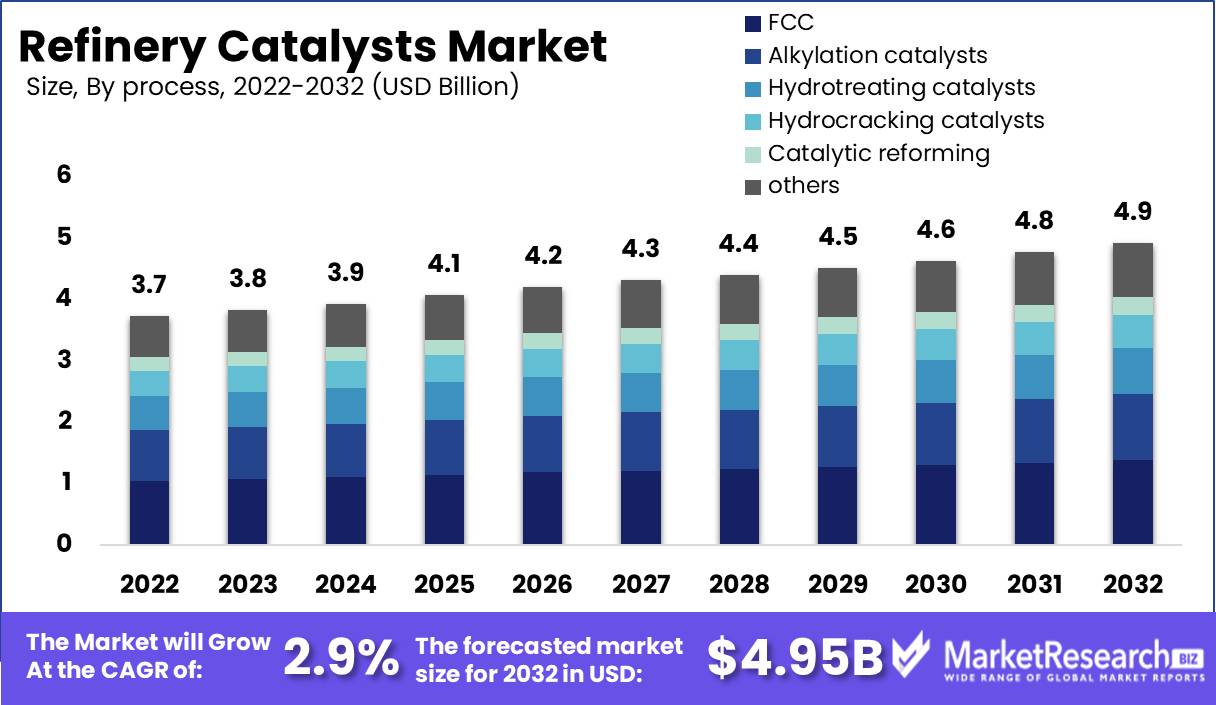
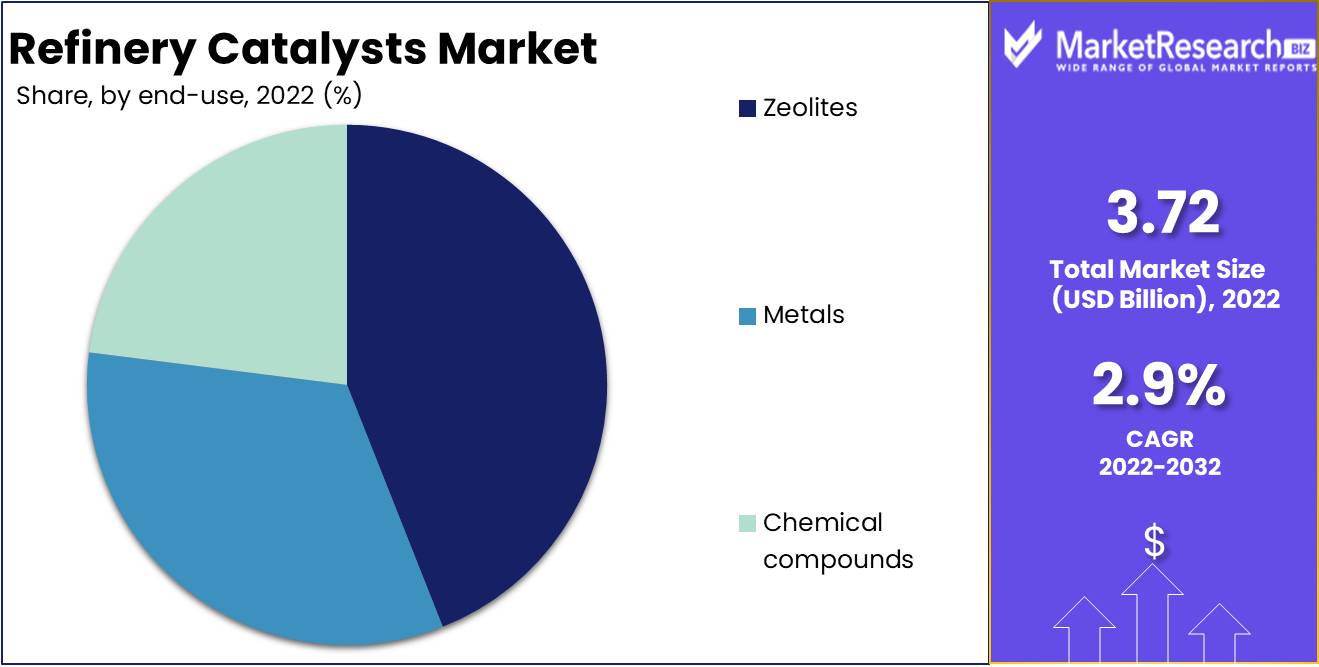
Refinery Catalysts Market size is expected to be worth around USD 4.95 Bn by 2032 from USD 3.72 Bn in 2022, growing at a CAGR of 2.9% during the forecast period from 2023 to 2032.
These agents of accelerated chemical reactions, Refinery Catalysts Market, transform crude oil into an assortment of valuable petroleum products. The complex and multifaceted character of the refining process necessitates a wide variety of catalysts in order to maximise its efficiency and effectiveness. Catalysing the transformation of petroleum into more profitable and useful fuels and compounds, refinery catalysts are indispensable to the petroleum refining industry. Incorporating catalysts into the refining process also improves its cost-effectiveness and ecological sustainability.
Beyond the simple refining of petroleum, refinery catalysts have significance. These agents allow the industry to produce fuels and compounds of superior quality, which benefit consumers and industries worldwide. Using refinery catalysts market, the industry can achieve a more desirable equilibrium between energy consumption, product quality, and yield, resulting in greater efficiency and reduced operational costs.
Innovation and advancement are recurring motifs in the evolution of refinery catalysts. Continuously investing in research and development, the industry strives to improve its performance and efficacy. Catalyst technology has seen extraordinary advancements in recent years, including zeolite-based catalysts for hydrocracking, single-atom catalysts for fuel and chemical production, and environmentally friendly catalysts for hydrotreating procedures.
Significant investment has been made in the research and development of novel refinery catalysts as a result of the quest for eco-friendly fuels and chemicals. ExxonMobil, BASF, and Honeywell, three leaders in the petrochemical and refining industries, are at the forefront of the development of novel and advanced refinery catalysts. These innovations are incorporated into their products and services, thereby satisfying consumers' demands for eco-friendly, high-quality products.
Environmental and human health risks are associated with the use of refinery catalysts, which produce toxic gases and compounds. Therefore, the industry places a premium on transparent, accountable, and explicable refinery catalyst utilisation. By encouraging responsible use, the industry ensures conformance with environmental regulations, promotes sustainable practises, and prioritises worker and community safety.
Driving factors
Demand for petroleum products is growing
The increasing demand for petroleum products is one of the main factors driving growth in the refinery catalysts market. As nations continue to rely on oil for everything from transportation to manufacturing, the demand for refinery catalysts is likely to increase. As developing countries continue to grow and expand, the demand for petroleum products is expected to rise, creating a tremendous opportunity for companies in the refinery catalysts market to expand their operations and capture new market share.
Pressure from the Government to Reduce Emissions
To combat climate change and reduce air pollution, stringent environmental regulations are being implemented, and refinery companies are being forced to employ cleaner technologies and processes. This is generating a substantial demand for efficient and effective refinery catalysts that can assist these companies in achieving their environmental objectives. There are discussions about instituting stricter regulations on greenhouse gas emissions, which would require businesses to reduce their emissions even further. This could generate a substantial demand for catalysts that assist businesses in meeting these new requirements.
Advancements in Refinery Technologies and Procedures
Innovations in refinery processes and technologies also contribute to the expansion of the market for refinery catalysts. Every year, new technologies emerge, allowing businesses to operate more efficiently and produce higher-quality goods. This has necessitated the development of refined catalysts that can keep up with the demands of the modern refinery. The development of new catalysts that are more efficient and effective than those presently available on the market is a key focus area for companies in the refinery catalysts industry.
Growth in Emerging Economies' Refining Capacity
As countries in Asia, Africa, and South America make substantial investments in their refining industries, the demand for catalysts is projected to increase substantially. The expansion of emerging economies' refining capacity presents a tremendous opportunity for companies in the refinery catalysts market to expand their operations and seize new market share. This trend is anticipated to continue as the economies of developing nations continue to grow and expand.
Potential Disruptors
There is always a chance that new competitors will enter the market and alter the competitive landscape. Nanotechnology and biotechnology have the potential to have a significant impact on the refinery catalysts market. These technologies could facilitate the creation of more efficient and effective catalysts than those presently on the market. Additionally, changes in consumer behaviour, such as a transition towards electric vehicles, may have a long-term impact on the demand for refinery catalysts.
Restraining Factors
Fluctuating Crude Oil Prices
The fluctuating prices of crude oil on the global market are one of the most significant restraints on the crude oil industry. Global demand and supply have a significant impact on the volatility of crude oil prices. Additionally, geopolitical tensions, natural disasters, and global economic uncertainty influence the prices.
As a consequence, it is difficult for crude oil companies to accurately predict their revenue and profits. This makes it difficult to plan long-term investments, expansion, and growth strategies. When prices fluctuate, it becomes substantially more difficult to invest in technology and innovation, as these endeavours require stable economic conditions.
High investment and operating expenses
The petroleum oil industry necessitates substantial capital expenditures for the establishment and maintenance of its production infrastructure. Oil exploration, drilling, processing, transportation, and storage facilities necessitate capital expenditures. This can make it difficult for businesses to establish and maintain a market presence.
In addition to the high maintenance and inspection, equipment, labour, and health and safety expenditures, the industry's operating costs are also quite high. These factors increase the cost of production, making it difficult for businesses to keep prices under control while maintaining product quality.
Increasing rivalry from alternative fuels
In recent years, alternative fuel sources, such as biofuels, natural gas, and electric vehicles, have gained prominence in the transportation sector, resulting in increased competition for crude oil. Governments are emphasising the development of alternative fuels to reduce carbon emissions and promote sustainable economic growth, resulting in stiff competition for companies that produce conventional fuels.
This competition is intensified by the development of cutting-edge technologies to support alternative fuels, which have increased their efficacy and decreased their prices. It is difficult for the crude oil industry to compete with technological advancements because establishing new technology requires substantial investment.
Problems Associated with Catalyst Deactivation
In the crude oil refining process, catalysts play a crucial role in determining the quality of the ultimate product. The deactivation of these catalysts over time makes it difficult for businesses to maintain operations. These catalysts deactivate primarily as a result of high-temperature operations, fouling, and toxicity.
Regeneration of the Market for Refinery Catalysts
Regenerating the refinery catalyst market presents significant obstacles for the crude oil business. Regenerating catalysts incurs high costs, and the materials used to produce catalysts are becoming increasingly scarce. Despite the importance of the refinery catalyst industry to the efficient operation of the crude oil industry, these obstacles are difficult to surmount.
By Process Analysis
In terms of utilisation and demand, the Fluid catalytic cracking (FCC) catalyst segment dominates the market for refinery catalysts. Fluid catalytic cracking is a chemical process used to refine petroleum oil into products such as petrol and diesel fuel, as its name suggests. The crude oil is heated to a high temperature and then exposed to a catalyst, which causes it to break down into smaller molecules. Numerous refineries prefer the fluid catalytic segment because it is efficient, cost-effective, and produces high yields.
Consumer behaviour and trends in the fluid catalytic market indicate that consumers are becoming increasingly environmentally conscious. Numerous consumers are concerned about the environmental impact of their activities, including their consumption of petrol and diesel fuel. The fluid catalytic segment reduces emissions produced during the refining process, making it an attractive option for consumers who are concerned about the environment.
In the future years, the fluid catalytic segment of the refinery catalysts market is anticipated to record the highest growth rate. This is due to the high demand for petrol and diesel fuel, as well as the growing emphasis on energy-efficient and environmentally conscious refining techniques.
By Type Analysis
The zeolites segment dominates the market for refinery catalysts in terms of product demand. Zeolites are natural or synthetic crystals that are utilised as refinement catalysts. Numerous refineries favour them due to their superior selectivity, stability, and efficiency.
Consumer behaviour and trends in the zeolites market indicate that consumers are becoming increasingly environmentally conscious. Numerous consumers are concerned about the environmental impact of their activities, including their consumption of petrol and diesel fuel. The zeolites segment reduces emissions produced during the refining process, making it an attractive option for consumers who are concerned about the environment.
In the coming years, the zeolites segment of the refinery catalysts market is anticipated to record the highest growth rate. This is due to the high demand for petrol and diesel fuel, as well as the growing emphasis on energy-efficient and environmentally conscious refining techniques.
Key Market Segments
By Process
- Fluid Catalytic Cracking (FCC) catalysts
- Alkylation catalysts
- Hydrotreating catalysts
- Hydrocracking catalysts
- Catalytic reforming
- others
By Type
- Zeolites
- Metals
- Chemical compounds
Growth Opportunity
Demand for Biofuels and Renewable Feedstocks Is Growing
The global demand for biofuels and renewable feedstocks as a healthier, more sustainable alternative to traditional fossil fuels has increased in recent years. This trend is the result of a combination of factors, including growing concern about climate change and ongoing efforts to reduce reliance on imported oil. Consequently, the demand for refinery catalysts that can effectively convert biofuels and renewable feedstocks into high-quality, usable fuels has been rising consistently.
Increasing Application of Nanotechnology to Catalyst Growth
Researchers are now able to devise and develop more efficient and effective catalysts due to the revolutionary impact of nanotechnology on catalyst development. The application of nanotechnology to the development of catalysts has allowed us to produce catalysts with vastly improved properties, such as increased surface area, enhanced reactivity, and enhanced selectivity. As a consequence, the use of nanotechnology in the development of catalysts has become more widespread, and an increasing number of companies are investing in this exciting field.
Developments in Catalyst Design and Fabrication Techniques
In recent years, significant advancements in catalyst design and production processes have allowed us to produce catalysts with enhanced performance and durability. These developments include the creation of novel synthesis techniques, the improvement of reactor design, and the application of advanced materials. As a result, the effectiveness and dependability of catalysts have increased, resulting in cost savings and enhanced productivity for the businesses that employ them.
Growing demand for eco-friendly chemical solutions
Green chemistry solutions are in high demand due to the expanding demand for cleaner, more sustainable products and processes. Green chemistry entails the development of chemical products and processes that minimise the use and production of hazardous substances. As a consequence, there has been an increase in demand for refinery catalysts that are more eco-friendly and conform to green chemistry standards. Green catalysts can reduce the environmental impact of the refining process, resulting in a more sustainable and cleaner environment.
Latest Trends
Increased Efficiency through High-Performance Catalysts
This section highlights how the use of high-performance catalysts can improve the efficiency of refining operations. The increasing global demand for refined petroleum products has led to a rising adoption of these catalysts. They not only improve the throughput of refineries but also reduce the energy required in the production process.
Catalyst Recycling and Regeneration
This paragraph discusses the trend of catalyst recycling and regeneration. As catalysts can become deactivated over time, recycling and regeneration technologies are becoming increasingly popular. This practice helps extend the lifespan of catalysts, reduces the cost of replacement, and is a sustainable approach to catalyst management.
Digital Technologies in Refinery Operations
This section talks about the increasing use of digital technologies in refinery operations. Digital sensors, data analytics, and machine learning algorithms are transforming the way refineries operate. Digital technologies provide real-time insights into refinery operations, allowing operators to optimize their processes and reduce downtime.
Sustainable and Eco-Friendly Catalysts
The focus of this paragraph is the growing trend towards sustainable and eco-friendly catalysts. Refineries are under pressure to reduce their environmental footprint and adopt sustainable practices, leading to the development of catalysts made from renewable resources. Eco-friendly catalysts have low environmental impact and are gaining in popularity.
Development of Cleaner Fuels
The final paragraph discusses the increasing demand for cleaner fuels and how this is driving the development of new types of catalysts. These catalysts are designed to convert heavy crude oils into lighter, cleaner products, reducing the emissions associated with the refining process. This trend reflects the industry's focus on sustainable practices and the need to meet global environmental targets.
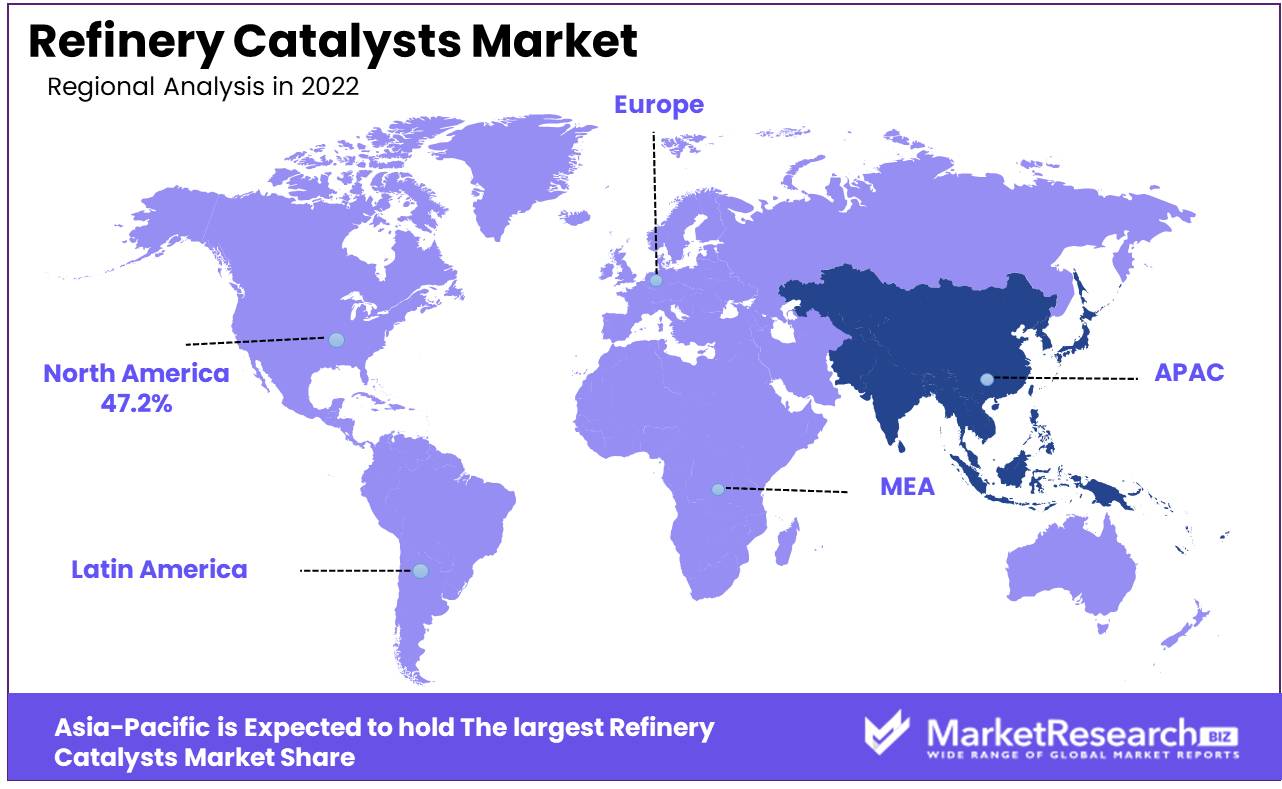
Regional Analysis
Refinery catalysts market help to turn crude oil into petrol and diesel fuel. Due to rising worldwide fossil fuel demand, refinery catalysts are expected to grow rapidly. The Asia-Pacific area will be the largest and fastest-growing market for refinery catalysts due to rising energy demand, economic growth, and petrochemical industry growth. Asia-Pacific countries are major consumers and producers of petroleum-based products due to rising industrialization and urbanisation. Thus, regional nations need efficient, cost-effective refinement technologies. Catalysts help refineries turn crude oil carrier into products. New catalysts and catalytic technologies have been developed to improve performance, reduce prices, and minimise environmental concerns due to rising demand for such technology.
The Asia-Pacific refinery catalysts market is influenced by advanced catalyst technologies. These technologies are designed to boost refinery yields and save operating costs by outperforming conventional catalysts in lifetime, activity, and selectivity. Advanced catalysts reduce greenhouse gas emissions and improve air quality. China and India, home to the world's largest petrochemical plants, have raised demand for these catalysts.
The Asia-Pacific region's need for refinery catalysts is growing due to the widespread use of biofuels. Refineries are increasingly using catalysts to manufacture biofuels from various feedstocks. Indonesia, Malaysia, and Thailand, significant palm oil and biofuel producers, are driving demand for biofuel catalysts in the region.
There are challenges that must be overcome despite the optimistic growth outlook for the Asia-Pacific market for refinery catalysts. These include global oil market volatility, competition from coal-to-liquids and the need for stricter emissions and pollution control regulations. However, regional demand for refinery catalysts is expected to outweigh these challenges and fuel growth for years to come.
Key Regions and Countries
North America
- US
- Canada
- Mexico
Western Europe
- Germany
- France
- The UK
- Spain
- Italy
- Portugal
- Ireland
- Austria
- Switzerland
- Benelux
- Nordic
- Rest of Western Europe
Eastern Europe
- Russia
- Poland
- The Czech Republic
- Greece
- Rest of Eastern Europe
APAC
- China
- Japan
- South Korea
- India
- Australia & New Zealand
- Indonesia
- Malaysia
- Philippines
- Singapore
- Thailand
- Vietnam
- Rest of APAC
Latin America
- Brazil
- Colombia
- Chile
- Argentina
- Costa Rica
- Rest of Latin America
Middle East & Africa
- Algeria
- Egypt
- Israel
- Kuwait
- Nigeria
- Saudi Arabia
- South Africa
- Turkey
- United Arab Emirates
- Rest of MEA
Key Players Analysis
Refinery catalysts, which may be precious metals or chemical compounds, play a crucial role in modifying or facilitating chemical reactions in chemical processes. With the use of these catalysts, refinery yields increase, product quality improves, and pollution levels decrease, demonstrating the utmost significance of these catalysts within the oil and gas industry.
As demand for crude oil and natural gas products increases, the global market for refinery catalysts is anticipated to expand significantly. The market is intensely competitive, with major players such as Johnson Matthey, BASF SE, W.R. Grace & Co, Criterion Catalysts & Technologies L.P., and Albemarle Corporation vying for a competitive advantage by developing innovative catalysts tailored to the diverse needs of the oil and gas industry.
To achieve this objective, competitors are developing innovative products and collaborating with their peers to increase their market share. In addition, they are making massive investments in research and development initiatives to create advanced refinery catalysts that can help reduce sulphur and nitrogen oxide emissions. In addition, the competitors offer performance enhancers that can dramatically improve the efficacy of refinery processes.
In order to expand their market presence, participants in the refinery catalyst market are also utilising various strategic initiatives, including mergers and acquisitions, partnerships, collaborations, and expansions. For instance, Johnson Matthey's 2020 acquisition of Clarianta's refinery catalysts business strengthened the company's performance in the refinery catalysts market, allowing them to serve a broader spectrum of customers.
Top Key Players in Refinery Catalysts Market
- Albemarle Corporation
- BASF SE
- Honeywell International Inc.
- Royal Dutch Shell plc
- R. Grace & Co.
- Axens SA
- Haldor Topsøe A/S
- Johnson Matthey Plc
- Clariant International AG
- Criterion Catalysts & Technologies L.P.
Recent Development
In 2021, Borotec, BASF's new FCC (Fluid Catalytic Cracking) catalyst, was introduced. It improves petrol yield and selectivity, thereby assisting refineries in meeting the increasing demand for cleaner fuels.
In 2020, Clariant has announced that its new catalyst, HYDEX E, will be released allowing refiners to increase production of high-quality diesel with reduced environmental impact.
In 2019, W.R. Grace & Co. announced the acquisition of Albemarle Corporation's Polyolefin Catalysts business, expanding its portfolio of plastics production catalysts.
In 2018, Honeywell UOP introduced its new catalyst, Unity, which enables refiners to produce more diesel from crude oil while simultaneously reducing emissions of sulphur and nitrogen oxides.
In 2017, To satisfy the growing demand for polyethylene products, Chevron Phillips Chemical Company announced the expansion of its catalyst manufacturing plant in Borger, Texas.
Report Scope:
Report Features Description Market Value (2022) USD 3.72 Bn Forecast Revenue (2032) USD 4.95 Bn CAGR (2023-2032) 2.9% Base Year for Estimation 2022 Historic Period 2016-2022 Forecast Period 2023-2032 Report Coverage Revenue Forecast, Market Dynamics, COVID-19 Impact, Competitive Landscape, Recent Developments Segments Covered By process: Fluid Catalytic Cracking (FCC) catalysts, Alkylation catalysts, Hydrotreating catalysts, Hydrocracking catalysts, Catalytic reforming, others
By type: Zeolites, Metals, Chemical compoundsRegional Analysis North America – The US, Canada, & Mexico; Western Europe – Germany, France, The UK, Spain, Italy, Portugal, Ireland, Austria, Switzerland, Benelux, Nordic, & Rest of Western Europe; Eastern Europe – Russia, Poland, The Czech Republic, Greece, & Rest of Eastern Europe; APAC – China, Japan, South Korea, India, Australia & New Zealand, Indonesia, Malaysia, Philippines, Singapore, Thailand, Vietnam, & Rest of APAC; Latin America – Brazil, Colombia, Chile, Argentina, Costa Rica, & Rest of Latin America; Middle East & Africa – Algeria, Egypt, Israel, Kuwait, Nigeria, Saudi Arabia, South Africa, Turkey, United Arab Emirates, & Rest of MEA Competitive Landscape Albemarle Corporation, BASF SE, Honeywell International Inc., Royal Dutch Shell plc, R. Grace & Co., Axens SA, Haldor Topsøe A/S, Johnson Matthey Plc, Clariant International AG, Criterion Catalysts & Technologies L.P., Customization Scope Customization for segments, region/country-level will be provided. Moreover, additional customization can be done based on the requirements. Purchase Options We have three licenses to opt for: Single User License, Multi-User License (Up to 5 Users), Corporate Use License (Unlimited User and Printable PDF) -
- 1. Executive Summary
- 1.1. Definition
- 1.2. Taxonomy
- 1.3. Research Scope
- 1.4. Key Analysis
- 1.5. Key Findings by Major Segments
- 1.6. Top strategies by Major Players
- 2. Global Refining Catalysts Market Overview
- 2.1. Refining Catalysts Market Dynamics
- 2.1.1. Drivers
- 2.1.2. Opportunities
- 2.1.3. Restraints
- 2.1.4. Challenges
- 2.2. Macro-economic Factors
- 2.3. Regulatory Framework
- 2.4. Market Investment Feasibility Index
- 2.5. PEST Analysis
- 2.6. PORTER’S Five Force Analysis
- 2.7. Drivers & Restraints Impact Analysis
- 2.8. Industry Chain Analysis
- 2.9. Cost Structure Analysis
- 2.10. Marketing Strategy
- 2.11. Russia-Ukraine War Impact Analysis
- 2.12. Opportunity Map Analysis
- 2.13. Market Competition Scenario Analysis
- 2.14. Product Life Cycle Analysis
- 2.15. Opportunity Orbits
- 2.16. Manufacturer Intensity Map
- 2.17. Major Companies sales by Value & Volume
- 2.1. Refining Catalysts Market Dynamics
- 3. Global Refining Catalysts Market Analysis, Opportunity and Forecast, 2016-2032
- 3.1. Global Refining Catalysts Market Analysis, 2016-2021
- 3.2. Global Refining Catalysts Market Opportunity and Forecast, 2023-2032
- 3.3. Global Refining Catalysts Market Analysis, Opportunity and Forecast, By By process, 2016-2032
- 3.3.1. Global Refining Catalysts Market Analysis by By process: Introduction
- 3.3.2. Market Size Absolute $ Opportunity Analysis and Forecast, By By process, 2016-2032
- 3.3.3. Fluid Catalytic Cracking (FCC) catalysts
- 3.3.4. Alkylation catalysts
- 3.3.5. Hydrotreating catalysts
- 3.3.6. Hydrocracking catalysts
- 3.3.7. Catalytic reforming
- 3.3.8. others
- 3.4. Global Refining Catalysts Market Analysis, Opportunity and Forecast, By By type, 2016-2032
- 3.4.1. Global Refining Catalysts Market Analysis by By type: Introduction
- 3.4.2. Market Size Absolute $ Opportunity Analysis and Forecast, By By type, 2016-2032
- 3.4.3. Zeolites
- 3.4.4. Metals
- 3.4.5. Chemical compounds
- 4. North America Refining Catalysts Market Analysis, Opportunity and Forecast, 2016-2032
- 4.1. North America Refining Catalysts Market Analysis, 2016-2021
- 4.2. North America Refining Catalysts Market Opportunity and Forecast, 2023-2032
- 4.3. North America Refining Catalysts Market Analysis, Opportunity and Forecast, By By process, 2016-2032
- 4.3.1. North America Refining Catalysts Market Analysis by By process: Introduction
- 4.3.2. Market Size Absolute $ Opportunity Analysis and Forecast, By By process, 2016-2032
- 4.3.3. Fluid Catalytic Cracking (FCC) catalysts
- 4.3.4. Alkylation catalysts
- 4.3.5. Hydrotreating catalysts
- 4.3.6. Hydrocracking catalysts
- 4.3.7. Catalytic reforming
- 4.3.8. others
- 4.4. North America Refining Catalysts Market Analysis, Opportunity and Forecast, By By type, 2016-2032
- 4.4.1. North America Refining Catalysts Market Analysis by By type: Introduction
- 4.4.2. Market Size Absolute $ Opportunity Analysis and Forecast, By By type, 2016-2032
- 4.4.3. Zeolites
- 4.4.4. Metals
- 4.4.5. Chemical compounds
- 4.5. North America Refining Catalysts Market Analysis, Opportunity and Forecast, By Country , 2016-2032
- 4.5.1. North America Refining Catalysts Market Analysis by Country : Introduction
- 4.5.2. Market Size Absolute $ Opportunity Analysis and Forecast, Country , 2016-2032
- 4.5.2.1. The US
- 4.5.2.2. Canada
- 4.5.2.3. Mexico
- 5. Western Europe Refining Catalysts Market Analysis, Opportunity and Forecast, 2016-2032
- 5.1. Western Europe Refining Catalysts Market Analysis, 2016-2021
- 5.2. Western Europe Refining Catalysts Market Opportunity and Forecast, 2023-2032
- 5.3. Western Europe Refining Catalysts Market Analysis, Opportunity and Forecast, By By process, 2016-2032
- 5.3.1. Western Europe Refining Catalysts Market Analysis by By process: Introduction
- 5.3.2. Market Size Absolute $ Opportunity Analysis and Forecast, By By process, 2016-2032
- 5.3.3. Fluid Catalytic Cracking (FCC) catalysts
- 5.3.4. Alkylation catalysts
- 5.3.5. Hydrotreating catalysts
- 5.3.6. Hydrocracking catalysts
- 5.3.7. Catalytic reforming
- 5.3.8. others
- 5.4. Western Europe Refining Catalysts Market Analysis, Opportunity and Forecast, By By type, 2016-2032
- 5.4.1. Western Europe Refining Catalysts Market Analysis by By type: Introduction
- 5.4.2. Market Size Absolute $ Opportunity Analysis and Forecast, By By type, 2016-2032
- 5.4.3. Zeolites
- 5.4.4. Metals
- 5.4.5. Chemical compounds
- 5.5. Western Europe Refining Catalysts Market Analysis, Opportunity and Forecast, By Country , 2016-2032
- 5.5.1. Western Europe Refining Catalysts Market Analysis by Country : Introduction
- 5.5.2. Market Size Absolute $ Opportunity Analysis and Forecast, Country , 2016-2032
- 5.5.2.1. Germany
- 5.5.2.2. France
- 5.5.2.3. The UK
- 5.5.2.4. Spain
- 5.5.2.5. Italy
- 5.5.2.6. Portugal
- 5.5.2.7. Ireland
- 5.5.2.8. Austria
- 5.5.2.9. Switzerland
- 5.5.2.10. Benelux
- 5.5.2.11. Nordic
- 5.5.2.12. Rest of Western Europe
- 6. Eastern Europe Refining Catalysts Market Analysis, Opportunity and Forecast, 2016-2032
- 6.1. Eastern Europe Refining Catalysts Market Analysis, 2016-2021
- 6.2. Eastern Europe Refining Catalysts Market Opportunity and Forecast, 2023-2032
- 6.3. Eastern Europe Refining Catalysts Market Analysis, Opportunity and Forecast, By By process, 2016-2032
- 6.3.1. Eastern Europe Refining Catalysts Market Analysis by By process: Introduction
- 6.3.2. Market Size Absolute $ Opportunity Analysis and Forecast, By By process, 2016-2032
- 6.3.3. Fluid Catalytic Cracking (FCC) catalysts
- 6.3.4. Alkylation catalysts
- 6.3.5. Hydrotreating catalysts
- 6.3.6. Hydrocracking catalysts
- 6.3.7. Catalytic reforming
- 6.3.8. others
- 6.4. Eastern Europe Refining Catalysts Market Analysis, Opportunity and Forecast, By By type, 2016-2032
- 6.4.1. Eastern Europe Refining Catalysts Market Analysis by By type: Introduction
- 6.4.2. Market Size Absolute $ Opportunity Analysis and Forecast, By By type, 2016-2032
- 6.4.3. Zeolites
- 6.4.4. Metals
- 6.4.5. Chemical compounds
- 6.5. Eastern Europe Refining Catalysts Market Analysis, Opportunity and Forecast, By Country , 2016-2032
- 6.5.1. Eastern Europe Refining Catalysts Market Analysis by Country : Introduction
- 6.5.2. Market Size Absolute $ Opportunity Analysis and Forecast, Country , 2016-2032
- 6.5.2.1. Russia
- 6.5.2.2. Poland
- 6.5.2.3. The Czech Republic
- 6.5.2.4. Greece
- 6.5.2.5. Rest of Eastern Europe
- 7. APAC Refining Catalysts Market Analysis, Opportunity and Forecast, 2016-2032
- 7.1. APAC Refining Catalysts Market Analysis, 2016-2021
- 7.2. APAC Refining Catalysts Market Opportunity and Forecast, 2023-2032
- 7.3. APAC Refining Catalysts Market Analysis, Opportunity and Forecast, By By process, 2016-2032
- 7.3.1. APAC Refining Catalysts Market Analysis by By process: Introduction
- 7.3.2. Market Size Absolute $ Opportunity Analysis and Forecast, By By process, 2016-2032
- 7.3.3. Fluid Catalytic Cracking (FCC) catalysts
- 7.3.4. Alkylation catalysts
- 7.3.5. Hydrotreating catalysts
- 7.3.6. Hydrocracking catalysts
- 7.3.7. Catalytic reforming
- 7.3.8. others
- 7.4. APAC Refining Catalysts Market Analysis, Opportunity and Forecast, By By type, 2016-2032
- 7.4.1. APAC Refining Catalysts Market Analysis by By type: Introduction
- 7.4.2. Market Size Absolute $ Opportunity Analysis and Forecast, By By type, 2016-2032
- 7.4.3. Zeolites
- 7.4.4. Metals
- 7.4.5. Chemical compounds
- 7.5. APAC Refining Catalysts Market Analysis, Opportunity and Forecast, By Country , 2016-2032
- 7.5.1. APAC Refining Catalysts Market Analysis by Country : Introduction
- 7.5.2. Market Size Absolute $ Opportunity Analysis and Forecast, Country , 2016-2032
- 7.5.2.1. China
- 7.5.2.2. Japan
- 7.5.2.3. South Korea
- 7.5.2.4. India
- 7.5.2.5. Australia & New Zeland
- 7.5.2.6. Indonesia
- 7.5.2.7. Malaysia
- 7.5.2.8. Philippines
- 7.5.2.9. Singapore
- 7.5.2.10. Thailand
- 7.5.2.11. Vietnam
- 7.5.2.12. Rest of APAC
- 8. Latin America Refining Catalysts Market Analysis, Opportunity and Forecast, 2016-2032
- 8.1. Latin America Refining Catalysts Market Analysis, 2016-2021
- 8.2. Latin America Refining Catalysts Market Opportunity and Forecast, 2023-2032
- 8.3. Latin America Refining Catalysts Market Analysis, Opportunity and Forecast, By By process, 2016-2032
- 8.3.1. Latin America Refining Catalysts Market Analysis by By process: Introduction
- 8.3.2. Market Size Absolute $ Opportunity Analysis and Forecast, By By process, 2016-2032
- 8.3.3. Fluid Catalytic Cracking (FCC) catalysts
- 8.3.4. Alkylation catalysts
- 8.3.5. Hydrotreating catalysts
- 8.3.6. Hydrocracking catalysts
- 8.3.7. Catalytic reforming
- 8.3.8. others
- 8.4. Latin America Refining Catalysts Market Analysis, Opportunity and Forecast, By By type, 2016-2032
- 8.4.1. Latin America Refining Catalysts Market Analysis by By type: Introduction
- 8.4.2. Market Size Absolute $ Opportunity Analysis and Forecast, By By type, 2016-2032
- 8.4.3. Zeolites
- 8.4.4. Metals
- 8.4.5. Chemical compounds
- 8.5. Latin America Refining Catalysts Market Analysis, Opportunity and Forecast, By Country , 2016-2032
- 8.5.1. Latin America Refining Catalysts Market Analysis by Country : Introduction
- 8.5.2. Market Size Absolute $ Opportunity Analysis and Forecast, Country , 2016-2032
- 8.5.2.1. Brazil
- 8.5.2.2. Colombia
- 8.5.2.3. Chile
- 8.5.2.4. Argentina
- 8.5.2.5. Costa Rica
- 8.5.2.6. Rest of Latin America
- 9. Middle East & Africa Refining Catalysts Market Analysis, Opportunity and Forecast, 2016-2032
- 9.1. Middle East & Africa Refining Catalysts Market Analysis, 2016-2021
- 9.2. Middle East & Africa Refining Catalysts Market Opportunity and Forecast, 2023-2032
- 9.3. Middle East & Africa Refining Catalysts Market Analysis, Opportunity and Forecast, By By process, 2016-2032
- 9.3.1. Middle East & Africa Refining Catalysts Market Analysis by By process: Introduction
- 9.3.2. Market Size Absolute $ Opportunity Analysis and Forecast, By By process, 2016-2032
- 9.3.3. Fluid Catalytic Cracking (FCC) catalysts
- 9.3.4. Alkylation catalysts
- 9.3.5. Hydrotreating catalysts
- 9.3.6. Hydrocracking catalysts
- 9.3.7. Catalytic reforming
- 9.3.8. others
- 9.4. Middle East & Africa Refining Catalysts Market Analysis, Opportunity and Forecast, By By type, 2016-2032
- 9.4.1. Middle East & Africa Refining Catalysts Market Analysis by By type: Introduction
- 9.4.2. Market Size Absolute $ Opportunity Analysis and Forecast, By By type, 2016-2032
- 9.4.3. Zeolites
- 9.4.4. Metals
- 9.4.5. Chemical compounds
- 9.5. Middle East & Africa Refining Catalysts Market Analysis, Opportunity and Forecast, By Country , 2016-2032
- 9.5.1. Middle East & Africa Refining Catalysts Market Analysis by Country : Introduction
- 9.5.2. Market Size Absolute $ Opportunity Analysis and Forecast, Country , 2016-2032
- 9.5.2.1. Algeria
- 9.5.2.2. Egypt
- 9.5.2.3. Israel
- 9.5.2.4. Kuwait
- 9.5.2.5. Nigeria
- 9.5.2.6. Saudi Arabia
- 9.5.2.7. South Africa
- 9.5.2.8. Turkey
- 9.5.2.9. The UAE
- 9.5.2.10. Rest of MEA
- 10. Global Refining Catalysts Market Analysis, Opportunity and Forecast, By Region , 2016-2032
- 10.1. Global Refining Catalysts Market Analysis by Region : Introduction
- 10.2. Market Size Absolute $ Opportunity Analysis and Forecast, By Region , 2016-2032
- 10.2.1. North America
- 10.2.2. Western Europe
- 10.2.3. Eastern Europe
- 10.2.4. APAC
- 10.2.5. Latin America
- 10.2.6. Middle East & Africa
- 11. Global Refining Catalysts Market Competitive Landscape, Market Share Analysis, and Company Profiles
- 11.1. Market Share Analysis
- 11.2. Company Profiles
- 11.3. Albemarle Corporation
- 11.3.1. Company Overview
- 11.3.2. Financial Highlights
- 11.3.3. Product Portfolio
- 11.3.4. SWOT Analysis
- 11.3.5. Key Strategies and Developments
- 11.4. BASF SE
- 11.4.1. Company Overview
- 11.4.2. Financial Highlights
- 11.4.3. Product Portfolio
- 11.4.4. SWOT Analysis
- 11.4.5. Key Strategies and Developments
- 11.5. Honeywell International Inc.
- 11.5.1. Company Overview
- 11.5.2. Financial Highlights
- 11.5.3. Product Portfolio
- 11.5.4. SWOT Analysis
- 11.5.5. Key Strategies and Developments
- 11.6. Royal Dutch Shell plc
- 11.6.1. Company Overview
- 11.6.2. Financial Highlights
- 11.6.3. Product Portfolio
- 11.6.4. SWOT Analysis
- 11.6.5. Key Strategies and Developments
- 11.7. R. Grace & Co.
- 11.7.1. Company Overview
- 11.7.2. Financial Highlights
- 11.7.3. Product Portfolio
- 11.7.4. SWOT Analysis
- 11.7.5. Key Strategies and Developments
- 11.8. Axens SA
- 11.8.1. Company Overview
- 11.8.2. Financial Highlights
- 11.8.3. Product Portfolio
- 11.8.4. SWOT Analysis
- 11.8.5. Key Strategies and Developments
- 11.9. Haldor Topsøe A/S
- 11.9.1. Company Overview
- 11.9.2. Financial Highlights
- 11.9.3. Product Portfolio
- 11.9.4. SWOT Analysis
- 11.9.5. Key Strategies and Developments
- 11.10. Johnson Matthey Plc
- 11.10.1. Company Overview
- 11.10.2. Financial Highlights
- 11.10.3. Product Portfolio
- 11.10.4. SWOT Analysis
- 11.10.5. Key Strategies and Developments
- 11.11. Clariant International AG
- 11.11.1. Company Overview
- 11.11.2. Financial Highlights
- 11.11.3. Product Portfolio
- 11.11.4. SWOT Analysis
- 11.11.5. Key Strategies and Developments
- 11.12. Criterion Catalysts & Technologies L.P.
- 11.12.1. Company Overview
- 11.12.2. Financial Highlights
- 11.12.3. Product Portfolio
- 11.12.4. SWOT Analysis
- 11.12.5. Key Strategies and Developments
- 12. Assumptions and Acronyms
- 13. Research Methodology
- 14. Contact
- List of Figures
- Figure 1: Global Refining Catalysts Market Revenue (US$ Mn) Market Share by By process in 2022
- Figure 2: Global Refining Catalysts Market Attractiveness Analysis by By process, 2016-2032
- Figure 3: Global Refining Catalysts Market Revenue (US$ Mn) Market Share by By typein 2022
- Figure 4: Global Refining Catalysts Market Attractiveness Analysis by By type, 2016-2032
- Figure 5: Global Refining Catalysts Market Revenue (US$ Mn) Market Share by Region in 2022
- Figure 6: Global Refining Catalysts Market Attractiveness Analysis by Region, 2016-2032
- Figure 7: Global Refining Catalysts Market Revenue (US$ Mn) (2016-2032)
- Figure 8: Global Refining Catalysts Market Revenue (US$ Mn) Comparison by Region (2016-2032)
- Figure 9: Global Refining Catalysts Market Revenue (US$ Mn) Comparison by By process (2016-2032)
- Figure 10: Global Refining Catalysts Market Revenue (US$ Mn) Comparison by By type (2016-2032)
- Figure 11: Global Refining Catalysts Market Y-o-Y Growth Rate Comparison by Region (2016-2032)
- Figure 12: Global Refining Catalysts Market Y-o-Y Growth Rate Comparison by By process (2016-2032)
- Figure 13: Global Refining Catalysts Market Y-o-Y Growth Rate Comparison by By type (2016-2032)
- Figure 14: Global Refining Catalysts Market Share Comparison by Region (2016-2032)
- Figure 15: Global Refining Catalysts Market Share Comparison by By process (2016-2032)
- Figure 16: Global Refining Catalysts Market Share Comparison by By type (2016-2032)
- Figure 17: North America Refining Catalysts Market Revenue (US$ Mn) Market Share by By processin 2022
- Figure 18: North America Refining Catalysts Market Attractiveness Analysis by By process, 2016-2032
- Figure 19: North America Refining Catalysts Market Revenue (US$ Mn) Market Share by By typein 2022
- Figure 20: North America Refining Catalysts Market Attractiveness Analysis by By type, 2016-2032
- Figure 21: North America Refining Catalysts Market Revenue (US$ Mn) Market Share by Country in 2022
- Figure 22: North America Refining Catalysts Market Attractiveness Analysis by Country, 2016-2032
- Figure 23: North America Refining Catalysts Market Revenue (US$ Mn) (2016-2032)
- Figure 24: North America Refining Catalysts Market Revenue (US$ Mn) Comparison by Country (2016-2032)
- Figure 25: North America Refining Catalysts Market Revenue (US$ Mn) Comparison by By process (2016-2032)
- Figure 26: North America Refining Catalysts Market Revenue (US$ Mn) Comparison by By type (2016-2032)
- Figure 27: North America Refining Catalysts Market Y-o-Y Growth Rate Comparison by Country (2016-2032)
- Figure 28: North America Refining Catalysts Market Y-o-Y Growth Rate Comparison by By process (2016-2032)
- Figure 29: North America Refining Catalysts Market Y-o-Y Growth Rate Comparison by By type (2016-2032)
- Figure 30: North America Refining Catalysts Market Share Comparison by Country (2016-2032)
- Figure 31: North America Refining Catalysts Market Share Comparison by By process (2016-2032)
- Figure 32: North America Refining Catalysts Market Share Comparison by By type (2016-2032)
- Figure 33: Western Europe Refining Catalysts Market Revenue (US$ Mn) Market Share by By processin 2022
- Figure 34: Western Europe Refining Catalysts Market Attractiveness Analysis by By process, 2016-2032
- Figure 35: Western Europe Refining Catalysts Market Revenue (US$ Mn) Market Share by By typein 2022
- Figure 36: Western Europe Refining Catalysts Market Attractiveness Analysis by By type, 2016-2032
- Figure 37: Western Europe Refining Catalysts Market Revenue (US$ Mn) Market Share by Country in 2022
- Figure 38: Western Europe Refining Catalysts Market Attractiveness Analysis by Country, 2016-2032
- Figure 39: Western Europe Refining Catalysts Market Revenue (US$ Mn) (2016-2032)
- Figure 40: Western Europe Refining Catalysts Market Revenue (US$ Mn) Comparison by Country (2016-2032)
- Figure 41: Western Europe Refining Catalysts Market Revenue (US$ Mn) Comparison by By process (2016-2032)
- Figure 42: Western Europe Refining Catalysts Market Revenue (US$ Mn) Comparison by By type (2016-2032)
- Figure 43: Western Europe Refining Catalysts Market Y-o-Y Growth Rate Comparison by Country (2016-2032)
- Figure 44: Western Europe Refining Catalysts Market Y-o-Y Growth Rate Comparison by By process (2016-2032)
- Figure 45: Western Europe Refining Catalysts Market Y-o-Y Growth Rate Comparison by By type (2016-2032)
- Figure 46: Western Europe Refining Catalysts Market Share Comparison by Country (2016-2032)
- Figure 47: Western Europe Refining Catalysts Market Share Comparison by By process (2016-2032)
- Figure 48: Western Europe Refining Catalysts Market Share Comparison by By type (2016-2032)
- Figure 49: Eastern Europe Refining Catalysts Market Revenue (US$ Mn) Market Share by By processin 2022
- Figure 50: Eastern Europe Refining Catalysts Market Attractiveness Analysis by By process, 2016-2032
- Figure 51: Eastern Europe Refining Catalysts Market Revenue (US$ Mn) Market Share by By typein 2022
- Figure 52: Eastern Europe Refining Catalysts Market Attractiveness Analysis by By type, 2016-2032
- Figure 53: Eastern Europe Refining Catalysts Market Revenue (US$ Mn) Market Share by Country in 2022
- Figure 54: Eastern Europe Refining Catalysts Market Attractiveness Analysis by Country, 2016-2032
- Figure 55: Eastern Europe Refining Catalysts Market Revenue (US$ Mn) (2016-2032)
- Figure 56: Eastern Europe Refining Catalysts Market Revenue (US$ Mn) Comparison by Country (2016-2032)
- Figure 57: Eastern Europe Refining Catalysts Market Revenue (US$ Mn) Comparison by By process (2016-2032)
- Figure 58: Eastern Europe Refining Catalysts Market Revenue (US$ Mn) Comparison by By type (2016-2032)
- Figure 59: Eastern Europe Refining Catalysts Market Y-o-Y Growth Rate Comparison by Country (2016-2032)
- Figure 60: Eastern Europe Refining Catalysts Market Y-o-Y Growth Rate Comparison by By process (2016-2032)
- Figure 61: Eastern Europe Refining Catalysts Market Y-o-Y Growth Rate Comparison by By type (2016-2032)
- Figure 62: Eastern Europe Refining Catalysts Market Share Comparison by Country (2016-2032)
- Figure 63: Eastern Europe Refining Catalysts Market Share Comparison by By process (2016-2032)
- Figure 64: Eastern Europe Refining Catalysts Market Share Comparison by By type (2016-2032)
- Figure 65: APAC Refining Catalysts Market Revenue (US$ Mn) Market Share by By processin 2022
- Figure 66: APAC Refining Catalysts Market Attractiveness Analysis by By process, 2016-2032
- Figure 67: APAC Refining Catalysts Market Revenue (US$ Mn) Market Share by By typein 2022
- Figure 68: APAC Refining Catalysts Market Attractiveness Analysis by By type, 2016-2032
- Figure 69: APAC Refining Catalysts Market Revenue (US$ Mn) Market Share by Country in 2022
- Figure 70: APAC Refining Catalysts Market Attractiveness Analysis by Country, 2016-2032
- Figure 71: APAC Refining Catalysts Market Revenue (US$ Mn) (2016-2032)
- Figure 72: APAC Refining Catalysts Market Revenue (US$ Mn) Comparison by Country (2016-2032)
- Figure 73: APAC Refining Catalysts Market Revenue (US$ Mn) Comparison by By process (2016-2032)
- Figure 74: APAC Refining Catalysts Market Revenue (US$ Mn) Comparison by By type (2016-2032)
- Figure 75: APAC Refining Catalysts Market Y-o-Y Growth Rate Comparison by Country (2016-2032)
- Figure 76: APAC Refining Catalysts Market Y-o-Y Growth Rate Comparison by By process (2016-2032)
- Figure 77: APAC Refining Catalysts Market Y-o-Y Growth Rate Comparison by By type (2016-2032)
- Figure 78: APAC Refining Catalysts Market Share Comparison by Country (2016-2032)
- Figure 79: APAC Refining Catalysts Market Share Comparison by By process (2016-2032)
- Figure 80: APAC Refining Catalysts Market Share Comparison by By type (2016-2032)
- Figure 81: Latin America Refining Catalysts Market Revenue (US$ Mn) Market Share by By processin 2022
- Figure 82: Latin America Refining Catalysts Market Attractiveness Analysis by By process, 2016-2032
- Figure 83: Latin America Refining Catalysts Market Revenue (US$ Mn) Market Share by By typein 2022
- Figure 84: Latin America Refining Catalysts Market Attractiveness Analysis by By type, 2016-2032
- Figure 85: Latin America Refining Catalysts Market Revenue (US$ Mn) Market Share by Country in 2022
- Figure 86: Latin America Refining Catalysts Market Attractiveness Analysis by Country, 2016-2032
- Figure 87: Latin America Refining Catalysts Market Revenue (US$ Mn) (2016-2032)
- Figure 88: Latin America Refining Catalysts Market Revenue (US$ Mn) Comparison by Country (2016-2032)
- Figure 89: Latin America Refining Catalysts Market Revenue (US$ Mn) Comparison by By process (2016-2032)
- Figure 90: Latin America Refining Catalysts Market Revenue (US$ Mn) Comparison by By type (2016-2032)
- Figure 91: Latin America Refining Catalysts Market Y-o-Y Growth Rate Comparison by Country (2016-2032)
- Figure 92: Latin America Refining Catalysts Market Y-o-Y Growth Rate Comparison by By process (2016-2032)
- Figure 93: Latin America Refining Catalysts Market Y-o-Y Growth Rate Comparison by By type (2016-2032)
- Figure 94: Latin America Refining Catalysts Market Share Comparison by Country (2016-2032)
- Figure 95: Latin America Refining Catalysts Market Share Comparison by By process (2016-2032)
- Figure 96: Latin America Refining Catalysts Market Share Comparison by By type (2016-2032)
- Figure 97: Middle East & Africa Refining Catalysts Market Revenue (US$ Mn) Market Share by By processin 2022
- Figure 98: Middle East & Africa Refining Catalysts Market Attractiveness Analysis by By process, 2016-2032
- Figure 99: Middle East & Africa Refining Catalysts Market Revenue (US$ Mn) Market Share by By typein 2022
- Figure 100: Middle East & Africa Refining Catalysts Market Attractiveness Analysis by By type, 2016-2032
- Figure 101: Middle East & Africa Refining Catalysts Market Revenue (US$ Mn) Market Share by Country in 2022
- Figure 102: Middle East & Africa Refining Catalysts Market Attractiveness Analysis by Country, 2016-2032
- Figure 103: Middle East & Africa Refining Catalysts Market Revenue (US$ Mn) (2016-2032)
- Figure 104: Middle East & Africa Refining Catalysts Market Revenue (US$ Mn) Comparison by Country (2016-2032)
- Figure 105: Middle East & Africa Refining Catalysts Market Revenue (US$ Mn) Comparison by By process (2016-2032)
- Figure 106: Middle East & Africa Refining Catalysts Market Revenue (US$ Mn) Comparison by By type (2016-2032)
- Figure 107: Middle East & Africa Refining Catalysts Market Y-o-Y Growth Rate Comparison by Country (2016-2032)
- Figure 108: Middle East & Africa Refining Catalysts Market Y-o-Y Growth Rate Comparison by By process (2016-2032)
- Figure 109: Middle East & Africa Refining Catalysts Market Y-o-Y Growth Rate Comparison by By type (2016-2032)
- Figure 110: Middle East & Africa Refining Catalysts Market Share Comparison by Country (2016-2032)
- Figure 111: Middle East & Africa Refining Catalysts Market Share Comparison by By process (2016-2032)
- Figure 112: Middle East & Africa Refining Catalysts Market Share Comparison by By type (2016-2032)
- List of Tables
- Table 1: Global Refining Catalysts Market Comparison by By process (2016-2032)
- Table 2: Global Refining Catalysts Market Comparison by By type (2016-2032)
- Table 3: Global Refining Catalysts Market Revenue (US$ Mn) Comparison by Region (2016-2032)
- Table 4: Global Refining Catalysts Market Revenue (US$ Mn) (2016-2032)
- Table 5: Global Refining Catalysts Market Revenue (US$ Mn) Comparison by Region (2016-2032)
- Table 6: Global Refining Catalysts Market Revenue (US$ Mn) Comparison by By process (2016-2032)
- Table 7: Global Refining Catalysts Market Revenue (US$ Mn) Comparison by By type (2016-2032)
- Table 8: Global Refining Catalysts Market Y-o-Y Growth Rate Comparison by Region (2016-2032)
- Table 9: Global Refining Catalysts Market Y-o-Y Growth Rate Comparison by By process (2016-2032)
- Table 10: Global Refining Catalysts Market Y-o-Y Growth Rate Comparison by By type (2016-2032)
- Table 11: Global Refining Catalysts Market Share Comparison by Region (2016-2032)
- Table 12: Global Refining Catalysts Market Share Comparison by By process (2016-2032)
- Table 13: Global Refining Catalysts Market Share Comparison by By type (2016-2032)
- Table 14: North America Refining Catalysts Market Comparison by By type (2016-2032)
- Table 15: North America Refining Catalysts Market Revenue (US$ Mn) Comparison by Country (2016-2032)
- Table 16: North America Refining Catalysts Market Revenue (US$ Mn) (2016-2032)
- Table 17: North America Refining Catalysts Market Revenue (US$ Mn) Comparison by Country (2016-2032)
- Table 18: North America Refining Catalysts Market Revenue (US$ Mn) Comparison by By process (2016-2032)
- Table 19: North America Refining Catalysts Market Revenue (US$ Mn) Comparison by By type (2016-2032)
- Table 20: North America Refining Catalysts Market Y-o-Y Growth Rate Comparison by Country (2016-2032)
- Table 21: North America Refining Catalysts Market Y-o-Y Growth Rate Comparison by By process (2016-2032)
- Table 22: North America Refining Catalysts Market Y-o-Y Growth Rate Comparison by By type (2016-2032)
- Table 23: North America Refining Catalysts Market Share Comparison by Country (2016-2032)
- Table 24: North America Refining Catalysts Market Share Comparison by By process (2016-2032)
- Table 25: North America Refining Catalysts Market Share Comparison by By type (2016-2032)
- Table 26: Western Europe Refining Catalysts Market Comparison by By process (2016-2032)
- Table 27: Western Europe Refining Catalysts Market Comparison by By type (2016-2032)
- Table 28: Western Europe Refining Catalysts Market Revenue (US$ Mn) Comparison by Country (2016-2032)
- Table 29: Western Europe Refining Catalysts Market Revenue (US$ Mn) (2016-2032)
- Table 30: Western Europe Refining Catalysts Market Revenue (US$ Mn) Comparison by Country (2016-2032)
- Table 31: Western Europe Refining Catalysts Market Revenue (US$ Mn) Comparison by By process (2016-2032)
- Table 32: Western Europe Refining Catalysts Market Revenue (US$ Mn) Comparison by By type (2016-2032)
- Table 33: Western Europe Refining Catalysts Market Y-o-Y Growth Rate Comparison by Country (2016-2032)
- Table 34: Western Europe Refining Catalysts Market Y-o-Y Growth Rate Comparison by By process (2016-2032)
- Table 35: Western Europe Refining Catalysts Market Y-o-Y Growth Rate Comparison by By type (2016-2032)
- Table 36: Western Europe Refining Catalysts Market Share Comparison by Country (2016-2032)
- Table 37: Western Europe Refining Catalysts Market Share Comparison by By process (2016-2032)
- Table 38: Western Europe Refining Catalysts Market Share Comparison by By type (2016-2032)
- Table 39: Eastern Europe Refining Catalysts Market Comparison by By process (2016-2032)
- Table 40: Eastern Europe Refining Catalysts Market Comparison by By type (2016-2032)
- Table 41: Eastern Europe Refining Catalysts Market Revenue (US$ Mn) Comparison by Country (2016-2032)
- Table 42: Eastern Europe Refining Catalysts Market Revenue (US$ Mn) (2016-2032)
- Table 43: Eastern Europe Refining Catalysts Market Revenue (US$ Mn) Comparison by Country (2016-2032)
- Table 44: Eastern Europe Refining Catalysts Market Revenue (US$ Mn) Comparison by By process (2016-2032)
- Table 45: Eastern Europe Refining Catalysts Market Revenue (US$ Mn) Comparison by By type (2016-2032)
- Table 46: Eastern Europe Refining Catalysts Market Y-o-Y Growth Rate Comparison by Country (2016-2032)
- Table 47: Eastern Europe Refining Catalysts Market Y-o-Y Growth Rate Comparison by By process (2016-2032)
- Table 48: Eastern Europe Refining Catalysts Market Y-o-Y Growth Rate Comparison by By type (2016-2032)
- Table 49: Eastern Europe Refining Catalysts Market Share Comparison by Country (2016-2032)
- Table 50: Eastern Europe Refining Catalysts Market Share Comparison by By process (2016-2032)
- Table 51: Eastern Europe Refining Catalysts Market Share Comparison by By type (2016-2032)
- Table 52: APAC Refining Catalysts Market Comparison by By process (2016-2032)
- Table 53: APAC Refining Catalysts Market Comparison by By type (2016-2032)
- Table 54: APAC Refining Catalysts Market Revenue (US$ Mn) Comparison by Country (2016-2032)
- Table 55: APAC Refining Catalysts Market Revenue (US$ Mn) (2016-2032)
- Table 56: APAC Refining Catalysts Market Revenue (US$ Mn) Comparison by Country (2016-2032)
- Table 57: APAC Refining Catalysts Market Revenue (US$ Mn) Comparison by By process (2016-2032)
- Table 58: APAC Refining Catalysts Market Revenue (US$ Mn) Comparison by By type (2016-2032)
- Table 59: APAC Refining Catalysts Market Y-o-Y Growth Rate Comparison by Country (2016-2032)
- Table 60: APAC Refining Catalysts Market Y-o-Y Growth Rate Comparison by By process (2016-2032)
- Table 61: APAC Refining Catalysts Market Y-o-Y Growth Rate Comparison by By type (2016-2032)
- Table 62: APAC Refining Catalysts Market Share Comparison by Country (2016-2032)
- Table 63: APAC Refining Catalysts Market Share Comparison by By process (2016-2032)
- Table 64: APAC Refining Catalysts Market Share Comparison by By type (2016-2032)
- Table 65: Latin America Refining Catalysts Market Comparison by By process (2016-2032)
- Table 66: Latin America Refining Catalysts Market Comparison by By type (2016-2032)
- Table 67: Latin America Refining Catalysts Market Revenue (US$ Mn) Comparison by Country (2016-2032)
- Table 68: Latin America Refining Catalysts Market Revenue (US$ Mn) (2016-2032)
- Table 69: Latin America Refining Catalysts Market Revenue (US$ Mn) Comparison by Country (2016-2032)
- Table 70: Latin America Refining Catalysts Market Revenue (US$ Mn) Comparison by By process (2016-2032)
- Table 71: Latin America Refining Catalysts Market Revenue (US$ Mn) Comparison by By type (2016-2032)
- Table 72: Latin America Refining Catalysts Market Y-o-Y Growth Rate Comparison by Country (2016-2032)
- Table 73: Latin America Refining Catalysts Market Y-o-Y Growth Rate Comparison by By process (2016-2032)
- Table 74: Latin America Refining Catalysts Market Y-o-Y Growth Rate Comparison by By type (2016-2032)
- Table 75: Latin America Refining Catalysts Market Share Comparison by Country (2016-2032)
- Table 76: Latin America Refining Catalysts Market Share Comparison by By process (2016-2032)
- Table 77: Latin America Refining Catalysts Market Share Comparison by By type (2016-2032)
- Table 78: Middle East & Africa Refining Catalysts Market Comparison by By process (2016-2032)
- Table 79: Middle East & Africa Refining Catalysts Market Comparison by By type (2016-2032)
- Table 80: Middle East & Africa Refining Catalysts Market Revenue (US$ Mn) Comparison by Country (2016-2032)
- Table 81: Middle East & Africa Refining Catalysts Market Revenue (US$ Mn) (2016-2032)
- Table 82: Middle East & Africa Refining Catalysts Market Revenue (US$ Mn) Comparison by Country (2016-2032)
- Table 83: Middle East & Africa Refining Catalysts Market Revenue (US$ Mn) Comparison by By process (2016-2032)
- Table 84: Middle East & Africa Refining Catalysts Market Revenue (US$ Mn) Comparison by By type (2016-2032)
- Table 85: Middle East & Africa Refining Catalysts Market Y-o-Y Growth Rate Comparison by Country (2016-2032)
- Table 86: Middle East & Africa Refining Catalysts Market Y-o-Y Growth Rate Comparison by By process (2016-2032)
- Table 87: Middle East & Africa Refining Catalysts Market Y-o-Y Growth Rate Comparison by By type (2016-2032)
- Table 88: Middle East & Africa Refining Catalysts Market Share Comparison by Country (2016-2032)
- Table 89: Middle East & Africa Refining Catalysts Market Share Comparison by By process (2016-2032)
- Table 90: Middle East & Africa Refining Catalysts Market Share Comparison by By type (2016-2032)
- 1. Executive Summary
-
- Albemarle Corporation
- BASF SE
- Honeywell International Inc.
- Royal Dutch Shell plc
- R. Grace & Co.
- Axens SA
- Haldor Topsøe A/S
- Johnson Matthey Plc
- Clariant International AG
- Criterion Catalysts & Technologies L.P.
Our Clients


View Our Licence Options
