
Red Biotechnology Market By Product Type (Gene Therapy Products, Cell Therapy Products, Tissue-Engineered Products, Biopharmaceutical Production, Others), By Application (Pharmacogenomics, Biopharmaceutical Production, Gene Therapy, Genetic Testing), By End-user (Research Institutes, CMOs & CROs, Biopharmaceutical Industries, Others), By Region And Companies - Industry Segment Outlook, Market Assessment, Competition Scenario, Trends, And Forecast 2024-2033
-
47692
-
June 2024
-
300
-


-
This report was compiled by Trishita Deb Trishita Deb is an experienced market research and consulting professional with over 7 years of expertise across healthcare, consumer goods, and materials, contributing to over 400 healthcare-related reports. Correspondence Team Lead- Healthcare Linkedin | Detailed Market research Methodology Our methodology involves a mix of primary research, including interviews with leading mental health experts, and secondary research from reputable medical journals and databases. View Detailed Methodology Page
-
Quick Navigation
Report Overview
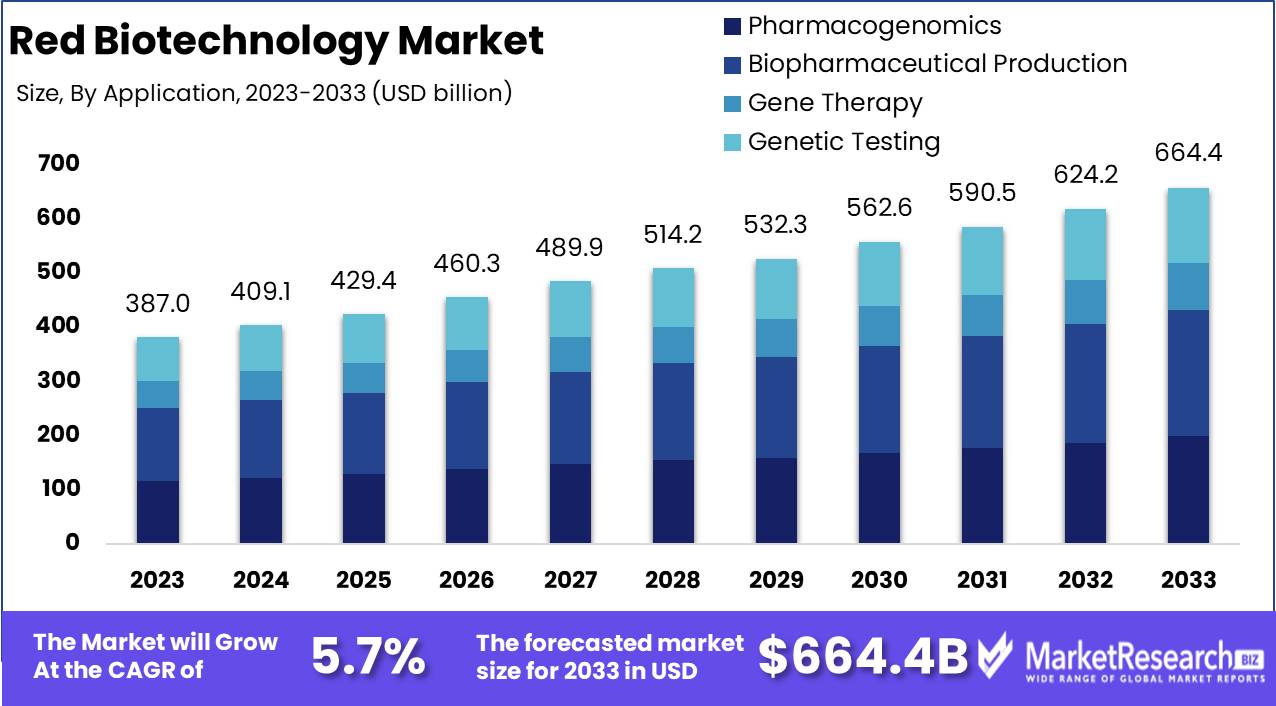
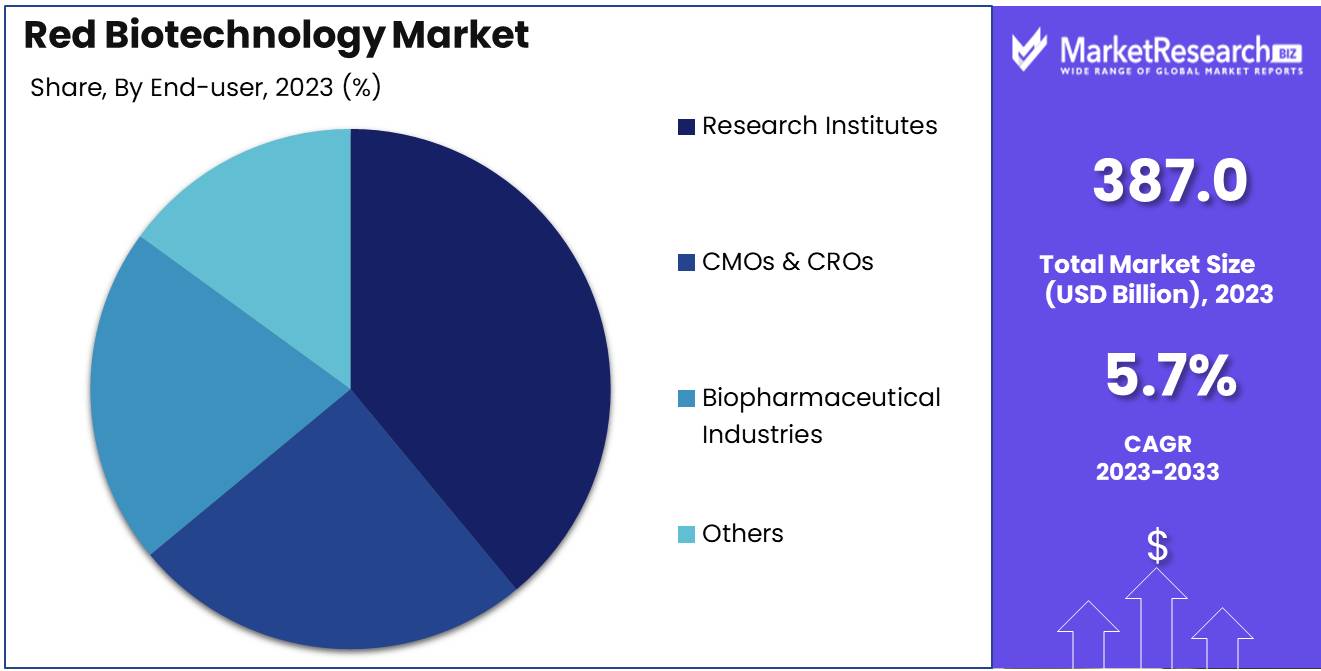
The Red Biotechnology Market was valued at USD 387.0 billion in 2023. It is expected to reach USD 664.4 billion by 2033, with a CAGR of 5.7% during the forecast period from 2024 to 2033.
The Red Biotechnology Market encompasses developing and applying biotechnological processes for medical and pharmaceutical purposes. It involves using organisms, cells, and biological molecules to produce therapeutics, vaccines, diagnostics, and genetically modified organisms. This market is pivotal in advancing personalized medicine, improving drug efficacy, and addressing unmet medical needs. Key areas include gene therapy, stem cell research, and biopharmaceuticals. The continuous innovation and growing demand for effective healthcare solutions drive significant investment and research in this sector, underscoring its critical importance in modern medicine and global health management.
The Red Biotechnology Market is experiencing transformative growth, driven by groundbreaking advancements in CRISPR-Cas9, next-generation sequencing (NGS), and regenerative medicine. These innovations are propelling the market forward by enabling more precise genetic editing, improving diagnostic accuracy, and enhancing therapeutic efficacy. The increasing number of over 5,000 active clinical trials underscores the sector’s robust research and development activities, with a notable focus on addressing critical areas such as cancer, rare genetic disorders, and infectious diseases. This extensive clinical pipeline reflects the sector's potential to deliver revolutionary treatments and significantly improve patient outcomes.
However, the market faces substantial challenges that could impede its growth trajectory. The high costs and prolonged timelines associated with developing biopharmaceuticals and gene therapies are significant barriers. These factors not only impact the financial feasibility of companies but also influence the accessibility of these advanced therapies to patients. As the industry continues to navigate these hurdles, strategic collaborations and innovative financing models will be crucial in sustaining momentum.
Overall, the Red Biotechnology Market stands at a pivotal juncture where the balance between technological innovation and cost management will define its future success.
Key Takeaways
- Market Growth: The Red Biotechnology Market was valued at USD 387.0 billion in 2023. It is expected to reach USD 664.4 billion by 2033, with a CAGR of 5.7% during the forecast period from 2024 to 2033.
- By Product Type: Gene Therapy Products dominated the Red Biotechnology Market.
- By Application: Biopharmaceutical Production dominated the Red Biotechnology Market applications.
- By End-user: Research Institutes dominated the red biotechnology market segment.
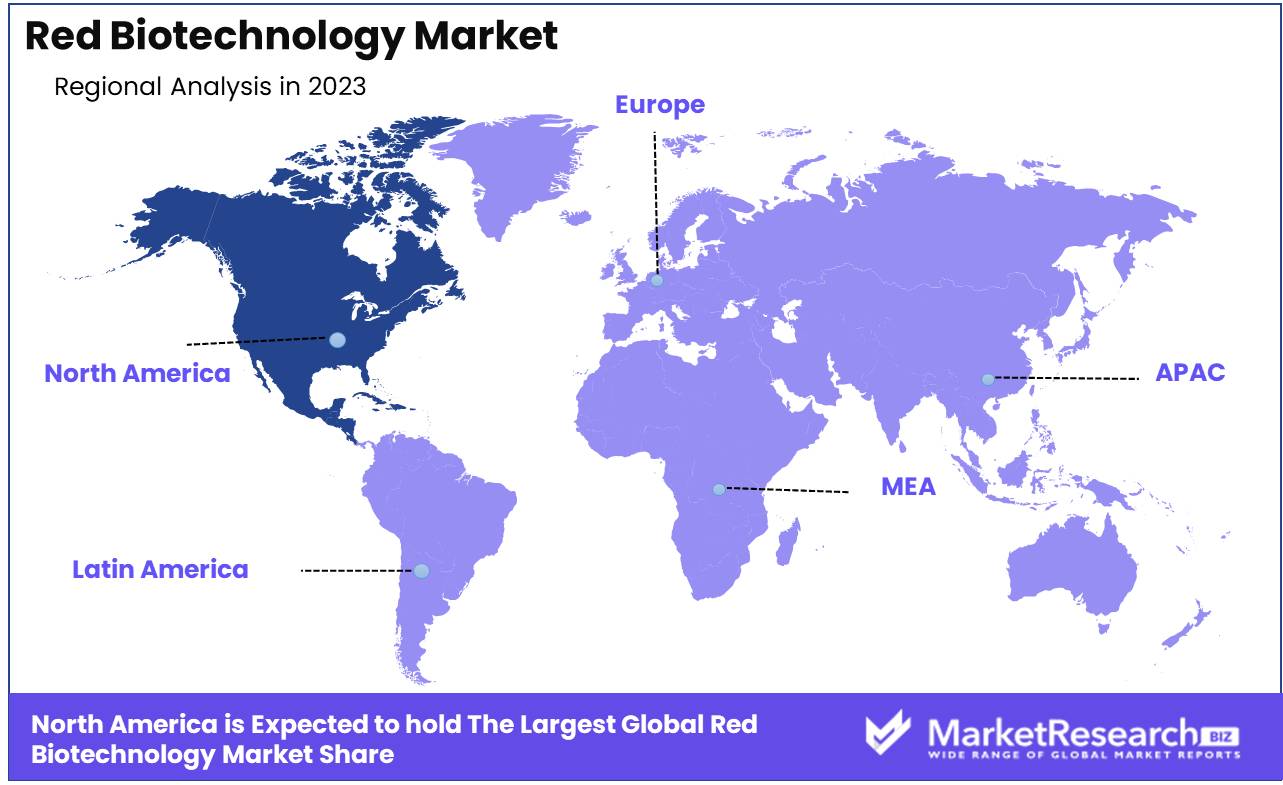
- Regional Dominance: North America leads the Red Biotechnology Market with a 45% largest market share.
- Growth Opportunity: Harnessing personalized medicine and AI advancements will drive significant growth and improved outcomes in the red biotechnology market.
Driving factors
Advancements in Gene Editing Technologies: Catalyzing Precision Medicine and Therapeutic Innovation
The red biotechnology market is significantly propelled by advancements in gene editing technologies, such as CRISPR-Cas9. These innovations have revolutionized the ability to modify genetic material with unprecedented precision, enabling the development of targeted therapies for a myriad of genetic disorders. For instance, CRISPR technology's capacity to correct mutations at the DNA level offers potential cures for conditions previously deemed untreatable. This technological leap not only enhances the efficacy of treatments but also reduces the risk of off-target effects, thereby improving patient outcomes. The market for gene editing was valued at approximately USD 3.7 billion in 2020 and is expected to reach USD 14.9 billion by 2028, reflecting a compound annual growth rate (CAGR) of 19.8%. This growth trajectory underscores the transformative impact of gene editing technologies on the red biotechnology sector, fostering innovation and expanding therapeutic possibilities.
Rising Incidence of Chronic and Rare Diseases: Driving Demand for Advanced Biotherapeutics
The increasing prevalence of chronic and rare diseases is a critical driver for the red biotechnology market. Chronic conditions such as diabetes, cancer, and cardiovascular diseases, along with a multitude of rare genetic disorders, create a substantial and growing demand for advanced biotherapeutics. The World Health Organization (WHO) reports that chronic diseases account for approximately 71% of all deaths globally, highlighting the urgent need for effective treatments.
Similarly, rare diseases, affecting 300 million people worldwide, present unique therapeutic challenges and opportunities for biotechnology solutions. This escalating burden necessitates continuous innovation in red biotechnology to develop novel drugs and therapies that can address these complex health issues. Consequently, the biopharmaceutical sector is poised to see robust growth, driven by the imperative to provide efficacious and personalized treatment options.
Growing Investment in Research and Development: Fueling Innovation and Market Expansion
Investment in research and development (R&D) is a cornerstone for the growth of the red biotechnology market. Governments, private enterprises, and academic institutions are increasingly channeling funds into biotechnological research, fostering an environment conducive to scientific breakthroughs and the commercialization of new therapies. Global R&D spending in the biotechnology sector was estimated at USD 45 billion, with projections indicating continued growth driven by the need for innovative healthcare solutions. This financial influx supports the discovery and development of cutting-edge biotechnological applications, from novel gene therapies to advanced biopharmaceuticals.
Moreover, partnerships and collaborations between biotech firms and research institutions accelerate the translation of scientific discoveries into marketable products, enhancing the overall pace of innovation. These investments are instrumental in maintaining the competitive edge of the red biotechnology sector, ensuring a steady pipeline of new therapies and diagnostics to meet the evolving healthcare demands.
Restraining Factors
High Cost of Drug Development: A Major Barrier to Market Expansion
The high cost of drug development is a significant restraining factor in the growth of the red biotechnology market. Developing new biopharmaceutical products involves substantial investment in research and development (R&D), clinical trials, and regulatory approval processes. According to a study of Drug Development, the average cost to bring a new drug to market is estimated to be around $2.6 billion, including the cost of failed trials. This immense financial burden limits the entry of new players into the market, consolidates the market power among established pharmaceutical giants, and often results in higher drug prices for consumers.
Moreover, these costs are further exacerbated by the lengthy timelines required for drug development, which can span over a decade from initial discovery to market launch. The extended duration of R&D not only ties up capital but also exposes companies to higher risks associated with technological failures and shifting regulatory landscapes. Consequently, the high cost of drug development creates a formidable barrier, slowing down the pace of innovation and market growth in the red biotechnology sector.
Technological Complexity: Impeding Market Progress
The technological complexity inherent in red biotechnology also plays a critical role in constraining market growth. Advanced biotechnological processes, such as genetic engineering, recombinant DNA technology, and cell culture techniques, require specialized knowledge and highly sophisticated equipment. The necessity for cutting-edge technology and expertise drives up the cost and time required for product development and scale-up.
Additionally, the complexity of these technologies poses significant challenges in terms of reproducibility and scalability. Ensuring that biotechnological processes can be consistently replicated at a commercial scale without loss of efficacy or safety is a major hurdle. These challenges are particularly pronounced in personalized medicine and gene therapy, where individualized treatments demand precise and reliable production methods.
By Product Type Analysis
In 2023, Gene Therapy Products dominated the Red Biotechnology Market.
In 2023, Gene Therapy Products held a dominant market position in the By Product Type segment of the Red Biotechnology Market. This dominance is attributed to significant advancements in genetic engineering technologies, which have led to the development of highly effective therapies for previously untreatable genetic disorders. Concurrently, Cell Therapy Products also demonstrated substantial growth, driven by the increasing adoption of regenerative medicine and personalized treatment approaches.
Tissue-engineered products, though at a nascent stage, showed promise in addressing complex tissue repair and organ replacement needs, reflecting advancements in scaffold development and biomaterials. The Biopharmaceutical Production segment witnessed robust expansion due to rising demand for biologics and biosimilars, leveraging biotechnological methods for more efficient and scalable production processes.
Additionally, the 'Others' category, encompassing a range of emerging technologies and applications, also contributed to market growth, spurred by continuous innovation and diversification within the biotechnology sector. Collectively, these segments underscore the dynamic and rapidly evolving nature of the Red Biotechnology Market, driven by technological breakthroughs and increasing healthcare demands.
By Application Analysis
In 2023, Biopharmaceutical Production dominated the Red Biotechnology Market applications.
In 2023, Biopharmaceutical Production held a dominant market position in the By Application segment of the Red Biotechnology Market, reflecting its critical role in advancing healthcare innovations. This segment, encompassing the manufacturing of therapeutic proteins, vaccines, and monoclonal antibodies, is driven by the increasing prevalence of chronic diseases and the growing demand for personalized medicine. Biopharmaceutical production benefits from advanced biotechnological methods, ensuring high efficiency and specificity in drug development.
Pharmacogenomics leverages genetic information to tailor drug therapies, enhancing efficacy and reducing adverse effects, thus experiencing substantial growth. Gene Therapy is gaining momentum due to its potential to treat genetic disorders at their root cause, representing a significant leap in therapeutic capabilities. Meanwhile, Genetic Testing continues to expand as it provides critical insights for disease prediction and management, aiding in early intervention strategies. Each of these applications collectively contributes to the robust landscape of the Red Biotechnology Market, yet biopharmaceutical production remains at the forefront due to its extensive application in creating life-saving therapies and its substantial investment in research and development.
By End-user Analysis
In 2023, Research Institutes dominated the Red Biotechnology Market segment.
In 2023, Research Institutes held a dominant market position in the "By End-user" segment of the red biotechnology market. This preeminence is driven by their extensive involvement in pioneering genetic research, drug development, and innovative therapeutic techniques. Research institutes benefit from substantial funding, both public and private, enabling them to push the boundaries of biotechnology. Additionally, their collaborative efforts with biopharmaceutical industries and academic entities facilitate advanced research and development (R&D) capabilities, accelerating the discovery of novel treatments and biotechnological applications.
Contract manufacturing organizations (CMOs) and contract research organizations (CROs) also play a critical role, leveraging their specialized services to support research institutes and biopharmaceutical companies. Their expertise in clinical trials, regulatory compliance, and large-scale production contributes significantly to the commercialization of biotechnological products.
Biopharmaceutical industries are pivotal in translating research breakthroughs into marketable therapies and driving innovation through substantial R&D investments and strategic partnerships. They are instrumental in advancing personalized medicine and developing targeted treatments.
Lastly, the "Others" category encompasses a diverse range of stakeholders, including healthcare providers, regulatory bodies, and non-profit organizations, all contributing to the dynamic growth and evolution of the red biotechnology market.
Key Market Segments
By Product Type
- Gene Therapy Products
- Cell Therapy Products
- Tissue-Engineered Products
- Biopharmaceutical Production
- Others
By Application
- Pharmacogenomics
- Biopharmaceutical Production
- Gene Therapy
- Genetic Testing
By End-user
- Research Institutes
- CMOs & CROs
- Biopharmaceutical Industries
- Others
Growth Opportunity
Increasing Adoption of Personalized Medicine
The global red biotechnology market is poised for significant growth driven primarily by the increasing adoption of personalized medicine. Personalized medicine tailors treatment to individual patient characteristics, leading to more effective and efficient healthcare solutions. This approach is gaining traction due to its potential to enhance patient outcomes, minimize adverse effects, and optimize therapeutic efficacy.
As healthcare systems worldwide shift towards value-based care, the demand for personalized medicine is expected to surge, providing a substantial growth opportunity for the red biotechnology sector. Companies investing in genomics, proteomics, and bioinformatics are particularly well-positioned to capitalize on this trend, as these fields are integral to the development and implementation of personalized treatment strategies.
Advancements in AI and Big Data Analytics
The integration of artificial intelligence (AI) and big data analytics into red biotechnology is another key driver of market growth. AI and big data analytics facilitate the rapid analysis of large datasets, enabling the identification of complex biological patterns and the acceleration of drug discovery processes. These technologies are transforming how research is conducted, leading to more efficient and cost-effective development of biopharmaceuticals.
In companies leveraging AI and big data will likely gain a competitive edge by speeding up the R&D pipeline, improving diagnostic accuracy, and enhancing patient stratification in clinical trials. The convergence of AI, big data, and red biotechnology is anticipated to unlock new therapeutic avenues and significantly boost market growth.
Latest Trends
Advancements in 3D Printing
The red biotechnology market is poised for significant transformation driven by cutting-edge advancements in 3D printing technology. This innovation is revolutionizing the development and production of biological materials and structures, offering unprecedented precision and customization. In particular, 3D bioprinting is emerging as a game-changer for tissue engineering and regenerative medicine. It allows for the creation of complex tissue structures that closely mimic natural biological environments, enhancing the potential for successful transplantation and reducing reliance on donor organs.
Additionally, 3D printing is streamlining the drug development process by enabling the production of precise, patient-specific dosage forms and drug delivery systems, ultimately accelerating the journey from laboratory research to clinical application.
Growing Demand for Biopharmaceuticals
The demand for biopharmaceuticals is anticipated to surge, driven by their efficacy and specificity in treating a wide array of chronic and complex diseases. Biopharmaceuticals, including monoclonal antibodies, vaccines, and recombinant proteins, offer targeted therapeutic solutions with fewer side effects compared to traditional pharmaceuticals. This trend is fueled by the increasing prevalence of chronic diseases, aging populations, and heightened awareness and accessibility of advanced therapies.
Furthermore, the biopharmaceutical industry is benefiting from regulatory support and significant R&D investments, fostering innovation and expediting the introduction of novel therapies. As a result, companies in the red biotechnology market are focusing on expanding their biopharmaceutical portfolios, optimizing production processes, and enhancing distribution channels to meet growing global demand.
Regional Analysis
North America leads the Red Biotechnology Market with a 45% largest market share.
The global Red Biotechnology Market exhibits significant regional variations, driven by differing levels of technological adoption, healthcare infrastructure, and investment in research and development. North America, particularly the United States, dominates the market with a substantial share of approximately 45%, attributed to its advanced biotechnological research facilities, robust healthcare system, and high expenditure on R&D. The region's leadership is further bolstered by strong government support and well-established pharmaceutical industry.
In Europe, the market is propelled by countries such as Germany, the United Kingdom, and France, which collectively account for a notable market share. Europe benefits from a high level of investment in biotechnology research, favorable regulatory environments, and a collaborative network of academic and research institutions.
The Asia Pacific region is experiencing rapid growth, driven by increasing healthcare expenditure, expanding biotechnological research, and a growing number of biotechnology startups. Key markets include China, India, and Japan, where government initiatives and investments are accelerating market development.
The Middle East & Africa and Latin America regions are emerging markets with significant potential. Growth in these regions is primarily fueled by improving healthcare infrastructure, rising awareness of biotechnological advancements, and increasing investments in the healthcare sector. While these regions currently hold a smaller share compared to North America and Europe, ongoing developments suggest a positive growth trajectory in the coming years.
Key Regions and Countries
North America
- The US
- Canada
- Rest of North America
Europe
- Germany
- France
- The UK
- Spain
- Netherlands
- Russia
- Italy
- Rest of Europe
Asia-Pacific
- China
- Japan
- Singapore
- Thailand
- South Korea
- Vietnam
- India
- New Zealand
- Rest of Asia Pacific
Latin America
- Mexico
- Brazil
- Rest of Latin America
Middle East & Africa
- Saudi Arabia
- South Africa
- UAE
- Rest of the Middle East & Africa
Key Players Analysis
In 2024, the global red biotechnology market is poised for significant growth, driven by the continued innovation and strategic positioning of leading companies. Hoffmann-La Roche Ltd. and Merck KGaA remain at the forefront, leveraging robust R&D pipelines and extensive global reach. Roche’s strategic focus on personalized medicine and diagnostics, combined with Merck’s advancements in biopharmaceuticals, solidify their leadership.
Regeneron Pharmaceuticals, Inc. and Pfizer, Inc. continue to excel through groundbreaking biologics and monoclonal antibodies, addressing critical unmet medical needs. Regeneron’s proprietary VelociSuite® technologies and Pfizer’s expansive portfolio, particularly in oncology and immunotherapy, underscore their competitive edge.
Biogen Inc. and Amgen Inc. are pivotal in the neurology and oncology sectors, respectively. Biogen’s commitment to neurodegenerative diseases and Amgen’s innovative cancer treatments highlight their market influence. AstraZeneca Plc. and Takeda Pharmaceutical Company Ltd. enhance their positions through strategic mergers and acquisitions, expanding their therapeutic areas and geographic presence.
Gilead Sciences, Inc. and Celgene Corporation (a Bristol-Myers Squibb company) focus on transformative therapies for viral diseases and hematologic malignancies, respectively. Gilead’s expertise in antiviral therapies and Celgene’s stronghold in hematology reinforce their pivotal roles in the market.
Overall, these companies’ continuous innovation, strategic collaborations, and diversified portfolios drive the red biotechnology market's advancement, promising improved patient outcomes and sustained industry growth.
Market Key Players
- Hoffmann-La Roche, Ltd.
- Merck KGaA
- Regeneron Pharmaceuticals, Inc.
- Pfizer Inc.
- Biogen Inc.
- Amgen Inc.
- AstraZeneca Plc.
- Takeda Pharmaceutical Company Ltd.
- Gilead Sciences, Inc.
- CELGENE CORPORATION
Recent Development
- In March 2024, Merck and Moderna announced a strategic collaboration to develop and commercialize personalized cancer vaccines. This partnership leverages Moderna's mRNA technology and Merck's extensive cancer immunotherapy expertise, aiming to bring innovative cancer treatments to market more rapidly.
- In February 2024, Janssen Pharmaceuticals received FDA approval for CARVYKTI, a BCMA-directed CAR-T cell therapy for patients with relapsed or refractory multiple myeloma. This development highlights the progress in cell therapies within the red biotechnology sector.
- In January 2024, Eli Lilly entered into a research and collaboration agreement with Entos Pharmaceuticals. This partnership, valued at $400 million, focuses on developing nucleic acid-based therapies for neurological conditions using Entos' Fusogenix delivery technology. This agreement is expected to drive significant advancements in therapeutic applications within red biotechnology.
Report Scope
Report Features Description Market Value (2023) USD 387.0 Billion Forecast Revenue (2033) USD 664.4 Billion CAGR (2024-2032) 5.7% Base Year for Estimation 2023 Historic Period 2016-2023 Forecast Period 2024-2033 Report Coverage Revenue Forecast, Market Dynamics, COVID-19 Impact, Competitive Landscape, Recent Developments Segments Covered By Product Type (Gene Therapy Products, Cell Therapy Products, Tissue-Engineered Products, Biopharmaceutical Production, Others), By Application (Pharmacogenomics, Biopharmaceutical Production, Gene Therapy, Genetic Testing), By End-user (Research Institutes, CMOs & CROs, Biopharmaceutical Industries, Others) Regional Analysis North America - The US, Canada, Rest of North America, Europe - Germany, France, The UK, Spain, Italy, Russia, Netherlands, Rest of Europe, Asia-Pacific - China, Japan, South Korea, India, New Zealand, Singapore, Thailand, Vietnam, Rest of Asia Pacific, Latin America - Brazil, Mexico, Rest of Latin America, Middle East & Africa - South Africa, Saudi Arabia, UAE, Rest of Middle East & Africa Competitive Landscape Hoffmann-La Roche, Ltd., Merck KGaA, Regeneron Pharmaceuticals, Inc., Pfizer Inc., Biogen Inc., Amgen Inc., AstraZeneca Plc., Takeda Pharmaceutical Company Ltd., Gilead Sciences, Inc., CELGENE CORPORATION Customization Scope Customization for segments, region/country-level will be provided. Moreover, additional customization can be done based on the requirements. Purchase Options We have three licenses to opt for Single User License, Multi-User License (Up to 5 Users), Corporate Use License (Unlimited User and Printable PDF) -
- 1. Executive Summary
- 1.1. Definition
- 1.2. Taxonomy
- 1.3. Research Scope
- 1.4. Key Analysis
- 1.5. Key Findings by Major Segments
- 1.6. Top strategies by Major Players
- 2. Global Red Biotechnology Market Overview
- 2.1. Red Biotechnology Market Dynamics
- 2.1.1. Drivers
- 2.1.2. Opportunities
- 2.1.3. Restraints
- 2.1.4. Challenges
- 2.2. Macro-economic Factors
- 2.3. Regulatory Framework
- 2.4. Market Investment Feasibility Index
- 2.5. PEST Analysis
- 2.6. PORTER’S Five Force Analysis
- 2.7. Drivers & Restraints Impact Analysis
- 2.8. Industry Chain Analysis
- 2.9. Cost Structure Analysis
- 2.10. Marketing Strategy
- 2.11. Russia-Ukraine War Impact Analysis
- 2.12. Opportunity Map Analysis
- 2.13. Market Competition Scenario Analysis
- 2.14. Product Life Cycle Analysis
- 2.15. Opportunity Orbits
- 2.16. Manufacturer Intensity Map
- 2.17. Major Companies sales by Value & Volume
- 2.1. Red Biotechnology Market Dynamics
- 3. Global Red Biotechnology Market Analysis, Opportunity and Forecast, 2016-2032
- 3.1. Global Red Biotechnology Market Analysis, 2016-2021
- 3.2. Global Red Biotechnology Market Opportunity and Forecast, 2023-2032
- 3.3. Global Red Biotechnology Market Analysis, Opportunity and Forecast, By Product Type, 2016-2032
- 3.3.1. Global Red Biotechnology Market Analysis by Product Type: Introduction
- 3.3.2. Market Size Absolute $ Opportunity Analysis and Forecast, By Product Type, 2016-2032
- 3.3.3. Gene Therapy Products
- 3.3.4. Cell Therapy Products
- 3.3.5. Tissue-Engineered Products
- 3.3.6. Biopharmaceutical Production
- 3.3.7. Others
- 3.4. Global Red Biotechnology Market Analysis, Opportunity and Forecast, By Application, 2016-2032
- 3.4.1. Global Red Biotechnology Market Analysis by Application: Introduction
- 3.4.2. Market Size Absolute $ Opportunity Analysis and Forecast, By Application, 2016-2032
- 3.4.3. Pharmacogenomics
- 3.4.4. Biopharmaceutical Production
- 3.4.5. Gene Therapy
- 3.4.6. Genetic Testing
- 3.5. Global Red Biotechnology Market Analysis, Opportunity and Forecast, By End-user, 2016-2032
- 3.5.1. Global Red Biotechnology Market Analysis by End-user: Introduction
- 3.5.2. Market Size Absolute $ Opportunity Analysis and Forecast, By End-user, 2016-2032
- 3.5.3. Research Institutes
- 3.5.4. CMOs & CROs
- 3.5.5. Biopharmaceutical Industries
- 3.5.6. Others
- 4. North America Red Biotechnology Market Analysis, Opportunity and Forecast, 2016-2032
- 4.1. North America Red Biotechnology Market Analysis, 2016-2021
- 4.2. North America Red Biotechnology Market Opportunity and Forecast, 2023-2032
- 4.3. North America Red Biotechnology Market Analysis, Opportunity and Forecast, By Product Type, 2016-2032
- 4.3.1. North America Red Biotechnology Market Analysis by Product Type: Introduction
- 4.3.2. Market Size Absolute $ Opportunity Analysis and Forecast, By Product Type, 2016-2032
- 4.3.3. Gene Therapy Products
- 4.3.4. Cell Therapy Products
- 4.3.5. Tissue-Engineered Products
- 4.3.6. Biopharmaceutical Production
- 4.3.7. Others
- 4.4. North America Red Biotechnology Market Analysis, Opportunity and Forecast, By Application, 2016-2032
- 4.4.1. North America Red Biotechnology Market Analysis by Application: Introduction
- 4.4.2. Market Size Absolute $ Opportunity Analysis and Forecast, By Application, 2016-2032
- 4.4.3. Pharmacogenomics
- 4.4.4. Biopharmaceutical Production
- 4.4.5. Gene Therapy
- 4.4.6. Genetic Testing
- 4.5. North America Red Biotechnology Market Analysis, Opportunity and Forecast, By End-user, 2016-2032
- 4.5.1. North America Red Biotechnology Market Analysis by End-user: Introduction
- 4.5.2. Market Size Absolute $ Opportunity Analysis and Forecast, By End-user, 2016-2032
- 4.5.3. Research Institutes
- 4.5.4. CMOs & CROs
- 4.5.5. Biopharmaceutical Industries
- 4.5.6. Others
- 4.6. North America Red Biotechnology Market Analysis, Opportunity and Forecast, By Country , 2016-2032
- 4.6.1. North America Red Biotechnology Market Analysis by Country : Introduction
- 4.6.2. Market Size Absolute $ Opportunity Analysis and Forecast, Country , 2016-2032
- 4.6.2.1. The US
- 4.6.2.2. Canada
- 4.6.2.3. Mexico
- 5. Western Europe Red Biotechnology Market Analysis, Opportunity and Forecast, 2016-2032
- 5.1. Western Europe Red Biotechnology Market Analysis, 2016-2021
- 5.2. Western Europe Red Biotechnology Market Opportunity and Forecast, 2023-2032
- 5.3. Western Europe Red Biotechnology Market Analysis, Opportunity and Forecast, By Product Type, 2016-2032
- 5.3.1. Western Europe Red Biotechnology Market Analysis by Product Type: Introduction
- 5.3.2. Market Size Absolute $ Opportunity Analysis and Forecast, By Product Type, 2016-2032
- 5.3.3. Gene Therapy Products
- 5.3.4. Cell Therapy Products
- 5.3.5. Tissue-Engineered Products
- 5.3.6. Biopharmaceutical Production
- 5.3.7. Others
- 5.4. Western Europe Red Biotechnology Market Analysis, Opportunity and Forecast, By Application, 2016-2032
- 5.4.1. Western Europe Red Biotechnology Market Analysis by Application: Introduction
- 5.4.2. Market Size Absolute $ Opportunity Analysis and Forecast, By Application, 2016-2032
- 5.4.3. Pharmacogenomics
- 5.4.4. Biopharmaceutical Production
- 5.4.5. Gene Therapy
- 5.4.6. Genetic Testing
- 5.5. Western Europe Red Biotechnology Market Analysis, Opportunity and Forecast, By End-user, 2016-2032
- 5.5.1. Western Europe Red Biotechnology Market Analysis by End-user: Introduction
- 5.5.2. Market Size Absolute $ Opportunity Analysis and Forecast, By End-user, 2016-2032
- 5.5.3. Research Institutes
- 5.5.4. CMOs & CROs
- 5.5.5. Biopharmaceutical Industries
- 5.5.6. Others
- 5.6. Western Europe Red Biotechnology Market Analysis, Opportunity and Forecast, By Country , 2016-2032
- 5.6.1. Western Europe Red Biotechnology Market Analysis by Country : Introduction
- 5.6.2. Market Size Absolute $ Opportunity Analysis and Forecast, Country , 2016-2032
- 5.6.2.1. Germany
- 5.6.2.2. France
- 5.6.2.3. The UK
- 5.6.2.4. Spain
- 5.6.2.5. Italy
- 5.6.2.6. Portugal
- 5.6.2.7. Ireland
- 5.6.2.8. Austria
- 5.6.2.9. Switzerland
- 5.6.2.10. Benelux
- 5.6.2.11. Nordic
- 5.6.2.12. Rest of Western Europe
- 6. Eastern Europe Red Biotechnology Market Analysis, Opportunity and Forecast, 2016-2032
- 6.1. Eastern Europe Red Biotechnology Market Analysis, 2016-2021
- 6.2. Eastern Europe Red Biotechnology Market Opportunity and Forecast, 2023-2032
- 6.3. Eastern Europe Red Biotechnology Market Analysis, Opportunity and Forecast, By Product Type, 2016-2032
- 6.3.1. Eastern Europe Red Biotechnology Market Analysis by Product Type: Introduction
- 6.3.2. Market Size Absolute $ Opportunity Analysis and Forecast, By Product Type, 2016-2032
- 6.3.3. Gene Therapy Products
- 6.3.4. Cell Therapy Products
- 6.3.5. Tissue-Engineered Products
- 6.3.6. Biopharmaceutical Production
- 6.3.7. Others
- 6.4. Eastern Europe Red Biotechnology Market Analysis, Opportunity and Forecast, By Application, 2016-2032
- 6.4.1. Eastern Europe Red Biotechnology Market Analysis by Application: Introduction
- 6.4.2. Market Size Absolute $ Opportunity Analysis and Forecast, By Application, 2016-2032
- 6.4.3. Pharmacogenomics
- 6.4.4. Biopharmaceutical Production
- 6.4.5. Gene Therapy
- 6.4.6. Genetic Testing
- 6.5. Eastern Europe Red Biotechnology Market Analysis, Opportunity and Forecast, By End-user, 2016-2032
- 6.5.1. Eastern Europe Red Biotechnology Market Analysis by End-user: Introduction
- 6.5.2. Market Size Absolute $ Opportunity Analysis and Forecast, By End-user, 2016-2032
- 6.5.3. Research Institutes
- 6.5.4. CMOs & CROs
- 6.5.5. Biopharmaceutical Industries
- 6.5.6. Others
- 6.6. Eastern Europe Red Biotechnology Market Analysis, Opportunity and Forecast, By Country , 2016-2032
- 6.6.1. Eastern Europe Red Biotechnology Market Analysis by Country : Introduction
- 6.6.2. Market Size Absolute $ Opportunity Analysis and Forecast, Country , 2016-2032
- 6.6.2.1. Russia
- 6.6.2.2. Poland
- 6.6.2.3. The Czech Republic
- 6.6.2.4. Greece
- 6.6.2.5. Rest of Eastern Europe
- 7. APAC Red Biotechnology Market Analysis, Opportunity and Forecast, 2016-2032
- 7.1. APAC Red Biotechnology Market Analysis, 2016-2021
- 7.2. APAC Red Biotechnology Market Opportunity and Forecast, 2023-2032
- 7.3. APAC Red Biotechnology Market Analysis, Opportunity and Forecast, By Product Type, 2016-2032
- 7.3.1. APAC Red Biotechnology Market Analysis by Product Type: Introduction
- 7.3.2. Market Size Absolute $ Opportunity Analysis and Forecast, By Product Type, 2016-2032
- 7.3.3. Gene Therapy Products
- 7.3.4. Cell Therapy Products
- 7.3.5. Tissue-Engineered Products
- 7.3.6. Biopharmaceutical Production
- 7.3.7. Others
- 7.4. APAC Red Biotechnology Market Analysis, Opportunity and Forecast, By Application, 2016-2032
- 7.4.1. APAC Red Biotechnology Market Analysis by Application: Introduction
- 7.4.2. Market Size Absolute $ Opportunity Analysis and Forecast, By Application, 2016-2032
- 7.4.3. Pharmacogenomics
- 7.4.4. Biopharmaceutical Production
- 7.4.5. Gene Therapy
- 7.4.6. Genetic Testing
- 7.5. APAC Red Biotechnology Market Analysis, Opportunity and Forecast, By End-user, 2016-2032
- 7.5.1. APAC Red Biotechnology Market Analysis by End-user: Introduction
- 7.5.2. Market Size Absolute $ Opportunity Analysis and Forecast, By End-user, 2016-2032
- 7.5.3. Research Institutes
- 7.5.4. CMOs & CROs
- 7.5.5. Biopharmaceutical Industries
- 7.5.6. Others
- 7.6. APAC Red Biotechnology Market Analysis, Opportunity and Forecast, By Country , 2016-2032
- 7.6.1. APAC Red Biotechnology Market Analysis by Country : Introduction
- 7.6.2. Market Size Absolute $ Opportunity Analysis and Forecast, Country , 2016-2032
- 7.6.2.1. China
- 7.6.2.2. Japan
- 7.6.2.3. South Korea
- 7.6.2.4. India
- 7.6.2.5. Australia & New Zeland
- 7.6.2.6. Indonesia
- 7.6.2.7. Malaysia
- 7.6.2.8. Philippines
- 7.6.2.9. Singapore
- 7.6.2.10. Thailand
- 7.6.2.11. Vietnam
- 7.6.2.12. Rest of APAC
- 8. Latin America Red Biotechnology Market Analysis, Opportunity and Forecast, 2016-2032
- 8.1. Latin America Red Biotechnology Market Analysis, 2016-2021
- 8.2. Latin America Red Biotechnology Market Opportunity and Forecast, 2023-2032
- 8.3. Latin America Red Biotechnology Market Analysis, Opportunity and Forecast, By Product Type, 2016-2032
- 8.3.1. Latin America Red Biotechnology Market Analysis by Product Type: Introduction
- 8.3.2. Market Size Absolute $ Opportunity Analysis and Forecast, By Product Type, 2016-2032
- 8.3.3. Gene Therapy Products
- 8.3.4. Cell Therapy Products
- 8.3.5. Tissue-Engineered Products
- 8.3.6. Biopharmaceutical Production
- 8.3.7. Others
- 8.4. Latin America Red Biotechnology Market Analysis, Opportunity and Forecast, By Application, 2016-2032
- 8.4.1. Latin America Red Biotechnology Market Analysis by Application: Introduction
- 8.4.2. Market Size Absolute $ Opportunity Analysis and Forecast, By Application, 2016-2032
- 8.4.3. Pharmacogenomics
- 8.4.4. Biopharmaceutical Production
- 8.4.5. Gene Therapy
- 8.4.6. Genetic Testing
- 8.5. Latin America Red Biotechnology Market Analysis, Opportunity and Forecast, By End-user, 2016-2032
- 8.5.1. Latin America Red Biotechnology Market Analysis by End-user: Introduction
- 8.5.2. Market Size Absolute $ Opportunity Analysis and Forecast, By End-user, 2016-2032
- 8.5.3. Research Institutes
- 8.5.4. CMOs & CROs
- 8.5.5. Biopharmaceutical Industries
- 8.5.6. Others
- 8.6. Latin America Red Biotechnology Market Analysis, Opportunity and Forecast, By Country , 2016-2032
- 8.6.1. Latin America Red Biotechnology Market Analysis by Country : Introduction
- 8.6.2. Market Size Absolute $ Opportunity Analysis and Forecast, Country , 2016-2032
- 8.6.2.1. Brazil
- 8.6.2.2. Colombia
- 8.6.2.3. Chile
- 8.6.2.4. Argentina
- 8.6.2.5. Costa Rica
- 8.6.2.6. Rest of Latin America
- 9. Middle East & Africa Red Biotechnology Market Analysis, Opportunity and Forecast, 2016-2032
- 9.1. Middle East & Africa Red Biotechnology Market Analysis, 2016-2021
- 9.2. Middle East & Africa Red Biotechnology Market Opportunity and Forecast, 2023-2032
- 9.3. Middle East & Africa Red Biotechnology Market Analysis, Opportunity and Forecast, By Product Type, 2016-2032
- 9.3.1. Middle East & Africa Red Biotechnology Market Analysis by Product Type: Introduction
- 9.3.2. Market Size Absolute $ Opportunity Analysis and Forecast, By Product Type, 2016-2032
- 9.3.3. Gene Therapy Products
- 9.3.4. Cell Therapy Products
- 9.3.5. Tissue-Engineered Products
- 9.3.6. Biopharmaceutical Production
- 9.3.7. Others
- 9.4. Middle East & Africa Red Biotechnology Market Analysis, Opportunity and Forecast, By Application, 2016-2032
- 9.4.1. Middle East & Africa Red Biotechnology Market Analysis by Application: Introduction
- 9.4.2. Market Size Absolute $ Opportunity Analysis and Forecast, By Application, 2016-2032
- 9.4.3. Pharmacogenomics
- 9.4.4. Biopharmaceutical Production
- 9.4.5. Gene Therapy
- 9.4.6. Genetic Testing
- 9.5. Middle East & Africa Red Biotechnology Market Analysis, Opportunity and Forecast, By End-user, 2016-2032
- 9.5.1. Middle East & Africa Red Biotechnology Market Analysis by End-user: Introduction
- 9.5.2. Market Size Absolute $ Opportunity Analysis and Forecast, By End-user, 2016-2032
- 9.5.3. Research Institutes
- 9.5.4. CMOs & CROs
- 9.5.5. Biopharmaceutical Industries
- 9.5.6. Others
- 9.6. Middle East & Africa Red Biotechnology Market Analysis, Opportunity and Forecast, By Country , 2016-2032
- 9.6.1. Middle East & Africa Red Biotechnology Market Analysis by Country : Introduction
- 9.6.2. Market Size Absolute $ Opportunity Analysis and Forecast, Country , 2016-2032
- 9.6.2.1. Algeria
- 9.6.2.2. Egypt
- 9.6.2.3. Israel
- 9.6.2.4. Kuwait
- 9.6.2.5. Nigeria
- 9.6.2.6. Saudi Arabia
- 9.6.2.7. South Africa
- 9.6.2.8. Turkey
- 9.6.2.9. The UAE
- 9.6.2.10. Rest of MEA
- 10. Global Red Biotechnology Market Analysis, Opportunity and Forecast, By Region , 2016-2032
- 10.1. Global Red Biotechnology Market Analysis by Region : Introduction
- 10.2. Market Size Absolute $ Opportunity Analysis and Forecast, By Region , 2016-2032
- 10.2.1. North America
- 10.2.2. Western Europe
- 10.2.3. Eastern Europe
- 10.2.4. APAC
- 10.2.5. Latin America
- 10.2.6. Middle East & Africa
- 11. Global Red Biotechnology Market Competitive Landscape, Market Share Analysis, and Company Profiles
- 11.1. Market Share Analysis
- 11.2. Company Profiles
- 11.3. Hoffmann-La Roche, Ltd.
- 11.3.1. Company Overview
- 11.3.2. Financial Highlights
- 11.3.3. Product Portfolio
- 11.3.4. SWOT Analysis
- 11.3.5. Key Strategies and Developments
- 11.4. Merck KGaA
- 11.4.1. Company Overview
- 11.4.2. Financial Highlights
- 11.4.3. Product Portfolio
- 11.4.4. SWOT Analysis
- 11.4.5. Key Strategies and Developments
- 11.5. Regeneron Pharmaceuticals, Inc.
- 11.5.1. Company Overview
- 11.5.2. Financial Highlights
- 11.5.3. Product Portfolio
- 11.5.4. SWOT Analysis
- 11.5.5. Key Strategies and Developments
- 11.6. Pfizer Inc.
- 11.6.1. Company Overview
- 11.6.2. Financial Highlights
- 11.6.3. Product Portfolio
- 11.6.4. SWOT Analysis
- 11.6.5. Key Strategies and Developments
- 11.7. Biogen Inc.
- 11.7.1. Company Overview
- 11.7.2. Financial Highlights
- 11.7.3. Product Portfolio
- 11.7.4. SWOT Analysis
- 11.7.5. Key Strategies and Developments
- 11.8. Amgen Inc.
- 11.8.1. Company Overview
- 11.8.2. Financial Highlights
- 11.8.3. Product Portfolio
- 11.8.4. SWOT Analysis
- 11.8.5. Key Strategies and Developments
- 11.9. AstraZeneca Plc.
- 11.9.1. Company Overview
- 11.9.2. Financial Highlights
- 11.9.3. Product Portfolio
- 11.9.4. SWOT Analysis
- 11.9.5. Key Strategies and Developments
- 11.10. Takeda Pharmaceutical Company Ltd.
- 11.10.1. Company Overview
- 11.10.2. Financial Highlights
- 11.10.3. Product Portfolio
- 11.10.4. SWOT Analysis
- 11.10.5. Key Strategies and Developments
- 11.11. Gilead Sciences, Inc.
- 11.11.1. Company Overview
- 11.11.2. Financial Highlights
- 11.11.3. Product Portfolio
- 11.11.4. SWOT Analysis
- 11.11.5. Key Strategies and Developments
- 11.12. CELGENE CORPORATION
- 11.12.1. Company Overview
- 11.12.2. Financial Highlights
- 11.12.3. Product Portfolio
- 11.12.4. SWOT Analysis
- 11.12.5. Key Strategies and Developments
- 11.13.1. Company Overview
- 11.13.2. Financial Highlights
- 11.13.3. Product Portfolio
- 11.13.4. SWOT Analysis
- 11.13.5. Key Strategies and Developments
- 12. Assumptions and Acronyms
- 13. Research Methodology
- 14. Contact
"
- List of Figures
- "
- Figure 1: Global Red Biotechnology Market Revenue (US$ Mn) Market Share by Product Type in 2022
- Figure 2: Global Red Biotechnology Market Market Attractiveness Analysis by Product Type, 2016-2032
- Figure 3: Global Red Biotechnology Market Revenue (US$ Mn) Market Share by Applicationin 2022
- Figure 4: Global Red Biotechnology Market Market Attractiveness Analysis by Application, 2016-2032
- Figure 5: Global Red Biotechnology Market Revenue (US$ Mn) Market Share by End-userin 2022
- Figure 6: Global Red Biotechnology Market Market Attractiveness Analysis by End-user, 2016-2032
- Figure 7: Global Red Biotechnology Market Revenue (US$ Mn) Market Share by Region in 2022
- Figure 8: Global Red Biotechnology Market Market Attractiveness Analysis by Region, 2016-2032
- Figure 9: Global Red Biotechnology Market Market Revenue (US$ Mn) (2016-2032)
- Figure 10: Global Red Biotechnology Market Market Revenue (US$ Mn) Comparison by Region (2016-2032)
- Figure 11: Global Red Biotechnology Market Market Revenue (US$ Mn) Comparison by Product Type (2016-2032)
- Figure 12: Global Red Biotechnology Market Market Revenue (US$ Mn) Comparison by Application (2016-2032)
- Figure 13: Global Red Biotechnology Market Market Revenue (US$ Mn) Comparison by End-user (2016-2032)
- Figure 14: Global Red Biotechnology Market Market Y-o-Y Growth Rate Comparison by Region (2016-2032)
- Figure 15: Global Red Biotechnology Market Market Y-o-Y Growth Rate Comparison by Product Type (2016-2032)
- Figure 16: Global Red Biotechnology Market Market Y-o-Y Growth Rate Comparison by Application (2016-2032)
- Figure 17: Global Red Biotechnology Market Market Y-o-Y Growth Rate Comparison by End-user (2016-2032)
- Figure 18: Global Red Biotechnology Market Market Share Comparison by Region (2016-2032)
- Figure 19: Global Red Biotechnology Market Market Share Comparison by Product Type (2016-2032)
- Figure 20: Global Red Biotechnology Market Market Share Comparison by Application (2016-2032)
- Figure 21: Global Red Biotechnology Market Market Share Comparison by End-user (2016-2032)
- Figure 22: North America Red Biotechnology Market Revenue (US$ Mn) Market Share by Product Typein 2022
- Figure 23: North America Red Biotechnology Market Market Attractiveness Analysis by Product Type, 2016-2032
- Figure 24: North America Red Biotechnology Market Revenue (US$ Mn) Market Share by Applicationin 2022
- Figure 25: North America Red Biotechnology Market Market Attractiveness Analysis by Application, 2016-2032
- Figure 26: North America Red Biotechnology Market Revenue (US$ Mn) Market Share by End-userin 2022
- Figure 27: North America Red Biotechnology Market Market Attractiveness Analysis by End-user, 2016-2032
- Figure 28: North America Red Biotechnology Market Revenue (US$ Mn) Market Share by Country in 2022
- Figure 29: North America Red Biotechnology Market Market Attractiveness Analysis by Country, 2016-2032
- Figure 30: North America Red Biotechnology Market Market Revenue (US$ Mn) (2016-2032)
- Figure 31: North America Red Biotechnology Market Market Revenue (US$ Mn) Comparison by Country (2016-2032)
- Figure 32: North America Red Biotechnology Market Market Revenue (US$ Mn) Comparison by Product Type (2016-2032)
- Figure 33: North America Red Biotechnology Market Market Revenue (US$ Mn) Comparison by Application (2016-2032)
- Figure 34: North America Red Biotechnology Market Market Revenue (US$ Mn) Comparison by End-user (2016-2032)
- Figure 35: North America Red Biotechnology Market Market Y-o-Y Growth Rate Comparison by Country (2016-2032)
- Figure 36: North America Red Biotechnology Market Market Y-o-Y Growth Rate Comparison by Product Type (2016-2032)
- Figure 37: North America Red Biotechnology Market Market Y-o-Y Growth Rate Comparison by Application (2016-2032)
- Figure 38: North America Red Biotechnology Market Market Y-o-Y Growth Rate Comparison by End-user (2016-2032)
- Figure 39: North America Red Biotechnology Market Market Share Comparison by Country (2016-2032)
- Figure 40: North America Red Biotechnology Market Market Share Comparison by Product Type (2016-2032)
- Figure 41: North America Red Biotechnology Market Market Share Comparison by Application (2016-2032)
- Figure 42: North America Red Biotechnology Market Market Share Comparison by End-user (2016-2032)
- Figure 43: Western Europe Red Biotechnology Market Revenue (US$ Mn) Market Share by Product Typein 2022
- Figure 44: Western Europe Red Biotechnology Market Market Attractiveness Analysis by Product Type, 2016-2032
- Figure 45: Western Europe Red Biotechnology Market Revenue (US$ Mn) Market Share by Applicationin 2022
- Figure 46: Western Europe Red Biotechnology Market Market Attractiveness Analysis by Application, 2016-2032
- Figure 47: Western Europe Red Biotechnology Market Revenue (US$ Mn) Market Share by End-userin 2022
- Figure 48: Western Europe Red Biotechnology Market Market Attractiveness Analysis by End-user, 2016-2032
- Figure 49: Western Europe Red Biotechnology Market Revenue (US$ Mn) Market Share by Country in 2022
- Figure 50: Western Europe Red Biotechnology Market Market Attractiveness Analysis by Country, 2016-2032
- Figure 51: Western Europe Red Biotechnology Market Market Revenue (US$ Mn) (2016-2032)
- Figure 52: Western Europe Red Biotechnology Market Market Revenue (US$ Mn) Comparison by Country (2016-2032)
- Figure 53: Western Europe Red Biotechnology Market Market Revenue (US$ Mn) Comparison by Product Type (2016-2032)
- Figure 54: Western Europe Red Biotechnology Market Market Revenue (US$ Mn) Comparison by Application (2016-2032)
- Figure 55: Western Europe Red Biotechnology Market Market Revenue (US$ Mn) Comparison by End-user (2016-2032)
- Figure 56: Western Europe Red Biotechnology Market Market Y-o-Y Growth Rate Comparison by Country (2016-2032)
- Figure 57: Western Europe Red Biotechnology Market Market Y-o-Y Growth Rate Comparison by Product Type (2016-2032)
- Figure 58: Western Europe Red Biotechnology Market Market Y-o-Y Growth Rate Comparison by Application (2016-2032)
- Figure 59: Western Europe Red Biotechnology Market Market Y-o-Y Growth Rate Comparison by End-user (2016-2032)
- Figure 60: Western Europe Red Biotechnology Market Market Share Comparison by Country (2016-2032)
- Figure 61: Western Europe Red Biotechnology Market Market Share Comparison by Product Type (2016-2032)
- Figure 62: Western Europe Red Biotechnology Market Market Share Comparison by Application (2016-2032)
- Figure 63: Western Europe Red Biotechnology Market Market Share Comparison by End-user (2016-2032)
- Figure 64: Eastern Europe Red Biotechnology Market Revenue (US$ Mn) Market Share by Product Typein 2022
- Figure 65: Eastern Europe Red Biotechnology Market Market Attractiveness Analysis by Product Type, 2016-2032
- Figure 66: Eastern Europe Red Biotechnology Market Revenue (US$ Mn) Market Share by Applicationin 2022
- Figure 67: Eastern Europe Red Biotechnology Market Market Attractiveness Analysis by Application, 2016-2032
- Figure 68: Eastern Europe Red Biotechnology Market Revenue (US$ Mn) Market Share by End-userin 2022
- Figure 69: Eastern Europe Red Biotechnology Market Market Attractiveness Analysis by End-user, 2016-2032
- Figure 70: Eastern Europe Red Biotechnology Market Revenue (US$ Mn) Market Share by Country in 2022
- Figure 71: Eastern Europe Red Biotechnology Market Market Attractiveness Analysis by Country, 2016-2032
- Figure 72: Eastern Europe Red Biotechnology Market Market Revenue (US$ Mn) (2016-2032)
- Figure 73: Eastern Europe Red Biotechnology Market Market Revenue (US$ Mn) Comparison by Country (2016-2032)
- Figure 74: Eastern Europe Red Biotechnology Market Market Revenue (US$ Mn) Comparison by Product Type (2016-2032)
- Figure 75: Eastern Europe Red Biotechnology Market Market Revenue (US$ Mn) Comparison by Application (2016-2032)
- Figure 76: Eastern Europe Red Biotechnology Market Market Revenue (US$ Mn) Comparison by End-user (2016-2032)
- Figure 77: Eastern Europe Red Biotechnology Market Market Y-o-Y Growth Rate Comparison by Country (2016-2032)
- Figure 78: Eastern Europe Red Biotechnology Market Market Y-o-Y Growth Rate Comparison by Product Type (2016-2032)
- Figure 79: Eastern Europe Red Biotechnology Market Market Y-o-Y Growth Rate Comparison by Application (2016-2032)
- Figure 80: Eastern Europe Red Biotechnology Market Market Y-o-Y Growth Rate Comparison by End-user (2016-2032)
- Figure 81: Eastern Europe Red Biotechnology Market Market Share Comparison by Country (2016-2032)
- Figure 82: Eastern Europe Red Biotechnology Market Market Share Comparison by Product Type (2016-2032)
- Figure 83: Eastern Europe Red Biotechnology Market Market Share Comparison by Application (2016-2032)
- Figure 84: Eastern Europe Red Biotechnology Market Market Share Comparison by End-user (2016-2032)
- Figure 85: APAC Red Biotechnology Market Revenue (US$ Mn) Market Share by Product Typein 2022
- Figure 86: APAC Red Biotechnology Market Market Attractiveness Analysis by Product Type, 2016-2032
- Figure 87: APAC Red Biotechnology Market Revenue (US$ Mn) Market Share by Applicationin 2022
- Figure 88: APAC Red Biotechnology Market Market Attractiveness Analysis by Application, 2016-2032
- Figure 89: APAC Red Biotechnology Market Revenue (US$ Mn) Market Share by End-userin 2022
- Figure 90: APAC Red Biotechnology Market Market Attractiveness Analysis by End-user, 2016-2032
- Figure 91: APAC Red Biotechnology Market Revenue (US$ Mn) Market Share by Country in 2022
- Figure 92: APAC Red Biotechnology Market Market Attractiveness Analysis by Country, 2016-2032
- Figure 93: APAC Red Biotechnology Market Market Revenue (US$ Mn) (2016-2032)
- Figure 94: APAC Red Biotechnology Market Market Revenue (US$ Mn) Comparison by Country (2016-2032)
- Figure 95: APAC Red Biotechnology Market Market Revenue (US$ Mn) Comparison by Product Type (2016-2032)
- Figure 96: APAC Red Biotechnology Market Market Revenue (US$ Mn) Comparison by Application (2016-2032)
- Figure 97: APAC Red Biotechnology Market Market Revenue (US$ Mn) Comparison by End-user (2016-2032)
- Figure 98: APAC Red Biotechnology Market Market Y-o-Y Growth Rate Comparison by Country (2016-2032)
- Figure 99: APAC Red Biotechnology Market Market Y-o-Y Growth Rate Comparison by Product Type (2016-2032)
- Figure 100: APAC Red Biotechnology Market Market Y-o-Y Growth Rate Comparison by Application (2016-2032)
- Figure 101: APAC Red Biotechnology Market Market Y-o-Y Growth Rate Comparison by End-user (2016-2032)
- Figure 102: APAC Red Biotechnology Market Market Share Comparison by Country (2016-2032)
- Figure 103: APAC Red Biotechnology Market Market Share Comparison by Product Type (2016-2032)
- Figure 104: APAC Red Biotechnology Market Market Share Comparison by Application (2016-2032)
- Figure 105: APAC Red Biotechnology Market Market Share Comparison by End-user (2016-2032)
- Figure 106: Latin America Red Biotechnology Market Revenue (US$ Mn) Market Share by Product Typein 2022
- Figure 107: Latin America Red Biotechnology Market Market Attractiveness Analysis by Product Type, 2016-2032
- Figure 108: Latin America Red Biotechnology Market Revenue (US$ Mn) Market Share by Applicationin 2022
- Figure 109: Latin America Red Biotechnology Market Market Attractiveness Analysis by Application, 2016-2032
- Figure 110: Latin America Red Biotechnology Market Revenue (US$ Mn) Market Share by End-userin 2022
- Figure 111: Latin America Red Biotechnology Market Market Attractiveness Analysis by End-user, 2016-2032
- Figure 112: Latin America Red Biotechnology Market Revenue (US$ Mn) Market Share by Country in 2022
- Figure 113: Latin America Red Biotechnology Market Market Attractiveness Analysis by Country, 2016-2032
- Figure 114: Latin America Red Biotechnology Market Market Revenue (US$ Mn) (2016-2032)
- Figure 115: Latin America Red Biotechnology Market Market Revenue (US$ Mn) Comparison by Country (2016-2032)
- Figure 116: Latin America Red Biotechnology Market Market Revenue (US$ Mn) Comparison by Product Type (2016-2032)
- Figure 117: Latin America Red Biotechnology Market Market Revenue (US$ Mn) Comparison by Application (2016-2032)
- Figure 118: Latin America Red Biotechnology Market Market Revenue (US$ Mn) Comparison by End-user (2016-2032)
- Figure 119: Latin America Red Biotechnology Market Market Y-o-Y Growth Rate Comparison by Country (2016-2032)
- Figure 120: Latin America Red Biotechnology Market Market Y-o-Y Growth Rate Comparison by Product Type (2016-2032)
- Figure 121: Latin America Red Biotechnology Market Market Y-o-Y Growth Rate Comparison by Application (2016-2032)
- Figure 122: Latin America Red Biotechnology Market Market Y-o-Y Growth Rate Comparison by End-user (2016-2032)
- Figure 123: Latin America Red Biotechnology Market Market Share Comparison by Country (2016-2032)
- Figure 124: Latin America Red Biotechnology Market Market Share Comparison by Product Type (2016-2032)
- Figure 125: Latin America Red Biotechnology Market Market Share Comparison by Application (2016-2032)
- Figure 126: Latin America Red Biotechnology Market Market Share Comparison by End-user (2016-2032)
- Figure 127: Middle East & Africa Red Biotechnology Market Revenue (US$ Mn) Market Share by Product Typein 2022
- Figure 128: Middle East & Africa Red Biotechnology Market Market Attractiveness Analysis by Product Type, 2016-2032
- Figure 129: Middle East & Africa Red Biotechnology Market Revenue (US$ Mn) Market Share by Applicationin 2022
- Figure 130: Middle East & Africa Red Biotechnology Market Market Attractiveness Analysis by Application, 2016-2032
- Figure 131: Middle East & Africa Red Biotechnology Market Revenue (US$ Mn) Market Share by End-userin 2022
- Figure 132: Middle East & Africa Red Biotechnology Market Market Attractiveness Analysis by End-user, 2016-2032
- Figure 133: Middle East & Africa Red Biotechnology Market Revenue (US$ Mn) Market Share by Country in 2022
- Figure 134: Middle East & Africa Red Biotechnology Market Market Attractiveness Analysis by Country, 2016-2032
- Figure 135: Middle East & Africa Red Biotechnology Market Market Revenue (US$ Mn) (2016-2032)
- Figure 136: Middle East & Africa Red Biotechnology Market Market Revenue (US$ Mn) Comparison by Country (2016-2032)
- Figure 137: Middle East & Africa Red Biotechnology Market Market Revenue (US$ Mn) Comparison by Product Type (2016-2032)
- Figure 138: Middle East & Africa Red Biotechnology Market Market Revenue (US$ Mn) Comparison by Application (2016-2032)
- Figure 139: Middle East & Africa Red Biotechnology Market Market Revenue (US$ Mn) Comparison by End-user (2016-2032)
- Figure 140: Middle East & Africa Red Biotechnology Market Market Y-o-Y Growth Rate Comparison by Country (2016-2032)
- Figure 141: Middle East & Africa Red Biotechnology Market Market Y-o-Y Growth Rate Comparison by Product Type (2016-2032)
- Figure 142: Middle East & Africa Red Biotechnology Market Market Y-o-Y Growth Rate Comparison by Application (2016-2032)
- Figure 143: Middle East & Africa Red Biotechnology Market Market Y-o-Y Growth Rate Comparison by End-user (2016-2032)
- Figure 144: Middle East & Africa Red Biotechnology Market Market Share Comparison by Country (2016-2032)
- Figure 145: Middle East & Africa Red Biotechnology Market Market Share Comparison by Product Type (2016-2032)
- Figure 146: Middle East & Africa Red Biotechnology Market Market Share Comparison by Application (2016-2032)
- Figure 147: Middle East & Africa Red Biotechnology Market Market Share Comparison by End-user (2016-2032)
"
- List of Tables
- "
- Table 1: Global Red Biotechnology Market Market Comparison by Product Type (2016-2032)
- Table 2: Global Red Biotechnology Market Market Comparison by Application (2016-2032)
- Table 3: Global Red Biotechnology Market Market Comparison by End-user (2016-2032)
- Table 4: Global Red Biotechnology Market Revenue (US$ Mn) Comparison by Region (2016-2032)
- Table 5: Global Red Biotechnology Market Market Revenue (US$ Mn) (2016-2032)
- Table 6: Global Red Biotechnology Market Market Revenue (US$ Mn) Comparison by Region (2016-2032)
- Table 7: Global Red Biotechnology Market Market Revenue (US$ Mn) Comparison by Product Type (2016-2032)
- Table 8: Global Red Biotechnology Market Market Revenue (US$ Mn) Comparison by Application (2016-2032)
- Table 9: Global Red Biotechnology Market Market Revenue (US$ Mn) Comparison by End-user (2016-2032)
- Table 10: Global Red Biotechnology Market Market Y-o-Y Growth Rate Comparison by Region (2016-2032)
- Table 11: Global Red Biotechnology Market Market Y-o-Y Growth Rate Comparison by Product Type (2016-2032)
- Table 12: Global Red Biotechnology Market Market Y-o-Y Growth Rate Comparison by Application (2016-2032)
- Table 13: Global Red Biotechnology Market Market Y-o-Y Growth Rate Comparison by End-user (2016-2032)
- Table 14: Global Red Biotechnology Market Market Share Comparison by Region (2016-2032)
- Table 15: Global Red Biotechnology Market Market Share Comparison by Product Type (2016-2032)
- Table 16: Global Red Biotechnology Market Market Share Comparison by Application (2016-2032)
- Table 17: Global Red Biotechnology Market Market Share Comparison by End-user (2016-2032)
- Table 18: North America Red Biotechnology Market Market Comparison by Application (2016-2032)
- Table 19: North America Red Biotechnology Market Market Comparison by End-user (2016-2032)
- Table 20: North America Red Biotechnology Market Revenue (US$ Mn) Comparison by Country (2016-2032)
- Table 21: North America Red Biotechnology Market Market Revenue (US$ Mn) (2016-2032)
- Table 22: North America Red Biotechnology Market Market Revenue (US$ Mn) Comparison by Country (2016-2032)
- Table 23: North America Red Biotechnology Market Market Revenue (US$ Mn) Comparison by Product Type (2016-2032)
- Table 24: North America Red Biotechnology Market Market Revenue (US$ Mn) Comparison by Application (2016-2032)
- Table 25: North America Red Biotechnology Market Market Revenue (US$ Mn) Comparison by End-user (2016-2032)
- Table 26: North America Red Biotechnology Market Market Y-o-Y Growth Rate Comparison by Country (2016-2032)
- Table 27: North America Red Biotechnology Market Market Y-o-Y Growth Rate Comparison by Product Type (2016-2032)
- Table 28: North America Red Biotechnology Market Market Y-o-Y Growth Rate Comparison by Application (2016-2032)
- Table 29: North America Red Biotechnology Market Market Y-o-Y Growth Rate Comparison by End-user (2016-2032)
- Table 30: North America Red Biotechnology Market Market Share Comparison by Country (2016-2032)
- Table 31: North America Red Biotechnology Market Market Share Comparison by Product Type (2016-2032)
- Table 32: North America Red Biotechnology Market Market Share Comparison by Application (2016-2032)
- Table 33: North America Red Biotechnology Market Market Share Comparison by End-user (2016-2032)
- Table 34: Western Europe Red Biotechnology Market Market Comparison by Product Type (2016-2032)
- Table 35: Western Europe Red Biotechnology Market Market Comparison by Application (2016-2032)
- Table 36: Western Europe Red Biotechnology Market Market Comparison by End-user (2016-2032)
- Table 37: Western Europe Red Biotechnology Market Revenue (US$ Mn) Comparison by Country (2016-2032)
- Table 38: Western Europe Red Biotechnology Market Market Revenue (US$ Mn) (2016-2032)
- Table 39: Western Europe Red Biotechnology Market Market Revenue (US$ Mn) Comparison by Country (2016-2032)
- Table 40: Western Europe Red Biotechnology Market Market Revenue (US$ Mn) Comparison by Product Type (2016-2032)
- Table 41: Western Europe Red Biotechnology Market Market Revenue (US$ Mn) Comparison by Application (2016-2032)
- Table 42: Western Europe Red Biotechnology Market Market Revenue (US$ Mn) Comparison by End-user (2016-2032)
- Table 43: Western Europe Red Biotechnology Market Market Y-o-Y Growth Rate Comparison by Country (2016-2032)
- Table 44: Western Europe Red Biotechnology Market Market Y-o-Y Growth Rate Comparison by Product Type (2016-2032)
- Table 45: Western Europe Red Biotechnology Market Market Y-o-Y Growth Rate Comparison by Application (2016-2032)
- Table 46: Western Europe Red Biotechnology Market Market Y-o-Y Growth Rate Comparison by End-user (2016-2032)
- Table 47: Western Europe Red Biotechnology Market Market Share Comparison by Country (2016-2032)
- Table 48: Western Europe Red Biotechnology Market Market Share Comparison by Product Type (2016-2032)
- Table 49: Western Europe Red Biotechnology Market Market Share Comparison by Application (2016-2032)
- Table 50: Western Europe Red Biotechnology Market Market Share Comparison by End-user (2016-2032)
- Table 51: Eastern Europe Red Biotechnology Market Market Comparison by Product Type (2016-2032)
- Table 52: Eastern Europe Red Biotechnology Market Market Comparison by Application (2016-2032)
- Table 53: Eastern Europe Red Biotechnology Market Market Comparison by End-user (2016-2032)
- Table 54: Eastern Europe Red Biotechnology Market Revenue (US$ Mn) Comparison by Country (2016-2032)
- Table 55: Eastern Europe Red Biotechnology Market Market Revenue (US$ Mn) (2016-2032)
- Table 56: Eastern Europe Red Biotechnology Market Market Revenue (US$ Mn) Comparison by Country (2016-2032)
- Table 57: Eastern Europe Red Biotechnology Market Market Revenue (US$ Mn) Comparison by Product Type (2016-2032)
- Table 58: Eastern Europe Red Biotechnology Market Market Revenue (US$ Mn) Comparison by Application (2016-2032)
- Table 59: Eastern Europe Red Biotechnology Market Market Revenue (US$ Mn) Comparison by End-user (2016-2032)
- Table 60: Eastern Europe Red Biotechnology Market Market Y-o-Y Growth Rate Comparison by Country (2016-2032)
- Table 61: Eastern Europe Red Biotechnology Market Market Y-o-Y Growth Rate Comparison by Product Type (2016-2032)
- Table 62: Eastern Europe Red Biotechnology Market Market Y-o-Y Growth Rate Comparison by Application (2016-2032)
- Table 63: Eastern Europe Red Biotechnology Market Market Y-o-Y Growth Rate Comparison by End-user (2016-2032)
- Table 64: Eastern Europe Red Biotechnology Market Market Share Comparison by Country (2016-2032)
- Table 65: Eastern Europe Red Biotechnology Market Market Share Comparison by Product Type (2016-2032)
- Table 66: Eastern Europe Red Biotechnology Market Market Share Comparison by Application (2016-2032)
- Table 67: Eastern Europe Red Biotechnology Market Market Share Comparison by End-user (2016-2032)
- Table 68: APAC Red Biotechnology Market Market Comparison by Product Type (2016-2032)
- Table 69: APAC Red Biotechnology Market Market Comparison by Application (2016-2032)
- Table 70: APAC Red Biotechnology Market Market Comparison by End-user (2016-2032)
- Table 71: APAC Red Biotechnology Market Revenue (US$ Mn) Comparison by Country (2016-2032)
- Table 72: APAC Red Biotechnology Market Market Revenue (US$ Mn) (2016-2032)
- Table 73: APAC Red Biotechnology Market Market Revenue (US$ Mn) Comparison by Country (2016-2032)
- Table 74: APAC Red Biotechnology Market Market Revenue (US$ Mn) Comparison by Product Type (2016-2032)
- Table 75: APAC Red Biotechnology Market Market Revenue (US$ Mn) Comparison by Application (2016-2032)
- Table 76: APAC Red Biotechnology Market Market Revenue (US$ Mn) Comparison by End-user (2016-2032)
- Table 77: APAC Red Biotechnology Market Market Y-o-Y Growth Rate Comparison by Country (2016-2032)
- Table 78: APAC Red Biotechnology Market Market Y-o-Y Growth Rate Comparison by Product Type (2016-2032)
- Table 79: APAC Red Biotechnology Market Market Y-o-Y Growth Rate Comparison by Application (2016-2032)
- Table 80: APAC Red Biotechnology Market Market Y-o-Y Growth Rate Comparison by End-user (2016-2032)
- Table 81: APAC Red Biotechnology Market Market Share Comparison by Country (2016-2032)
- Table 82: APAC Red Biotechnology Market Market Share Comparison by Product Type (2016-2032)
- Table 83: APAC Red Biotechnology Market Market Share Comparison by Application (2016-2032)
- Table 84: APAC Red Biotechnology Market Market Share Comparison by End-user (2016-2032)
- Table 85: Latin America Red Biotechnology Market Market Comparison by Product Type (2016-2032)
- Table 86: Latin America Red Biotechnology Market Market Comparison by Application (2016-2032)
- Table 87: Latin America Red Biotechnology Market Market Comparison by End-user (2016-2032)
- Table 88: Latin America Red Biotechnology Market Revenue (US$ Mn) Comparison by Country (2016-2032)
- Table 89: Latin America Red Biotechnology Market Market Revenue (US$ Mn) (2016-2032)
- Table 90: Latin America Red Biotechnology Market Market Revenue (US$ Mn) Comparison by Country (2016-2032)
- Table 91: Latin America Red Biotechnology Market Market Revenue (US$ Mn) Comparison by Product Type (2016-2032)
- Table 92: Latin America Red Biotechnology Market Market Revenue (US$ Mn) Comparison by Application (2016-2032)
- Table 93: Latin America Red Biotechnology Market Market Revenue (US$ Mn) Comparison by End-user (2016-2032)
- Table 94: Latin America Red Biotechnology Market Market Y-o-Y Growth Rate Comparison by Country (2016-2032)
- Table 95: Latin America Red Biotechnology Market Market Y-o-Y Growth Rate Comparison by Product Type (2016-2032)
- Table 96: Latin America Red Biotechnology Market Market Y-o-Y Growth Rate Comparison by Application (2016-2032)
- Table 97: Latin America Red Biotechnology Market Market Y-o-Y Growth Rate Comparison by End-user (2016-2032)
- Table 98: Latin America Red Biotechnology Market Market Share Comparison by Country (2016-2032)
- Table 99: Latin America Red Biotechnology Market Market Share Comparison by Product Type (2016-2032)
- Table 100: Latin America Red Biotechnology Market Market Share Comparison by Application (2016-2032)
- Table 101: Latin America Red Biotechnology Market Market Share Comparison by End-user (2016-2032)
- Table 102: Middle East & Africa Red Biotechnology Market Market Comparison by Product Type (2016-2032)
- Table 103: Middle East & Africa Red Biotechnology Market Market Comparison by Application (2016-2032)
- Table 104: Middle East & Africa Red Biotechnology Market Market Comparison by End-user (2016-2032)
- Table 105: Middle East & Africa Red Biotechnology Market Revenue (US$ Mn) Comparison by Country (2016-2032)
- Table 106: Middle East & Africa Red Biotechnology Market Market Revenue (US$ Mn) (2016-2032)
- Table 107: Middle East & Africa Red Biotechnology Market Market Revenue (US$ Mn) Comparison by Country (2016-2032)
- Table 108: Middle East & Africa Red Biotechnology Market Market Revenue (US$ Mn) Comparison by Product Type (2016-2032)
- Table 109: Middle East & Africa Red Biotechnology Market Market Revenue (US$ Mn) Comparison by Application (2016-2032)
- Table 110: Middle East & Africa Red Biotechnology Market Market Revenue (US$ Mn) Comparison by End-user (2016-2032)
- Table 111: Middle East & Africa Red Biotechnology Market Market Y-o-Y Growth Rate Comparison by Country (2016-2032)
- Table 112: Middle East & Africa Red Biotechnology Market Market Y-o-Y Growth Rate Comparison by Product Type (2016-2032)
- Table 113: Middle East & Africa Red Biotechnology Market Market Y-o-Y Growth Rate Comparison by Application (2016-2032)
- Table 114: Middle East & Africa Red Biotechnology Market Market Y-o-Y Growth Rate Comparison by End-user (2016-2032)
- Table 115: Middle East & Africa Red Biotechnology Market Market Share Comparison by Country (2016-2032)
- Table 116: Middle East & Africa Red Biotechnology Market Market Share Comparison by Product Type (2016-2032)
- Table 117: Middle East & Africa Red Biotechnology Market Market Share Comparison by Application (2016-2032)
- Table 118: Middle East & Africa Red Biotechnology Market Market Share Comparison by End-user (2016-2032)
- 1. Executive Summary
-
- Hoffmann-La Roche, Ltd.
- Merck KGaA
- Regeneron Pharmaceuticals, Inc.
- Pfizer Inc.
- Biogen Inc.
- Amgen Inc.
- AstraZeneca Plc.
- Takeda Pharmaceutical Company Ltd.
- Gilead Sciences, Inc.
- CELGENE CORPORATION
Our Clients


View Our Licence Options
