Raisins Market Report By Nature (Organic Raisins, Conventional Raisins), By Type (Natural Sun-Dried Raisins, Golden Raisins, Sultana Raisins, Black Currant Raisins, Muscat Raisins, Others), By End Use (Snacks and Confectionery, Bakery and Cereals, Dairy Products, Desserts, Beverages, Others), By Distribution Channel, By Region and Companies - Industry Segment Outlook, Market Assessment, Competition Scenario, Trends and Forecast 2024-2033
-
22495
-
May 2024
-
321
-


-
This report was compiled by Shreyas Rokade Shreyas Rokade is a seasoned Research Analyst with CMFE, bringing extensive expertise in market research and consulting, with a strong background in Chemical Engineering. Correspondence Team Lead-CMFE Linkedin | Detailed Market research Methodology Our methodology involves a mix of primary research, including interviews with leading mental health experts, and secondary research from reputable medical journals and databases. View Detailed Methodology Page
-
Quick Navigation
Report Overview
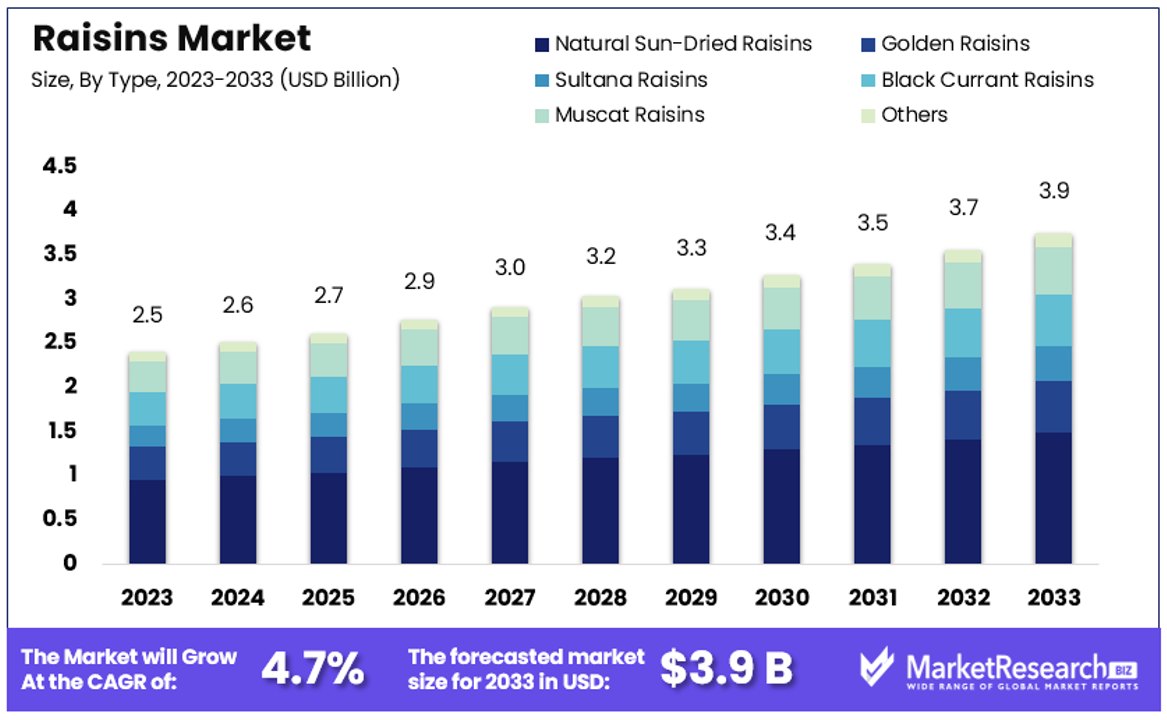
The Global Raisins Market size is expected to be worth around USD 3.9 Billion by 2033, from USD 2.5 Billion in 2023, growing at a CAGR of 4.7% during the forecast period from 2024 to 2033.
The Raisins Market involves the production, processing, and distribution of dried grapes. This market serves both direct consumers and industrial clients who use raisins in various food products like cereals, snacks, and baking goods. The demand in this market is propelled by raisins' nutritional benefits, including high fiber content and antioxidants, making them a preferred choice for health-conscious consumers.
Additionally, the versatility of raisins as a natural sweetener enhances their appeal in the food industry. Key growth drivers include the increasing popularity of healthy snacking options and the expanding use of natural ingredients in food preparation.
The Raisins Market is experiencing nuanced shifts in both demand and production that signal significant implications for market dynamics. Recommended consumption levels are set at about 40 grams per day, which equates to roughly 80-100 raisins depending on the variety. This portion size underlines raisins' role as a healthy snack option, bolstering their consumption globally.
In terms of global trade, there are notable changes in export dynamics. China’s raisin exports are anticipated to decline by 15% to 16,000 metric tons in the 2022/23 marketing year. Similarly, Chile is expected to see a decrease in its raisin exports, dropping to 59,000 metric tons. These declines could be indicative of internal market shifts or changing global demand patterns.
On the production front, China is projected to produce approximately 170,000 metric tons of raisins. Chile’s production is expected at about 61,850 metric tons, while India’s output is estimated to be between 55,000 and 65,000 metric tons. These figures highlight the significant role these countries play in the global raisins market, not only as producers but also as potential market influencers through their export capacities.
Strategically, stakeholders in the raisins market need to focus on adapting to these changes in global supply and demand. There is an opportunity to innovate in product offerings, especially in targeting health-conscious consumers and integrating raisins into various new food products. Additionally, understanding the shifts in export and production volumes is crucial for businesses planning to navigate the competitive landscape effectively. Monitoring these trends will be key to developing robust strategies aimed at leveraging growth opportunities within the global raisins market.
Key Takeaways
- Market Value: The Global Raisins Market is anticipated to reach USD 3.9 billion by 2033, exhibiting a steady CAGR of 4.7% from 2024 to 2033, driven by factors such as increasing consumer preference for health-conscious and natural food products.
- Nature Segment Analysis: Organic raisins lead with a 60% market share, reflecting the growing demand for health-conscious and environmentally friendly products.
- Type Segment Analysis: Natural Sun-Dried Raisins dominate with 40% market share due to their traditional appeal and perceived natural qualities.
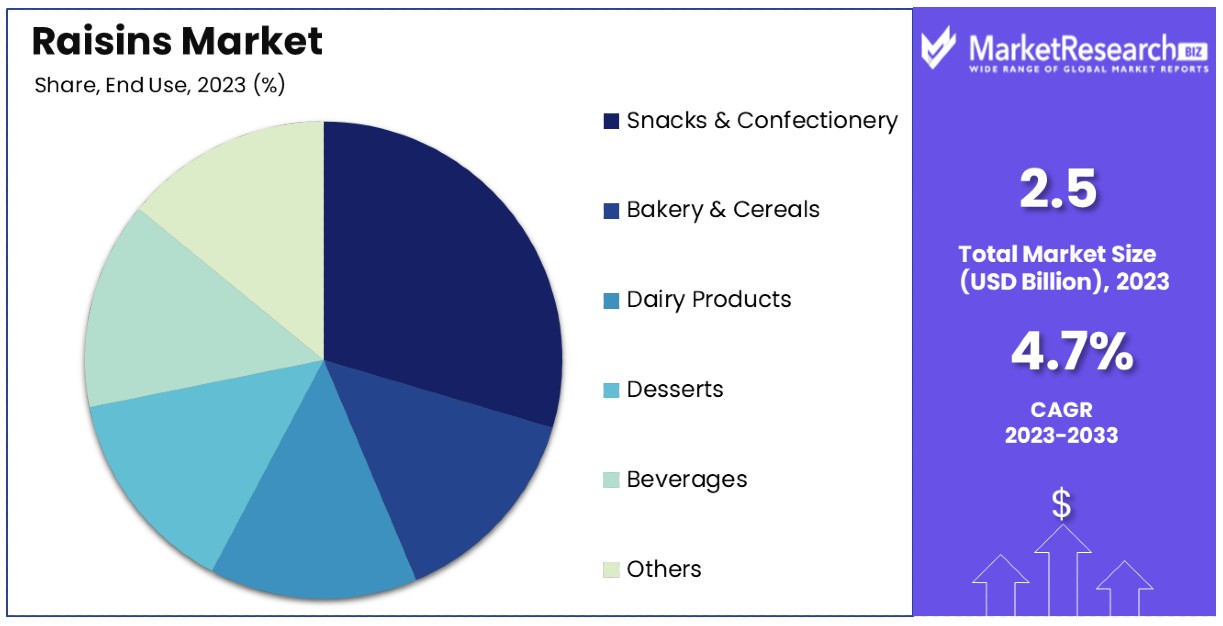
- End Use Segment Analysis: Snacks and Confectionery hold the largest share (35%) due to raisins' widespread use in everyday consumer diets. Bakery and Cereals, Dairy Products, and Desserts also contribute significantly to raisins' consumption.
- Distribution Channel Segment Analysis: Supermarkets/Hypermarkets dominate with a 50% market share, driven by their extensive reach and convenience for consumers.
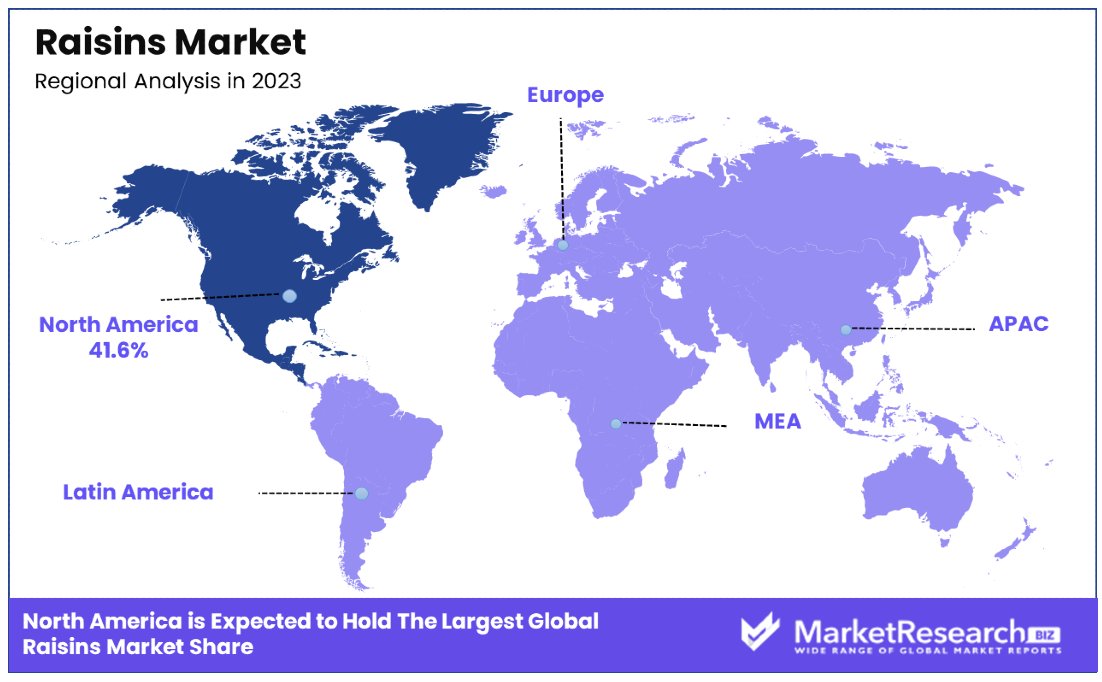
- North America Dominance: North America leads the market with a 41.6% share, followed by Europe with approximately 30% of the global market share, indicating strong market penetration and consumption of raisins in these regions.
- Analyst Viewpoint: Analysts anticipate steady growth in the raisins market, driven by consumer preferences for healthy and natural snacks, expansion in culinary applications, and the rise of online retail channels.
- Growth Opportunities: Opportunities lie in expanding product offerings, enhancing distribution networks, and capitalizing on emerging trends in health and wellness to meet evolving consumer demands effectively.
Driving Factors
Increasing Demand for Healthy and Convenient Snacks Drives Market Growth
The increasing consumer preference for healthy and convenient snack options significantly boosts the raisins market. Raisins, known for their high nutrient and antioxidant content, cater perfectly to the rising health consciousness among global consumers.
With busy lifestyles becoming the norm, particularly in developed regions like the United States and Canada, the demand for quick and nutritious snacks has surged. Raisins, being both healthful and portable, have gained prominence as an ideal snack. This trend is supported by data indicating a marked increase in the consumption of healthy snacks, with the global healthy snack market projected to grow at a CAGR of around 5.2% through the next decade.
Rising Popularity of Bakery and Confectionery Products Drives Market Growth
Raisins are integral to the bakery and confectionery industry, widely used in products such as breads, cakes, and cookies. The enduring popularity of these items, especially in regions with strong bakery cultures like Germany and France, underpins the consistent demand for raisins.
As global consumption of bakery and confectionery items grows, so too does the use of raisins. The global market for bakery products is expected to expand, further fueling demand for raisins as a key ingredient. This growth is not isolated but connected to broader trends in food consumption and cultural preferences, highlighting raisins' versatile appeal.
Growth in the Foodservice Industry Drives Market Growth
The expansion of the foodservice sector is a pivotal factor in the rising demand for raisins. As urbanization increases and consumer dining habits evolve, restaurants, cafes, and catering services are incorporating more raisins into their offerings.
This is particularly evident in countries like the United Kingdom and Australia, where the foodservice industry is experiencing robust growth. Raisins are featured in a variety of dishes from salads to desserts, demonstrating their adaptability and appeal. The growth of the foodservice industry, expected to rise globally, supports increased consumption and demand for raisins across diverse culinary applications.
Expansion of Global Trade and Export Markets Drives Market Growth
The global trade dynamics of raisins significantly contribute to their market growth. Major producers like the United States, Turkey, and Iran have successfully expanded their reach into international markets, enhancing the global footprint of raisins.
The United States, for example, exports a substantial portion of its raisins to countries such as the United Kingdom, Japan, and Mexico. This expansion is facilitated by favorable trade agreements and the global recognition of raisins as a versatile and healthful food product. The growth of export markets not only broadens consumer access to raisins but also stabilizes demand and prices on a global scale, underscoring the importance of trade in the industry's growth.
Restraining Factors
Climate and Weather Conditions Restrains Market Growth
Climate and weather play a critical role in the production of raisins, making them vulnerable to environmental changes. Favorable conditions, such as ample sunlight and low humidity, are essential for drying grapes into raisins. However, adverse weather, like excessive rainfall or drought, can drastically reduce yield and quality.
For example, in California, a key raisin-producing region, recent droughts have led to significant reductions in production. This not only creates supply shortages but also drives up prices, making raisins less competitive in the market. Such environmental constraints pose ongoing risks to production stability and market growth, as evidenced by fluctuating output levels and price instability in major production areas.
Competition from Other Dried Fruits Restrains Market Growth
Raisins face considerable competition from other dried fruits, which can limit market growth. Alternative dried fruits like dates, apricots, and prunes offer variety in flavor, nutritional content, and price, attracting different consumer preferences.
In regions such as the Middle East, where dates are not only widely available but also culturally significant, raisins often find it challenging to compete. This competition affects raisins’ market share and can restrain their growth, particularly in markets where other dried fruits are either more popular or more economically priced. This competitive landscape necessitates strategic marketing and product differentiation to maintain or grow raisins' market position.
Nature Segment Analysis
Organic raisins dominate with 60% market share due to increasing consumer preference for health-conscious and environmentally friendly products.
The Nature segment of the raisins market can be broadly classified into two sub-segments: Organic Raisins and Conventional Raisins. Organic raisins have emerged as the dominant sub-segment, capturing a significant portion of the market. This dominance is primarily driven by the global shift towards organic and natural food products, as consumers increasingly seek foods that are free from pesticides and are perceived as healthier. The demand for organic raisins is further bolstered by rising awareness of environmental issues and sustainability practices, which resonate with the values of today's ethical consumers.
Organic raisins not only attract health-conscious consumers but also fetch premium prices in the market, contributing to higher profit margins for producers and retailers. Despite the higher price point, the demand for organic raisins continues to grow, reflecting a robust consumer willingness to invest in premium, health-oriented products. On the other hand, conventional raisins still hold a significant share of the market. They are favored for their lower cost and widespread availability. Conventional raisins cater to a broader audience that may not prioritize organic certification but still desires the health benefits associated with raisin consumption.
In sum, while organic raisins lead the segment, conventional raisins remain relevant, offering affordability and catering to a less niche market. The growth in the organic sub-segment is expected to continue, driven by ongoing trends in health and wellness and environmental consciousness.
Type Segment Analysis
Natural Sun-Dried Raisins dominate with 40% due to their traditional appeal and perceived natural qualities.
In the Type segment, the raisins market is diversified into several categories: Natural Sun-Dried Raisins, Golden Raisins, Sultana Raisins, Black Currant Raisins, Muscat Raisins, and Others. Natural Sun-Dried Raisins lead this segment, primarily due to their traditional drying method that appeals to consumers seeking natural and minimally processed food options. This method involves drying grapes under the sun without the use of chemical agents, which not only preserves the natural flavor but also retains more of the antioxidants and nutrients.
Golden Raisins and Sultana Raisins are also popular but serve slightly different preferences. Golden Raisins, treated with sulfur dioxide to preserve their color, appeal to consumers looking for aesthetically pleasing and sweeter tasting raisins. Sultana Raisins, on the other hand, are appreciated for their lighter color and tartness, which makes them a preferred ingredient in various culinary applications. Black Currant and Muscat Raisins cater to niche markets that value distinct flavors and textures in their recipes.
The segmentation within the Type category highlights the diverse applications and consumer preferences that drive the raisins market. Each sub-segment contributes to the overall growth by catering to specific taste preferences and uses in cooking and baking. The dominance of Natural Sun-Dried Raisins underscores a market-wide trend towards natural food products, while the presence of other types ensures that the raisins market can appeal to a broad range of consumers and culinary needs.
End Use Segment Analysis
Snacks and Confectionery dominate with 35% market share due to their widespread use in everyday consumer diets.
The End Use segment of the raisins market includes Snacks and Confectionery, Bakery and Cereals, Dairy Products, Desserts, Beverages, and Others. Snacks and Confectionery emerge as the leading sub-segment, largely because raisins are commonly incorporated into snack mixes, health bars, and sweets. This sub-segment benefits from the general increase in snack consumption globally, driven by busy lifestyles that favor convenient, on-the-go eating options.
Bakery and Cereals also consume a significant amount of raisins, using them as a sweet and nutritious addition to products like bread, muffins, and breakfast cereals. Dairy Products and Desserts use raisins to enhance flavor and texture, with raisins appearing in items like yogurts and ice creams. Beverages and other applications show smaller but growing interest, utilizing raisins in products ranging from raisin-based drinks to savory dishes.
The dominance of Snacks and Confectionery in the End Use segment reflects the versatility and widespread appeal of raisins as an ingredient that enhances both flavor and nutritional value. The continued growth in this segment is supported by innovation in snack products and the increasing trend of incorporating natural and nutritious ingredients in confectionery.
Distribution Channel Segment Analysis
Supermarkets/Hypermarkets dominate with 50% market share due to their extensive reach and convenience for consumers.
The Distribution Channel segment for raisins includes Supermarkets/Hypermarkets, Convenience Stores, Specialty Stores, Online Retail, and Others. Supermarkets and Hypermarkets are the dominant channels, providing extensive accessibility and convenience to consumers. These venues offer a wide range of raisin varieties and pack sizes, meeting the needs of diverse consumer groups.
Convenience Stores and Specialty Stores also play crucial roles but cater to more specific consumer needs or preferences. Convenience Stores are favored for quick purchases, while Specialty Stores attract customers looking for premium or niche products, such as organic or specialty raisins. Online Retail is rapidly growing as a significant distribution channel, especially with the increase in e-commerce sales following consumer behavior shifts due to the COVID-19 pandemic.
The prominent position of Supermarkets and Hypermarkets in the Distribution Channel segment is due to their ability to offer one-stop shopping experiences, competitive pricing, and promotions. However, the growth of online retail indicates a shift in consumer purchasing patterns, likely to influence future distribution strategies in the raisins market.
Key Market Segments
By Nature
- Organic Raisins
- Conventional Raisins
By Type
- Natural Sun-Dried Raisins
- Golden Raisins
- Sultana Raisins
- Black Currant Raisins
- Muscat Raisins
- Others
By End Use
- Snacks and Confectionery
- Bakery and Cereals
- Dairy Products
- Desserts
- Beverages
- Others
By Distribution Channel
- Supermarkets/Hypermarkets
- Convenience Stores
- Specialty Stores
- Online Retail
- Others
Growth Opportunities
Product Innovation and Value-Addition Offers Growth Opportunity
Product innovation in the raisins market presents significant growth opportunities by aligning with evolving consumer preferences for variety and healthier snack options. Introducing new product variations such as flavored raisins or raisin-infused products like granola and energy bars meets the rising demand for convenient yet healthy eating choices.
In the United States and Turkey, innovative products such as yogurt and chocolate-coated raisins have successfully captured consumer interest, offering indulgence without compromising health benefits. This strategy not only revitalizes the raisin category but also expands the market reach to consumers who might not typically choose raisins as a snack. The ability to innovate and diversify products can decisively influence consumer preference and boost market share in competitive snack segments.
Leveraging Organic and Fair Trade Certifications Offers Growth Opportunity
The growing consumer awareness of sustainable and ethical practices offers a substantial growth avenue for the raisins market through organic and fair trade certifications. These certifications are increasingly valued by consumers who prioritize environmental and social responsibility in their purchasing decisions. Raisin producers who obtain these certifications can access premium pricing and market differentiation, particularly in regions like Europe and North America where there is a strong demand for such products.
By aligning with these ethical standards, producers not only enhance their brand reputation but also tap into a niche market segment that could lead to increased sales volumes and higher profit margins. This strategic positioning helps in capturing the attention of a more conscious consumer base, driving both market growth and sustainability initiatives.
Trending Factors
Traceability and Transparency Are Trending Factors
Traceability and transparency are rapidly becoming key factors in the raisins market, as consumers increasingly demand to know more about the origins and handling of their food. This trend is evidenced by initiatives such as blockchain-based traceability systems, implemented by raisin producers in Turkey and Iran, which allow consumers to track the product’s journey from vineyard to plate.
Such transparency not only builds consumer trust but also enhances loyalty and allows producers to command premium prices. By providing detailed information about sourcing and processing, raisin producers can meet the growing consumer demand for authenticity and safety in their food choices, thus positioning themselves advantageously in a competitive market.
Clean Label and Non-GMO Offerings Are Trending Factors
The trend towards clean label and non-GMO offerings in the raisins market reflects a broader consumer shift towards more natural and safer food products. This demand is particularly strong in markets like the United States and Europe, where consumers are increasingly wary of artificial additives and genetically modified ingredients.
Raisin producers who offer products free from these elements and who ensure transparent labeling are successfully differentiating their offerings. Highlighting these attributes enables producers to capture the attention of health-conscious consumers and align with market demands for purity and simplicity in ingredients. As this trend continues to grow, it represents a significant opportunity for expansion and market penetration for producers committed to clean and natural production methods.
Regional Analysis
North America Dominates with 41.6% Market Share
North America's substantial 41.6% share in the global raisins market is largely driven by high consumer demand for healthy snack options and a robust agricultural sector capable of large-scale raisin production. The U.S., particularly California, is a significant contributor due to its ideal climatic conditions for grape cultivation and advanced drying technologies. The region's focus on product innovation and value-added offerings, such as organic and flavored raisins, also plays a crucial role in maintaining its market leadership.
The market dynamics in North America are influenced by a well-established food processing industry and a strong retail network. The presence of major food companies and brands in the region encourages continuous innovation and marketing efforts that boost raisin consumption. Additionally, the increasing trend towards healthy and convenient eating in the U.S. and Canada fuels the demand for raisins as a natural sweetener and a nutritious snack option.
Regional Market Share and Growth Rates:
- Europe: Holds approximately 30% of the global market share. The region's strong bakery culture, which extensively uses raisins in various traditional pastries and breads, supports its significant market position. The ongoing demand in countries like Germany, the UK, and France is expected to keep Europe a key player in the global raisins market.
- Asia Pacific: Accounts for about 18% market share, with expected growth due to rising disposable incomes and the integration of Western eating habits. Countries like China and India are witnessing increased consumption of dried fruits, including raisins, in both snacks and traditional dishes.
- Middle East & Africa: This region has a 7% share of the market, driven by the high consumption of raisins in traditional diets and as a staple in many regional cuisines. The market is expected to grow steadily as the population and economic conditions improve.
- Latin America: Holds around 4% of the market share. Although smaller in comparison, the region shows potential for growth due to increasing urbanization and the popularity of Western-style diets that include more diverse and healthy snacking options.
Key Regions and Countries
- North America
- The US
- Canada
- Mexico
- Western Europe
- Germany
- France
- The UK
- Spain
- Italy
- Portugal
- Ireland
- Austria
- Switzerland
- Benelux
- Nordic
- Rest of Western Europe
- Eastern Europe
- Russia
- Poland
- The Czech Republic
- Greece
- Rest of Eastern Europe
- APAC
- China
- Japan
- South Korea
- India
- Australia & New Zealand
- Indonesia
- Malaysia
- Philippines
- Singapore
- Thailand
- Vietnam
- Rest of APAC
- Latin America
- Brazil
- Colombia
- Chile
- Argentina
- Costa Rica
- Rest of Latin America
- Middle East & Africa
- Algeria
- Egypt
- Israel
- Kuwait
- Nigeria
- Saudi Arabia
- South Africa
- Turkey
- United Arab Emirates
- Rest of MEA
Key Players Analysis
The Raisins Market witnesses the dominance of several key players, each contributing uniquely to the industry's dynamics and growth trajectory. Their strategic positioning, market influence, and impact shape the competitive landscape, driving innovation and market expansion.
Sun-Maid Growers: As a prominent player, Sun-Maid Growers epitomizes market leadership through its extensive product portfolio, brand recognition, and global distribution network. Its strategic alliances and investments in sustainable practices bolster its market influence, catering to evolving consumer preferences.
Sunbeam Foods Pty Ltd.: Sunbeam Foods Pty Ltd. commands a significant presence in the Raisins Market, leveraging its expertise in agriculture and processing technologies. Its focus on quality assurance and product diversification solidifies its strategic positioning, capturing diverse consumer segments.
Dole Packaged Foods LLC: Dole Packaged Foods LLC emerges as a formidable competitor, renowned for its commitment to quality, innovation, and consumer-centric offerings. Its vertically integrated supply chain and global market presence amplify its impact, driving market penetration and brand loyalty.
Mariani Packing Company: Mariani Packing Company stands out for its heritage, expertise, and commitment to sustainable farming practices. Its emphasis on product differentiation and premiumization reinforces its strategic positioning, resonating with discerning consumers seeking superior quality.
Montagu Snacks: Montagu Snacks brings a fresh perspective to the Raisins Market with its emphasis on health, wellness, and natural products. Its agility and responsiveness to consumer trends enable strategic agility, facilitating market expansion and diversification.
Viva Bella Orchards Inc.: Viva Bella Orchards Inc. distinguishes itself through its focus on organic farming practices and artisanal craftsmanship. Its niche positioning appeals to health-conscious consumers, fostering brand loyalty and market differentiation.
In conclusion, the Raisins Market thrives on the contributions of these key players, each leveraging its strengths to drive innovation, sustainability, and consumer satisfaction. Their strategic maneuvers and market influence collectively shape the industry's trajectory, heralding a future of growth and resilience.
Market Key Players
- Sun-Maid Growers
- Sunbeam Foods Pty Ltd.
- Dole Packaged Foods LLC
- Mariani Packing Company
- Montagu Snacks
- Viva Bella Orchards Inc.
- Fresh Del Monte Produce Inc.
- Citadelle Maple Syrup Producers'
- N. Sunshine Raisin Corporation Market
- Nuts Ltd Market
Recent Developments
- On April 2024, Keebler® launched Sandies Oatmeal Raisin cookies, aiming to enhance 'me moments' with a new indulgent flavor, crafted by Ernie and the elves, featuring buttery shortbread and raisins.
- On December 2023, Sun-Maid raisins announced a breakup with fruitcake, introducing new dessert recipes like 'Bacon Raisin Cornbread Chicken' and 'Forget Fruitcake Cookie' to showcase the versatility of dried fruit and increase raisin sales during the holiday season.
- On September 2023, gardeners in Herat province converted most of their grape produce into raisins due to inadequate cold storage facilities and market access, highlighting the need for government support in establishing air corridors and export facilities to boost the agricultural economy.
Report Scope
Report Features Description Market Value (2023) USD 2.5 Billion Forecast Revenue (2033) USD 3.9 Billion CAGR (2024-2033) 4.7% Base Year for Estimation 2023 Historic Period 2018-2023 Forecast Period 2024-2033 Report Coverage Revenue Forecast, Market Dynamics, Competitive Landscape, Recent Developments Segments Covered By Nature (Organic Raisins, Conventional Raisins), By Type (Natural Sun-Dried Raisins, Golden Raisins, Sultana Raisins, Black Currant Raisins, Muscat Raisins, Others), By End Use (Snacks and Confectionery, Bakery and Cereals, Dairy Products, Desserts, Beverages, Others), By Distribution Channel (Supermarkets/Hypermarkets, Convenience Stores, Specialty Stores, Online Retail, Others) Regional Analysis North America - The US, Canada, & Mexico; Western Europe - Germany, France, The UK, Spain, Italy, Portugal, Ireland, Austria, Switzerland, Benelux, Nordic, & Rest of Western Europe; Eastern Europe - Russia, Poland, The Czech Republic, Greece, & Rest of Eastern Europe; APAC - China, Japan, South Korea, India, Australia & New Zealand, Indonesia, Malaysia, Philippines, Singapore, Thailand, Vietnam, & Rest of APAC; Latin America - Brazil, Colombia, Chile, Argentina, Costa Rica, & Rest of Latin America; Middle East & Africa - Algeria, Egypt, Israel, Kuwait, Nigeria, Saudi Arabia, South Africa, Turkey, United Arab Emirates, & Rest of MEA Competitive Landscape Sun-Maid Growers, Sunbeam Foods Pty Ltd., Dole Packaged Foods LLC, Mariani Packing Company, Montagu Snacks, Viva Bella Orchards Inc., Fresh Del Monte Produce Inc., Citadelle Maple Syrup Producers', N. Sunshine Raisin Corporation Market, Nuts Ltd Market Customization Scope Customization for segments, region/country-level will be provided. Moreover, additional customization can be done based on the requirements. Purchase Options We have three licenses to opt for: Single User License, Multi-User License (Up to 5 Users), Corporate Use License (Unlimited User and Printable PDF) -
- 1. Executive Summary
- 1.1. Definition
- 1.2. Taxonomy
- 1.3. Research Scope
- 1.4. Key Analysis
- 1.5. Key Findings by Major Segments
- 1.6. Top strategies by Major Players
- 2. Global Raisins Market Overview
- 2.1. Raisins Market Dynamics
- 2.1.1. Drivers
- 2.1.2. Opportunities
- 2.1.3. Restraints
- 2.1.4. Challenges
- 2.2. Macro-economic Factors
- 2.3. Regulatory Framework
- 2.4. Market Investment Feasibility Index
- 2.5. PEST Analysis
- 2.6. PORTER’S Five Force Analysis
- 2.7. Drivers & Restraints Impact Analysis
- 2.8. Industry Chain Analysis
- 2.9. Cost Structure Analysis
- 2.10. Marketing Strategy
- 2.11. Russia-Ukraine War Impact Analysis
- 2.12. Opportunity Map Analysis
- 2.13. Market Competition Scenario Analysis
- 2.14. Product Life Cycle Analysis
- 2.15. Opportunity Orbits
- 2.16. Manufacturer Intensity Map
- 2.17. Major Companies sales by Value & Volume
- 2.1. Raisins Market Dynamics
- 3. Global Raisins Market Analysis, Opportunity and Forecast, 2016-2032
- 3.1. Global Raisins Market Analysis, 2016-2021
- 3.2. Global Raisins Market Opportunity and Forecast, 2023-2032
- 3.3. Global Raisins Market Analysis, Opportunity and Forecast, By Nature, 2016-2032
- 3.3.1. Global Raisins Market Analysis by Nature: Introduction
- 3.3.2. Market Size Absolute $ Opportunity Analysis and Forecast, By Nature, 2016-2032
- 3.3.3. Organic Raisins
- 3.3.4. Conventional Raisins
- 3.4. Global Raisins Market Analysis, Opportunity and Forecast, By Type, 2016-2032
- 3.4.1. Global Raisins Market Analysis by Type: Introduction
- 3.4.2. Market Size Absolute $ Opportunity Analysis and Forecast, By Type, 2016-2032
- 3.4.3. Natural Sun-Dried Raisins
- 3.4.4. Golden Raisins
- 3.4.5. Sultana Raisins
- 3.4.6. Black Currant Raisins
- 3.4.7. Muscat Raisins
- 3.4.8. Others
- 3.5. Global Raisins Market Analysis, Opportunity and Forecast, By End Use, 2016-2032
- 3.5.1. Global Raisins Market Analysis by End Use: Introduction
- 3.5.2. Market Size Absolute $ Opportunity Analysis and Forecast, By End Use, 2016-2032
- 3.5.3. Snacks and Confectionery
- 3.5.4. Bakery and Cereals
- 3.5.5. Dairy Products
- 3.5.6. Desserts
- 3.5.7. Beverages
- 3.5.8. Others
- 3.6. Global Raisins Market Analysis, Opportunity and Forecast, By Distribution Channel, 2016-2032
- 3.6.1. Global Raisins Market Analysis by Distribution Channel: Introduction
- 3.6.2. Market Size Absolute $ Opportunity Analysis and Forecast, By Distribution Channel, 2016-2032
- 3.6.3. Supermarkets/Hypermarkets
- 3.6.4. Convenience Stores
- 3.6.5. Specialty Stores
- 3.6.6. Online Retail
- 3.6.7. Others
- 4. North America Raisins Market Analysis, Opportunity and Forecast, 2016-2032
- 4.1. North America Raisins Market Analysis, 2016-2021
- 4.2. North America Raisins Market Opportunity and Forecast, 2023-2032
- 4.3. North America Raisins Market Analysis, Opportunity and Forecast, By Nature, 2016-2032
- 4.3.1. North America Raisins Market Analysis by Nature: Introduction
- 4.3.2. Market Size Absolute $ Opportunity Analysis and Forecast, By Nature, 2016-2032
- 4.3.3. Organic Raisins
- 4.3.4. Conventional Raisins
- 4.4. North America Raisins Market Analysis, Opportunity and Forecast, By Type, 2016-2032
- 4.4.1. North America Raisins Market Analysis by Type: Introduction
- 4.4.2. Market Size Absolute $ Opportunity Analysis and Forecast, By Type, 2016-2032
- 4.4.3. Natural Sun-Dried Raisins
- 4.4.4. Golden Raisins
- 4.4.5. Sultana Raisins
- 4.4.6. Black Currant Raisins
- 4.4.7. Muscat Raisins
- 4.4.8. Others
- 4.5. North America Raisins Market Analysis, Opportunity and Forecast, By End Use, 2016-2032
- 4.5.1. North America Raisins Market Analysis by End Use: Introduction
- 4.5.2. Market Size Absolute $ Opportunity Analysis and Forecast, By End Use, 2016-2032
- 4.5.3. Snacks and Confectionery
- 4.5.4. Bakery and Cereals
- 4.5.5. Dairy Products
- 4.5.6. Desserts
- 4.5.7. Beverages
- 4.5.8. Others
- 4.6. North America Raisins Market Analysis, Opportunity and Forecast, By Distribution Channel, 2016-2032
- 4.6.1. North America Raisins Market Analysis by Distribution Channel: Introduction
- 4.6.2. Market Size Absolute $ Opportunity Analysis and Forecast, By Distribution Channel, 2016-2032
- 4.6.3. Supermarkets/Hypermarkets
- 4.6.4. Convenience Stores
- 4.6.5. Specialty Stores
- 4.6.6. Online Retail
- 4.6.7. Others
- 4.7. North America Raisins Market Analysis, Opportunity and Forecast, By Country , 2016-2032
- 4.7.1. North America Raisins Market Analysis by Country : Introduction
- 4.7.2. Market Size Absolute $ Opportunity Analysis and Forecast, Country , 2016-2032
- 4.7.2.1. The US
- 4.7.2.2. Canada
- 4.7.2.3. Mexico
- 5. Western Europe Raisins Market Analysis, Opportunity and Forecast, 2016-2032
- 5.1. Western Europe Raisins Market Analysis, 2016-2021
- 5.2. Western Europe Raisins Market Opportunity and Forecast, 2023-2032
- 5.3. Western Europe Raisins Market Analysis, Opportunity and Forecast, By Nature, 2016-2032
- 5.3.1. Western Europe Raisins Market Analysis by Nature: Introduction
- 5.3.2. Market Size Absolute $ Opportunity Analysis and Forecast, By Nature, 2016-2032
- 5.3.3. Organic Raisins
- 5.3.4. Conventional Raisins
- 5.4. Western Europe Raisins Market Analysis, Opportunity and Forecast, By Type, 2016-2032
- 5.4.1. Western Europe Raisins Market Analysis by Type: Introduction
- 5.4.2. Market Size Absolute $ Opportunity Analysis and Forecast, By Type, 2016-2032
- 5.4.3. Natural Sun-Dried Raisins
- 5.4.4. Golden Raisins
- 5.4.5. Sultana Raisins
- 5.4.6. Black Currant Raisins
- 5.4.7. Muscat Raisins
- 5.4.8. Others
- 5.5. Western Europe Raisins Market Analysis, Opportunity and Forecast, By End Use, 2016-2032
- 5.5.1. Western Europe Raisins Market Analysis by End Use: Introduction
- 5.5.2. Market Size Absolute $ Opportunity Analysis and Forecast, By End Use, 2016-2032
- 5.5.3. Snacks and Confectionery
- 5.5.4. Bakery and Cereals
- 5.5.5. Dairy Products
- 5.5.6. Desserts
- 5.5.7. Beverages
- 5.5.8. Others
- 5.6. Western Europe Raisins Market Analysis, Opportunity and Forecast, By Distribution Channel, 2016-2032
- 5.6.1. Western Europe Raisins Market Analysis by Distribution Channel: Introduction
- 5.6.2. Market Size Absolute $ Opportunity Analysis and Forecast, By Distribution Channel, 2016-2032
- 5.6.3. Supermarkets/Hypermarkets
- 5.6.4. Convenience Stores
- 5.6.5. Specialty Stores
- 5.6.6. Online Retail
- 5.6.7. Others
- 5.7. Western Europe Raisins Market Analysis, Opportunity and Forecast, By Country , 2016-2032
- 5.7.1. Western Europe Raisins Market Analysis by Country : Introduction
- 5.7.2. Market Size Absolute $ Opportunity Analysis and Forecast, Country , 2016-2032
- 5.7.2.1. Germany
- 5.7.2.2. France
- 5.7.2.3. The UK
- 5.7.2.4. Spain
- 5.7.2.5. Italy
- 5.7.2.6. Portugal
- 5.7.2.7. Ireland
- 5.7.2.8. Austria
- 5.7.2.9. Switzerland
- 5.7.2.10. Benelux
- 5.7.2.11. Nordic
- 5.7.2.12. Rest of Western Europe
- 6. Eastern Europe Raisins Market Analysis, Opportunity and Forecast, 2016-2032
- 6.1. Eastern Europe Raisins Market Analysis, 2016-2021
- 6.2. Eastern Europe Raisins Market Opportunity and Forecast, 2023-2032
- 6.3. Eastern Europe Raisins Market Analysis, Opportunity and Forecast, By Nature, 2016-2032
- 6.3.1. Eastern Europe Raisins Market Analysis by Nature: Introduction
- 6.3.2. Market Size Absolute $ Opportunity Analysis and Forecast, By Nature, 2016-2032
- 6.3.3. Organic Raisins
- 6.3.4. Conventional Raisins
- 6.4. Eastern Europe Raisins Market Analysis, Opportunity and Forecast, By Type, 2016-2032
- 6.4.1. Eastern Europe Raisins Market Analysis by Type: Introduction
- 6.4.2. Market Size Absolute $ Opportunity Analysis and Forecast, By Type, 2016-2032
- 6.4.3. Natural Sun-Dried Raisins
- 6.4.4. Golden Raisins
- 6.4.5. Sultana Raisins
- 6.4.6. Black Currant Raisins
- 6.4.7. Muscat Raisins
- 6.4.8. Others
- 6.5. Eastern Europe Raisins Market Analysis, Opportunity and Forecast, By End Use, 2016-2032
- 6.5.1. Eastern Europe Raisins Market Analysis by End Use: Introduction
- 6.5.2. Market Size Absolute $ Opportunity Analysis and Forecast, By End Use, 2016-2032
- 6.5.3. Snacks and Confectionery
- 6.5.4. Bakery and Cereals
- 6.5.5. Dairy Products
- 6.5.6. Desserts
- 6.5.7. Beverages
- 6.5.8. Others
- 6.6. Eastern Europe Raisins Market Analysis, Opportunity and Forecast, By Distribution Channel, 2016-2032
- 6.6.1. Eastern Europe Raisins Market Analysis by Distribution Channel: Introduction
- 6.6.2. Market Size Absolute $ Opportunity Analysis and Forecast, By Distribution Channel, 2016-2032
- 6.6.3. Supermarkets/Hypermarkets
- 6.6.4. Convenience Stores
- 6.6.5. Specialty Stores
- 6.6.6. Online Retail
- 6.6.7. Others
- 6.7. Eastern Europe Raisins Market Analysis, Opportunity and Forecast, By Country , 2016-2032
- 6.7.1. Eastern Europe Raisins Market Analysis by Country : Introduction
- 6.7.2. Market Size Absolute $ Opportunity Analysis and Forecast, Country , 2016-2032
- 6.7.2.1. Russia
- 6.7.2.2. Poland
- 6.7.2.3. The Czech Republic
- 6.7.2.4. Greece
- 6.7.2.5. Rest of Eastern Europe
- 7. APAC Raisins Market Analysis, Opportunity and Forecast, 2016-2032
- 7.1. APAC Raisins Market Analysis, 2016-2021
- 7.2. APAC Raisins Market Opportunity and Forecast, 2023-2032
- 7.3. APAC Raisins Market Analysis, Opportunity and Forecast, By Nature, 2016-2032
- 7.3.1. APAC Raisins Market Analysis by Nature: Introduction
- 7.3.2. Market Size Absolute $ Opportunity Analysis and Forecast, By Nature, 2016-2032
- 7.3.3. Organic Raisins
- 7.3.4. Conventional Raisins
- 7.4. APAC Raisins Market Analysis, Opportunity and Forecast, By Type, 2016-2032
- 7.4.1. APAC Raisins Market Analysis by Type: Introduction
- 7.4.2. Market Size Absolute $ Opportunity Analysis and Forecast, By Type, 2016-2032
- 7.4.3. Natural Sun-Dried Raisins
- 7.4.4. Golden Raisins
- 7.4.5. Sultana Raisins
- 7.4.6. Black Currant Raisins
- 7.4.7. Muscat Raisins
- 7.4.8. Others
- 7.5. APAC Raisins Market Analysis, Opportunity and Forecast, By End Use, 2016-2032
- 7.5.1. APAC Raisins Market Analysis by End Use: Introduction
- 7.5.2. Market Size Absolute $ Opportunity Analysis and Forecast, By End Use, 2016-2032
- 7.5.3. Snacks and Confectionery
- 7.5.4. Bakery and Cereals
- 7.5.5. Dairy Products
- 7.5.6. Desserts
- 7.5.7. Beverages
- 7.5.8. Others
- 7.6. APAC Raisins Market Analysis, Opportunity and Forecast, By Distribution Channel, 2016-2032
- 7.6.1. APAC Raisins Market Analysis by Distribution Channel: Introduction
- 7.6.2. Market Size Absolute $ Opportunity Analysis and Forecast, By Distribution Channel, 2016-2032
- 7.6.3. Supermarkets/Hypermarkets
- 7.6.4. Convenience Stores
- 7.6.5. Specialty Stores
- 7.6.6. Online Retail
- 7.6.7. Others
- 7.7. APAC Raisins Market Analysis, Opportunity and Forecast, By Country , 2016-2032
- 7.7.1. APAC Raisins Market Analysis by Country : Introduction
- 7.7.2. Market Size Absolute $ Opportunity Analysis and Forecast, Country , 2016-2032
- 7.7.2.1. China
- 7.7.2.2. Japan
- 7.7.2.3. South Korea
- 7.7.2.4. India
- 7.7.2.5. Australia & New Zeland
- 7.7.2.6. Indonesia
- 7.7.2.7. Malaysia
- 7.7.2.8. Philippines
- 7.7.2.9. Singapore
- 7.7.2.10. Thailand
- 7.7.2.11. Vietnam
- 7.7.2.12. Rest of APAC
- 8. Latin America Raisins Market Analysis, Opportunity and Forecast, 2016-2032
- 8.1. Latin America Raisins Market Analysis, 2016-2021
- 8.2. Latin America Raisins Market Opportunity and Forecast, 2023-2032
- 8.3. Latin America Raisins Market Analysis, Opportunity and Forecast, By Nature, 2016-2032
- 8.3.1. Latin America Raisins Market Analysis by Nature: Introduction
- 8.3.2. Market Size Absolute $ Opportunity Analysis and Forecast, By Nature, 2016-2032
- 8.3.3. Organic Raisins
- 8.3.4. Conventional Raisins
- 8.4. Latin America Raisins Market Analysis, Opportunity and Forecast, By Type, 2016-2032
- 8.4.1. Latin America Raisins Market Analysis by Type: Introduction
- 8.4.2. Market Size Absolute $ Opportunity Analysis and Forecast, By Type, 2016-2032
- 8.4.3. Natural Sun-Dried Raisins
- 8.4.4. Golden Raisins
- 8.4.5. Sultana Raisins
- 8.4.6. Black Currant Raisins
- 8.4.7. Muscat Raisins
- 8.4.8. Others
- 8.5. Latin America Raisins Market Analysis, Opportunity and Forecast, By End Use, 2016-2032
- 8.5.1. Latin America Raisins Market Analysis by End Use: Introduction
- 8.5.2. Market Size Absolute $ Opportunity Analysis and Forecast, By End Use, 2016-2032
- 8.5.3. Snacks and Confectionery
- 8.5.4. Bakery and Cereals
- 8.5.5. Dairy Products
- 8.5.6. Desserts
- 8.5.7. Beverages
- 8.5.8. Others
- 8.6. Latin America Raisins Market Analysis, Opportunity and Forecast, By Distribution Channel, 2016-2032
- 8.6.1. Latin America Raisins Market Analysis by Distribution Channel: Introduction
- 8.6.2. Market Size Absolute $ Opportunity Analysis and Forecast, By Distribution Channel, 2016-2032
- 8.6.3. Supermarkets/Hypermarkets
- 8.6.4. Convenience Stores
- 8.6.5. Specialty Stores
- 8.6.6. Online Retail
- 8.6.7. Others
- 8.7. Latin America Raisins Market Analysis, Opportunity and Forecast, By Country , 2016-2032
- 8.7.1. Latin America Raisins Market Analysis by Country : Introduction
- 8.7.2. Market Size Absolute $ Opportunity Analysis and Forecast, Country , 2016-2032
- 8.7.2.1. Brazil
- 8.7.2.2. Colombia
- 8.7.2.3. Chile
- 8.7.2.4. Argentina
- 8.7.2.5. Costa Rica
- 8.7.2.6. Rest of Latin America
- 9. Middle East & Africa Raisins Market Analysis, Opportunity and Forecast, 2016-2032
- 9.1. Middle East & Africa Raisins Market Analysis, 2016-2021
- 9.2. Middle East & Africa Raisins Market Opportunity and Forecast, 2023-2032
- 9.3. Middle East & Africa Raisins Market Analysis, Opportunity and Forecast, By Nature, 2016-2032
- 9.3.1. Middle East & Africa Raisins Market Analysis by Nature: Introduction
- 9.3.2. Market Size Absolute $ Opportunity Analysis and Forecast, By Nature, 2016-2032
- 9.3.3. Organic Raisins
- 9.3.4. Conventional Raisins
- 9.4. Middle East & Africa Raisins Market Analysis, Opportunity and Forecast, By Type, 2016-2032
- 9.4.1. Middle East & Africa Raisins Market Analysis by Type: Introduction
- 9.4.2. Market Size Absolute $ Opportunity Analysis and Forecast, By Type, 2016-2032
- 9.4.3. Natural Sun-Dried Raisins
- 9.4.4. Golden Raisins
- 9.4.5. Sultana Raisins
- 9.4.6. Black Currant Raisins
- 9.4.7. Muscat Raisins
- 9.4.8. Others
- 9.5. Middle East & Africa Raisins Market Analysis, Opportunity and Forecast, By End Use, 2016-2032
- 9.5.1. Middle East & Africa Raisins Market Analysis by End Use: Introduction
- 9.5.2. Market Size Absolute $ Opportunity Analysis and Forecast, By End Use, 2016-2032
- 9.5.3. Snacks and Confectionery
- 9.5.4. Bakery and Cereals
- 9.5.5. Dairy Products
- 9.5.6. Desserts
- 9.5.7. Beverages
- 9.5.8. Others
- 9.6. Middle East & Africa Raisins Market Analysis, Opportunity and Forecast, By Distribution Channel, 2016-2032
- 9.6.1. Middle East & Africa Raisins Market Analysis by Distribution Channel: Introduction
- 9.6.2. Market Size Absolute $ Opportunity Analysis and Forecast, By Distribution Channel, 2016-2032
- 9.6.3. Supermarkets/Hypermarkets
- 9.6.4. Convenience Stores
- 9.6.5. Specialty Stores
- 9.6.6. Online Retail
- 9.6.7. Others
- 9.7. Middle East & Africa Raisins Market Analysis, Opportunity and Forecast, By Country , 2016-2032
- 9.7.1. Middle East & Africa Raisins Market Analysis by Country : Introduction
- 9.7.2. Market Size Absolute $ Opportunity Analysis and Forecast, Country , 2016-2032
- 9.7.2.1. Algeria
- 9.7.2.2. Egypt
- 9.7.2.3. Israel
- 9.7.2.4. Kuwait
- 9.7.2.5. Nigeria
- 9.7.2.6. Saudi Arabia
- 9.7.2.7. South Africa
- 9.7.2.8. Turkey
- 9.7.2.9. The UAE
- 9.7.2.10. Rest of MEA
- 10. Global Raisins Market Analysis, Opportunity and Forecast, By Region , 2016-2032
- 10.1. Global Raisins Market Analysis by Region : Introduction
- 10.2. Market Size Absolute $ Opportunity Analysis and Forecast, By Region , 2016-2032
- 10.2.1. North America
- 10.2.2. Western Europe
- 10.2.3. Eastern Europe
- 10.2.4. APAC
- 10.2.5. Latin America
- 10.2.6. Middle East & Africa
- 11. Global Raisins Market Competitive Landscape, Market Share Analysis, and Company Profiles
- 11.1. Market Share Analysis
- 11.2. Company Profiles
- 11.3. Sun-Maid Growers
- 11.3.1. Company Overview
- 11.3.2. Financial Highlights
- 11.3.3. Product Portfolio
- 11.3.4. SWOT Analysis
- 11.3.5. Key Strategies and Developments
- 11.4. Sunbeam Foods Pty Ltd.
- 11.4.1. Company Overview
- 11.4.2. Financial Highlights
- 11.4.3. Product Portfolio
- 11.4.4. SWOT Analysis
- 11.4.5. Key Strategies and Developments
- 11.5. Dole Packaged Foods LLC
- 11.5.1. Company Overview
- 11.5.2. Financial Highlights
- 11.5.3. Product Portfolio
- 11.5.4. SWOT Analysis
- 11.5.5. Key Strategies and Developments
- 11.6. Mariani Packing Company
- 11.6.1. Company Overview
- 11.6.2. Financial Highlights
- 11.6.3. Product Portfolio
- 11.6.4. SWOT Analysis
- 11.6.5. Key Strategies and Developments
- 11.7. Montagu Snacks
- 11.7.1. Company Overview
- 11.7.2. Financial Highlights
- 11.7.3. Product Portfolio
- 11.7.4. SWOT Analysis
- 11.7.5. Key Strategies and Developments
- 11.8. Viva Bella Orchards Inc.
- 11.8.1. Company Overview
- 11.8.2. Financial Highlights
- 11.8.3. Product Portfolio
- 11.8.4. SWOT Analysis
- 11.8.5. Key Strategies and Developments
- 11.9. Fresh Del Monte Produce Inc.
- 11.9.1. Company Overview
- 11.9.2. Financial Highlights
- 11.9.3. Product Portfolio
- 11.9.4. SWOT Analysis
- 11.9.5. Key Strategies and Developments
- 11.10. Citadelle Maple Syrup Producers'
- 11.10.1. Company Overview
- 11.10.2. Financial Highlights
- 11.10.3. Product Portfolio
- 11.10.4. SWOT Analysis
- 11.10.5. Key Strategies and Developments
- 11.11. N. Sunshine Raisin Corporation Market
- 11.11.1. Company Overview
- 11.11.2. Financial Highlights
- 11.11.3. Product Portfolio
- 11.11.4. SWOT Analysis
- 11.11.5. Key Strategies and Developments
- 11.12. Nuts Ltd Market
- 11.12.1. Company Overview
- 11.12.2. Financial Highlights
- 11.12.3. Product Portfolio
- 11.12.4. SWOT Analysis
- 11.12.5. Key Strategies and Developments
- 11.13.1. Company Overview
- 11.13.2. Financial Highlights
- 11.13.3. Product Portfolio
- 11.13.4. SWOT Analysis
- 11.13.5. Key Strategies and Developments
- 12. Assumptions and Acronyms
- 13. Research Methodology
- 14. Contact
- List of Figures
- Figure 1: Global Raisins Market Revenue (US$ Mn) Market Share by Nature in 2022
- Figure 2: Global Raisins Market Attractiveness Analysis by Nature, 2016-2032
- Figure 3: Global Raisins Market Revenue (US$ Mn) Market Share by Typein 2022
- Figure 4: Global Raisins Market Attractiveness Analysis by Type, 2016-2032
- Figure 5: Global Raisins Market Revenue (US$ Mn) Market Share by End Usein 2022
- Figure 6: Global Raisins Market Attractiveness Analysis by End Use, 2016-2032
- Figure 7: Global Raisins Market Revenue (US$ Mn) Market Share by Distribution Channelin 2022
- Figure 8: Global Raisins Market Attractiveness Analysis by Distribution Channel, 2016-2032
- Figure 9: Global Raisins Market Revenue (US$ Mn) Market Share by Region in 2022
- Figure 10: Global Raisins Market Attractiveness Analysis by Region, 2016-2032
- Figure 11: Global Raisins Market Revenue (US$ Mn) (2016-2032)
- Figure 12: Global Raisins Market Revenue (US$ Mn) Comparison by Region (2016-2032)
- Figure 13: Global Raisins Market Revenue (US$ Mn) Comparison by Nature (2016-2032)
- Figure 14: Global Raisins Market Revenue (US$ Mn) Comparison by Type (2016-2032)
- Figure 15: Global Raisins Market Revenue (US$ Mn) Comparison by End Use (2016-2032)
- Figure 16: Global Raisins Market Revenue (US$ Mn) Comparison by Distribution Channel (2016-2032)
- Figure 17: Global Raisins Market Y-o-Y Growth Rate Comparison by Region (2016-2032)
- Figure 18: Global Raisins Market Y-o-Y Growth Rate Comparison by Nature (2016-2032)
- Figure 19: Global Raisins Market Y-o-Y Growth Rate Comparison by Type (2016-2032)
- Figure 20: Global Raisins Market Y-o-Y Growth Rate Comparison by End Use (2016-2032)
- Figure 21: Global Raisins Market Y-o-Y Growth Rate Comparison by Distribution Channel (2016-2032)
- Figure 22: Global Raisins Market Share Comparison by Region (2016-2032)
- Figure 23: Global Raisins Market Share Comparison by Nature (2016-2032)
- Figure 24: Global Raisins Market Share Comparison by Type (2016-2032)
- Figure 25: Global Raisins Market Share Comparison by End Use (2016-2032)
- Figure 26: Global Raisins Market Share Comparison by Distribution Channel (2016-2032)
- Figure 27: North America Raisins Market Revenue (US$ Mn) Market Share by Naturein 2022
- Figure 28: North America Raisins Market Attractiveness Analysis by Nature, 2016-2032
- Figure 29: North America Raisins Market Revenue (US$ Mn) Market Share by Typein 2022
- Figure 30: North America Raisins Market Attractiveness Analysis by Type, 2016-2032
- Figure 31: North America Raisins Market Revenue (US$ Mn) Market Share by End Usein 2022
- Figure 32: North America Raisins Market Attractiveness Analysis by End Use, 2016-2032
- Figure 33: North America Raisins Market Revenue (US$ Mn) Market Share by Distribution Channelin 2022
- Figure 34: North America Raisins Market Attractiveness Analysis by Distribution Channel, 2016-2032
- Figure 35: North America Raisins Market Revenue (US$ Mn) Market Share by Country in 2022
- Figure 36: North America Raisins Market Attractiveness Analysis by Country, 2016-2032
- Figure 37: North America Raisins Market Revenue (US$ Mn) (2016-2032)
- Figure 38: North America Raisins Market Revenue (US$ Mn) Comparison by Country (2016-2032)
- Figure 39: North America Raisins Market Revenue (US$ Mn) Comparison by Nature (2016-2032)
- Figure 40: North America Raisins Market Revenue (US$ Mn) Comparison by Type (2016-2032)
- Figure 41: North America Raisins Market Revenue (US$ Mn) Comparison by End Use (2016-2032)
- Figure 42: North America Raisins Market Revenue (US$ Mn) Comparison by Distribution Channel (2016-2032)
- Figure 43: North America Raisins Market Y-o-Y Growth Rate Comparison by Country (2016-2032)
- Figure 44: North America Raisins Market Y-o-Y Growth Rate Comparison by Nature (2016-2032)
- Figure 45: North America Raisins Market Y-o-Y Growth Rate Comparison by Type (2016-2032)
- Figure 46: North America Raisins Market Y-o-Y Growth Rate Comparison by End Use (2016-2032)
- Figure 47: North America Raisins Market Y-o-Y Growth Rate Comparison by Distribution Channel (2016-2032)
- Figure 48: North America Raisins Market Share Comparison by Country (2016-2032)
- Figure 49: North America Raisins Market Share Comparison by Nature (2016-2032)
- Figure 50: North America Raisins Market Share Comparison by Type (2016-2032)
- Figure 51: North America Raisins Market Share Comparison by End Use (2016-2032)
- Figure 52: North America Raisins Market Share Comparison by Distribution Channel (2016-2032)
- Figure 53: Western Europe Raisins Market Revenue (US$ Mn) Market Share by Naturein 2022
- Figure 54: Western Europe Raisins Market Attractiveness Analysis by Nature, 2016-2032
- Figure 55: Western Europe Raisins Market Revenue (US$ Mn) Market Share by Typein 2022
- Figure 56: Western Europe Raisins Market Attractiveness Analysis by Type, 2016-2032
- Figure 57: Western Europe Raisins Market Revenue (US$ Mn) Market Share by End Usein 2022
- Figure 58: Western Europe Raisins Market Attractiveness Analysis by End Use, 2016-2032
- Figure 59: Western Europe Raisins Market Revenue (US$ Mn) Market Share by Distribution Channelin 2022
- Figure 60: Western Europe Raisins Market Attractiveness Analysis by Distribution Channel, 2016-2032
- Figure 61: Western Europe Raisins Market Revenue (US$ Mn) Market Share by Country in 2022
- Figure 62: Western Europe Raisins Market Attractiveness Analysis by Country, 2016-2032
- Figure 63: Western Europe Raisins Market Revenue (US$ Mn) (2016-2032)
- Figure 64: Western Europe Raisins Market Revenue (US$ Mn) Comparison by Country (2016-2032)
- Figure 65: Western Europe Raisins Market Revenue (US$ Mn) Comparison by Nature (2016-2032)
- Figure 66: Western Europe Raisins Market Revenue (US$ Mn) Comparison by Type (2016-2032)
- Figure 67: Western Europe Raisins Market Revenue (US$ Mn) Comparison by End Use (2016-2032)
- Figure 68: Western Europe Raisins Market Revenue (US$ Mn) Comparison by Distribution Channel (2016-2032)
- Figure 69: Western Europe Raisins Market Y-o-Y Growth Rate Comparison by Country (2016-2032)
- Figure 70: Western Europe Raisins Market Y-o-Y Growth Rate Comparison by Nature (2016-2032)
- Figure 71: Western Europe Raisins Market Y-o-Y Growth Rate Comparison by Type (2016-2032)
- Figure 72: Western Europe Raisins Market Y-o-Y Growth Rate Comparison by End Use (2016-2032)
- Figure 73: Western Europe Raisins Market Y-o-Y Growth Rate Comparison by Distribution Channel (2016-2032)
- Figure 74: Western Europe Raisins Market Share Comparison by Country (2016-2032)
- Figure 75: Western Europe Raisins Market Share Comparison by Nature (2016-2032)
- Figure 76: Western Europe Raisins Market Share Comparison by Type (2016-2032)
- Figure 77: Western Europe Raisins Market Share Comparison by End Use (2016-2032)
- Figure 78: Western Europe Raisins Market Share Comparison by Distribution Channel (2016-2032)
- Figure 79: Eastern Europe Raisins Market Revenue (US$ Mn) Market Share by Naturein 2022
- Figure 80: Eastern Europe Raisins Market Attractiveness Analysis by Nature, 2016-2032
- Figure 81: Eastern Europe Raisins Market Revenue (US$ Mn) Market Share by Typein 2022
- Figure 82: Eastern Europe Raisins Market Attractiveness Analysis by Type, 2016-2032
- Figure 83: Eastern Europe Raisins Market Revenue (US$ Mn) Market Share by End Usein 2022
- Figure 84: Eastern Europe Raisins Market Attractiveness Analysis by End Use, 2016-2032
- Figure 85: Eastern Europe Raisins Market Revenue (US$ Mn) Market Share by Distribution Channelin 2022
- Figure 86: Eastern Europe Raisins Market Attractiveness Analysis by Distribution Channel, 2016-2032
- Figure 87: Eastern Europe Raisins Market Revenue (US$ Mn) Market Share by Country in 2022
- Figure 88: Eastern Europe Raisins Market Attractiveness Analysis by Country, 2016-2032
- Figure 89: Eastern Europe Raisins Market Revenue (US$ Mn) (2016-2032)
- Figure 90: Eastern Europe Raisins Market Revenue (US$ Mn) Comparison by Country (2016-2032)
- Figure 91: Eastern Europe Raisins Market Revenue (US$ Mn) Comparison by Nature (2016-2032)
- Figure 92: Eastern Europe Raisins Market Revenue (US$ Mn) Comparison by Type (2016-2032)
- Figure 93: Eastern Europe Raisins Market Revenue (US$ Mn) Comparison by End Use (2016-2032)
- Figure 94: Eastern Europe Raisins Market Revenue (US$ Mn) Comparison by Distribution Channel (2016-2032)
- Figure 95: Eastern Europe Raisins Market Y-o-Y Growth Rate Comparison by Country (2016-2032)
- Figure 96: Eastern Europe Raisins Market Y-o-Y Growth Rate Comparison by Nature (2016-2032)
- Figure 97: Eastern Europe Raisins Market Y-o-Y Growth Rate Comparison by Type (2016-2032)
- Figure 98: Eastern Europe Raisins Market Y-o-Y Growth Rate Comparison by End Use (2016-2032)
- Figure 99: Eastern Europe Raisins Market Y-o-Y Growth Rate Comparison by Distribution Channel (2016-2032)
- Figure 100: Eastern Europe Raisins Market Share Comparison by Country (2016-2032)
- Figure 101: Eastern Europe Raisins Market Share Comparison by Nature (2016-2032)
- Figure 102: Eastern Europe Raisins Market Share Comparison by Type (2016-2032)
- Figure 103: Eastern Europe Raisins Market Share Comparison by End Use (2016-2032)
- Figure 104: Eastern Europe Raisins Market Share Comparison by Distribution Channel (2016-2032)
- Figure 105: APAC Raisins Market Revenue (US$ Mn) Market Share by Naturein 2022
- Figure 106: APAC Raisins Market Attractiveness Analysis by Nature, 2016-2032
- Figure 107: APAC Raisins Market Revenue (US$ Mn) Market Share by Typein 2022
- Figure 108: APAC Raisins Market Attractiveness Analysis by Type, 2016-2032
- Figure 109: APAC Raisins Market Revenue (US$ Mn) Market Share by End Usein 2022
- Figure 110: APAC Raisins Market Attractiveness Analysis by End Use, 2016-2032
- Figure 111: APAC Raisins Market Revenue (US$ Mn) Market Share by Distribution Channelin 2022
- Figure 112: APAC Raisins Market Attractiveness Analysis by Distribution Channel, 2016-2032
- Figure 113: APAC Raisins Market Revenue (US$ Mn) Market Share by Country in 2022
- Figure 114: APAC Raisins Market Attractiveness Analysis by Country, 2016-2032
- Figure 115: APAC Raisins Market Revenue (US$ Mn) (2016-2032)
- Figure 116: APAC Raisins Market Revenue (US$ Mn) Comparison by Country (2016-2032)
- Figure 117: APAC Raisins Market Revenue (US$ Mn) Comparison by Nature (2016-2032)
- Figure 118: APAC Raisins Market Revenue (US$ Mn) Comparison by Type (2016-2032)
- Figure 119: APAC Raisins Market Revenue (US$ Mn) Comparison by End Use (2016-2032)
- Figure 120: APAC Raisins Market Revenue (US$ Mn) Comparison by Distribution Channel (2016-2032)
- Figure 121: APAC Raisins Market Y-o-Y Growth Rate Comparison by Country (2016-2032)
- Figure 122: APAC Raisins Market Y-o-Y Growth Rate Comparison by Nature (2016-2032)
- Figure 123: APAC Raisins Market Y-o-Y Growth Rate Comparison by Type (2016-2032)
- Figure 124: APAC Raisins Market Y-o-Y Growth Rate Comparison by End Use (2016-2032)
- Figure 125: APAC Raisins Market Y-o-Y Growth Rate Comparison by Distribution Channel (2016-2032)
- Figure 126: APAC Raisins Market Share Comparison by Country (2016-2032)
- Figure 127: APAC Raisins Market Share Comparison by Nature (2016-2032)
- Figure 128: APAC Raisins Market Share Comparison by Type (2016-2032)
- Figure 129: APAC Raisins Market Share Comparison by End Use (2016-2032)
- Figure 130: APAC Raisins Market Share Comparison by Distribution Channel (2016-2032)
- Figure 131: Latin America Raisins Market Revenue (US$ Mn) Market Share by Naturein 2022
- Figure 132: Latin America Raisins Market Attractiveness Analysis by Nature, 2016-2032
- Figure 133: Latin America Raisins Market Revenue (US$ Mn) Market Share by Typein 2022
- Figure 134: Latin America Raisins Market Attractiveness Analysis by Type, 2016-2032
- Figure 135: Latin America Raisins Market Revenue (US$ Mn) Market Share by End Usein 2022
- Figure 136: Latin America Raisins Market Attractiveness Analysis by End Use, 2016-2032
- Figure 137: Latin America Raisins Market Revenue (US$ Mn) Market Share by Distribution Channelin 2022
- Figure 138: Latin America Raisins Market Attractiveness Analysis by Distribution Channel, 2016-2032
- Figure 139: Latin America Raisins Market Revenue (US$ Mn) Market Share by Country in 2022
- Figure 140: Latin America Raisins Market Attractiveness Analysis by Country, 2016-2032
- Figure 141: Latin America Raisins Market Revenue (US$ Mn) (2016-2032)
- Figure 142: Latin America Raisins Market Revenue (US$ Mn) Comparison by Country (2016-2032)
- Figure 143: Latin America Raisins Market Revenue (US$ Mn) Comparison by Nature (2016-2032)
- Figure 144: Latin America Raisins Market Revenue (US$ Mn) Comparison by Type (2016-2032)
- Figure 145: Latin America Raisins Market Revenue (US$ Mn) Comparison by End Use (2016-2032)
- Figure 146: Latin America Raisins Market Revenue (US$ Mn) Comparison by Distribution Channel (2016-2032)
- Figure 147: Latin America Raisins Market Y-o-Y Growth Rate Comparison by Country (2016-2032)
- Figure 148: Latin America Raisins Market Y-o-Y Growth Rate Comparison by Nature (2016-2032)
- Figure 149: Latin America Raisins Market Y-o-Y Growth Rate Comparison by Type (2016-2032)
- Figure 150: Latin America Raisins Market Y-o-Y Growth Rate Comparison by End Use (2016-2032)
- Figure 151: Latin America Raisins Market Y-o-Y Growth Rate Comparison by Distribution Channel (2016-2032)
- Figure 152: Latin America Raisins Market Share Comparison by Country (2016-2032)
- Figure 153: Latin America Raisins Market Share Comparison by Nature (2016-2032)
- Figure 154: Latin America Raisins Market Share Comparison by Type (2016-2032)
- Figure 155: Latin America Raisins Market Share Comparison by End Use (2016-2032)
- Figure 156: Latin America Raisins Market Share Comparison by Distribution Channel (2016-2032)
- Figure 157: Middle East & Africa Raisins Market Revenue (US$ Mn) Market Share by Naturein 2022
- Figure 158: Middle East & Africa Raisins Market Attractiveness Analysis by Nature, 2016-2032
- Figure 159: Middle East & Africa Raisins Market Revenue (US$ Mn) Market Share by Typein 2022
- Figure 160: Middle East & Africa Raisins Market Attractiveness Analysis by Type, 2016-2032
- Figure 161: Middle East & Africa Raisins Market Revenue (US$ Mn) Market Share by End Usein 2022
- Figure 162: Middle East & Africa Raisins Market Attractiveness Analysis by End Use, 2016-2032
- Figure 163: Middle East & Africa Raisins Market Revenue (US$ Mn) Market Share by Distribution Channelin 2022
- Figure 164: Middle East & Africa Raisins Market Attractiveness Analysis by Distribution Channel, 2016-2032
- Figure 165: Middle East & Africa Raisins Market Revenue (US$ Mn) Market Share by Country in 2022
- Figure 166: Middle East & Africa Raisins Market Attractiveness Analysis by Country, 2016-2032
- Figure 167: Middle East & Africa Raisins Market Revenue (US$ Mn) (2016-2032)
- Figure 168: Middle East & Africa Raisins Market Revenue (US$ Mn) Comparison by Country (2016-2032)
- Figure 169: Middle East & Africa Raisins Market Revenue (US$ Mn) Comparison by Nature (2016-2032)
- Figure 170: Middle East & Africa Raisins Market Revenue (US$ Mn) Comparison by Type (2016-2032)
- Figure 171: Middle East & Africa Raisins Market Revenue (US$ Mn) Comparison by End Use (2016-2032)
- Figure 172: Middle East & Africa Raisins Market Revenue (US$ Mn) Comparison by Distribution Channel (2016-2032)
- Figure 173: Middle East & Africa Raisins Market Y-o-Y Growth Rate Comparison by Country (2016-2032)
- Figure 174: Middle East & Africa Raisins Market Y-o-Y Growth Rate Comparison by Nature (2016-2032)
- Figure 175: Middle East & Africa Raisins Market Y-o-Y Growth Rate Comparison by Type (2016-2032)
- Figure 176: Middle East & Africa Raisins Market Y-o-Y Growth Rate Comparison by End Use (2016-2032)
- Figure 177: Middle East & Africa Raisins Market Y-o-Y Growth Rate Comparison by Distribution Channel (2016-2032)
- Figure 178: Middle East & Africa Raisins Market Share Comparison by Country (2016-2032)
- Figure 179: Middle East & Africa Raisins Market Share Comparison by Nature (2016-2032)
- Figure 180: Middle East & Africa Raisins Market Share Comparison by Type (2016-2032)
- Figure 181: Middle East & Africa Raisins Market Share Comparison by End Use (2016-2032)
- Figure 182: Middle East & Africa Raisins Market Share Comparison by Distribution Channel (2016-2032)
- List of Tables
- Table 1: Global Raisins Market Comparison by Nature (2016-2032)
- Table 2: Global Raisins Market Comparison by Type (2016-2032)
- Table 3: Global Raisins Market Comparison by End Use (2016-2032)
- Table 4: Global Raisins Market Comparison by Distribution Channel (2016-2032)
- Table 5: Global Raisins Market Revenue (US$ Mn) Comparison by Region (2016-2032)
- Table 6: Global Raisins Market Revenue (US$ Mn) (2016-2032)
- Table 7: Global Raisins Market Revenue (US$ Mn) Comparison by Region (2016-2032)
- Table 8: Global Raisins Market Revenue (US$ Mn) Comparison by Nature (2016-2032)
- Table 9: Global Raisins Market Revenue (US$ Mn) Comparison by Type (2016-2032)
- Table 10: Global Raisins Market Revenue (US$ Mn) Comparison by End Use (2016-2032)
- Table 11: Global Raisins Market Revenue (US$ Mn) Comparison by Distribution Channel (2016-2032)
- Table 12: Global Raisins Market Y-o-Y Growth Rate Comparison by Region (2016-2032)
- Table 13: Global Raisins Market Y-o-Y Growth Rate Comparison by Nature (2016-2032)
- Table 14: Global Raisins Market Y-o-Y Growth Rate Comparison by Type (2016-2032)
- Table 15: Global Raisins Market Y-o-Y Growth Rate Comparison by End Use (2016-2032)
- Table 16: Global Raisins Market Y-o-Y Growth Rate Comparison by Distribution Channel (2016-2032)
- Table 17: Global Raisins Market Share Comparison by Region (2016-2032)
- Table 18: Global Raisins Market Share Comparison by Nature (2016-2032)
- Table 19: Global Raisins Market Share Comparison by Type (2016-2032)
- Table 20: Global Raisins Market Share Comparison by End Use (2016-2032)
- Table 21: Global Raisins Market Share Comparison by Distribution Channel (2016-2032)
- Table 22: North America Raisins Market Comparison by Type (2016-2032)
- Table 23: North America Raisins Market Comparison by End Use (2016-2032)
- Table 24: North America Raisins Market Comparison by Distribution Channel (2016-2032)
- Table 25: North America Raisins Market Revenue (US$ Mn) Comparison by Country (2016-2032)
- Table 26: North America Raisins Market Revenue (US$ Mn) (2016-2032)
- Table 27: North America Raisins Market Revenue (US$ Mn) Comparison by Country (2016-2032)
- Table 28: North America Raisins Market Revenue (US$ Mn) Comparison by Nature (2016-2032)
- Table 29: North America Raisins Market Revenue (US$ Mn) Comparison by Type (2016-2032)
- Table 30: North America Raisins Market Revenue (US$ Mn) Comparison by End Use (2016-2032)
- Table 31: North America Raisins Market Revenue (US$ Mn) Comparison by Distribution Channel (2016-2032)
- Table 32: North America Raisins Market Y-o-Y Growth Rate Comparison by Country (2016-2032)
- Table 33: North America Raisins Market Y-o-Y Growth Rate Comparison by Nature (2016-2032)
- Table 34: North America Raisins Market Y-o-Y Growth Rate Comparison by Type (2016-2032)
- Table 35: North America Raisins Market Y-o-Y Growth Rate Comparison by End Use (2016-2032)
- Table 36: North America Raisins Market Y-o-Y Growth Rate Comparison by Distribution Channel (2016-2032)
- Table 37: North America Raisins Market Share Comparison by Country (2016-2032)
- Table 38: North America Raisins Market Share Comparison by Nature (2016-2032)
- Table 39: North America Raisins Market Share Comparison by Type (2016-2032)
- Table 40: North America Raisins Market Share Comparison by End Use (2016-2032)
- Table 41: North America Raisins Market Share Comparison by Distribution Channel (2016-2032)
- Table 42: Western Europe Raisins Market Comparison by Nature (2016-2032)
- Table 43: Western Europe Raisins Market Comparison by Type (2016-2032)
- Table 44: Western Europe Raisins Market Comparison by End Use (2016-2032)
- Table 45: Western Europe Raisins Market Comparison by Distribution Channel (2016-2032)
- Table 46: Western Europe Raisins Market Revenue (US$ Mn) Comparison by Country (2016-2032)
- Table 47: Western Europe Raisins Market Revenue (US$ Mn) (2016-2032)
- Table 48: Western Europe Raisins Market Revenue (US$ Mn) Comparison by Country (2016-2032)
- Table 49: Western Europe Raisins Market Revenue (US$ Mn) Comparison by Nature (2016-2032)
- Table 50: Western Europe Raisins Market Revenue (US$ Mn) Comparison by Type (2016-2032)
- Table 51: Western Europe Raisins Market Revenue (US$ Mn) Comparison by End Use (2016-2032)
- Table 52: Western Europe Raisins Market Revenue (US$ Mn) Comparison by Distribution Channel (2016-2032)
- Table 53: Western Europe Raisins Market Y-o-Y Growth Rate Comparison by Country (2016-2032)
- Table 54: Western Europe Raisins Market Y-o-Y Growth Rate Comparison by Nature (2016-2032)
- Table 55: Western Europe Raisins Market Y-o-Y Growth Rate Comparison by Type (2016-2032)
- Table 56: Western Europe Raisins Market Y-o-Y Growth Rate Comparison by End Use (2016-2032)
- Table 57: Western Europe Raisins Market Y-o-Y Growth Rate Comparison by Distribution Channel (2016-2032)
- Table 58: Western Europe Raisins Market Share Comparison by Country (2016-2032)
- Table 59: Western Europe Raisins Market Share Comparison by Nature (2016-2032)
- Table 60: Western Europe Raisins Market Share Comparison by Type (2016-2032)
- Table 61: Western Europe Raisins Market Share Comparison by End Use (2016-2032)
- Table 62: Western Europe Raisins Market Share Comparison by Distribution Channel (2016-2032)
- Table 63: Eastern Europe Raisins Market Comparison by Nature (2016-2032)
- Table 64: Eastern Europe Raisins Market Comparison by Type (2016-2032)
- Table 65: Eastern Europe Raisins Market Comparison by End Use (2016-2032)
- Table 66: Eastern Europe Raisins Market Comparison by Distribution Channel (2016-2032)
- Table 67: Eastern Europe Raisins Market Revenue (US$ Mn) Comparison by Country (2016-2032)
- Table 68: Eastern Europe Raisins Market Revenue (US$ Mn) (2016-2032)
- Table 69: Eastern Europe Raisins Market Revenue (US$ Mn) Comparison by Country (2016-2032)
- Table 70: Eastern Europe Raisins Market Revenue (US$ Mn) Comparison by Nature (2016-2032)
- Table 71: Eastern Europe Raisins Market Revenue (US$ Mn) Comparison by Type (2016-2032)
- Table 72: Eastern Europe Raisins Market Revenue (US$ Mn) Comparison by End Use (2016-2032)
- Table 73: Eastern Europe Raisins Market Revenue (US$ Mn) Comparison by Distribution Channel (2016-2032)
- Table 74: Eastern Europe Raisins Market Y-o-Y Growth Rate Comparison by Country (2016-2032)
- Table 75: Eastern Europe Raisins Market Y-o-Y Growth Rate Comparison by Nature (2016-2032)
- Table 76: Eastern Europe Raisins Market Y-o-Y Growth Rate Comparison by Type (2016-2032)
- Table 77: Eastern Europe Raisins Market Y-o-Y Growth Rate Comparison by End Use (2016-2032)
- Table 78: Eastern Europe Raisins Market Y-o-Y Growth Rate Comparison by Distribution Channel (2016-2032)
- Table 79: Eastern Europe Raisins Market Share Comparison by Country (2016-2032)
- Table 80: Eastern Europe Raisins Market Share Comparison by Nature (2016-2032)
- Table 81: Eastern Europe Raisins Market Share Comparison by Type (2016-2032)
- Table 82: Eastern Europe Raisins Market Share Comparison by End Use (2016-2032)
- Table 83: Eastern Europe Raisins Market Share Comparison by Distribution Channel (2016-2032)
- Table 84: APAC Raisins Market Comparison by Nature (2016-2032)
- Table 85: APAC Raisins Market Comparison by Type (2016-2032)
- Table 86: APAC Raisins Market Comparison by End Use (2016-2032)
- Table 87: APAC Raisins Market Comparison by Distribution Channel (2016-2032)
- Table 88: APAC Raisins Market Revenue (US$ Mn) Comparison by Country (2016-2032)
- Table 89: APAC Raisins Market Revenue (US$ Mn) (2016-2032)
- Table 90: APAC Raisins Market Revenue (US$ Mn) Comparison by Country (2016-2032)
- Table 91: APAC Raisins Market Revenue (US$ Mn) Comparison by Nature (2016-2032)
- Table 92: APAC Raisins Market Revenue (US$ Mn) Comparison by Type (2016-2032)
- Table 93: APAC Raisins Market Revenue (US$ Mn) Comparison by End Use (2016-2032)
- Table 94: APAC Raisins Market Revenue (US$ Mn) Comparison by Distribution Channel (2016-2032)
- Table 95: APAC Raisins Market Y-o-Y Growth Rate Comparison by Country (2016-2032)
- Table 96: APAC Raisins Market Y-o-Y Growth Rate Comparison by Nature (2016-2032)
- Table 97: APAC Raisins Market Y-o-Y Growth Rate Comparison by Type (2016-2032)
- Table 98: APAC Raisins Market Y-o-Y Growth Rate Comparison by End Use (2016-2032)
- Table 99: APAC Raisins Market Y-o-Y Growth Rate Comparison by Distribution Channel (2016-2032)
- Table 100: APAC Raisins Market Share Comparison by Country (2016-2032)
- Table 101: APAC Raisins Market Share Comparison by Nature (2016-2032)
- Table 102: APAC Raisins Market Share Comparison by Type (2016-2032)
- Table 103: APAC Raisins Market Share Comparison by End Use (2016-2032)
- Table 104: APAC Raisins Market Share Comparison by Distribution Channel (2016-2032)
- Table 105: Latin America Raisins Market Comparison by Nature (2016-2032)
- Table 106: Latin America Raisins Market Comparison by Type (2016-2032)
- Table 107: Latin America Raisins Market Comparison by End Use (2016-2032)
- Table 108: Latin America Raisins Market Comparison by Distribution Channel (2016-2032)
- Table 109: Latin America Raisins Market Revenue (US$ Mn) Comparison by Country (2016-2032)
- Table 110: Latin America Raisins Market Revenue (US$ Mn) (2016-2032)
- Table 111: Latin America Raisins Market Revenue (US$ Mn) Comparison by Country (2016-2032)
- Table 112: Latin America Raisins Market Revenue (US$ Mn) Comparison by Nature (2016-2032)
- Table 113: Latin America Raisins Market Revenue (US$ Mn) Comparison by Type (2016-2032)
- Table 114: Latin America Raisins Market Revenue (US$ Mn) Comparison by End Use (2016-2032)
- Table 115: Latin America Raisins Market Revenue (US$ Mn) Comparison by Distribution Channel (2016-2032)
- Table 116: Latin America Raisins Market Y-o-Y Growth Rate Comparison by Country (2016-2032)
- Table 117: Latin America Raisins Market Y-o-Y Growth Rate Comparison by Nature (2016-2032)
- Table 118: Latin America Raisins Market Y-o-Y Growth Rate Comparison by Type (2016-2032)
- Table 119: Latin America Raisins Market Y-o-Y Growth Rate Comparison by End Use (2016-2032)
- Table 120: Latin America Raisins Market Y-o-Y Growth Rate Comparison by Distribution Channel (2016-2032)
- Table 121: Latin America Raisins Market Share Comparison by Country (2016-2032)
- Table 122: Latin America Raisins Market Share Comparison by Nature (2016-2032)
- Table 123: Latin America Raisins Market Share Comparison by Type (2016-2032)
- Table 124: Latin America Raisins Market Share Comparison by End Use (2016-2032)
- Table 125: Latin America Raisins Market Share Comparison by Distribution Channel (2016-2032)
- Table 126: Middle East & Africa Raisins Market Comparison by Nature (2016-2032)
- Table 127: Middle East & Africa Raisins Market Comparison by Type (2016-2032)
- Table 128: Middle East & Africa Raisins Market Comparison by End Use (2016-2032)
- Table 129: Middle East & Africa Raisins Market Comparison by Distribution Channel (2016-2032)
- Table 130: Middle East & Africa Raisins Market Revenue (US$ Mn) Comparison by Country (2016-2032)
- Table 131: Middle East & Africa Raisins Market Revenue (US$ Mn) (2016-2032)
- Table 132: Middle East & Africa Raisins Market Revenue (US$ Mn) Comparison by Country (2016-2032)
- Table 133: Middle East & Africa Raisins Market Revenue (US$ Mn) Comparison by Nature (2016-2032)
- Table 134: Middle East & Africa Raisins Market Revenue (US$ Mn) Comparison by Type (2016-2032)
- Table 135: Middle East & Africa Raisins Market Revenue (US$ Mn) Comparison by End Use (2016-2032)
- Table 136: Middle East & Africa Raisins Market Revenue (US$ Mn) Comparison by Distribution Channel (2016-2032)
- Table 137: Middle East & Africa Raisins Market Y-o-Y Growth Rate Comparison by Country (2016-2032)
- Table 138: Middle East & Africa Raisins Market Y-o-Y Growth Rate Comparison by Nature (2016-2032)
- Table 139: Middle East & Africa Raisins Market Y-o-Y Growth Rate Comparison by Type (2016-2032)
- Table 140: Middle East & Africa Raisins Market Y-o-Y Growth Rate Comparison by End Use (2016-2032)
- Table 141: Middle East & Africa Raisins Market Y-o-Y Growth Rate Comparison by Distribution Channel (2016-2032)
- Table 142: Middle East & Africa Raisins Market Share Comparison by Country (2016-2032)
- Table 143: Middle East & Africa Raisins Market Share Comparison by Nature (2016-2032)
- Table 144: Middle East & Africa Raisins Market Share Comparison by Type (2016-2032)
- Table 145: Middle East & Africa Raisins Market Share Comparison by End Use (2016-2032)
- Table 146: Middle East & Africa Raisins Market Share Comparison by Distribution Channel (2016-2032)
- 1. Executive Summary
-
- Sunbeam Foods Pty Ltd.
- Traina Foods Inc.
- Lion Raisins Inc.
- Del Monte Foods, Inc.
- Dole Packed Foods LLC
- Sunsweet Growers Inc.
- JAB Dried Fruit Products (Pty) Ltd
- Sun-Maid Growers of California
- Bergin Fruit and Nut Company Inc.
- Decas Cranberry Products Inc.
- Ocean Spray Cranberries Inc.
- VKC Nuts Pvt Ltd.
- Other Key Industry Players
Our Clients


View Our Licence Options
