
Global Power Banks Market By Capacity Range(Up to 3,000 mAh, 3,001 mAh-8,000 mAh, 8,001 mAh-20,000 mAh , Above 20,000 mAh), By Energy Source(Electric, Solar), By Battery Type(Lithium-Ion, Lithium Polymer), By Distribution Channel(E-Commerce, Brick and Mortar), By Region And Companies - Industry Segment Outlook, Market Assessment, Competition Scenario, Trends, And Forecast 2024-2033
-
3692
-
July 2024
-
300
-


-
This report was compiled by Research Team Research team of over 50 passionate professionals leverages advanced research methodologies and analytical expertise to deliver insightful, data-driven market intelligence that empowers businesses across diverse industries to make strategic, well-informed Correspondence Research Team Linkedin | Detailed Market research Methodology Our methodology involves a mix of primary research, including interviews with leading mental health experts, and secondary research from reputable medical journals and databases. View Detailed Methodology Page
-
Quick Navigation
Report Overview
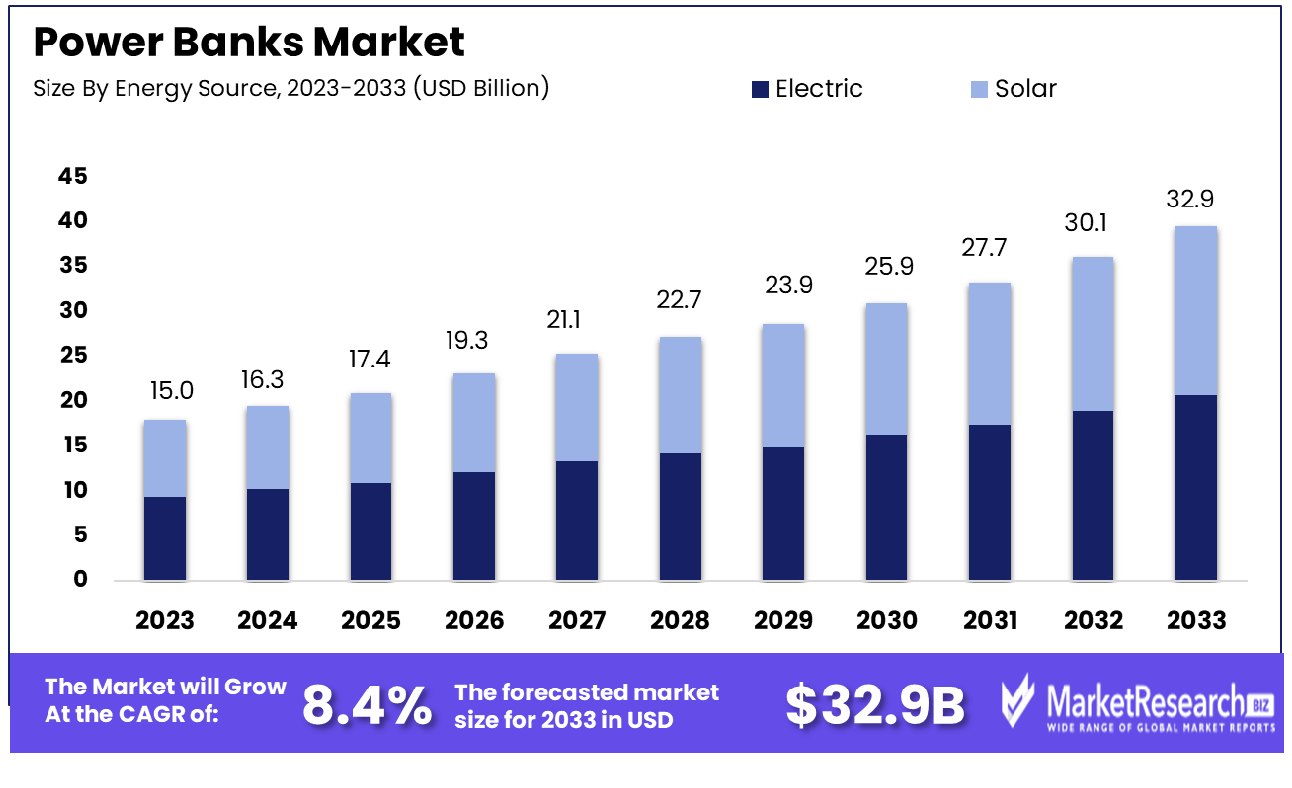
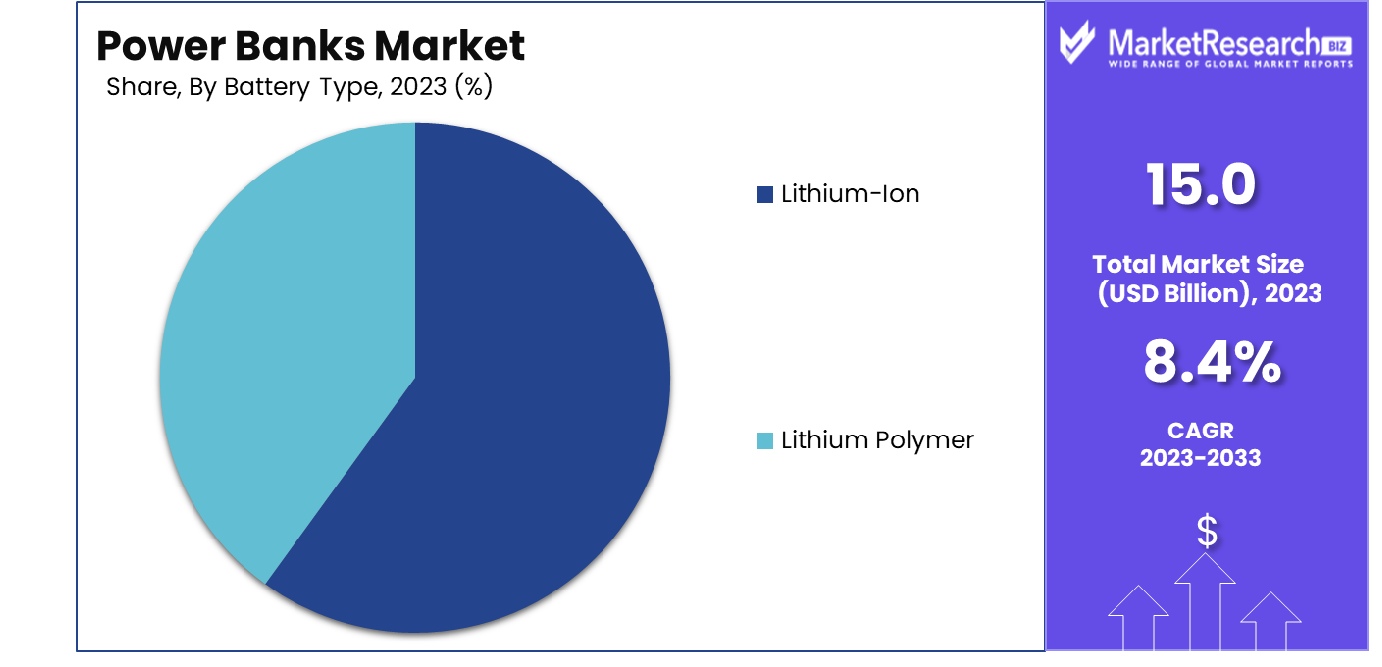
The Global Power Banks Market was valued at USD 15.0 billion in 2023. It is expected to reach USD 32.9 billion by 2033, with a CAGR of 8.4% during the forecast period from 2024 to 2033.
The Power Banks Market comprises enterprises engaged in the design, manufacturing, and distribution of portable energy storage solutions. These devices are crucial for charging mobile phones, tablets, and other electronic devices on the go, addressing the escalating demand for continuous power supply in today's fast-paced digital world. The market caters to a diverse consumer base, from individual consumers seeking convenience to professionals requiring reliable power backup.
As digital device usage proliferates, the market's relevance escalates, offering significant growth opportunities for businesses focusing on innovative, high-capacity, and environmentally friendly power solutions. Key stakeholders include technology providers, manufacturers, and marketing leaders who strategically position these indispensable tools in the global marketplace.
The global market for power banks is witnessing a significant surge, driven by the escalating demand for portable charging solutions amidst an increasingly mobile society. Power banks, as portable energy storage devices, offer a critical utility in ensuring connectivity and productivity, especially with the pervasive use of smartphones and other portable electronic devices. Capacities of these power banks vary considerably, generally ranging from about 3000 mAh, which typically provides a single charge, to more than 20,000 mAh, capable of recharging a device multiple times.
A typical 10,000 mAh power bank is engineered to recharge a 3000 mAh smartphone up to three times, while a more robust 20,000 mAh model can deliver over six full charges. However, it is essential to recognize that the actual capacity of power banks often does not match the claimed specifications. Practical usage suggests that the real-world capacity may be approximately 40% less than advertised, affecting the actual number of charges a device can receive. This discrepancy is a vital consideration for manufacturers and consumers alike, influencing product development and consumer expectations.
The market's dynamics are further molded by advancements in battery technology, the integration of smart features like fast charging, and the development of more compact and lightweight designs. As the industry evolves, the focus on enhancing the efficiency and capacity of power banks, along with sustainable manufacturing practices, will likely be pivotal in addressing the growing consumer demands and environmental considerations.
Key Takeaways
- Market Growth: The Global Power Banks Market was valued at USD 15.0 billion in 2023. It is expected to reach USD 32.9 billion by 2033, with a CAGR of 8.4% during the forecast period from 2024 to 2033.
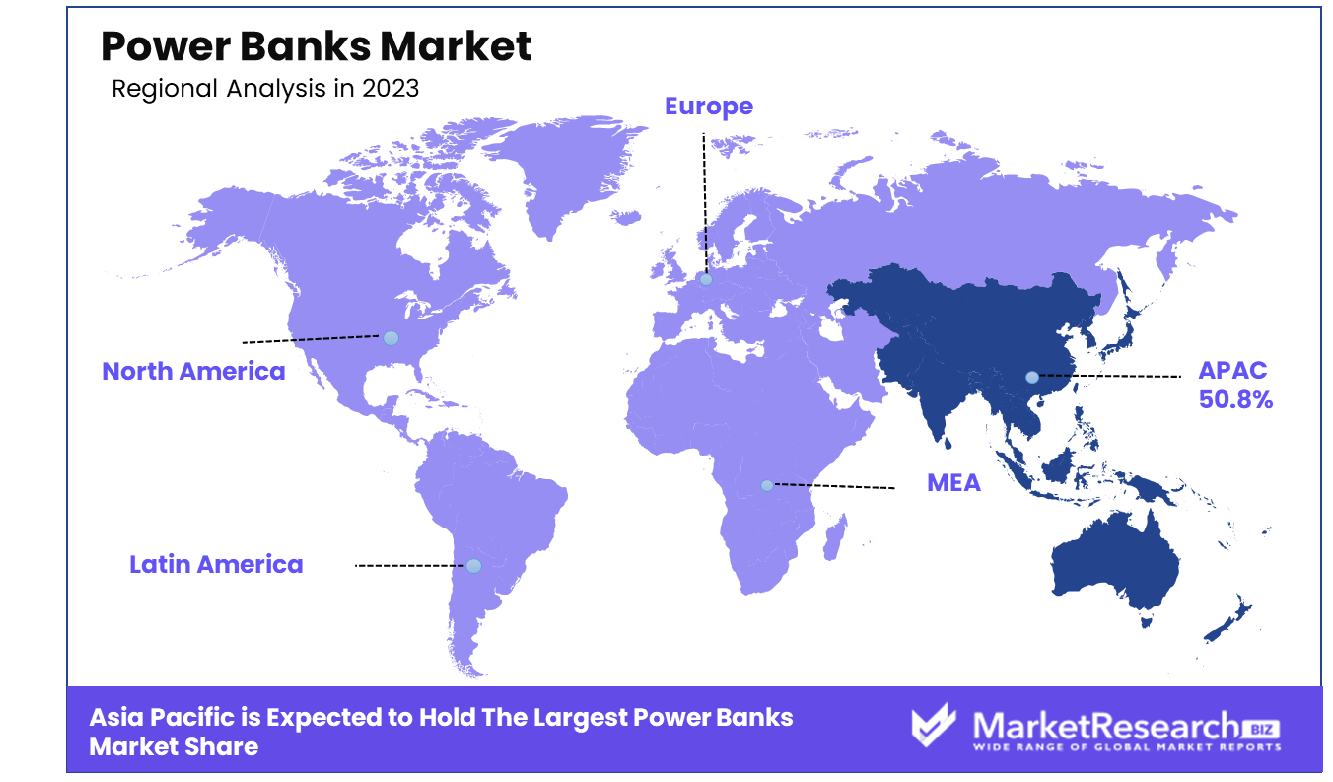
- Regional Dominance: Asia Pacific dominates the power banks market with a 50.8% market share.
- By Capacity Range: Power banks 8,001 mAh-20,000 mAh dominate with a 35.0% share.
- By Energy Source: Electric power banks dominate the market with a 72.8% share.
- By Battery Type: Lithium-ion batteries dominate the market with an 80.4% share.
- By Distribution Channel: E-commerce channels dominate power bank sales with a 52.9% market share.
Driving factors
Increased Usage of Electronic Devices
The growth of the Power Banks Market is primarily fueled by the increased usage of electronic devices such as smartphones and tablets. As these devices have become integral to daily life for communication, entertainment, and business, their constant use has led to a higher demand for extended battery life, particularly when charging stations are not available.
Statistics indicate a significant increase in smartphone penetration rates globally, with over 3.8 billion smartphone users worldwide, which directly correlates to the rising demand for power banks to ensure these devices remain operational throughout the day.
Rising Demand for Portable Power Solutions
Aligned with the increase in electronic device usage, there is a heightened demand for portable power solutions. Consumers seek convenient and efficient ways to charge devices on the go, which power banks provide. This demand is amplified by the modern lifestyle that requires high mobility and connectivity, regardless of location.
Power banks, ranging from small, pocket-sized devices to larger, high-capacity units, offer a range of power solutions that cater to different user needs, thus broadening their market appeal and driving market growth.
Growth in Outdoor Activities and Travel
The expansion of outdoor activities and travel has significantly contributed to the growth of the Power Banks Market. More individuals are engaging in outdoor pursuits such as hiking, camping, and long-distance travel, where access to power sources is limited.
This trend necessitates the use of power banks to keep electronic devices like GPS units, digital cameras, and smartphones charged in remote locations. The increased interest in travel and outdoor activities, especially post-pandemic, has led to a surge in demand for reliable and durable power banks, further propelling market growth.
Restraining Factors
Improvements in Battery Life of Electronic Devices
Advancements in the battery life of electronic devices such as smartphones and tablets have emerged as a significant restraining factor in the growth of the Power Banks Market. As manufacturers continue to enhance the efficiency and capacity of built-in batteries, the urgency and frequency of needing external charging solutions like power banks diminish.
For instance, the introduction of smartphones with batteries that can last more than a day on a single charge reduces the consumer's dependency on additional power sources, thus potentially slowing the market growth for power banks.
Issues Related to the Transportation and Shipping of Lithium-Ion Batteries
Regulatory challenges associated with the transportation and shipping of lithium-ion batteries pose another hurdle for the Power Banks Market. Due to safety concerns, such as the risk of thermal runaway and fires, strict regulations have been implemented globally that govern the shipping of lithium-ion batteries. These restrictions can increase logistical costs and complicate the supply chain for power bank manufacturers, ultimately impacting the market.
For example, airlines have specific guidelines and limitations on transporting lithium-ion batteries, which can discourage consumers from purchasing power banks for travel purposes, further restraining market expansion. Together, these factors necessitate ongoing innovation and adaptation within the industry to maintain market viability and growth.
By Capacity Range Analysis
8,001 mAh-20,000 mAh power banks dominated the market with a 35.0% share.
In 2023, 8,001 mAh-20,000 mAh held a dominant market position in the By Capacity Range segment of the Power Banks Market, capturing more than a 35.0% share. This significant market share is attributed to the rising demand for high-capacity power banks that offer extended battery life for multiple devices, catering to the increasing use of power-intensive applications and devices.
The Up to 3,000 mAh segment, although essential for lightweight and portable power solutions, accounted for a smaller market share. Its primary user base includes individuals seeking emergency power backups for low-power devices such as basic mobile phones and small electronic gadgets. However, this segment is constrained by its limited capacity, which has restricted its market growth compared to higher capacity segments.
The 3,001 mAh-8,000 mAh segment also plays a crucial role in the market, offering a balance between portability and capacity. This range is popular among consumers who need reliable power banks for daily use without the bulk of higher-capacity models. Despite its utility, it represented a moderate share of the market due to competition from both lower and higher-capacity power banks.
Above 20,000 mAh capacity power banks, while not the largest segment, have seen substantial growth due to their ability to charge multiple devices simultaneously and their suitability for heavy-duty applications, including outdoor activities and professional use. This segment is expected to grow as consumer awareness and the need for high-capacity, long-lasting power solutions increase.
Overall, the 8,001 mAh-20,000 mAh segment's dominance is driven by its optimal balance of capacity, portability, and consumer demand, reflecting broader trends in the market towards more versatile and reliable power solutions. The future growth trajectory of this segment is likely to be influenced by ongoing technological advancements and the evolving power needs of consumers globally.
By Energy Source Analysis
Electric power banks held a dominant position, accounting for 72.8% of the market.
In 2023, Electric held a dominant market position in the By Energy Source segment of the Power Banks Market, capturing more than a 72.8% share. This substantial market share is primarily driven by the widespread availability and reliability of electric power banks, which continue to meet the increasing consumer demand for efficient and convenient charging solutions.
The dominance of electric power banks is underpinned by several factors, including their relatively lower cost, faster charging capabilities, and widespread consumer familiarity. These power banks are equipped to handle the frequent charging requirements of modern electronic devices, such as smartphones, tablets, and laptops. The convenience of plugging into any standard electrical outlet for a quick recharge has cemented its status as the preferred choice among consumers.
In contrast, the Solar segment, while growing, accounted for a smaller share of the market. Solar power banks offer the advantage of harnessing renewable energy, making them an attractive option for environmentally conscious consumers and those in remote or off-grid locations. However, their market penetration remains limited due to higher costs, slower charging speeds, and dependence on weather conditions for optimal performance. Despite these challenges, there is a niche market for solar power banks among outdoor enthusiasts and professionals working in remote areas.
The future growth potential of the solar segment is promising, with increasing investments in solar technology and rising consumer awareness about sustainable energy solutions. Innovations in photovoltaic efficiency and hybrid models combining electric and solar charging capabilities are expected to enhance the appeal and functionality of solar power banks.
Overall, the Electric segment's dominance reflects the current consumer preference for reliability and convenience, while the Solar segment, though smaller, is positioned for growth driven by technological advancements and the global shift towards renewable energy sources. The ongoing evolution in consumer preferences and technological innovations will play a crucial role in shaping the future landscape of the Power Banks Market.
By Battery Type Analysis
Lithium-ion power banks dominated the market, representing 80.4% of total sales.
In 2023, Lithium-Ion held a dominant market position in the By Battery Type segment of the Power Banks Market, capturing more than an 80.4% share. This substantial market share underscores the widespread adoption and preference for Lithium-Ion batteries, driven by their superior energy density, longer life cycles, and cost-effectiveness.
Lithium-Ion batteries have become the industry standard for power banks due to their ability to provide high capacity in a compact form factor. Their widespread availability and established manufacturing processes contribute to lower production costs, making them an attractive option for both manufacturers and consumers. Additionally, the technological advancements in Lithium-Ion battery technology have further enhanced their performance, safety, and charging efficiency, reinforcing their dominance in the market.
On the other hand, the Lithium Polymer segment, while smaller, is gaining traction. Lithium Polymer batteries offer several advantages, including a lighter weight, flexible form factors, and enhanced safety features due to their solid electrolyte. These attributes make them particularly suitable for slim and portable power bank designs, appealing to consumers seeking sleek and lightweight charging solutions. Despite these benefits, the higher production costs and lower energy density compared to Lithium-Ion batteries have limited their market penetration.
The ongoing innovation in battery technology is expected to influence the future dynamics of the market. While Lithium-Ion batteries continue to lead, advancements in Lithium Polymer technology could bridge the gap in energy density and cost, potentially increasing their market share.
Overall, the dominance of Lithium-Ion batteries reflects their established market presence and continuous improvements in performance and affordability. Meanwhile, the Lithium Polymer segment, though currently smaller, is poised for growth as consumer demand for lightweight and portable power solutions increases. The interplay between these battery types will shape the competitive landscape of the Power Banks Market in the coming years.
By Distribution Channel Analysis
E-commerce platforms led the market, capturing a 52.9% share of sales.
In 2023, E-Commerce held a dominant market position in the By Distribution Channel segment of the Power Banks Market, capturing more than a 52.9% share. This commanding market share reflects the growing consumer preference for online shopping, driven by the convenience, variety, and competitive pricing offered by e-commerce platforms.
The prominence of E-Commerce in the power banks market is largely attributed to the expansive reach of online retailers and the ability to provide detailed product information, user reviews, and price comparisons. The digital shopping experience facilitates easy access to a wide range of power bank options from various brands, allowing consumers to make informed purchasing decisions without the constraints of geographical location or store hours. Additionally, promotional offers, discounts, and free shipping options available through online channels further enhance their appeal.
Conversely, the brick-and-mortar segment, while maintaining a significant presence, accounted for a smaller share of the market. Physical retail stores offer the advantage of immediate product access and the opportunity for consumers to physically inspect and test power banks before purchase. However, the constraints of store space, limited inventory, and regional availability have impeded their competitive edge compared to the extensive offerings and convenience of e-commerce.
Despite these limitations, brick-and-mortar stores continue to play a crucial role in the market, particularly for consumers who prioritize in-person shopping experiences or require immediate product availability. The synergy between online and physical retail channels is expected to continue, with many brick-and-mortar retailers enhancing their online presence to cater to a broader audience.
Overall, the dominance of E-Commerce in the Power Banks Market underscores the shifting consumer behavior towards digital purchasing, while brick-and-mortar stores remain relevant through their complementary role in providing immediate and tactile shopping experiences.
Key Market Segments
By Capacity Range
- Up to 3,000 mAh
- 3,001 mAh-8,000 mAh
- 8,001 mAh-20,000 mAh
- Above 20,000 mAh
By Energy Source
- Electric
- Solar
By Battery Type
- Lithium-Ion
- Lithium Polymer
By Distribution Channel
- E-Commerce
- Brick and Mortar
Growth Opportunity
Development of Solar-Powered and Eco-Friendly Power Banks
The development of solar-powered and eco-friendly power banks presents a substantial growth opportunity for the global Power Banks Market in 2023. As environmental concerns and the push for sustainable products intensify, consumers are increasingly seeking eco-friendly alternatives to traditional electronics. Solar-powered power banks offer a renewable energy source, allowing users to charge their devices without relying on the electrical grid.
This is particularly advantageous in regions with abundant sunlight and for outdoor enthusiasts who require a reliable power source in remote areas. The integration of sustainable materials and energy-efficient technologies in power bank manufacturing not only addresses environmental concerns but also appeals to the growing segment of eco-conscious consumers. This shift towards green technology is anticipated to drive significant market growth as companies innovate to meet these new demands.
Expansion into Emerging Markets with Rising Mobile Penetration
The expansion into emerging markets with rising mobile penetration represents another key growth opportunity for the global Power Banks Market in 2023. Emerging economies in regions such as Asia Pacific, Africa, and Latin America are experiencing rapid increases in smartphone adoption and mobile internet usage. For instance, countries like India, Indonesia, and Nigeria have seen a surge in mobile phone users, driven by improving network infrastructure and decreasing device costs.
Despite this growth, many areas still face challenges with reliable electricity access, creating a substantial demand for portable power solutions. Power banks provide an essential service in these markets, ensuring uninterrupted device usage. Companies that strategically enter and establish a presence in these regions can capitalize on the expanding consumer base, leveraging localized marketing and distribution strategies to maximize their market share. This approach not only boosts sales but also fosters brand loyalty and recognition in rapidly developing markets.
Latest Trends
Wireless Charging Power Banks
One of the most significant trends shaping the global Power Banks Market in 2023 is the proliferation of wireless charging power banks. As consumers increasingly demand convenience and efficiency in their electronic devices, the adoption of wireless charging technologies is accelerating. Wireless charging power banks eliminate the need for cables, offering a seamless and clutter-free charging experience. This trend is driven by advancements in Qi wireless charging standards and the growing compatibility of smartphones and other gadgets with wireless charging capabilities.
For instance, flagship models from leading smartphone manufacturers now often include wireless charging as a standard feature, thus promoting the use of wireless power banks. The convenience and flexibility of wireless charging power banks are likely to attract a broad range of consumers, from tech enthusiasts to casual users, thereby driving market growth.
Integration of Fast Charging Technology
The integration of fast charging technology into power banks is another key trend that is expected to significantly impact the market in 2023. Fast charging technology, such as Qualcomm's Quick Charge and USB Power Delivery (USB-PD), enables power banks to charge devices at a much quicker rate compared to traditional charging methods. This capability is particularly appealing in today's fast-paced environment, where consumers seek to minimize downtime and maximize productivity.
The demand for fast-charging power banks is further fueled by the increasing power requirements of modern devices, which often feature high-capacity batteries. Power banks that incorporate fast charging technology can significantly reduce charging times, offering a compelling value proposition to users who prioritize speed and efficiency. As more manufacturers adopt and refine fast-charging technologies, the power banks market is expected to see enhanced product offerings, greater consumer satisfaction, and robust growth.
Regional Analysis
Asia Pacific dominates the power banks market with a 50.8% share, driven by high smartphone usage.
The power banks market exhibits significant regional disparities, with Asia Pacific emerging as the dominant region, accounting for 50.8% of the global market share. This dominance is primarily driven by the high penetration of smartphones and the increasing need for portable charging solutions in countries such as China, India, and Japan. China's substantial electronics manufacturing base and the high consumer demand for advanced mobile accessories further bolster the region's leading position.
In North America, the market is propelled by the high adoption rate of electronic devices and the growing trend of remote working, which necessitates reliable power sources. The United States, in particular, contributes a substantial share due to its robust technological infrastructure and high disposable income levels.
Europe also holds a significant market share, driven by the rising usage of electronic gadgets and the presence of major market players such as Anker Innovations and Xtorm. Countries like Germany and the UK are at the forefront due to their strong technological ecosystems and increasing consumer inclination towards mobile accessories. In the Middle East & Africa, the market is gradually expanding, driven by the increasing urbanization and smartphone penetration in countries like the UAE and South Africa. The region's market growth is also supported by improving economic conditions and a rising middle-class population.
Latin America showcases moderate growth, influenced by the expanding consumer electronics market in countries like Brazil and Mexico. The increasing availability of low-cost smartphones and the growing tech-savvy population in these countries are significant drivers of market expansion. Overall, while Asia Pacific dominates the power banks market, other regions are also contributing substantially, each with unique growth drivers and market dynamics.
Key Regions and Countries
North America
- The US
- Canada
- Rest of North America
Europe
- Germany
- France
- The UK
- Spain
- Netherlands
- Russia
- Italy
- Rest of Europe
Asia-Pacific
- China
- Japan
- Singapore
- Thailand
- South Korea
- Vietnam
- India
- New Zealand
- Rest of Asia Pacific
Latin America
- Mexico
- Brazil
- Rest of Latin America
Middle East & Africa
- Saudi Arabia
- South Africa
- UAE
- Rest of Middle East & Africa
Key Players Analysis
The global power banks market in 2023 is significantly influenced by several key players, each contributing uniquely to market dynamics. Ambrane India Private Ltd. continues to leverage its stronghold in the Indian market, focusing on affordable yet high-quality power banks, which cater to the price-sensitive yet growing tech-savvy consumer base in the region. Anker Technology Co. Ltd., known for its innovative and high-capacity power banks, maintains its market leadership through continuous product innovation and robust global distribution channels.
ASUSTeK Computer Inc. utilizes its extensive experience in the electronics sector to offer technologically advanced power banks, integrating features like fast charging and high energy density, appealing to both consumer and commercial segments. Beijing Xiaomi Technology Co., Ltd., with its aggressive pricing strategy and strong online presence, captures a significant market share by targeting young and tech-savvy consumers globally, particularly in Asia Pacific.
Intex Technologies, a notable player in the Indian market, focuses on budget-friendly power banks with substantial battery life, catering to a diverse customer base in emerging markets. Lenovo Group Ltd. leverages its brand reputation and extensive distribution network to offer reliable power banks, enhancing its portfolio in the mobile accessories market. Microsoft Corporation, although primarily known for software, capitalizes on its strong brand image to promote its power bank offerings, focusing on seamless compatibility with its other hardware products.
Panasonic Corporation brings its expertise in battery technology to the power banks market, ensuring high safety standards and energy efficiency, which is crucial for gaining consumer trust. Samsung SDI Co., Ltd. emphasizes innovation and quality, integrating advanced battery technologies that offer high capacity and fast charging solutions. Lastly, Sony Corporation remains a key player by offering premium power banks, renowned for their reliability, durability, and cutting-edge technology.
Market Key Players
- Ambrane India Private Ltd.
- Anker Technology Co. Ltd.
- ASUSTeK Computer Inc.
- Beijing Xiaomi Technology Co., Ltd.
- Intex Technologies
- Lenovo Group Ltd.
- Microsoft Corporation
- Panasonic Corporation
- Samsung SDI Co., Ltd.
- Sony Corporation
Recent Development
- In June 2024, Ambrane India Private Ltd launched a new line of solar-powered power banks, reflecting a commitment to eco-friendly technology. This launch aligns with the growing consumer interest in sustainable electronics.
- In May 2024, Beijing Xiaomi Technology Co., Ltd. invested $50 million in a new manufacturing facility to double their production capacity of power banks. This expansion aims to cater to the increasing global demand for mobile charging solutions.
- In April 2024, Intex Technologies launched an innovative power bank in April 2024 that integrates wireless charging capabilities, allowing users to charge devices without the need for cables. This product addresses the growing consumer demand for convenience and minimalism in technology.
Report Scope
Report Features Description Market Value (2023) USD 15.0 Billion Forecast Revenue (2033) USD 32.9 Billion CAGR (2024-2032) 8.4% Base Year for Estimation 2023 Historic Period 2016-2023 Forecast Period 2024-2033 Report Coverage Revenue Forecast, Market Dynamics, COVID-19 Impact, Competitive Landscape, Recent Developments Segments Covered By Capacity Range(Up to 3,000 mAh, 3,001 mAh-8,000 mAh, 8,001 mAh-20,000 mAh , Above 20,000 mAh), By Energy Source(Electric, Solar), By Battery Type(Lithium-Ion, Lithium Polymer), By Distribution Channel(E-Commerce, Brick and Mortar) Regional Analysis North America - The US, Canada, Rest of North America, Europe - Germany, France, The UK, Spain, Italy, Russia, Netherlands, Rest of Europe, Asia-Pacific - China, Japan, South Korea, India, New Zealand, Singapore, Thailand, Vietnam, Rest of Asia Pacific, Latin America - Brazil, Mexico, Rest of Latin America, Middle East & Africa - South Africa, Saudi Arabia, UAE, Rest of Middle East & Africa Competitive Landscape Ambrane India Private Ltd., Anker Technology Co. Ltd., ASUSTeK Computer Inc., Beijing Xiaomi Technology Co., Ltd., Intex Technologies, Lenovo Group Ltd., Microsoft Corporation, Panasonic Corporation, Samsung SDI Co., Ltd., Sony Corporation Customization Scope Customization for segments, region/country-level will be provided. Moreover, additional customization can be done based on the requirements. Purchase Options We have three licenses to opt for Single User License, Multi-User License (Up to 5 Users), Corporate Use License (Unlimited User and Printable PDF) -
- 1. Executive Summary
- 1.1. Definition
- 1.2. Taxonomy
- 1.3. Research Scope
- 1.4. Key Analysis
- 1.5. Key Findings by Major Segments
- 1.6. Top strategies by Major Players
- 2. Global Power Banks Market Overview
- 2.1. Power Banks Market Dynamics
- 2.1.1. Drivers
- 2.1.2. Opportunities
- 2.1.3. Restraints
- 2.1.4. Challenges
- 2.2. Macro-economic Factors
- 2.3. Regulatory Framework
- 2.4. Market Investment Feasibility Index
- 2.5. PEST Analysis
- 2.6. PORTER’S Five Force Analysis
- 2.7. Drivers & Restraints Impact Analysis
- 2.8. Industry Chain Analysis
- 2.9. Cost Structure Analysis
- 2.10. Marketing Strategy
- 2.11. Russia-Ukraine War Impact Analysis
- 2.12. Opportunity Map Analysis
- 2.13. Market Competition Scenario Analysis
- 2.14. Product Life Cycle Analysis
- 2.15. Opportunity Orbits
- 2.16. Manufacturer Intensity Map
- 2.17. Major Companies sales by Value & Volume
- 2.1. Power Banks Market Dynamics
- 3. Global Power Banks Market Analysis, Opportunity and Forecast, 2016-2032
- 3.1. Global Power Banks Market Analysis, 2016-2021
- 3.2. Global Power Banks Market Opportunity and Forecast, 2023-2032
- 3.3. Global Power Banks Market Analysis, Opportunity and Forecast, By By Capacity Range , 2016-2032
- 3.3.1. Global Power Banks Market Analysis by By Capacity Range : Introduction
- 3.3.2. Market Size Absolute $ Opportunity Analysis and Forecast, By By Capacity Range , 2016-2032
- 3.3.3. Up to 3,000 mAh
- 3.3.4. 3,001 mAh-8,000 mAh
- 3.3.5. 8,001 mAh-20,000 mAh
- 3.3.6. Above 20,000 mAh
- 3.4. Global Power Banks Market Analysis, Opportunity and Forecast, By By Energy Source , 2016-2032
- 3.4.1. Global Power Banks Market Analysis by By Energy Source : Introduction
- 3.4.2. Market Size Absolute $ Opportunity Analysis and Forecast, By By Energy Source , 2016-2032
- 3.4.3. Electric
- 3.4.4. Solar
- 3.5. Global Power Banks Market Analysis, Opportunity and Forecast, By By Battery Type , 2016-2032
- 3.5.1. Global Power Banks Market Analysis by By Battery Type : Introduction
- 3.5.2. Market Size Absolute $ Opportunity Analysis and Forecast, By By Battery Type , 2016-2032
- 3.5.3. Lithium-Ion
- 3.5.4. Lithium Polymer
- 3.6. Global Power Banks Market Analysis, Opportunity and Forecast, By By Distribution Channel , 2016-2032
- 3.6.1. Global Power Banks Market Analysis by By Distribution Channel : Introduction
- 3.6.2. Market Size Absolute $ Opportunity Analysis and Forecast, By By Distribution Channel , 2016-2032
- 3.6.3. E-Commerce
- 3.6.4. Brick and Mortar
- 4. North America Power Banks Market Analysis, Opportunity and Forecast, 2016-2032
- 4.1. North America Power Banks Market Analysis, 2016-2021
- 4.2. North America Power Banks Market Opportunity and Forecast, 2023-2032
- 4.3. North America Power Banks Market Analysis, Opportunity and Forecast, By By Capacity Range , 2016-2032
- 4.3.1. North America Power Banks Market Analysis by By Capacity Range : Introduction
- 4.3.2. Market Size Absolute $ Opportunity Analysis and Forecast, By By Capacity Range , 2016-2032
- 4.3.3. Up to 3,000 mAh
- 4.3.4. 3,001 mAh-8,000 mAh
- 4.3.5. 8,001 mAh-20,000 mAh
- 4.3.6. Above 20,000 mAh
- 4.4. North America Power Banks Market Analysis, Opportunity and Forecast, By By Energy Source , 2016-2032
- 4.4.1. North America Power Banks Market Analysis by By Energy Source : Introduction
- 4.4.2. Market Size Absolute $ Opportunity Analysis and Forecast, By By Energy Source , 2016-2032
- 4.4.3. Electric
- 4.4.4. Solar
- 4.5. North America Power Banks Market Analysis, Opportunity and Forecast, By By Battery Type , 2016-2032
- 4.5.1. North America Power Banks Market Analysis by By Battery Type : Introduction
- 4.5.2. Market Size Absolute $ Opportunity Analysis and Forecast, By By Battery Type , 2016-2032
- 4.5.3. Lithium-Ion
- 4.5.4. Lithium Polymer
- 4.6. North America Power Banks Market Analysis, Opportunity and Forecast, By By Distribution Channel , 2016-2032
- 4.6.1. North America Power Banks Market Analysis by By Distribution Channel : Introduction
- 4.6.2. Market Size Absolute $ Opportunity Analysis and Forecast, By By Distribution Channel , 2016-2032
- 4.6.3. E-Commerce
- 4.6.4. Brick and Mortar
- 4.7. North America Power Banks Market Analysis, Opportunity and Forecast, By Country , 2016-2032
- 4.7.1. North America Power Banks Market Analysis by Country : Introduction
- 4.7.2. Market Size Absolute $ Opportunity Analysis and Forecast, Country , 2016-2032
- 4.7.2.1. The US
- 4.7.2.2. Canada
- 4.7.2.3. Mexico
- 5. Western Europe Power Banks Market Analysis, Opportunity and Forecast, 2016-2032
- 5.1. Western Europe Power Banks Market Analysis, 2016-2021
- 5.2. Western Europe Power Banks Market Opportunity and Forecast, 2023-2032
- 5.3. Western Europe Power Banks Market Analysis, Opportunity and Forecast, By By Capacity Range , 2016-2032
- 5.3.1. Western Europe Power Banks Market Analysis by By Capacity Range : Introduction
- 5.3.2. Market Size Absolute $ Opportunity Analysis and Forecast, By By Capacity Range , 2016-2032
- 5.3.3. Up to 3,000 mAh
- 5.3.4. 3,001 mAh-8,000 mAh
- 5.3.5. 8,001 mAh-20,000 mAh
- 5.3.6. Above 20,000 mAh
- 5.4. Western Europe Power Banks Market Analysis, Opportunity and Forecast, By By Energy Source , 2016-2032
- 5.4.1. Western Europe Power Banks Market Analysis by By Energy Source : Introduction
- 5.4.2. Market Size Absolute $ Opportunity Analysis and Forecast, By By Energy Source , 2016-2032
- 5.4.3. Electric
- 5.4.4. Solar
- 5.5. Western Europe Power Banks Market Analysis, Opportunity and Forecast, By By Battery Type , 2016-2032
- 5.5.1. Western Europe Power Banks Market Analysis by By Battery Type : Introduction
- 5.5.2. Market Size Absolute $ Opportunity Analysis and Forecast, By By Battery Type , 2016-2032
- 5.5.3. Lithium-Ion
- 5.5.4. Lithium Polymer
- 5.6. Western Europe Power Banks Market Analysis, Opportunity and Forecast, By By Distribution Channel , 2016-2032
- 5.6.1. Western Europe Power Banks Market Analysis by By Distribution Channel : Introduction
- 5.6.2. Market Size Absolute $ Opportunity Analysis and Forecast, By By Distribution Channel , 2016-2032
- 5.6.3. E-Commerce
- 5.6.4. Brick and Mortar
- 5.7. Western Europe Power Banks Market Analysis, Opportunity and Forecast, By Country , 2016-2032
- 5.7.1. Western Europe Power Banks Market Analysis by Country : Introduction
- 5.7.2. Market Size Absolute $ Opportunity Analysis and Forecast, Country , 2016-2032
- 5.7.2.1. Germany
- 5.7.2.2. France
- 5.7.2.3. The UK
- 5.7.2.4. Spain
- 5.7.2.5. Italy
- 5.7.2.6. Portugal
- 5.7.2.7. Ireland
- 5.7.2.8. Austria
- 5.7.2.9. Switzerland
- 5.7.2.10. Benelux
- 5.7.2.11. Nordic
- 5.7.2.12. Rest of Western Europe
- 6. Eastern Europe Power Banks Market Analysis, Opportunity and Forecast, 2016-2032
- 6.1. Eastern Europe Power Banks Market Analysis, 2016-2021
- 6.2. Eastern Europe Power Banks Market Opportunity and Forecast, 2023-2032
- 6.3. Eastern Europe Power Banks Market Analysis, Opportunity and Forecast, By By Capacity Range , 2016-2032
- 6.3.1. Eastern Europe Power Banks Market Analysis by By Capacity Range : Introduction
- 6.3.2. Market Size Absolute $ Opportunity Analysis and Forecast, By By Capacity Range , 2016-2032
- 6.3.3. Up to 3,000 mAh
- 6.3.4. 3,001 mAh-8,000 mAh
- 6.3.5. 8,001 mAh-20,000 mAh
- 6.3.6. Above 20,000 mAh
- 6.4. Eastern Europe Power Banks Market Analysis, Opportunity and Forecast, By By Energy Source , 2016-2032
- 6.4.1. Eastern Europe Power Banks Market Analysis by By Energy Source : Introduction
- 6.4.2. Market Size Absolute $ Opportunity Analysis and Forecast, By By Energy Source , 2016-2032
- 6.4.3. Electric
- 6.4.4. Solar
- 6.5. Eastern Europe Power Banks Market Analysis, Opportunity and Forecast, By By Battery Type , 2016-2032
- 6.5.1. Eastern Europe Power Banks Market Analysis by By Battery Type : Introduction
- 6.5.2. Market Size Absolute $ Opportunity Analysis and Forecast, By By Battery Type , 2016-2032
- 6.5.3. Lithium-Ion
- 6.5.4. Lithium Polymer
- 6.6. Eastern Europe Power Banks Market Analysis, Opportunity and Forecast, By By Distribution Channel , 2016-2032
- 6.6.1. Eastern Europe Power Banks Market Analysis by By Distribution Channel : Introduction
- 6.6.2. Market Size Absolute $ Opportunity Analysis and Forecast, By By Distribution Channel , 2016-2032
- 6.6.3. E-Commerce
- 6.6.4. Brick and Mortar
- 6.7. Eastern Europe Power Banks Market Analysis, Opportunity and Forecast, By Country , 2016-2032
- 6.7.1. Eastern Europe Power Banks Market Analysis by Country : Introduction
- 6.7.2. Market Size Absolute $ Opportunity Analysis and Forecast, Country , 2016-2032
- 6.7.2.1. Russia
- 6.7.2.2. Poland
- 6.7.2.3. The Czech Republic
- 6.7.2.4. Greece
- 6.7.2.5. Rest of Eastern Europe
- 7. APAC Power Banks Market Analysis, Opportunity and Forecast, 2016-2032
- 7.1. APAC Power Banks Market Analysis, 2016-2021
- 7.2. APAC Power Banks Market Opportunity and Forecast, 2023-2032
- 7.3. APAC Power Banks Market Analysis, Opportunity and Forecast, By By Capacity Range , 2016-2032
- 7.3.1. APAC Power Banks Market Analysis by By Capacity Range : Introduction
- 7.3.2. Market Size Absolute $ Opportunity Analysis and Forecast, By By Capacity Range , 2016-2032
- 7.3.3. Up to 3,000 mAh
- 7.3.4. 3,001 mAh-8,000 mAh
- 7.3.5. 8,001 mAh-20,000 mAh
- 7.3.6. Above 20,000 mAh
- 7.4. APAC Power Banks Market Analysis, Opportunity and Forecast, By By Energy Source , 2016-2032
- 7.4.1. APAC Power Banks Market Analysis by By Energy Source : Introduction
- 7.4.2. Market Size Absolute $ Opportunity Analysis and Forecast, By By Energy Source , 2016-2032
- 7.4.3. Electric
- 7.4.4. Solar
- 7.5. APAC Power Banks Market Analysis, Opportunity and Forecast, By By Battery Type , 2016-2032
- 7.5.1. APAC Power Banks Market Analysis by By Battery Type : Introduction
- 7.5.2. Market Size Absolute $ Opportunity Analysis and Forecast, By By Battery Type , 2016-2032
- 7.5.3. Lithium-Ion
- 7.5.4. Lithium Polymer
- 7.6. APAC Power Banks Market Analysis, Opportunity and Forecast, By By Distribution Channel , 2016-2032
- 7.6.1. APAC Power Banks Market Analysis by By Distribution Channel : Introduction
- 7.6.2. Market Size Absolute $ Opportunity Analysis and Forecast, By By Distribution Channel , 2016-2032
- 7.6.3. E-Commerce
- 7.6.4. Brick and Mortar
- 7.7. APAC Power Banks Market Analysis, Opportunity and Forecast, By Country , 2016-2032
- 7.7.1. APAC Power Banks Market Analysis by Country : Introduction
- 7.7.2. Market Size Absolute $ Opportunity Analysis and Forecast, Country , 2016-2032
- 7.7.2.1. China
- 7.7.2.2. Japan
- 7.7.2.3. South Korea
- 7.7.2.4. India
- 7.7.2.5. Australia & New Zeland
- 7.7.2.6. Indonesia
- 7.7.2.7. Malaysia
- 7.7.2.8. Philippines
- 7.7.2.9. Singapore
- 7.7.2.10. Thailand
- 7.7.2.11. Vietnam
- 7.7.2.12. Rest of APAC
- 8. Latin America Power Banks Market Analysis, Opportunity and Forecast, 2016-2032
- 8.1. Latin America Power Banks Market Analysis, 2016-2021
- 8.2. Latin America Power Banks Market Opportunity and Forecast, 2023-2032
- 8.3. Latin America Power Banks Market Analysis, Opportunity and Forecast, By By Capacity Range , 2016-2032
- 8.3.1. Latin America Power Banks Market Analysis by By Capacity Range : Introduction
- 8.3.2. Market Size Absolute $ Opportunity Analysis and Forecast, By By Capacity Range , 2016-2032
- 8.3.3. Up to 3,000 mAh
- 8.3.4. 3,001 mAh-8,000 mAh
- 8.3.5. 8,001 mAh-20,000 mAh
- 8.3.6. Above 20,000 mAh
- 8.4. Latin America Power Banks Market Analysis, Opportunity and Forecast, By By Energy Source , 2016-2032
- 8.4.1. Latin America Power Banks Market Analysis by By Energy Source : Introduction
- 8.4.2. Market Size Absolute $ Opportunity Analysis and Forecast, By By Energy Source , 2016-2032
- 8.4.3. Electric
- 8.4.4. Solar
- 8.5. Latin America Power Banks Market Analysis, Opportunity and Forecast, By By Battery Type , 2016-2032
- 8.5.1. Latin America Power Banks Market Analysis by By Battery Type : Introduction
- 8.5.2. Market Size Absolute $ Opportunity Analysis and Forecast, By By Battery Type , 2016-2032
- 8.5.3. Lithium-Ion
- 8.5.4. Lithium Polymer
- 8.6. Latin America Power Banks Market Analysis, Opportunity and Forecast, By By Distribution Channel , 2016-2032
- 8.6.1. Latin America Power Banks Market Analysis by By Distribution Channel : Introduction
- 8.6.2. Market Size Absolute $ Opportunity Analysis and Forecast, By By Distribution Channel , 2016-2032
- 8.6.3. E-Commerce
- 8.6.4. Brick and Mortar
- 8.7. Latin America Power Banks Market Analysis, Opportunity and Forecast, By Country , 2016-2032
- 8.7.1. Latin America Power Banks Market Analysis by Country : Introduction
- 8.7.2. Market Size Absolute $ Opportunity Analysis and Forecast, Country , 2016-2032
- 8.7.2.1. Brazil
- 8.7.2.2. Colombia
- 8.7.2.3. Chile
- 8.7.2.4. Argentina
- 8.7.2.5. Costa Rica
- 8.7.2.6. Rest of Latin America
- 9. Middle East & Africa Power Banks Market Analysis, Opportunity and Forecast, 2016-2032
- 9.1. Middle East & Africa Power Banks Market Analysis, 2016-2021
- 9.2. Middle East & Africa Power Banks Market Opportunity and Forecast, 2023-2032
- 9.3. Middle East & Africa Power Banks Market Analysis, Opportunity and Forecast, By By Capacity Range , 2016-2032
- 9.3.1. Middle East & Africa Power Banks Market Analysis by By Capacity Range : Introduction
- 9.3.2. Market Size Absolute $ Opportunity Analysis and Forecast, By By Capacity Range , 2016-2032
- 9.3.3. Up to 3,000 mAh
- 9.3.4. 3,001 mAh-8,000 mAh
- 9.3.5. 8,001 mAh-20,000 mAh
- 9.3.6. Above 20,000 mAh
- 9.4. Middle East & Africa Power Banks Market Analysis, Opportunity and Forecast, By By Energy Source , 2016-2032
- 9.4.1. Middle East & Africa Power Banks Market Analysis by By Energy Source : Introduction
- 9.4.2. Market Size Absolute $ Opportunity Analysis and Forecast, By By Energy Source , 2016-2032
- 9.4.3. Electric
- 9.4.4. Solar
- 9.5. Middle East & Africa Power Banks Market Analysis, Opportunity and Forecast, By By Battery Type , 2016-2032
- 9.5.1. Middle East & Africa Power Banks Market Analysis by By Battery Type : Introduction
- 9.5.2. Market Size Absolute $ Opportunity Analysis and Forecast, By By Battery Type , 2016-2032
- 9.5.3. Lithium-Ion
- 9.5.4. Lithium Polymer
- 9.6. Middle East & Africa Power Banks Market Analysis, Opportunity and Forecast, By By Distribution Channel , 2016-2032
- 9.6.1. Middle East & Africa Power Banks Market Analysis by By Distribution Channel : Introduction
- 9.6.2. Market Size Absolute $ Opportunity Analysis and Forecast, By By Distribution Channel , 2016-2032
- 9.6.3. E-Commerce
- 9.6.4. Brick and Mortar
- 9.7. Middle East & Africa Power Banks Market Analysis, Opportunity and Forecast, By Country , 2016-2032
- 9.7.1. Middle East & Africa Power Banks Market Analysis by Country : Introduction
- 9.7.2. Market Size Absolute $ Opportunity Analysis and Forecast, Country , 2016-2032
- 9.7.2.1. Algeria
- 9.7.2.2. Egypt
- 9.7.2.3. Israel
- 9.7.2.4. Kuwait
- 9.7.2.5. Nigeria
- 9.7.2.6. Saudi Arabia
- 9.7.2.7. South Africa
- 9.7.2.8. Turkey
- 9.7.2.9. The UAE
- 9.7.2.10. Rest of MEA
- 10. Global Power Banks Market Analysis, Opportunity and Forecast, By Region , 2016-2032
- 10.1. Global Power Banks Market Analysis by Region : Introduction
- 10.2. Market Size Absolute $ Opportunity Analysis and Forecast, By Region , 2016-2032
- 10.2.1. North America
- 10.2.2. Western Europe
- 10.2.3. Eastern Europe
- 10.2.4. APAC
- 10.2.5. Latin America
- 10.2.6. Middle East & Africa
- 11. Global Power Banks Market Competitive Landscape, Market Share Analysis, and Company Profiles
- 11.1. Market Share Analysis
- 11.2. Company Profiles
- 11.3. Ambrane India Private Ltd.
- 11.3.1. Company Overview
- 11.3.2. Financial Highlights
- 11.3.3. Product Portfolio
- 11.3.4. SWOT Analysis
- 11.3.5. Key Strategies and Developments
- 11.4. Anker Technology Co. Ltd.
- 11.4.1. Company Overview
- 11.4.2. Financial Highlights
- 11.4.3. Product Portfolio
- 11.4.4. SWOT Analysis
- 11.4.5. Key Strategies and Developments
- 11.5. ASUSTeK Computer Inc.
- 11.5.1. Company Overview
- 11.5.2. Financial Highlights
- 11.5.3. Product Portfolio
- 11.5.4. SWOT Analysis
- 11.5.5. Key Strategies and Developments
- 11.6. Beijing Xiaomi Technology Co., Ltd.
- 11.6.1. Company Overview
- 11.6.2. Financial Highlights
- 11.6.3. Product Portfolio
- 11.6.4. SWOT Analysis
- 11.6.5. Key Strategies and Developments
- 11.7. Intex Technologies
- 11.7.1. Company Overview
- 11.7.2. Financial Highlights
- 11.7.3. Product Portfolio
- 11.7.4. SWOT Analysis
- 11.7.5. Key Strategies and Developments
- 11.8. Lenovo Group Ltd.
- 11.8.1. Company Overview
- 11.8.2. Financial Highlights
- 11.8.3. Product Portfolio
- 11.8.4. SWOT Analysis
- 11.8.5. Key Strategies and Developments
- 11.9. Microsoft Corporation
- 11.9.1. Company Overview
- 11.9.2. Financial Highlights
- 11.9.3. Product Portfolio
- 11.9.4. SWOT Analysis
- 11.9.5. Key Strategies and Developments
- 11.10. Panasonic Corporation
- 11.10.1. Company Overview
- 11.10.2. Financial Highlights
- 11.10.3. Product Portfolio
- 11.10.4. SWOT Analysis
- 11.10.5. Key Strategies and Developments
- 11.11. Samsung SDI Co., Ltd.
- 11.11.1. Company Overview
- 11.11.2. Financial Highlights
- 11.11.3. Product Portfolio
- 11.11.4. SWOT Analysis
- 11.11.5. Key Strategies and Developments
- 11.12. Sony Corporation
- 11.12.1. Company Overview
- 11.12.2. Financial Highlights
- 11.12.3. Product Portfolio
- 11.12.4. SWOT Analysis
- 11.12.5. Key Strategies and Developments
- 11.13.1. Company Overview
- 11.13.2. Financial Highlights
- 11.13.3. Product Portfolio
- 11.13.4. SWOT Analysis
- 11.13.5. Key Strategies and Developments
- 12. Assumptions and Acronyms
- 13. Research Methodology
- 14. Contact
"
- List of Figures
- "
- Figure 1: Global Power Banks Market Revenue (US$ Mn) Market Share by By Capacity Range in 2022
- Figure 2: Global Power Banks Market Market Attractiveness Analysis by By Capacity Range , 2016-2032
- Figure 3: Global Power Banks Market Revenue (US$ Mn) Market Share by By Energy Source in 2022
- Figure 4: Global Power Banks Market Market Attractiveness Analysis by By Energy Source , 2016-2032
- Figure 5: Global Power Banks Market Revenue (US$ Mn) Market Share by By Battery Type in 2022
- Figure 6: Global Power Banks Market Market Attractiveness Analysis by By Battery Type , 2016-2032
- Figure 7: Global Power Banks Market Revenue (US$ Mn) Market Share by By Distribution Channel in 2022
- Figure 8: Global Power Banks Market Market Attractiveness Analysis by By Distribution Channel , 2016-2032
- Figure 9: Global Power Banks Market Revenue (US$ Mn) Market Share by Region in 2022
- Figure 10: Global Power Banks Market Market Attractiveness Analysis by Region, 2016-2032
- Figure 11: Global Power Banks Market Market Revenue (US$ Mn) (2016-2032)
- Figure 12: Global Power Banks Market Market Revenue (US$ Mn) Comparison by Region (2016-2032)
- Figure 13: Global Power Banks Market Market Revenue (US$ Mn) Comparison by By Capacity Range (2016-2032)
- Figure 14: Global Power Banks Market Market Revenue (US$ Mn) Comparison by By Energy Source (2016-2032)
- Figure 15: Global Power Banks Market Market Revenue (US$ Mn) Comparison by By Battery Type (2016-2032)
- Figure 16: Global Power Banks Market Market Revenue (US$ Mn) Comparison by By Distribution Channel (2016-2032)
- Figure 17: Global Power Banks Market Market Y-o-Y Growth Rate Comparison by Region (2016-2032)
- Figure 18: Global Power Banks Market Market Y-o-Y Growth Rate Comparison by By Capacity Range (2016-2032)
- Figure 19: Global Power Banks Market Market Y-o-Y Growth Rate Comparison by By Energy Source (2016-2032)
- Figure 20: Global Power Banks Market Market Y-o-Y Growth Rate Comparison by By Battery Type (2016-2032)
- Figure 21: Global Power Banks Market Market Y-o-Y Growth Rate Comparison by By Distribution Channel (2016-2032)
- Figure 22: Global Power Banks Market Market Share Comparison by Region (2016-2032)
- Figure 23: Global Power Banks Market Market Share Comparison by By Capacity Range (2016-2032)
- Figure 24: Global Power Banks Market Market Share Comparison by By Energy Source (2016-2032)
- Figure 25: Global Power Banks Market Market Share Comparison by By Battery Type (2016-2032)
- Figure 26: Global Power Banks Market Market Share Comparison by By Distribution Channel (2016-2032)
- Figure 27: North America Power Banks Market Revenue (US$ Mn) Market Share by By Capacity Range in 2022
- Figure 28: North America Power Banks Market Market Attractiveness Analysis by By Capacity Range , 2016-2032
- Figure 29: North America Power Banks Market Revenue (US$ Mn) Market Share by By Energy Source in 2022
- Figure 30: North America Power Banks Market Market Attractiveness Analysis by By Energy Source , 2016-2032
- Figure 31: North America Power Banks Market Revenue (US$ Mn) Market Share by By Battery Type in 2022
- Figure 32: North America Power Banks Market Market Attractiveness Analysis by By Battery Type , 2016-2032
- Figure 33: North America Power Banks Market Revenue (US$ Mn) Market Share by By Distribution Channel in 2022
- Figure 34: North America Power Banks Market Market Attractiveness Analysis by By Distribution Channel , 2016-2032
- Figure 35: North America Power Banks Market Revenue (US$ Mn) Market Share by Country in 2022
- Figure 36: North America Power Banks Market Market Attractiveness Analysis by Country, 2016-2032
- Figure 37: North America Power Banks Market Market Revenue (US$ Mn) (2016-2032)
- Figure 38: North America Power Banks Market Market Revenue (US$ Mn) Comparison by Country (2016-2032)
- Figure 39: North America Power Banks Market Market Revenue (US$ Mn) Comparison by By Capacity Range (2016-2032)
- Figure 40: North America Power Banks Market Market Revenue (US$ Mn) Comparison by By Energy Source (2016-2032)
- Figure 41: North America Power Banks Market Market Revenue (US$ Mn) Comparison by By Battery Type (2016-2032)
- Figure 42: North America Power Banks Market Market Revenue (US$ Mn) Comparison by By Distribution Channel (2016-2032)
- Figure 43: North America Power Banks Market Market Y-o-Y Growth Rate Comparison by Country (2016-2032)
- Figure 44: North America Power Banks Market Market Y-o-Y Growth Rate Comparison by By Capacity Range (2016-2032)
- Figure 45: North America Power Banks Market Market Y-o-Y Growth Rate Comparison by By Energy Source (2016-2032)
- Figure 46: North America Power Banks Market Market Y-o-Y Growth Rate Comparison by By Battery Type (2016-2032)
- Figure 47: North America Power Banks Market Market Y-o-Y Growth Rate Comparison by By Distribution Channel (2016-2032)
- Figure 48: North America Power Banks Market Market Share Comparison by Country (2016-2032)
- Figure 49: North America Power Banks Market Market Share Comparison by By Capacity Range (2016-2032)
- Figure 50: North America Power Banks Market Market Share Comparison by By Energy Source (2016-2032)
- Figure 51: North America Power Banks Market Market Share Comparison by By Battery Type (2016-2032)
- Figure 52: North America Power Banks Market Market Share Comparison by By Distribution Channel (2016-2032)
- Figure 53: Western Europe Power Banks Market Revenue (US$ Mn) Market Share by By Capacity Range in 2022
- Figure 54: Western Europe Power Banks Market Market Attractiveness Analysis by By Capacity Range , 2016-2032
- Figure 55: Western Europe Power Banks Market Revenue (US$ Mn) Market Share by By Energy Source in 2022
- Figure 56: Western Europe Power Banks Market Market Attractiveness Analysis by By Energy Source , 2016-2032
- Figure 57: Western Europe Power Banks Market Revenue (US$ Mn) Market Share by By Battery Type in 2022
- Figure 58: Western Europe Power Banks Market Market Attractiveness Analysis by By Battery Type , 2016-2032
- Figure 59: Western Europe Power Banks Market Revenue (US$ Mn) Market Share by By Distribution Channel in 2022
- Figure 60: Western Europe Power Banks Market Market Attractiveness Analysis by By Distribution Channel , 2016-2032
- Figure 61: Western Europe Power Banks Market Revenue (US$ Mn) Market Share by Country in 2022
- Figure 62: Western Europe Power Banks Market Market Attractiveness Analysis by Country, 2016-2032
- Figure 63: Western Europe Power Banks Market Market Revenue (US$ Mn) (2016-2032)
- Figure 64: Western Europe Power Banks Market Market Revenue (US$ Mn) Comparison by Country (2016-2032)
- Figure 65: Western Europe Power Banks Market Market Revenue (US$ Mn) Comparison by By Capacity Range (2016-2032)
- Figure 66: Western Europe Power Banks Market Market Revenue (US$ Mn) Comparison by By Energy Source (2016-2032)
- Figure 67: Western Europe Power Banks Market Market Revenue (US$ Mn) Comparison by By Battery Type (2016-2032)
- Figure 68: Western Europe Power Banks Market Market Revenue (US$ Mn) Comparison by By Distribution Channel (2016-2032)
- Figure 69: Western Europe Power Banks Market Market Y-o-Y Growth Rate Comparison by Country (2016-2032)
- Figure 70: Western Europe Power Banks Market Market Y-o-Y Growth Rate Comparison by By Capacity Range (2016-2032)
- Figure 71: Western Europe Power Banks Market Market Y-o-Y Growth Rate Comparison by By Energy Source (2016-2032)
- Figure 72: Western Europe Power Banks Market Market Y-o-Y Growth Rate Comparison by By Battery Type (2016-2032)
- Figure 73: Western Europe Power Banks Market Market Y-o-Y Growth Rate Comparison by By Distribution Channel (2016-2032)
- Figure 74: Western Europe Power Banks Market Market Share Comparison by Country (2016-2032)
- Figure 75: Western Europe Power Banks Market Market Share Comparison by By Capacity Range (2016-2032)
- Figure 76: Western Europe Power Banks Market Market Share Comparison by By Energy Source (2016-2032)
- Figure 77: Western Europe Power Banks Market Market Share Comparison by By Battery Type (2016-2032)
- Figure 78: Western Europe Power Banks Market Market Share Comparison by By Distribution Channel (2016-2032)
- Figure 79: Eastern Europe Power Banks Market Revenue (US$ Mn) Market Share by By Capacity Range in 2022
- Figure 80: Eastern Europe Power Banks Market Market Attractiveness Analysis by By Capacity Range , 2016-2032
- Figure 81: Eastern Europe Power Banks Market Revenue (US$ Mn) Market Share by By Energy Source in 2022
- Figure 82: Eastern Europe Power Banks Market Market Attractiveness Analysis by By Energy Source , 2016-2032
- Figure 83: Eastern Europe Power Banks Market Revenue (US$ Mn) Market Share by By Battery Type in 2022
- Figure 84: Eastern Europe Power Banks Market Market Attractiveness Analysis by By Battery Type , 2016-2032
- Figure 85: Eastern Europe Power Banks Market Revenue (US$ Mn) Market Share by By Distribution Channel in 2022
- Figure 86: Eastern Europe Power Banks Market Market Attractiveness Analysis by By Distribution Channel , 2016-2032
- Figure 87: Eastern Europe Power Banks Market Revenue (US$ Mn) Market Share by Country in 2022
- Figure 88: Eastern Europe Power Banks Market Market Attractiveness Analysis by Country, 2016-2032
- Figure 89: Eastern Europe Power Banks Market Market Revenue (US$ Mn) (2016-2032)
- Figure 90: Eastern Europe Power Banks Market Market Revenue (US$ Mn) Comparison by Country (2016-2032)
- Figure 91: Eastern Europe Power Banks Market Market Revenue (US$ Mn) Comparison by By Capacity Range (2016-2032)
- Figure 92: Eastern Europe Power Banks Market Market Revenue (US$ Mn) Comparison by By Energy Source (2016-2032)
- Figure 93: Eastern Europe Power Banks Market Market Revenue (US$ Mn) Comparison by By Battery Type (2016-2032)
- Figure 94: Eastern Europe Power Banks Market Market Revenue (US$ Mn) Comparison by By Distribution Channel (2016-2032)
- Figure 95: Eastern Europe Power Banks Market Market Y-o-Y Growth Rate Comparison by Country (2016-2032)
- Figure 96: Eastern Europe Power Banks Market Market Y-o-Y Growth Rate Comparison by By Capacity Range (2016-2032)
- Figure 97: Eastern Europe Power Banks Market Market Y-o-Y Growth Rate Comparison by By Energy Source (2016-2032)
- Figure 98: Eastern Europe Power Banks Market Market Y-o-Y Growth Rate Comparison by By Battery Type (2016-2032)
- Figure 99: Eastern Europe Power Banks Market Market Y-o-Y Growth Rate Comparison by By Distribution Channel (2016-2032)
- Figure 100: Eastern Europe Power Banks Market Market Share Comparison by Country (2016-2032)
- Figure 101: Eastern Europe Power Banks Market Market Share Comparison by By Capacity Range (2016-2032)
- Figure 102: Eastern Europe Power Banks Market Market Share Comparison by By Energy Source (2016-2032)
- Figure 103: Eastern Europe Power Banks Market Market Share Comparison by By Battery Type (2016-2032)
- Figure 104: Eastern Europe Power Banks Market Market Share Comparison by By Distribution Channel (2016-2032)
- Figure 105: APAC Power Banks Market Revenue (US$ Mn) Market Share by By Capacity Range in 2022
- Figure 106: APAC Power Banks Market Market Attractiveness Analysis by By Capacity Range , 2016-2032
- Figure 107: APAC Power Banks Market Revenue (US$ Mn) Market Share by By Energy Source in 2022
- Figure 108: APAC Power Banks Market Market Attractiveness Analysis by By Energy Source , 2016-2032
- Figure 109: APAC Power Banks Market Revenue (US$ Mn) Market Share by By Battery Type in 2022
- Figure 110: APAC Power Banks Market Market Attractiveness Analysis by By Battery Type , 2016-2032
- Figure 111: APAC Power Banks Market Revenue (US$ Mn) Market Share by By Distribution Channel in 2022
- Figure 112: APAC Power Banks Market Market Attractiveness Analysis by By Distribution Channel , 2016-2032
- Figure 113: APAC Power Banks Market Revenue (US$ Mn) Market Share by Country in 2022
- Figure 114: APAC Power Banks Market Market Attractiveness Analysis by Country, 2016-2032
- Figure 115: APAC Power Banks Market Market Revenue (US$ Mn) (2016-2032)
- Figure 116: APAC Power Banks Market Market Revenue (US$ Mn) Comparison by Country (2016-2032)
- Figure 117: APAC Power Banks Market Market Revenue (US$ Mn) Comparison by By Capacity Range (2016-2032)
- Figure 118: APAC Power Banks Market Market Revenue (US$ Mn) Comparison by By Energy Source (2016-2032)
- Figure 119: APAC Power Banks Market Market Revenue (US$ Mn) Comparison by By Battery Type (2016-2032)
- Figure 120: APAC Power Banks Market Market Revenue (US$ Mn) Comparison by By Distribution Channel (2016-2032)
- Figure 121: APAC Power Banks Market Market Y-o-Y Growth Rate Comparison by Country (2016-2032)
- Figure 122: APAC Power Banks Market Market Y-o-Y Growth Rate Comparison by By Capacity Range (2016-2032)
- Figure 123: APAC Power Banks Market Market Y-o-Y Growth Rate Comparison by By Energy Source (2016-2032)
- Figure 124: APAC Power Banks Market Market Y-o-Y Growth Rate Comparison by By Battery Type (2016-2032)
- Figure 125: APAC Power Banks Market Market Y-o-Y Growth Rate Comparison by By Distribution Channel (2016-2032)
- Figure 126: APAC Power Banks Market Market Share Comparison by Country (2016-2032)
- Figure 127: APAC Power Banks Market Market Share Comparison by By Capacity Range (2016-2032)
- Figure 128: APAC Power Banks Market Market Share Comparison by By Energy Source (2016-2032)
- Figure 129: APAC Power Banks Market Market Share Comparison by By Battery Type (2016-2032)
- Figure 130: APAC Power Banks Market Market Share Comparison by By Distribution Channel (2016-2032)
- Figure 131: Latin America Power Banks Market Revenue (US$ Mn) Market Share by By Capacity Range in 2022
- Figure 132: Latin America Power Banks Market Market Attractiveness Analysis by By Capacity Range , 2016-2032
- Figure 133: Latin America Power Banks Market Revenue (US$ Mn) Market Share by By Energy Source in 2022
- Figure 134: Latin America Power Banks Market Market Attractiveness Analysis by By Energy Source , 2016-2032
- Figure 135: Latin America Power Banks Market Revenue (US$ Mn) Market Share by By Battery Type in 2022
- Figure 136: Latin America Power Banks Market Market Attractiveness Analysis by By Battery Type , 2016-2032
- Figure 137: Latin America Power Banks Market Revenue (US$ Mn) Market Share by By Distribution Channel in 2022
- Figure 138: Latin America Power Banks Market Market Attractiveness Analysis by By Distribution Channel , 2016-2032
- Figure 139: Latin America Power Banks Market Revenue (US$ Mn) Market Share by Country in 2022
- Figure 140: Latin America Power Banks Market Market Attractiveness Analysis by Country, 2016-2032
- Figure 141: Latin America Power Banks Market Market Revenue (US$ Mn) (2016-2032)
- Figure 142: Latin America Power Banks Market Market Revenue (US$ Mn) Comparison by Country (2016-2032)
- Figure 143: Latin America Power Banks Market Market Revenue (US$ Mn) Comparison by By Capacity Range (2016-2032)
- Figure 144: Latin America Power Banks Market Market Revenue (US$ Mn) Comparison by By Energy Source (2016-2032)
- Figure 145: Latin America Power Banks Market Market Revenue (US$ Mn) Comparison by By Battery Type (2016-2032)
- Figure 146: Latin America Power Banks Market Market Revenue (US$ Mn) Comparison by By Distribution Channel (2016-2032)
- Figure 147: Latin America Power Banks Market Market Y-o-Y Growth Rate Comparison by Country (2016-2032)
- Figure 148: Latin America Power Banks Market Market Y-o-Y Growth Rate Comparison by By Capacity Range (2016-2032)
- Figure 149: Latin America Power Banks Market Market Y-o-Y Growth Rate Comparison by By Energy Source (2016-2032)
- Figure 150: Latin America Power Banks Market Market Y-o-Y Growth Rate Comparison by By Battery Type (2016-2032)
- Figure 151: Latin America Power Banks Market Market Y-o-Y Growth Rate Comparison by By Distribution Channel (2016-2032)
- Figure 152: Latin America Power Banks Market Market Share Comparison by Country (2016-2032)
- Figure 153: Latin America Power Banks Market Market Share Comparison by By Capacity Range (2016-2032)
- Figure 154: Latin America Power Banks Market Market Share Comparison by By Energy Source (2016-2032)
- Figure 155: Latin America Power Banks Market Market Share Comparison by By Battery Type (2016-2032)
- Figure 156: Latin America Power Banks Market Market Share Comparison by By Distribution Channel (2016-2032)
- Figure 157: Middle East & Africa Power Banks Market Revenue (US$ Mn) Market Share by By Capacity Range in 2022
- Figure 158: Middle East & Africa Power Banks Market Market Attractiveness Analysis by By Capacity Range , 2016-2032
- Figure 159: Middle East & Africa Power Banks Market Revenue (US$ Mn) Market Share by By Energy Source in 2022
- Figure 160: Middle East & Africa Power Banks Market Market Attractiveness Analysis by By Energy Source , 2016-2032
- Figure 161: Middle East & Africa Power Banks Market Revenue (US$ Mn) Market Share by By Battery Type in 2022
- Figure 162: Middle East & Africa Power Banks Market Market Attractiveness Analysis by By Battery Type , 2016-2032
- Figure 163: Middle East & Africa Power Banks Market Revenue (US$ Mn) Market Share by By Distribution Channel in 2022
- Figure 164: Middle East & Africa Power Banks Market Market Attractiveness Analysis by By Distribution Channel , 2016-2032
- Figure 165: Middle East & Africa Power Banks Market Revenue (US$ Mn) Market Share by Country in 2022
- Figure 166: Middle East & Africa Power Banks Market Market Attractiveness Analysis by Country, 2016-2032
- Figure 167: Middle East & Africa Power Banks Market Market Revenue (US$ Mn) (2016-2032)
- Figure 168: Middle East & Africa Power Banks Market Market Revenue (US$ Mn) Comparison by Country (2016-2032)
- Figure 169: Middle East & Africa Power Banks Market Market Revenue (US$ Mn) Comparison by By Capacity Range (2016-2032)
- Figure 170: Middle East & Africa Power Banks Market Market Revenue (US$ Mn) Comparison by By Energy Source (2016-2032)
- Figure 171: Middle East & Africa Power Banks Market Market Revenue (US$ Mn) Comparison by By Battery Type (2016-2032)
- Figure 172: Middle East & Africa Power Banks Market Market Revenue (US$ Mn) Comparison by By Distribution Channel (2016-2032)
- Figure 173: Middle East & Africa Power Banks Market Market Y-o-Y Growth Rate Comparison by Country (2016-2032)
- Figure 174: Middle East & Africa Power Banks Market Market Y-o-Y Growth Rate Comparison by By Capacity Range (2016-2032)
- Figure 175: Middle East & Africa Power Banks Market Market Y-o-Y Growth Rate Comparison by By Energy Source (2016-2032)
- Figure 176: Middle East & Africa Power Banks Market Market Y-o-Y Growth Rate Comparison by By Battery Type (2016-2032)
- Figure 177: Middle East & Africa Power Banks Market Market Y-o-Y Growth Rate Comparison by By Distribution Channel (2016-2032)
- Figure 178: Middle East & Africa Power Banks Market Market Share Comparison by Country (2016-2032)
- Figure 179: Middle East & Africa Power Banks Market Market Share Comparison by By Capacity Range (2016-2032)
- Figure 180: Middle East & Africa Power Banks Market Market Share Comparison by By Energy Source (2016-2032)
- Figure 181: Middle East & Africa Power Banks Market Market Share Comparison by By Battery Type (2016-2032)
- Figure 182: Middle East & Africa Power Banks Market Market Share Comparison by By Distribution Channel (2016-2032)
"
- List of Tables
- "
- Table 1: Global Power Banks Market Market Comparison by By Capacity Range (2016-2032)
- Table 2: Global Power Banks Market Market Comparison by By Energy Source (2016-2032)
- Table 3: Global Power Banks Market Market Comparison by By Battery Type (2016-2032)
- Table 4: Global Power Banks Market Market Comparison by By Distribution Channel (2016-2032)
- Table 5: Global Power Banks Market Revenue (US$ Mn) Comparison by Region (2016-2032)
- Table 6: Global Power Banks Market Market Revenue (US$ Mn) (2016-2032)
- Table 7: Global Power Banks Market Market Revenue (US$ Mn) Comparison by Region (2016-2032)
- Table 8: Global Power Banks Market Market Revenue (US$ Mn) Comparison by By Capacity Range (2016-2032)
- Table 9: Global Power Banks Market Market Revenue (US$ Mn) Comparison by By Energy Source (2016-2032)
- Table 10: Global Power Banks Market Market Revenue (US$ Mn) Comparison by By Battery Type (2016-2032)
- Table 11: Global Power Banks Market Market Revenue (US$ Mn) Comparison by By Distribution Channel (2016-2032)
- Table 12: Global Power Banks Market Market Y-o-Y Growth Rate Comparison by Region (2016-2032)
- Table 13: Global Power Banks Market Market Y-o-Y Growth Rate Comparison by By Capacity Range (2016-2032)
- Table 14: Global Power Banks Market Market Y-o-Y Growth Rate Comparison by By Energy Source (2016-2032)
- Table 15: Global Power Banks Market Market Y-o-Y Growth Rate Comparison by By Battery Type (2016-2032)
- Table 16: Global Power Banks Market Market Y-o-Y Growth Rate Comparison by By Distribution Channel (2016-2032)
- Table 17: Global Power Banks Market Market Share Comparison by Region (2016-2032)
- Table 18: Global Power Banks Market Market Share Comparison by By Capacity Range (2016-2032)
- Table 19: Global Power Banks Market Market Share Comparison by By Energy Source (2016-2032)
- Table 20: Global Power Banks Market Market Share Comparison by By Battery Type (2016-2032)
- Table 21: Global Power Banks Market Market Share Comparison by By Distribution Channel (2016-2032)
- Table 22: North America Power Banks Market Market Comparison by By Energy Source (2016-2032)
- Table 23: North America Power Banks Market Market Comparison by By Battery Type (2016-2032)
- Table 24: North America Power Banks Market Market Comparison by By Distribution Channel (2016-2032)
- Table 25: North America Power Banks Market Revenue (US$ Mn) Comparison by Country (2016-2032)
- Table 26: North America Power Banks Market Market Revenue (US$ Mn) (2016-2032)
- Table 27: North America Power Banks Market Market Revenue (US$ Mn) Comparison by Country (2016-2032)
- Table 28: North America Power Banks Market Market Revenue (US$ Mn) Comparison by By Capacity Range (2016-2032)
- Table 29: North America Power Banks Market Market Revenue (US$ Mn) Comparison by By Energy Source (2016-2032)
- Table 30: North America Power Banks Market Market Revenue (US$ Mn) Comparison by By Battery Type (2016-2032)
- Table 31: North America Power Banks Market Market Revenue (US$ Mn) Comparison by By Distribution Channel (2016-2032)
- Table 32: North America Power Banks Market Market Y-o-Y Growth Rate Comparison by Country (2016-2032)
- Table 33: North America Power Banks Market Market Y-o-Y Growth Rate Comparison by By Capacity Range (2016-2032)
- Table 34: North America Power Banks Market Market Y-o-Y Growth Rate Comparison by By Energy Source (2016-2032)
- Table 35: North America Power Banks Market Market Y-o-Y Growth Rate Comparison by By Battery Type (2016-2032)
- Table 36: North America Power Banks Market Market Y-o-Y Growth Rate Comparison by By Distribution Channel (2016-2032)
- Table 37: North America Power Banks Market Market Share Comparison by Country (2016-2032)
- Table 38: North America Power Banks Market Market Share Comparison by By Capacity Range (2016-2032)
- Table 39: North America Power Banks Market Market Share Comparison by By Energy Source (2016-2032)
- Table 40: North America Power Banks Market Market Share Comparison by By Battery Type (2016-2032)
- Table 41: North America Power Banks Market Market Share Comparison by By Distribution Channel (2016-2032)
- Table 42: Western Europe Power Banks Market Market Comparison by By Capacity Range (2016-2032)
- Table 43: Western Europe Power Banks Market Market Comparison by By Energy Source (2016-2032)
- Table 44: Western Europe Power Banks Market Market Comparison by By Battery Type (2016-2032)
- Table 45: Western Europe Power Banks Market Market Comparison by By Distribution Channel (2016-2032)
- Table 46: Western Europe Power Banks Market Revenue (US$ Mn) Comparison by Country (2016-2032)
- Table 47: Western Europe Power Banks Market Market Revenue (US$ Mn) (2016-2032)
- Table 48: Western Europe Power Banks Market Market Revenue (US$ Mn) Comparison by Country (2016-2032)
- Table 49: Western Europe Power Banks Market Market Revenue (US$ Mn) Comparison by By Capacity Range (2016-2032)
- Table 50: Western Europe Power Banks Market Market Revenue (US$ Mn) Comparison by By Energy Source (2016-2032)
- Table 51: Western Europe Power Banks Market Market Revenue (US$ Mn) Comparison by By Battery Type (2016-2032)
- Table 52: Western Europe Power Banks Market Market Revenue (US$ Mn) Comparison by By Distribution Channel (2016-2032)
- Table 53: Western Europe Power Banks Market Market Y-o-Y Growth Rate Comparison by Country (2016-2032)
- Table 54: Western Europe Power Banks Market Market Y-o-Y Growth Rate Comparison by By Capacity Range (2016-2032)
- Table 55: Western Europe Power Banks Market Market Y-o-Y Growth Rate Comparison by By Energy Source (2016-2032)
- Table 56: Western Europe Power Banks Market Market Y-o-Y Growth Rate Comparison by By Battery Type (2016-2032)
- Table 57: Western Europe Power Banks Market Market Y-o-Y Growth Rate Comparison by By Distribution Channel (2016-2032)
- Table 58: Western Europe Power Banks Market Market Share Comparison by Country (2016-2032)
- Table 59: Western Europe Power Banks Market Market Share Comparison by By Capacity Range (2016-2032)
- Table 60: Western Europe Power Banks Market Market Share Comparison by By Energy Source (2016-2032)
- Table 61: Western Europe Power Banks Market Market Share Comparison by By Battery Type (2016-2032)
- Table 62: Western Europe Power Banks Market Market Share Comparison by By Distribution Channel (2016-2032)
- Table 63: Eastern Europe Power Banks Market Market Comparison by By Capacity Range (2016-2032)
- Table 64: Eastern Europe Power Banks Market Market Comparison by By Energy Source (2016-2032)
- Table 65: Eastern Europe Power Banks Market Market Comparison by By Battery Type (2016-2032)
- Table 66: Eastern Europe Power Banks Market Market Comparison by By Distribution Channel (2016-2032)
- Table 67: Eastern Europe Power Banks Market Revenue (US$ Mn) Comparison by Country (2016-2032)
- Table 68: Eastern Europe Power Banks Market Market Revenue (US$ Mn) (2016-2032)
- Table 69: Eastern Europe Power Banks Market Market Revenue (US$ Mn) Comparison by Country (2016-2032)
- Table 70: Eastern Europe Power Banks Market Market Revenue (US$ Mn) Comparison by By Capacity Range (2016-2032)
- Table 71: Eastern Europe Power Banks Market Market Revenue (US$ Mn) Comparison by By Energy Source (2016-2032)
- Table 72: Eastern Europe Power Banks Market Market Revenue (US$ Mn) Comparison by By Battery Type (2016-2032)
- Table 73: Eastern Europe Power Banks Market Market Revenue (US$ Mn) Comparison by By Distribution Channel (2016-2032)
- Table 74: Eastern Europe Power Banks Market Market Y-o-Y Growth Rate Comparison by Country (2016-2032)
- Table 75: Eastern Europe Power Banks Market Market Y-o-Y Growth Rate Comparison by By Capacity Range (2016-2032)
- Table 76: Eastern Europe Power Banks Market Market Y-o-Y Growth Rate Comparison by By Energy Source (2016-2032)
- Table 77: Eastern Europe Power Banks Market Market Y-o-Y Growth Rate Comparison by By Battery Type (2016-2032)
- Table 78: Eastern Europe Power Banks Market Market Y-o-Y Growth Rate Comparison by By Distribution Channel (2016-2032)
- Table 79: Eastern Europe Power Banks Market Market Share Comparison by Country (2016-2032)
- Table 80: Eastern Europe Power Banks Market Market Share Comparison by By Capacity Range (2016-2032)
- Table 81: Eastern Europe Power Banks Market Market Share Comparison by By Energy Source (2016-2032)
- Table 82: Eastern Europe Power Banks Market Market Share Comparison by By Battery Type (2016-2032)
- Table 83: Eastern Europe Power Banks Market Market Share Comparison by By Distribution Channel (2016-2032)
- Table 84: APAC Power Banks Market Market Comparison by By Capacity Range (2016-2032)
- Table 85: APAC Power Banks Market Market Comparison by By Energy Source (2016-2032)
- Table 86: APAC Power Banks Market Market Comparison by By Battery Type (2016-2032)
- Table 87: APAC Power Banks Market Market Comparison by By Distribution Channel (2016-2032)
- Table 88: APAC Power Banks Market Revenue (US$ Mn) Comparison by Country (2016-2032)
- Table 89: APAC Power Banks Market Market Revenue (US$ Mn) (2016-2032)
- Table 90: APAC Power Banks Market Market Revenue (US$ Mn) Comparison by Country (2016-2032)
- Table 91: APAC Power Banks Market Market Revenue (US$ Mn) Comparison by By Capacity Range (2016-2032)
- Table 92: APAC Power Banks Market Market Revenue (US$ Mn) Comparison by By Energy Source (2016-2032)
- Table 93: APAC Power Banks Market Market Revenue (US$ Mn) Comparison by By Battery Type (2016-2032)
- Table 94: APAC Power Banks Market Market Revenue (US$ Mn) Comparison by By Distribution Channel (2016-2032)
- Table 95: APAC Power Banks Market Market Y-o-Y Growth Rate Comparison by Country (2016-2032)
- Table 96: APAC Power Banks Market Market Y-o-Y Growth Rate Comparison by By Capacity Range (2016-2032)
- Table 97: APAC Power Banks Market Market Y-o-Y Growth Rate Comparison by By Energy Source (2016-2032)
- Table 98: APAC Power Banks Market Market Y-o-Y Growth Rate Comparison by By Battery Type (2016-2032)
- Table 99: APAC Power Banks Market Market Y-o-Y Growth Rate Comparison by By Distribution Channel (2016-2032)
- Table 100: APAC Power Banks Market Market Share Comparison by Country (2016-2032)
- Table 101: APAC Power Banks Market Market Share Comparison by By Capacity Range (2016-2032)
- Table 102: APAC Power Banks Market Market Share Comparison by By Energy Source (2016-2032)
- Table 103: APAC Power Banks Market Market Share Comparison by By Battery Type (2016-2032)
- Table 104: APAC Power Banks Market Market Share Comparison by By Distribution Channel (2016-2032)
- Table 105: Latin America Power Banks Market Market Comparison by By Capacity Range (2016-2032)
- Table 106: Latin America Power Banks Market Market Comparison by By Energy Source (2016-2032)
- Table 107: Latin America Power Banks Market Market Comparison by By Battery Type (2016-2032)
- Table 108: Latin America Power Banks Market Market Comparison by By Distribution Channel (2016-2032)
- Table 109: Latin America Power Banks Market Revenue (US$ Mn) Comparison by Country (2016-2032)
- Table 110: Latin America Power Banks Market Market Revenue (US$ Mn) (2016-2032)
- Table 111: Latin America Power Banks Market Market Revenue (US$ Mn) Comparison by Country (2016-2032)
- Table 112: Latin America Power Banks Market Market Revenue (US$ Mn) Comparison by By Capacity Range (2016-2032)
- Table 113: Latin America Power Banks Market Market Revenue (US$ Mn) Comparison by By Energy Source (2016-2032)
- Table 114: Latin America Power Banks Market Market Revenue (US$ Mn) Comparison by By Battery Type (2016-2032)
- Table 115: Latin America Power Banks Market Market Revenue (US$ Mn) Comparison by By Distribution Channel (2016-2032)
- Table 116: Latin America Power Banks Market Market Y-o-Y Growth Rate Comparison by Country (2016-2032)
- Table 117: Latin America Power Banks Market Market Y-o-Y Growth Rate Comparison by By Capacity Range (2016-2032)
- Table 118: Latin America Power Banks Market Market Y-o-Y Growth Rate Comparison by By Energy Source (2016-2032)
- Table 119: Latin America Power Banks Market Market Y-o-Y Growth Rate Comparison by By Battery Type (2016-2032)
- Table 120: Latin America Power Banks Market Market Y-o-Y Growth Rate Comparison by By Distribution Channel (2016-2032)
- Table 121: Latin America Power Banks Market Market Share Comparison by Country (2016-2032)
- Table 122: Latin America Power Banks Market Market Share Comparison by By Capacity Range (2016-2032)
- Table 123: Latin America Power Banks Market Market Share Comparison by By Energy Source (2016-2032)
- Table 124: Latin America Power Banks Market Market Share Comparison by By Battery Type (2016-2032)
- Table 125: Latin America Power Banks Market Market Share Comparison by By Distribution Channel (2016-2032)
- Table 126: Middle East & Africa Power Banks Market Market Comparison by By Capacity Range (2016-2032)
- Table 127: Middle East & Africa Power Banks Market Market Comparison by By Energy Source (2016-2032)
- Table 128: Middle East & Africa Power Banks Market Market Comparison by By Battery Type (2016-2032)
- Table 129: Middle East & Africa Power Banks Market Market Comparison by By Distribution Channel (2016-2032)
- Table 130: Middle East & Africa Power Banks Market Revenue (US$ Mn) Comparison by Country (2016-2032)
- Table 131: Middle East & Africa Power Banks Market Market Revenue (US$ Mn) (2016-2032)
- Table 132: Middle East & Africa Power Banks Market Market Revenue (US$ Mn) Comparison by Country (2016-2032)
- Table 133: Middle East & Africa Power Banks Market Market Revenue (US$ Mn) Comparison by By Capacity Range (2016-2032)
- Table 134: Middle East & Africa Power Banks Market Market Revenue (US$ Mn) Comparison by By Energy Source (2016-2032)
- Table 135: Middle East & Africa Power Banks Market Market Revenue (US$ Mn) Comparison by By Battery Type (2016-2032)
- Table 136: Middle East & Africa Power Banks Market Market Revenue (US$ Mn) Comparison by By Distribution Channel (2016-2032)
- Table 137: Middle East & Africa Power Banks Market Market Y-o-Y Growth Rate Comparison by Country (2016-2032)
- Table 138: Middle East & Africa Power Banks Market Market Y-o-Y Growth Rate Comparison by By Capacity Range (2016-2032)
- Table 139: Middle East & Africa Power Banks Market Market Y-o-Y Growth Rate Comparison by By Energy Source (2016-2032)
- Table 140: Middle East & Africa Power Banks Market Market Y-o-Y Growth Rate Comparison by By Battery Type (2016-2032)
- Table 141: Middle East & Africa Power Banks Market Market Y-o-Y Growth Rate Comparison by By Distribution Channel (2016-2032)
- Table 142: Middle East & Africa Power Banks Market Market Share Comparison by Country (2016-2032)
- Table 143: Middle East & Africa Power Banks Market Market Share Comparison by By Capacity Range (2016-2032)
- Table 144: Middle East & Africa Power Banks Market Market Share Comparison by By Energy Source (2016-2032)
- Table 145: Middle East & Africa Power Banks Market Market Share Comparison by By Battery Type (2016-2032)
- Table 146: Middle East & Africa Power Banks Market Market Share Comparison by By Distribution Channel (2016-2032)
- 1. Executive Summary
-
- Ambrane India Private Ltd.
- Anker Technology Co. Ltd.
- ASUSTeK Computer Inc.
- Beijing Xiaomi Technology Co., Ltd.
- Intex Technologies
- Lenovo Group Ltd.
- Microsoft Corporation
- Panasonic Corporation
- Samsung SDI Co., Ltd.
- Sony Corporation
Our Clients


View Our Licence Options
