
Global Power Amplifier Market By Type(Audio Power Amplifier, Radiofrequency (RF) Power Amplifier, Linear Power Amplifier), By Material(Gallium Nitride (GaN), Gallium Arsenide (GaAs), Silicon Germanium (SiGe)), By End-user(Consumer Electronics, Healthcare, Aerospace and Defense, Telecommunication, Others (Automotive, Energy and Power, and Oil and Gas)), By Region And Companies - Industry Segment Outlook, Market Assessment, Competition Scenario, Trends, And Forecast 2024-2033
-
49129
-
July 2024
-
300
-


-
This report was compiled by Vishwa Gaul Vishwa is an experienced market research and consulting professional with over 8 years of expertise in the ICT industry, contributing to over 700 reports across telecommunications, software, hardware, and digital solutions. Correspondence Team Lead- ICT Linkedin | Detailed Market research Methodology Our methodology involves a mix of primary research, including interviews with leading mental health experts, and secondary research from reputable medical journals and databases. View Detailed Methodology Page
-
Quick Navigation
Report Overview
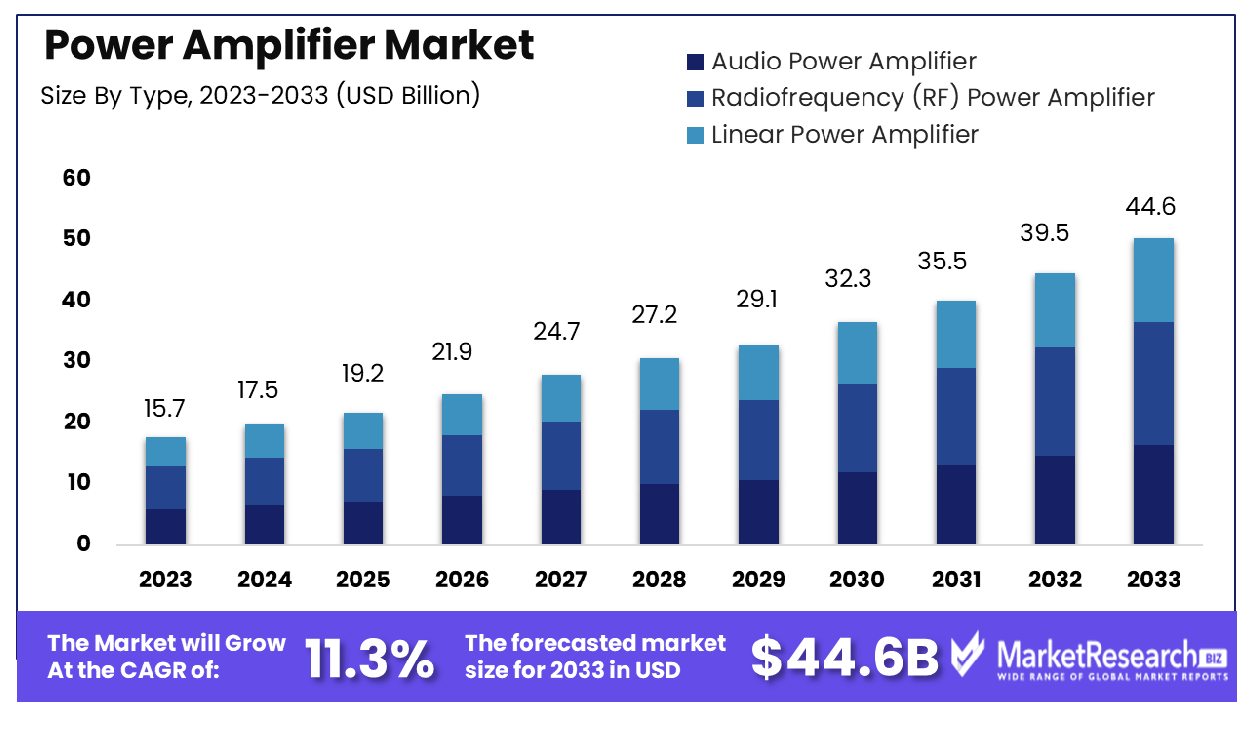
The Global Power Amplifier Market was valued at USD 15.7 billion in 2023. It is expected to reach USD 44.6 billion by 2033, with a CAGR of 11.3% during the forecast period from 2024 to 2033.
The Power Amplifier Market encompasses the sector dedicated to the development, production, and distribution of devices that enhance the power of an input signal, resulting in a significant increase in output. Power amplifiers are crucial components in various applications, including telecommunications, consumer electronics, automotive, and industrial sectors. They are integral in enhancing signal strength for effective data transmission and reception, ensuring high performance and efficiency.
The market's growth is driven by advancements in wireless communication technologies, increasing demand for high-quality audio systems, and the expanding adoption of electric vehicles. Strategic investments and innovation in this field are pivotal for maintaining competitive advantage.
The Power Amplifier Market is poised for significant growth, driven by technological advancements and increasing demand across various industries. Power amplifiers, essential in enhancing signal strength for effective data transmission and reception, are critical components in telecommunications, consumer electronics, automotive, and industrial applications. The market's trajectory is influenced by the rise of wireless communication technologies, the need for high-quality audio systems, and the growing adoption of electric vehicles.
Analyzing the efficiency and configuration of power amplifiers provides insights into market dynamics. Class A amplifiers, which amplify 100% of the input signal using a single transistor in a common emitter configuration, offer low efficiency at around 25%. Despite their high-fidelity output, their inefficiency limits their widespread adoption. In contrast, Class B amplifiers, utilizing two transistors in a push-pull configuration with each conducting for 50% of the cycle, achieve a higher efficiency of approximately 78.5%.
This configuration is more favorable for applications requiring better energy utilization. Furthermore, Class AB amplifiers present a balanced solution, with each transistor conducting slightly more than 50% to reduce crossover distortion, resulting in an efficiency range of 50-70%. This compromise between Class A and Class B configurations makes Class AB amplifiers suitable for applications where both efficiency and performance are crucial.
Strategic investments and continuous innovation in amplifier technologies are paramount for companies to maintain a competitive edge. Emphasis on improving amplifier efficiency while maintaining signal integrity will drive advancements in this market. As industries increasingly prioritize energy-efficient solutions, the power amplifier market is expected to experience robust growth, supported by the ongoing evolution of wireless communication and the proliferation of electric vehicles.
Key Takeaways
- Market Growth: The Global Power Amplifier Market was valued at USD 15.7 billion in 2023. It is expected to reach USD 44.6 billion by 2033, with a CAGR of 11.3% during the forecast period from 2024 to 2033.
- By Type: Radiofrequency (RF) power amplifiers dominate with a 40% market share.
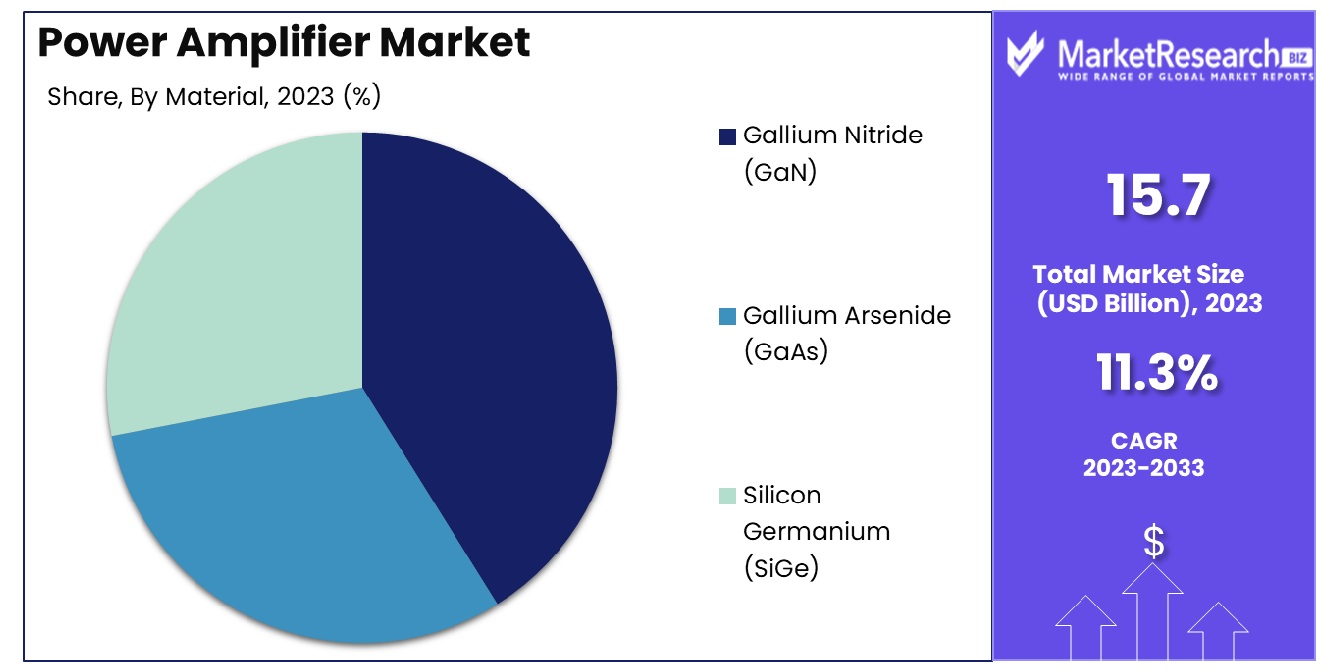
- By Material: Gallium Nitride (GaN) leads materials usage at 45% dominance.
- By End-user: Consumer electronics is the top end-user, holding 50% dominance.
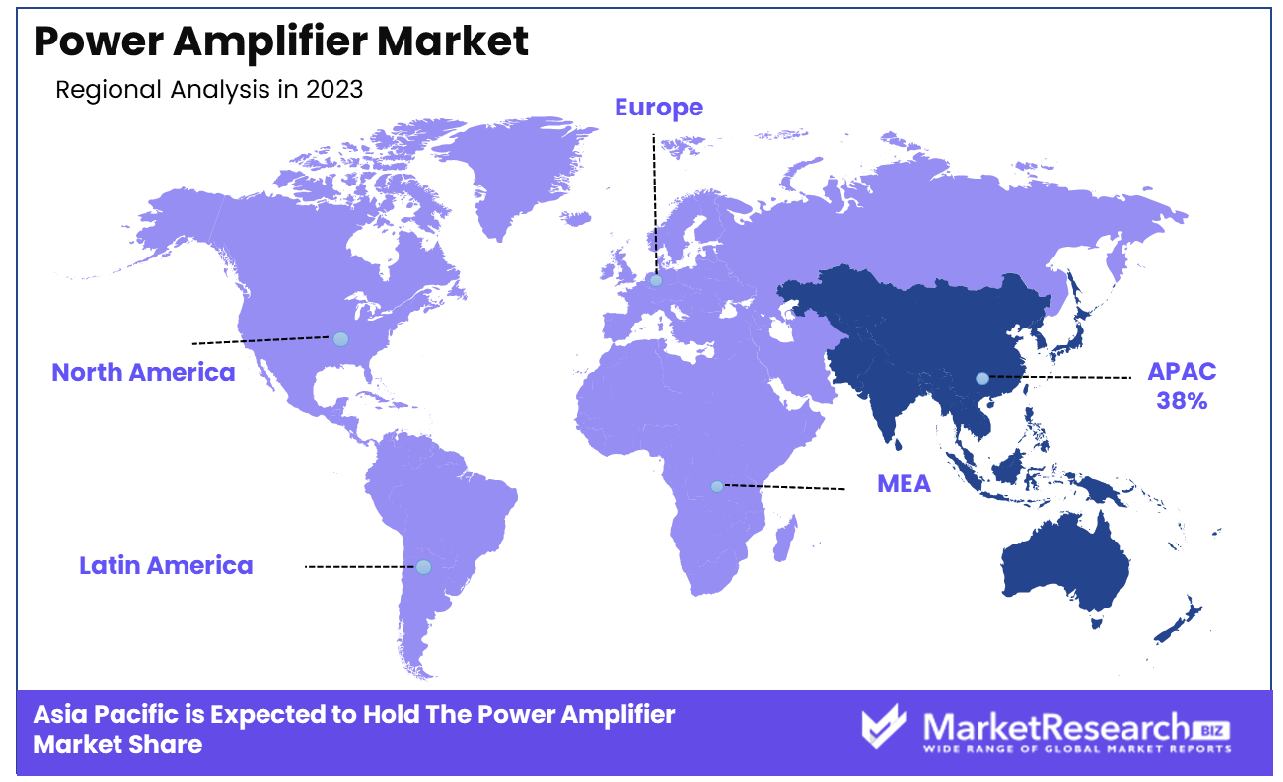
- Regional Dominance: Asia Pacific leads the power amplifier market with a 38% share.
Driving factors
Enhancing Wireless Communication Systems: Catalyst for Power Amplifier Market Expansion
The surge in demand for high-performance wireless communication systems is a pivotal driver for the Power Amplifier Market. As wireless communication technology evolves, there is a growing need for devices that can handle higher data rates and provide better signal quality. Power amplifiers play a crucial role in achieving these objectives by boosting the power of the transmitted signals to ensure clear and reliable communication over longer distances.
This need is particularly pronounced with the ongoing global shift towards IoT and smart devices, which require robust communication links to function effectively. The increasing integration of these technologies in various sectors, including healthcare, automotive, and industrial applications, underpins the rising demand for advanced power amplifiers.
Consumer Electronics: A Robust Growth Avenue for Power Amplifiers
The consumer electronics sector, encompassing devices like smartphones, tablets, and laptops, remains a substantial growth area for the Power Amplifier Market. As consumer demand for devices with enhanced connectivity and prolonged battery life escalates, manufacturers are increasingly focusing on incorporating efficient power amplifiers that minimize power loss and improve performance.
Statistically, the consumer electronics market is expected to grow significantly, further bolstering the demand for power amplifiers that can meet the high standards of modern electronic devices.
5G Network Expansion: A Strategic Growth Pillar for Power Amplifiers
The global rollout of 5G networks is another critical factor driving the Power Amplifier Market. 5G technology promises faster data speeds, reduced latency, and higher capacity, which necessitates the deployment of power amplifiers capable of supporting these enhanced features.
The expansion of 5G infrastructure not only increases the volume of power amplifiers needed but also the development of new types capable of handling the advanced frequencies utilized by 5G technology. As countries and companies invest heavily in building 5G infrastructure, the demand for these specialized power amplifiers is expected to skyrocket, providing a significant growth trajectory for the market.
Restraining Factors
Overcoming Technical Challenges: Enhancing Power Efficiency in Power Amplifiers
Technical challenges related to power efficiency significantly influence the growth of the Power Amplifier Market. Power amplifiers, particularly those used in high-frequency applications like telecommunications and broadcasting, traditionally suffer from power inefficiencies, where a substantial portion of the power they consume is lost as heat rather than being effectively converted into signal power. Addressing these inefficiencies is crucial as the demand for energy-efficient devices escalates, especially in sectors sensitive to power consumption and heat generation.
Innovations that improve efficiency not only enhance the performance of power amplifiers but also meet the stringent energy regulations increasingly imposed worldwide. Consequently, advancements in technology that tackle these efficiency challenges can drive market growth by enabling the broader adoption of power amplifiers in emerging wireless applications and next-generation mobile networks.
Navigating High Development Costs: A Strategic Focus for Power Amplifier Manufacturers
The development of advanced power amplifiers, especially those designed to meet the needs of modern wireless and broadband applications, involves significant costs. These expenses are attributable to the sophisticated design, high-quality materials, and complex manufacturing processes required to produce amplifiers that can operate efficiently at high frequencies and over wide bandwidths.
While these costs can be a barrier to entry for some manufacturers, they also represent a critical investment area for leading companies aiming to capitalize on the expansion of advanced telecommunications infrastructures, such as 5G. By investing in the development of high-performance, cost-efficient amplifiers, manufacturers can gain a competitive edge in a market that is increasingly driven by technological advancements. This strategic focus on managing and justifying high development costs through innovations that deliver superior performance and efficiency is essential for sustaining market growth and meeting evolving consumer and industrial demands.
By Type Analysis
Radiofrequency (RF) Power Amplifiers dominate the market, holding a 40% share in this segment.
In 2023, the Power Amplifier Market was categorized into three primary segments: Audio Power Amplifier, Radiofrequency (RF) Power Amplifier, and Linear Power Amplifier. Among these, the Radiofrequency (RF) Power Amplifier segment held a dominant position in the market's 'By Type' category, capturing more than a 40% share. This significant market share can be attributed to the extensive application of RF power amplifiers in burgeoning sectors such as telecommunications, broadcasting, and wireless communications.
The demand for RF power amplifiers has been driven by the global expansion of mobile network infrastructures and the increasing adoption of next-generation wireless communication standards. As 5G technology continues to be deployed worldwide, the requirement for high-efficiency and high-power density amplifiers to ensure broad coverage and enhanced data transmission capabilities has become crucial. This has resulted in substantial investments in RF technology, further propelling the growth of this segment.
Furthermore, the integration of IoT devices, which rely on RF signals to operate and communicate, has contributed to the expansion of the RF power amplifier market. The proliferation of IoT technology across various industries including automotive, healthcare, and manufacturing, is expected to sustain the demand for RF power amplifiers. This trend is likely to continue, fostering growth in this segment through technological advancements and innovation.
Comparatively, the Audio Power Amplifier and Linear Power Amplifier segments have also shown steady growth but have not reached the market penetration of the RF Power Amplifier. This illustrates the critical role that RF power amplifiers play in modern wireless communication infrastructures, highlighting their importance in the overall market dynamics of power amplifiers.
By Material Analysis
Gallium Nitride (GaN) is the leading material in power amplifiers, comprising 45% of the market.
In 2023, Gallium Nitride (GaN) held a dominant market position in the "By Material" segment of the Power Amplifier Market, capturing more than a 45% share. GaN's prominence in the market can be attributed to its superior characteristics such as high thermal conductivity, high voltage tolerance, and efficiency at high frequencies. These attributes make GaN ideal for high-power and high-frequency applications, thus driving its adoption in sectors such as telecommunications and military.
Following GaN, Gallium Arsenide (GaAs) and Silicon Germanium (SiGe) also held significant positions within the market. GaAs accounted for approximately 35% of the market share. This material is favored for its exceptional electron mobility, which is crucial for high-speed and radio frequency applications. GaAs is predominantly utilized in applications requiring high efficiency and low noise, bolstering its market presence.
Silicon Germanium (SiGe) captured a market share of about 20%. SiGe is increasingly recognized for its ability to provide a cost-effective solution with moderate performance metrics in terms of frequency and power capabilities. It is commonly applied in consumer electronics and other lower-power applications due to its integration ease and manufacturing scalability.
The distribution of market shares among these materials highlights the ongoing advancements and shifts in technology preferences in the Power Amplifier Market. GaN's leading position underscores the market's inclination towards materials that offer a combination of performance and efficiency, particularly in high-stakes applications where reliability and robustness are critical.
By End-user Analysis
Consumer electronics emerge as the primary end-user, commanding a 50% dominance in the market.
In 2023, the Power Amplifier Market was segmented by end-users into Consumer Electronics, Healthcare, Aerospace and Defense, Telecommunication, and Others (including Automotive, Energy and Power, and Oil and Gas). Among these, Consumer Electronics held a dominant market position, capturing more than a 50% share. This substantial market share can be primarily attributed to the escalating demand for high-performance electronic devices that require advanced power amplification solutions to enhance audio and video outputs.
The surge in demand within the Consumer Electronics segment is driven by the proliferation of smart devices, such as smartphones, smart TVs, and home audio systems, which incorporate power amplifiers to deliver improved sound quality and multimedia experiences. Additionally, the rapid advancements in technology and the growing consumer preference for portable and wireless devices have further fueled the expansion of this market segment.
The integration of power amplifiers into various consumer electronic products has been critical in achieving desirable performance standards and meeting the increasing expectations of end-users for superior quality and functionality. This has led to continuous innovation and development efforts by manufacturers to produce more efficient, compact, and cost-effective amplifiers.
While the Consumer Electronics segment commands the largest share, the other segments, including Healthcare, Aerospace and Defense, and Telecommunication, also contribute significantly to the market dynamics. Each of these sectors has specialized requirements that influence the development and adaptation of power amplifier technologies. The ongoing diversification of applications across these industries is expected to continuously shape the power amplifier market landscape.
Key Market Segments
By Type
- Audio Power Amplifier
- Radiofrequency (RF) Power Amplifier
- Linear Power Amplifier
By Material
- Gallium Nitride (GaN)
- Gallium Arsenide (GaAs)
- Silicon Germanium (SiGe)
By End-user
- Consumer Electronics -
- Healthcare
- Aerospace and Defense
- Telecommunication
- Others (Automotive, Energy and Power, and Oil and Gas)
Growth Opportunity
Adoption of IoT and Smart Devices: A Pivotal Growth Avenue
The global Power Amplifier Market is poised for substantial growth in 2023, driven largely by the accelerating adoption of IoT (Internet of Things) and smart devices across various sectors. As IoT devices, such as smart home systems, wearable technology, and connected industrial equipment, become more prevalent, the demand for power amplifiers that can efficiently manage and boost signal strength while maintaining energy efficiency is expected to surge.
These amplifiers are crucial for ensuring robust wireless connectivity, which is the backbone of IoT functionality. The integration of power amplifiers into these devices not only enhances their operational capabilities but also supports the proliferation of IoT technology in emerging markets, where connectivity is still developing. This trend presents significant opportunities for manufacturers and investors in the power amplifier domain to innovate and scale solutions that cater to a rapidly expanding market.
Advancements in Automotive Electronics: Fueling Demand for Power Amplifiers
Another significant opportunity in 2023 for the Power Amplifier Market stems from advancements in automotive electronics. Modern vehicles are increasingly equipped with sophisticated systems requiring reliable and powerful signal transmission solutions. This includes everything from advanced driver-assistance systems (ADAS) to infotainment and vehicle-to-everything (V2X) communications, all of which rely heavily on effective power amplification to function optimally.
As automotive manufacturers continue to push the boundaries of what's possible in car technology, the need for power amplifiers that can deliver high performance in harsh environments is critical. This specific demand creates a lucrative niche for power amplifier manufacturers, offering a clear path to tap into the expanding automotive sector, where electronics integration is becoming a standard rather than a luxury. This synergy between automotive advancements and power amplifier technology is expected to be a major growth driver in the market throughout 2023 and beyond.
Latest Trends
Development of GaN & SiC-based Power Amplifiers: Leading Technological Advancements
In 2023, one of the most significant trends shaping the global Power Amplifier Market is the development and increased adoption of Gallium Nitride (GaN) and Silicon Carbide (SiC)-based power amplifiers. These materials are pivotal in the next generation of power amplifier designs due to their ability to operate at higher voltages, temperatures, and efficiencies compared to traditional silicon-based amplifiers. GaN and SiC are particularly advantageous in applications requiring high power density and thermal conductivity, such as in military, satellite, and high-frequency telecommunications systems.
Their superior performance characteristics not only enhance the overall efficiency of these systems but also contribute to the downsizing of equipment. The shift towards GaN and SiC technology is a transformative trend that provides substantial performance improvements, driving broader market adoption and opening up new applications across diverse sectors.
Miniaturization of Power Amplifiers for Mobile Applications: Enhancing Device Integration
Another leading trend in 2023 is the miniaturization of power amplifiers, specifically for mobile applications. As the consumer electronics industry continues to evolve towards more compact yet powerful devices, the demand for smaller power amplifiers that do not compromise on performance has escalated. Miniaturized power amplifiers are crucial for mobile devices such as smartphones, tablets, and wearable technology, where space is at a premium but connectivity and battery life cannot be sacrificed.
Manufacturers are focusing on innovative design techniques and advanced materials that allow for the reduction in size of power amplifiers while maintaining or enhancing their efficiency and output. This trend not only meets the current consumer demand for sleeker, more efficient devices but also drives the Power Amplifier Market forward by integrating cutting-edge technology into everyday consumer electronics. The miniaturization trend is expected to continue driving market innovation and competitiveness, making it a critical area of focus for stakeholders in the power amplifier industry.
Regional Analysis
The Asia Pacific region dominates the power amplifier market, holding a substantial 38% market share.
The global market for power amplifiers is segmented into several key regions, each exhibiting distinct growth dynamics and market penetration. Asia Pacific emerges as the dominating region, accounting for approximately 38% of the market share. This substantial proportion is driven by robust manufacturing sectors, increasing adoption of high-performance electronics, and significant investments in telecommunications infrastructure across countries such as China, Japan, and South Korea.
North America also represents a significant portion of the market, propelled by advanced technological developments and high adoption rates of new technologies in consumer electronics and automotive sectors. The region benefits from the presence of leading industry players who are pioneering innovations in amplifier technologies.
Europe's market is characterized by stringent regulations regarding energy efficiency and a strong inclination towards adopting sustainable technologies, which drive the demand for high-efficiency power amplifiers. The region's focus on renewable energy sources further supports the integration of advanced power amplifiers in energy systems.
The Middle East & Africa (MEA) region, although smaller in comparison, is experiencing gradual growth due to the expanding telecommunications network and industrial development. The market in this region is expected to accelerate with increased investments in infrastructure and technological advancements.
Latin America, on the other hand, shows potential for growth in the power amplifier market amid rising consumer electronics usage and automotive industry growth. Economic stabilization and increasing urbanization are key factors enhancing the market landscape in this region.
Key Regions and Countries
North America
- The US
- Canada
- Rest of North America
Europe
- Germany
- France
- The UK
- Spain
- Netherlands
- Russia
- Italy
- Rest of Europe
Asia-Pacific
- China
- Japan
- Singapore
- Thailand
- South Korea
- Vietnam
- India
- New Zealand
- Rest of Asia Pacific
Latin America
- Mexico
- Brazil
- Rest of Latin America
Middle East & Africa
- Saudi Arabia
- South Africa
- UAE
- Rest of Middle East & Africa
Key Players Analysis
In 2023, the global Power Amplifier Market is significantly shaped by the strategic actions and innovations of major companies, each contributing uniquely to the industry's landscape. Texas Instruments Inc., with its broad portfolio, continues to lead in innovation, particularly in integrating advanced materials like GaN and SiC into their power amplifier designs. Renesas Electronics Corporation and Qualcomm Incorporated are at the forefront of developing power amplifiers that cater to the burgeoning needs of wireless and mobile communications, emphasizing the enhancement of connectivity solutions for next-generation telecommunications.
Skyworks Solutions, Inc., and Infineon Technologies AG have carved out strong positions by focusing on the miniaturization of power amplifiers, critical for mobile and IoT devices, ensuring their amplifiers are integral to consumer electronics. STMicroelectronics N.V. leverages its expertise in semiconductor technologies to provide highly efficient power amplifiers that meet the stringent requirements of automotive and industrial applications.
Broadcom Inc. continues to impact the market with its focus on high-performance analog and mixed-signal devices, whereas Toshiba Corporation strengthens its position through innovations tailored to robust and high-frequency applications. Analog Devices, Inc., known for its precision engineering, focuses on delivering high-quality amplifiers that enhance signal integrity and operational efficiency.
Lastly, NXP Semiconductors N.V. stands out with its strategic emphasis on integrating power amplifiers into a wider range of automotive electronics, aligning with the industry's shift towards more connected and autonomous vehicles. Collectively, these key players are not only advancing power amplifier technology but are also setting the competitive dynamics of the market, driving growth through technological innovations and strategic market expansions. Their continued focus on R&D and customer-centric solutions will likely keep them at the forefront of the Power Amplifier Market in 2023 and beyond.
Market Key Players
- Texas Instruments Inc.
- Renesas Electronics Corporation
- Qualcomm Incorporated.
- Skyworks Solutions, Inc.
- Infineon Technologies AG
- STMicroelectronics N.V.
- Broadcom Inc.
- Toshiba Corporation
- Analog Devices, Inc
- NXP Semiconductors N.V.
Recent Development
- In May 2024, Infineon Technologies AG expanded its manufacturing capabilities in Europe with a $200 million investment. This expansion is specifically aimed at increasing the production of power amplifiers used in automotive and industrial applications, signaling a strong growth outlook in these sectors.
- In February 2024, Texas Instruments Inc. released a new series of high-efficiency power amplifiers designed for mobile devices. This launch aims to meet the increasing demand for longer battery life in smartphones and tablets, enhancing user experience significantly.
- In January 2024, Qualcomm Incorporated announced a partnership with a leading tech company to co-develop next-generation power amplifiers for 5G networks. This collaboration is backed by a funding of $100 million, focusing on optimizing 5G performance and energy efficiency.
Report Scope
Report Features Description Market Value (2023) USD 15.7 Billion Forecast Revenue (2033) USD 44.6 Billion CAGR (2024-2032) 11.3% Base Year for Estimation 2023 Historic Period 2016-2023 Forecast Period 2024-2033 Report Coverage Revenue Forecast, Market Dynamics, COVID-19 Impact, Competitive Landscape, Recent Developments Segments Covered By Type(Audio Power Amplifier, Radiofrequency (RF) Power Amplifier, Linear Power Amplifier), By Material(Gallium Nitride (GaN), Gallium Arsenide (GaAs), Silicon Germanium (SiGe)), By End-user(Consumer Electronics, Healthcare, Aerospace and Defense, Telecommunication, Others (Automotive, Energy and Power, and Oil and Gas)) Regional Analysis North America - The US, Canada, Rest of North America, Europe - Germany, France, The UK, Spain, Italy, Russia, Netherlands, Rest of Europe, Asia-Pacific - China, Japan, South Korea, India, New Zealand, Singapore, Thailand, Vietnam, Rest of Asia Pacific, Latin America - Brazil, Mexico, Rest of Latin America, Middle East & Africa - South Africa, Saudi Arabia, UAE, Rest of Middle East & Africa Competitive Landscape Texas Instruments Inc., Renesas Electronics Corporation, Qualcomm Incorporated., Skyworks Solutions, Inc., Infineon Technologies AG, STMicroelectronics N.V., Broadcom Inc., Toshiba Corporation, Analog Devices, Inc, NXP Semiconductors N.V. Customization Scope Customization for segments, region/country-level will be provided. Moreover, additional customization can be done based on the requirements. Purchase Options We have three licenses to opt for Single User License, Multi-User License (Up to 5 Users), Corporate Use License (Unlimited User and Printable PDF) -
- 1. Executive Summary
- 1.1. Definition
- 1.2. Taxonomy
- 1.3. Research Scope
- 1.4. Key Analysis
- 1.5. Key Findings by Major Segments
- 1.6. Top strategies by Major Players
- 2. Global Power Amplifier Market Overview
- 2.1. Power Amplifier Market Dynamics
- 2.1.1. Drivers
- 2.1.2. Opportunities
- 2.1.3. Restraints
- 2.1.4. Challenges
- 2.2. Macro-economic Factors
- 2.3. Regulatory Framework
- 2.4. Market Investment Feasibility Index
- 2.5. PEST Analysis
- 2.6. PORTER’S Five Force Analysis
- 2.7. Drivers & Restraints Impact Analysis
- 2.8. Industry Chain Analysis
- 2.9. Cost Structure Analysis
- 2.10. Marketing Strategy
- 2.11. Russia-Ukraine War Impact Analysis
- 2.12. Opportunity Map Analysis
- 2.13. Market Competition Scenario Analysis
- 2.14. Product Life Cycle Analysis
- 2.15. Opportunity Orbits
- 2.16. Manufacturer Intensity Map
- 2.17. Major Companies sales by Value & Volume
- 2.1. Power Amplifier Market Dynamics
- 3. Global Power Amplifier Market Analysis, Opportunity and Forecast, 2016-2032
- 3.1. Global Power Amplifier Market Analysis, 2016-2021
- 3.2. Global Power Amplifier Market Opportunity and Forecast, 2023-2032
- 3.3. Global Power Amplifier Market Analysis, Opportunity and Forecast, By By Type, 2016-2032
- 3.3.1. Global Power Amplifier Market Analysis by By Type: Introduction
- 3.3.2. Market Size Absolute $ Opportunity Analysis and Forecast, By By Type, 2016-2032
- 3.3.3. Audio Power Amplifier
- 3.3.4. Radiofrequency (RF) Power Amplifier
- 3.3.5. Linear Power Amplifier
- 3.4. Global Power Amplifier Market Analysis, Opportunity and Forecast, By By Material, 2016-2032
- 3.4.1. Global Power Amplifier Market Analysis by By Material: Introduction
- 3.4.2. Market Size Absolute $ Opportunity Analysis and Forecast, By By Material, 2016-2032
- 3.4.3. Gallium Nitride (GaN)
- 3.4.4. Gallium Arsenide (GaAs)
- 3.4.5. Silicon Germanium (SiGe)
- 3.5. Global Power Amplifier Market Analysis, Opportunity and Forecast, By By End-user, 2016-2032
- 3.5.1. Global Power Amplifier Market Analysis by By End-user: Introduction
- 3.5.2. Market Size Absolute $ Opportunity Analysis and Forecast, By By End-user, 2016-2032
- 3.5.3. Consumer Electronics
- 3.5.4. Healthcare
- 3.5.5. Aerospace and Defense
- 3.5.6. Telecommunication
- 3.5.7. Others (Automotive, Energy and Power, and Oil and Gas)
- 4. North America Power Amplifier Market Analysis, Opportunity and Forecast, 2016-2032
- 4.1. North America Power Amplifier Market Analysis, 2016-2021
- 4.2. North America Power Amplifier Market Opportunity and Forecast, 2023-2032
- 4.3. North America Power Amplifier Market Analysis, Opportunity and Forecast, By By Type, 2016-2032
- 4.3.1. North America Power Amplifier Market Analysis by By Type: Introduction
- 4.3.2. Market Size Absolute $ Opportunity Analysis and Forecast, By By Type, 2016-2032
- 4.3.3. Audio Power Amplifier
- 4.3.4. Radiofrequency (RF) Power Amplifier
- 4.3.5. Linear Power Amplifier
- 4.4. North America Power Amplifier Market Analysis, Opportunity and Forecast, By By Material, 2016-2032
- 4.4.1. North America Power Amplifier Market Analysis by By Material: Introduction
- 4.4.2. Market Size Absolute $ Opportunity Analysis and Forecast, By By Material, 2016-2032
- 4.4.3. Gallium Nitride (GaN)
- 4.4.4. Gallium Arsenide (GaAs)
- 4.4.5. Silicon Germanium (SiGe)
- 4.5. North America Power Amplifier Market Analysis, Opportunity and Forecast, By By End-user, 2016-2032
- 4.5.1. North America Power Amplifier Market Analysis by By End-user: Introduction
- 4.5.2. Market Size Absolute $ Opportunity Analysis and Forecast, By By End-user, 2016-2032
- 4.5.3. Consumer Electronics
- 4.5.4. Healthcare
- 4.5.5. Aerospace and Defense
- 4.5.6. Telecommunication
- 4.5.7. Others (Automotive, Energy and Power, and Oil and Gas)
- 4.6. North America Power Amplifier Market Analysis, Opportunity and Forecast, By Country , 2016-2032
- 4.6.1. North America Power Amplifier Market Analysis by Country : Introduction
- 4.6.2. Market Size Absolute $ Opportunity Analysis and Forecast, Country , 2016-2032
- 4.6.2.1. The US
- 4.6.2.2. Canada
- 4.6.2.3. Mexico
- 5. Western Europe Power Amplifier Market Analysis, Opportunity and Forecast, 2016-2032
- 5.1. Western Europe Power Amplifier Market Analysis, 2016-2021
- 5.2. Western Europe Power Amplifier Market Opportunity and Forecast, 2023-2032
- 5.3. Western Europe Power Amplifier Market Analysis, Opportunity and Forecast, By By Type, 2016-2032
- 5.3.1. Western Europe Power Amplifier Market Analysis by By Type: Introduction
- 5.3.2. Market Size Absolute $ Opportunity Analysis and Forecast, By By Type, 2016-2032
- 5.3.3. Audio Power Amplifier
- 5.3.4. Radiofrequency (RF) Power Amplifier
- 5.3.5. Linear Power Amplifier
- 5.4. Western Europe Power Amplifier Market Analysis, Opportunity and Forecast, By By Material, 2016-2032
- 5.4.1. Western Europe Power Amplifier Market Analysis by By Material: Introduction
- 5.4.2. Market Size Absolute $ Opportunity Analysis and Forecast, By By Material, 2016-2032
- 5.4.3. Gallium Nitride (GaN)
- 5.4.4. Gallium Arsenide (GaAs)
- 5.4.5. Silicon Germanium (SiGe)
- 5.5. Western Europe Power Amplifier Market Analysis, Opportunity and Forecast, By By End-user, 2016-2032
- 5.5.1. Western Europe Power Amplifier Market Analysis by By End-user: Introduction
- 5.5.2. Market Size Absolute $ Opportunity Analysis and Forecast, By By End-user, 2016-2032
- 5.5.3. Consumer Electronics
- 5.5.4. Healthcare
- 5.5.5. Aerospace and Defense
- 5.5.6. Telecommunication
- 5.5.7. Others (Automotive, Energy and Power, and Oil and Gas)
- 5.6. Western Europe Power Amplifier Market Analysis, Opportunity and Forecast, By Country , 2016-2032
- 5.6.1. Western Europe Power Amplifier Market Analysis by Country : Introduction
- 5.6.2. Market Size Absolute $ Opportunity Analysis and Forecast, Country , 2016-2032
- 5.6.2.1. Germany
- 5.6.2.2. France
- 5.6.2.3. The UK
- 5.6.2.4. Spain
- 5.6.2.5. Italy
- 5.6.2.6. Portugal
- 5.6.2.7. Ireland
- 5.6.2.8. Austria
- 5.6.2.9. Switzerland
- 5.6.2.10. Benelux
- 5.6.2.11. Nordic
- 5.6.2.12. Rest of Western Europe
- 6. Eastern Europe Power Amplifier Market Analysis, Opportunity and Forecast, 2016-2032
- 6.1. Eastern Europe Power Amplifier Market Analysis, 2016-2021
- 6.2. Eastern Europe Power Amplifier Market Opportunity and Forecast, 2023-2032
- 6.3. Eastern Europe Power Amplifier Market Analysis, Opportunity and Forecast, By By Type, 2016-2032
- 6.3.1. Eastern Europe Power Amplifier Market Analysis by By Type: Introduction
- 6.3.2. Market Size Absolute $ Opportunity Analysis and Forecast, By By Type, 2016-2032
- 6.3.3. Audio Power Amplifier
- 6.3.4. Radiofrequency (RF) Power Amplifier
- 6.3.5. Linear Power Amplifier
- 6.4. Eastern Europe Power Amplifier Market Analysis, Opportunity and Forecast, By By Material, 2016-2032
- 6.4.1. Eastern Europe Power Amplifier Market Analysis by By Material: Introduction
- 6.4.2. Market Size Absolute $ Opportunity Analysis and Forecast, By By Material, 2016-2032
- 6.4.3. Gallium Nitride (GaN)
- 6.4.4. Gallium Arsenide (GaAs)
- 6.4.5. Silicon Germanium (SiGe)
- 6.5. Eastern Europe Power Amplifier Market Analysis, Opportunity and Forecast, By By End-user, 2016-2032
- 6.5.1. Eastern Europe Power Amplifier Market Analysis by By End-user: Introduction
- 6.5.2. Market Size Absolute $ Opportunity Analysis and Forecast, By By End-user, 2016-2032
- 6.5.3. Consumer Electronics
- 6.5.4. Healthcare
- 6.5.5. Aerospace and Defense
- 6.5.6. Telecommunication
- 6.5.7. Others (Automotive, Energy and Power, and Oil and Gas)
- 6.6. Eastern Europe Power Amplifier Market Analysis, Opportunity and Forecast, By Country , 2016-2032
- 6.6.1. Eastern Europe Power Amplifier Market Analysis by Country : Introduction
- 6.6.2. Market Size Absolute $ Opportunity Analysis and Forecast, Country , 2016-2032
- 6.6.2.1. Russia
- 6.6.2.2. Poland
- 6.6.2.3. The Czech Republic
- 6.6.2.4. Greece
- 6.6.2.5. Rest of Eastern Europe
- 7. APAC Power Amplifier Market Analysis, Opportunity and Forecast, 2016-2032
- 7.1. APAC Power Amplifier Market Analysis, 2016-2021
- 7.2. APAC Power Amplifier Market Opportunity and Forecast, 2023-2032
- 7.3. APAC Power Amplifier Market Analysis, Opportunity and Forecast, By By Type, 2016-2032
- 7.3.1. APAC Power Amplifier Market Analysis by By Type: Introduction
- 7.3.2. Market Size Absolute $ Opportunity Analysis and Forecast, By By Type, 2016-2032
- 7.3.3. Audio Power Amplifier
- 7.3.4. Radiofrequency (RF) Power Amplifier
- 7.3.5. Linear Power Amplifier
- 7.4. APAC Power Amplifier Market Analysis, Opportunity and Forecast, By By Material, 2016-2032
- 7.4.1. APAC Power Amplifier Market Analysis by By Material: Introduction
- 7.4.2. Market Size Absolute $ Opportunity Analysis and Forecast, By By Material, 2016-2032
- 7.4.3. Gallium Nitride (GaN)
- 7.4.4. Gallium Arsenide (GaAs)
- 7.4.5. Silicon Germanium (SiGe)
- 7.5. APAC Power Amplifier Market Analysis, Opportunity and Forecast, By By End-user, 2016-2032
- 7.5.1. APAC Power Amplifier Market Analysis by By End-user: Introduction
- 7.5.2. Market Size Absolute $ Opportunity Analysis and Forecast, By By End-user, 2016-2032
- 7.5.3. Consumer Electronics
- 7.5.4. Healthcare
- 7.5.5. Aerospace and Defense
- 7.5.6. Telecommunication
- 7.5.7. Others (Automotive, Energy and Power, and Oil and Gas)
- 7.6. APAC Power Amplifier Market Analysis, Opportunity and Forecast, By Country , 2016-2032
- 7.6.1. APAC Power Amplifier Market Analysis by Country : Introduction
- 7.6.2. Market Size Absolute $ Opportunity Analysis and Forecast, Country , 2016-2032
- 7.6.2.1. China
- 7.6.2.2. Japan
- 7.6.2.3. South Korea
- 7.6.2.4. India
- 7.6.2.5. Australia & New Zeland
- 7.6.2.6. Indonesia
- 7.6.2.7. Malaysia
- 7.6.2.8. Philippines
- 7.6.2.9. Singapore
- 7.6.2.10. Thailand
- 7.6.2.11. Vietnam
- 7.6.2.12. Rest of APAC
- 8. Latin America Power Amplifier Market Analysis, Opportunity and Forecast, 2016-2032
- 8.1. Latin America Power Amplifier Market Analysis, 2016-2021
- 8.2. Latin America Power Amplifier Market Opportunity and Forecast, 2023-2032
- 8.3. Latin America Power Amplifier Market Analysis, Opportunity and Forecast, By By Type, 2016-2032
- 8.3.1. Latin America Power Amplifier Market Analysis by By Type: Introduction
- 8.3.2. Market Size Absolute $ Opportunity Analysis and Forecast, By By Type, 2016-2032
- 8.3.3. Audio Power Amplifier
- 8.3.4. Radiofrequency (RF) Power Amplifier
- 8.3.5. Linear Power Amplifier
- 8.4. Latin America Power Amplifier Market Analysis, Opportunity and Forecast, By By Material, 2016-2032
- 8.4.1. Latin America Power Amplifier Market Analysis by By Material: Introduction
- 8.4.2. Market Size Absolute $ Opportunity Analysis and Forecast, By By Material, 2016-2032
- 8.4.3. Gallium Nitride (GaN)
- 8.4.4. Gallium Arsenide (GaAs)
- 8.4.5. Silicon Germanium (SiGe)
- 8.5. Latin America Power Amplifier Market Analysis, Opportunity and Forecast, By By End-user, 2016-2032
- 8.5.1. Latin America Power Amplifier Market Analysis by By End-user: Introduction
- 8.5.2. Market Size Absolute $ Opportunity Analysis and Forecast, By By End-user, 2016-2032
- 8.5.3. Consumer Electronics
- 8.5.4. Healthcare
- 8.5.5. Aerospace and Defense
- 8.5.6. Telecommunication
- 8.5.7. Others (Automotive, Energy and Power, and Oil and Gas)
- 8.6. Latin America Power Amplifier Market Analysis, Opportunity and Forecast, By Country , 2016-2032
- 8.6.1. Latin America Power Amplifier Market Analysis by Country : Introduction
- 8.6.2. Market Size Absolute $ Opportunity Analysis and Forecast, Country , 2016-2032
- 8.6.2.1. Brazil
- 8.6.2.2. Colombia
- 8.6.2.3. Chile
- 8.6.2.4. Argentina
- 8.6.2.5. Costa Rica
- 8.6.2.6. Rest of Latin America
- 9. Middle East & Africa Power Amplifier Market Analysis, Opportunity and Forecast, 2016-2032
- 9.1. Middle East & Africa Power Amplifier Market Analysis, 2016-2021
- 9.2. Middle East & Africa Power Amplifier Market Opportunity and Forecast, 2023-2032
- 9.3. Middle East & Africa Power Amplifier Market Analysis, Opportunity and Forecast, By By Type, 2016-2032
- 9.3.1. Middle East & Africa Power Amplifier Market Analysis by By Type: Introduction
- 9.3.2. Market Size Absolute $ Opportunity Analysis and Forecast, By By Type, 2016-2032
- 9.3.3. Audio Power Amplifier
- 9.3.4. Radiofrequency (RF) Power Amplifier
- 9.3.5. Linear Power Amplifier
- 9.4. Middle East & Africa Power Amplifier Market Analysis, Opportunity and Forecast, By By Material, 2016-2032
- 9.4.1. Middle East & Africa Power Amplifier Market Analysis by By Material: Introduction
- 9.4.2. Market Size Absolute $ Opportunity Analysis and Forecast, By By Material, 2016-2032
- 9.4.3. Gallium Nitride (GaN)
- 9.4.4. Gallium Arsenide (GaAs)
- 9.4.5. Silicon Germanium (SiGe)
- 9.5. Middle East & Africa Power Amplifier Market Analysis, Opportunity and Forecast, By By End-user, 2016-2032
- 9.5.1. Middle East & Africa Power Amplifier Market Analysis by By End-user: Introduction
- 9.5.2. Market Size Absolute $ Opportunity Analysis and Forecast, By By End-user, 2016-2032
- 9.5.3. Consumer Electronics
- 9.5.4. Healthcare
- 9.5.5. Aerospace and Defense
- 9.5.6. Telecommunication
- 9.5.7. Others (Automotive, Energy and Power, and Oil and Gas)
- 9.6. Middle East & Africa Power Amplifier Market Analysis, Opportunity and Forecast, By Country , 2016-2032
- 9.6.1. Middle East & Africa Power Amplifier Market Analysis by Country : Introduction
- 9.6.2. Market Size Absolute $ Opportunity Analysis and Forecast, Country , 2016-2032
- 9.6.2.1. Algeria
- 9.6.2.2. Egypt
- 9.6.2.3. Israel
- 9.6.2.4. Kuwait
- 9.6.2.5. Nigeria
- 9.6.2.6. Saudi Arabia
- 9.6.2.7. South Africa
- 9.6.2.8. Turkey
- 9.6.2.9. The UAE
- 9.6.2.10. Rest of MEA
- 10. Global Power Amplifier Market Analysis, Opportunity and Forecast, By Region , 2016-2032
- 10.1. Global Power Amplifier Market Analysis by Region : Introduction
- 10.2. Market Size Absolute $ Opportunity Analysis and Forecast, By Region , 2016-2032
- 10.2.1. North America
- 10.2.2. Western Europe
- 10.2.3. Eastern Europe
- 10.2.4. APAC
- 10.2.5. Latin America
- 10.2.6. Middle East & Africa
- 11. Global Power Amplifier Market Competitive Landscape, Market Share Analysis, and Company Profiles
- 11.1. Market Share Analysis
- 11.2. Company Profiles
- 11.3. Texas Instruments Inc.
- 11.3.1. Company Overview
- 11.3.2. Financial Highlights
- 11.3.3. Product Portfolio
- 11.3.4. SWOT Analysis
- 11.3.5. Key Strategies and Developments
- 11.4. Renesas Electronics Corporation
- 11.4.1. Company Overview
- 11.4.2. Financial Highlights
- 11.4.3. Product Portfolio
- 11.4.4. SWOT Analysis
- 11.4.5. Key Strategies and Developments
- 11.5. Qualcomm Incorporated.
- 11.5.1. Company Overview
- 11.5.2. Financial Highlights
- 11.5.3. Product Portfolio
- 11.5.4. SWOT Analysis
- 11.5.5. Key Strategies and Developments
- 11.6. Skyworks Solutions, Inc.
- 11.6.1. Company Overview
- 11.6.2. Financial Highlights
- 11.6.3. Product Portfolio
- 11.6.4. SWOT Analysis
- 11.6.5. Key Strategies and Developments
- 11.7. Infineon Technologies AG
- 11.7.1. Company Overview
- 11.7.2. Financial Highlights
- 11.7.3. Product Portfolio
- 11.7.4. SWOT Analysis
- 11.7.5. Key Strategies and Developments
- 11.8. STMicroelectronics N.V.
- 11.8.1. Company Overview
- 11.8.2. Financial Highlights
- 11.8.3. Product Portfolio
- 11.8.4. SWOT Analysis
- 11.8.5. Key Strategies and Developments
- 11.9. Broadcom Inc.
- 11.9.1. Company Overview
- 11.9.2. Financial Highlights
- 11.9.3. Product Portfolio
- 11.9.4. SWOT Analysis
- 11.9.5. Key Strategies and Developments
- 11.10. Toshiba Corporation
- 11.10.1. Company Overview
- 11.10.2. Financial Highlights
- 11.10.3. Product Portfolio
- 11.10.4. SWOT Analysis
- 11.10.5. Key Strategies and Developments
- 11.11. Analog Devices, Inc
- 11.11.1. Company Overview
- 11.11.2. Financial Highlights
- 11.11.3. Product Portfolio
- 11.11.4. SWOT Analysis
- 11.11.5. Key Strategies and Developments
- 11.12. NXP Semiconductors N.V.
- 11.12.1. Company Overview
- 11.12.2. Financial Highlights
- 11.12.3. Product Portfolio
- 11.12.4. SWOT Analysis
- 11.12.5. Key Strategies and Developments
- 11.13.1. Company Overview
- 11.13.2. Financial Highlights
- 11.13.3. Product Portfolio
- 11.13.4. SWOT Analysis
- 11.13.5. Key Strategies and Developments
- 12. Assumptions and Acronyms
- 13. Research Methodology
- 14. Contact
"
- List of Figures
- "
- Figure 1: Global Power Amplifier Market Revenue (US$ Mn) Market Share by By Type in 2022
- Figure 2: Global Power Amplifier Market Market Attractiveness Analysis by By Type, 2016-2032
- Figure 3: Global Power Amplifier Market Revenue (US$ Mn) Market Share by By Materialin 2022
- Figure 4: Global Power Amplifier Market Market Attractiveness Analysis by By Material, 2016-2032
- Figure 5: Global Power Amplifier Market Revenue (US$ Mn) Market Share by By End-userin 2022
- Figure 6: Global Power Amplifier Market Market Attractiveness Analysis by By End-user, 2016-2032
- Figure 7: Global Power Amplifier Market Revenue (US$ Mn) Market Share by Region in 2022
- Figure 8: Global Power Amplifier Market Market Attractiveness Analysis by Region, 2016-2032
- Figure 9: Global Power Amplifier Market Market Revenue (US$ Mn) (2016-2032)
- Figure 10: Global Power Amplifier Market Market Revenue (US$ Mn) Comparison by Region (2016-2032)
- Figure 11: Global Power Amplifier Market Market Revenue (US$ Mn) Comparison by By Type (2016-2032)
- Figure 12: Global Power Amplifier Market Market Revenue (US$ Mn) Comparison by By Material (2016-2032)
- Figure 13: Global Power Amplifier Market Market Revenue (US$ Mn) Comparison by By End-user (2016-2032)
- Figure 14: Global Power Amplifier Market Market Y-o-Y Growth Rate Comparison by Region (2016-2032)
- Figure 15: Global Power Amplifier Market Market Y-o-Y Growth Rate Comparison by By Type (2016-2032)
- Figure 16: Global Power Amplifier Market Market Y-o-Y Growth Rate Comparison by By Material (2016-2032)
- Figure 17: Global Power Amplifier Market Market Y-o-Y Growth Rate Comparison by By End-user (2016-2032)
- Figure 18: Global Power Amplifier Market Market Share Comparison by Region (2016-2032)
- Figure 19: Global Power Amplifier Market Market Share Comparison by By Type (2016-2032)
- Figure 20: Global Power Amplifier Market Market Share Comparison by By Material (2016-2032)
- Figure 21: Global Power Amplifier Market Market Share Comparison by By End-user (2016-2032)
- Figure 22: North America Power Amplifier Market Revenue (US$ Mn) Market Share by By Typein 2022
- Figure 23: North America Power Amplifier Market Market Attractiveness Analysis by By Type, 2016-2032
- Figure 24: North America Power Amplifier Market Revenue (US$ Mn) Market Share by By Materialin 2022
- Figure 25: North America Power Amplifier Market Market Attractiveness Analysis by By Material, 2016-2032
- Figure 26: North America Power Amplifier Market Revenue (US$ Mn) Market Share by By End-userin 2022
- Figure 27: North America Power Amplifier Market Market Attractiveness Analysis by By End-user, 2016-2032
- Figure 28: North America Power Amplifier Market Revenue (US$ Mn) Market Share by Country in 2022
- Figure 29: North America Power Amplifier Market Market Attractiveness Analysis by Country, 2016-2032
- Figure 30: North America Power Amplifier Market Market Revenue (US$ Mn) (2016-2032)
- Figure 31: North America Power Amplifier Market Market Revenue (US$ Mn) Comparison by Country (2016-2032)
- Figure 32: North America Power Amplifier Market Market Revenue (US$ Mn) Comparison by By Type (2016-2032)
- Figure 33: North America Power Amplifier Market Market Revenue (US$ Mn) Comparison by By Material (2016-2032)
- Figure 34: North America Power Amplifier Market Market Revenue (US$ Mn) Comparison by By End-user (2016-2032)
- Figure 35: North America Power Amplifier Market Market Y-o-Y Growth Rate Comparison by Country (2016-2032)
- Figure 36: North America Power Amplifier Market Market Y-o-Y Growth Rate Comparison by By Type (2016-2032)
- Figure 37: North America Power Amplifier Market Market Y-o-Y Growth Rate Comparison by By Material (2016-2032)
- Figure 38: North America Power Amplifier Market Market Y-o-Y Growth Rate Comparison by By End-user (2016-2032)
- Figure 39: North America Power Amplifier Market Market Share Comparison by Country (2016-2032)
- Figure 40: North America Power Amplifier Market Market Share Comparison by By Type (2016-2032)
- Figure 41: North America Power Amplifier Market Market Share Comparison by By Material (2016-2032)
- Figure 42: North America Power Amplifier Market Market Share Comparison by By End-user (2016-2032)
- Figure 43: Western Europe Power Amplifier Market Revenue (US$ Mn) Market Share by By Typein 2022
- Figure 44: Western Europe Power Amplifier Market Market Attractiveness Analysis by By Type, 2016-2032
- Figure 45: Western Europe Power Amplifier Market Revenue (US$ Mn) Market Share by By Materialin 2022
- Figure 46: Western Europe Power Amplifier Market Market Attractiveness Analysis by By Material, 2016-2032
- Figure 47: Western Europe Power Amplifier Market Revenue (US$ Mn) Market Share by By End-userin 2022
- Figure 48: Western Europe Power Amplifier Market Market Attractiveness Analysis by By End-user, 2016-2032
- Figure 49: Western Europe Power Amplifier Market Revenue (US$ Mn) Market Share by Country in 2022
- Figure 50: Western Europe Power Amplifier Market Market Attractiveness Analysis by Country, 2016-2032
- Figure 51: Western Europe Power Amplifier Market Market Revenue (US$ Mn) (2016-2032)
- Figure 52: Western Europe Power Amplifier Market Market Revenue (US$ Mn) Comparison by Country (2016-2032)
- Figure 53: Western Europe Power Amplifier Market Market Revenue (US$ Mn) Comparison by By Type (2016-2032)
- Figure 54: Western Europe Power Amplifier Market Market Revenue (US$ Mn) Comparison by By Material (2016-2032)
- Figure 55: Western Europe Power Amplifier Market Market Revenue (US$ Mn) Comparison by By End-user (2016-2032)
- Figure 56: Western Europe Power Amplifier Market Market Y-o-Y Growth Rate Comparison by Country (2016-2032)
- Figure 57: Western Europe Power Amplifier Market Market Y-o-Y Growth Rate Comparison by By Type (2016-2032)
- Figure 58: Western Europe Power Amplifier Market Market Y-o-Y Growth Rate Comparison by By Material (2016-2032)
- Figure 59: Western Europe Power Amplifier Market Market Y-o-Y Growth Rate Comparison by By End-user (2016-2032)
- Figure 60: Western Europe Power Amplifier Market Market Share Comparison by Country (2016-2032)
- Figure 61: Western Europe Power Amplifier Market Market Share Comparison by By Type (2016-2032)
- Figure 62: Western Europe Power Amplifier Market Market Share Comparison by By Material (2016-2032)
- Figure 63: Western Europe Power Amplifier Market Market Share Comparison by By End-user (2016-2032)
- Figure 64: Eastern Europe Power Amplifier Market Revenue (US$ Mn) Market Share by By Typein 2022
- Figure 65: Eastern Europe Power Amplifier Market Market Attractiveness Analysis by By Type, 2016-2032
- Figure 66: Eastern Europe Power Amplifier Market Revenue (US$ Mn) Market Share by By Materialin 2022
- Figure 67: Eastern Europe Power Amplifier Market Market Attractiveness Analysis by By Material, 2016-2032
- Figure 68: Eastern Europe Power Amplifier Market Revenue (US$ Mn) Market Share by By End-userin 2022
- Figure 69: Eastern Europe Power Amplifier Market Market Attractiveness Analysis by By End-user, 2016-2032
- Figure 70: Eastern Europe Power Amplifier Market Revenue (US$ Mn) Market Share by Country in 2022
- Figure 71: Eastern Europe Power Amplifier Market Market Attractiveness Analysis by Country, 2016-2032
- Figure 72: Eastern Europe Power Amplifier Market Market Revenue (US$ Mn) (2016-2032)
- Figure 73: Eastern Europe Power Amplifier Market Market Revenue (US$ Mn) Comparison by Country (2016-2032)
- Figure 74: Eastern Europe Power Amplifier Market Market Revenue (US$ Mn) Comparison by By Type (2016-2032)
- Figure 75: Eastern Europe Power Amplifier Market Market Revenue (US$ Mn) Comparison by By Material (2016-2032)
- Figure 76: Eastern Europe Power Amplifier Market Market Revenue (US$ Mn) Comparison by By End-user (2016-2032)
- Figure 77: Eastern Europe Power Amplifier Market Market Y-o-Y Growth Rate Comparison by Country (2016-2032)
- Figure 78: Eastern Europe Power Amplifier Market Market Y-o-Y Growth Rate Comparison by By Type (2016-2032)
- Figure 79: Eastern Europe Power Amplifier Market Market Y-o-Y Growth Rate Comparison by By Material (2016-2032)
- Figure 80: Eastern Europe Power Amplifier Market Market Y-o-Y Growth Rate Comparison by By End-user (2016-2032)
- Figure 81: Eastern Europe Power Amplifier Market Market Share Comparison by Country (2016-2032)
- Figure 82: Eastern Europe Power Amplifier Market Market Share Comparison by By Type (2016-2032)
- Figure 83: Eastern Europe Power Amplifier Market Market Share Comparison by By Material (2016-2032)
- Figure 84: Eastern Europe Power Amplifier Market Market Share Comparison by By End-user (2016-2032)
- Figure 85: APAC Power Amplifier Market Revenue (US$ Mn) Market Share by By Typein 2022
- Figure 86: APAC Power Amplifier Market Market Attractiveness Analysis by By Type, 2016-2032
- Figure 87: APAC Power Amplifier Market Revenue (US$ Mn) Market Share by By Materialin 2022
- Figure 88: APAC Power Amplifier Market Market Attractiveness Analysis by By Material, 2016-2032
- Figure 89: APAC Power Amplifier Market Revenue (US$ Mn) Market Share by By End-userin 2022
- Figure 90: APAC Power Amplifier Market Market Attractiveness Analysis by By End-user, 2016-2032
- Figure 91: APAC Power Amplifier Market Revenue (US$ Mn) Market Share by Country in 2022
- Figure 92: APAC Power Amplifier Market Market Attractiveness Analysis by Country, 2016-2032
- Figure 93: APAC Power Amplifier Market Market Revenue (US$ Mn) (2016-2032)
- Figure 94: APAC Power Amplifier Market Market Revenue (US$ Mn) Comparison by Country (2016-2032)
- Figure 95: APAC Power Amplifier Market Market Revenue (US$ Mn) Comparison by By Type (2016-2032)
- Figure 96: APAC Power Amplifier Market Market Revenue (US$ Mn) Comparison by By Material (2016-2032)
- Figure 97: APAC Power Amplifier Market Market Revenue (US$ Mn) Comparison by By End-user (2016-2032)
- Figure 98: APAC Power Amplifier Market Market Y-o-Y Growth Rate Comparison by Country (2016-2032)
- Figure 99: APAC Power Amplifier Market Market Y-o-Y Growth Rate Comparison by By Type (2016-2032)
- Figure 100: APAC Power Amplifier Market Market Y-o-Y Growth Rate Comparison by By Material (2016-2032)
- Figure 101: APAC Power Amplifier Market Market Y-o-Y Growth Rate Comparison by By End-user (2016-2032)
- Figure 102: APAC Power Amplifier Market Market Share Comparison by Country (2016-2032)
- Figure 103: APAC Power Amplifier Market Market Share Comparison by By Type (2016-2032)
- Figure 104: APAC Power Amplifier Market Market Share Comparison by By Material (2016-2032)
- Figure 105: APAC Power Amplifier Market Market Share Comparison by By End-user (2016-2032)
- Figure 106: Latin America Power Amplifier Market Revenue (US$ Mn) Market Share by By Typein 2022
- Figure 107: Latin America Power Amplifier Market Market Attractiveness Analysis by By Type, 2016-2032
- Figure 108: Latin America Power Amplifier Market Revenue (US$ Mn) Market Share by By Materialin 2022
- Figure 109: Latin America Power Amplifier Market Market Attractiveness Analysis by By Material, 2016-2032
- Figure 110: Latin America Power Amplifier Market Revenue (US$ Mn) Market Share by By End-userin 2022
- Figure 111: Latin America Power Amplifier Market Market Attractiveness Analysis by By End-user, 2016-2032
- Figure 112: Latin America Power Amplifier Market Revenue (US$ Mn) Market Share by Country in 2022
- Figure 113: Latin America Power Amplifier Market Market Attractiveness Analysis by Country, 2016-2032
- Figure 114: Latin America Power Amplifier Market Market Revenue (US$ Mn) (2016-2032)
- Figure 115: Latin America Power Amplifier Market Market Revenue (US$ Mn) Comparison by Country (2016-2032)
- Figure 116: Latin America Power Amplifier Market Market Revenue (US$ Mn) Comparison by By Type (2016-2032)
- Figure 117: Latin America Power Amplifier Market Market Revenue (US$ Mn) Comparison by By Material (2016-2032)
- Figure 118: Latin America Power Amplifier Market Market Revenue (US$ Mn) Comparison by By End-user (2016-2032)
- Figure 119: Latin America Power Amplifier Market Market Y-o-Y Growth Rate Comparison by Country (2016-2032)
- Figure 120: Latin America Power Amplifier Market Market Y-o-Y Growth Rate Comparison by By Type (2016-2032)
- Figure 121: Latin America Power Amplifier Market Market Y-o-Y Growth Rate Comparison by By Material (2016-2032)
- Figure 122: Latin America Power Amplifier Market Market Y-o-Y Growth Rate Comparison by By End-user (2016-2032)
- Figure 123: Latin America Power Amplifier Market Market Share Comparison by Country (2016-2032)
- Figure 124: Latin America Power Amplifier Market Market Share Comparison by By Type (2016-2032)
- Figure 125: Latin America Power Amplifier Market Market Share Comparison by By Material (2016-2032)
- Figure 126: Latin America Power Amplifier Market Market Share Comparison by By End-user (2016-2032)
- Figure 127: Middle East & Africa Power Amplifier Market Revenue (US$ Mn) Market Share by By Typein 2022
- Figure 128: Middle East & Africa Power Amplifier Market Market Attractiveness Analysis by By Type, 2016-2032
- Figure 129: Middle East & Africa Power Amplifier Market Revenue (US$ Mn) Market Share by By Materialin 2022
- Figure 130: Middle East & Africa Power Amplifier Market Market Attractiveness Analysis by By Material, 2016-2032
- Figure 131: Middle East & Africa Power Amplifier Market Revenue (US$ Mn) Market Share by By End-userin 2022
- Figure 132: Middle East & Africa Power Amplifier Market Market Attractiveness Analysis by By End-user, 2016-2032
- Figure 133: Middle East & Africa Power Amplifier Market Revenue (US$ Mn) Market Share by Country in 2022
- Figure 134: Middle East & Africa Power Amplifier Market Market Attractiveness Analysis by Country, 2016-2032
- Figure 135: Middle East & Africa Power Amplifier Market Market Revenue (US$ Mn) (2016-2032)
- Figure 136: Middle East & Africa Power Amplifier Market Market Revenue (US$ Mn) Comparison by Country (2016-2032)
- Figure 137: Middle East & Africa Power Amplifier Market Market Revenue (US$ Mn) Comparison by By Type (2016-2032)
- Figure 138: Middle East & Africa Power Amplifier Market Market Revenue (US$ Mn) Comparison by By Material (2016-2032)
- Figure 139: Middle East & Africa Power Amplifier Market Market Revenue (US$ Mn) Comparison by By End-user (2016-2032)
- Figure 140: Middle East & Africa Power Amplifier Market Market Y-o-Y Growth Rate Comparison by Country (2016-2032)
- Figure 141: Middle East & Africa Power Amplifier Market Market Y-o-Y Growth Rate Comparison by By Type (2016-2032)
- Figure 142: Middle East & Africa Power Amplifier Market Market Y-o-Y Growth Rate Comparison by By Material (2016-2032)
- Figure 143: Middle East & Africa Power Amplifier Market Market Y-o-Y Growth Rate Comparison by By End-user (2016-2032)
- Figure 144: Middle East & Africa Power Amplifier Market Market Share Comparison by Country (2016-2032)
- Figure 145: Middle East & Africa Power Amplifier Market Market Share Comparison by By Type (2016-2032)
- Figure 146: Middle East & Africa Power Amplifier Market Market Share Comparison by By Material (2016-2032)
- Figure 147: Middle East & Africa Power Amplifier Market Market Share Comparison by By End-user (2016-2032)
"
- List of Tables
- "
- Table 1: Global Power Amplifier Market Market Comparison by By Type (2016-2032)
- Table 2: Global Power Amplifier Market Market Comparison by By Material (2016-2032)
- Table 3: Global Power Amplifier Market Market Comparison by By End-user (2016-2032)
- Table 4: Global Power Amplifier Market Revenue (US$ Mn) Comparison by Region (2016-2032)
- Table 5: Global Power Amplifier Market Market Revenue (US$ Mn) (2016-2032)
- Table 6: Global Power Amplifier Market Market Revenue (US$ Mn) Comparison by Region (2016-2032)
- Table 7: Global Power Amplifier Market Market Revenue (US$ Mn) Comparison by By Type (2016-2032)
- Table 8: Global Power Amplifier Market Market Revenue (US$ Mn) Comparison by By Material (2016-2032)
- Table 9: Global Power Amplifier Market Market Revenue (US$ Mn) Comparison by By End-user (2016-2032)
- Table 10: Global Power Amplifier Market Market Y-o-Y Growth Rate Comparison by Region (2016-2032)
- Table 11: Global Power Amplifier Market Market Y-o-Y Growth Rate Comparison by By Type (2016-2032)
- Table 12: Global Power Amplifier Market Market Y-o-Y Growth Rate Comparison by By Material (2016-2032)
- Table 13: Global Power Amplifier Market Market Y-o-Y Growth Rate Comparison by By End-user (2016-2032)
- Table 14: Global Power Amplifier Market Market Share Comparison by Region (2016-2032)
- Table 15: Global Power Amplifier Market Market Share Comparison by By Type (2016-2032)
- Table 16: Global Power Amplifier Market Market Share Comparison by By Material (2016-2032)
- Table 17: Global Power Amplifier Market Market Share Comparison by By End-user (2016-2032)
- Table 18: North America Power Amplifier Market Market Comparison by By Material (2016-2032)
- Table 19: North America Power Amplifier Market Market Comparison by By End-user (2016-2032)
- Table 20: North America Power Amplifier Market Revenue (US$ Mn) Comparison by Country (2016-2032)
- Table 21: North America Power Amplifier Market Market Revenue (US$ Mn) (2016-2032)
- Table 22: North America Power Amplifier Market Market Revenue (US$ Mn) Comparison by Country (2016-2032)
- Table 23: North America Power Amplifier Market Market Revenue (US$ Mn) Comparison by By Type (2016-2032)
- Table 24: North America Power Amplifier Market Market Revenue (US$ Mn) Comparison by By Material (2016-2032)
- Table 25: North America Power Amplifier Market Market Revenue (US$ Mn) Comparison by By End-user (2016-2032)
- Table 26: North America Power Amplifier Market Market Y-o-Y Growth Rate Comparison by Country (2016-2032)
- Table 27: North America Power Amplifier Market Market Y-o-Y Growth Rate Comparison by By Type (2016-2032)
- Table 28: North America Power Amplifier Market Market Y-o-Y Growth Rate Comparison by By Material (2016-2032)
- Table 29: North America Power Amplifier Market Market Y-o-Y Growth Rate Comparison by By End-user (2016-2032)
- Table 30: North America Power Amplifier Market Market Share Comparison by Country (2016-2032)
- Table 31: North America Power Amplifier Market Market Share Comparison by By Type (2016-2032)
- Table 32: North America Power Amplifier Market Market Share Comparison by By Material (2016-2032)
- Table 33: North America Power Amplifier Market Market Share Comparison by By End-user (2016-2032)
- Table 34: Western Europe Power Amplifier Market Market Comparison by By Type (2016-2032)
- Table 35: Western Europe Power Amplifier Market Market Comparison by By Material (2016-2032)
- Table 36: Western Europe Power Amplifier Market Market Comparison by By End-user (2016-2032)
- Table 37: Western Europe Power Amplifier Market Revenue (US$ Mn) Comparison by Country (2016-2032)
- Table 38: Western Europe Power Amplifier Market Market Revenue (US$ Mn) (2016-2032)
- Table 39: Western Europe Power Amplifier Market Market Revenue (US$ Mn) Comparison by Country (2016-2032)
- Table 40: Western Europe Power Amplifier Market Market Revenue (US$ Mn) Comparison by By Type (2016-2032)
- Table 41: Western Europe Power Amplifier Market Market Revenue (US$ Mn) Comparison by By Material (2016-2032)
- Table 42: Western Europe Power Amplifier Market Market Revenue (US$ Mn) Comparison by By End-user (2016-2032)
- Table 43: Western Europe Power Amplifier Market Market Y-o-Y Growth Rate Comparison by Country (2016-2032)
- Table 44: Western Europe Power Amplifier Market Market Y-o-Y Growth Rate Comparison by By Type (2016-2032)
- Table 45: Western Europe Power Amplifier Market Market Y-o-Y Growth Rate Comparison by By Material (2016-2032)
- Table 46: Western Europe Power Amplifier Market Market Y-o-Y Growth Rate Comparison by By End-user (2016-2032)
- Table 47: Western Europe Power Amplifier Market Market Share Comparison by Country (2016-2032)
- Table 48: Western Europe Power Amplifier Market Market Share Comparison by By Type (2016-2032)
- Table 49: Western Europe Power Amplifier Market Market Share Comparison by By Material (2016-2032)
- Table 50: Western Europe Power Amplifier Market Market Share Comparison by By End-user (2016-2032)
- Table 51: Eastern Europe Power Amplifier Market Market Comparison by By Type (2016-2032)
- Table 52: Eastern Europe Power Amplifier Market Market Comparison by By Material (2016-2032)
- Table 53: Eastern Europe Power Amplifier Market Market Comparison by By End-user (2016-2032)
- Table 54: Eastern Europe Power Amplifier Market Revenue (US$ Mn) Comparison by Country (2016-2032)
- Table 55: Eastern Europe Power Amplifier Market Market Revenue (US$ Mn) (2016-2032)
- Table 56: Eastern Europe Power Amplifier Market Market Revenue (US$ Mn) Comparison by Country (2016-2032)
- Table 57: Eastern Europe Power Amplifier Market Market Revenue (US$ Mn) Comparison by By Type (2016-2032)
- Table 58: Eastern Europe Power Amplifier Market Market Revenue (US$ Mn) Comparison by By Material (2016-2032)
- Table 59: Eastern Europe Power Amplifier Market Market Revenue (US$ Mn) Comparison by By End-user (2016-2032)
- Table 60: Eastern Europe Power Amplifier Market Market Y-o-Y Growth Rate Comparison by Country (2016-2032)
- Table 61: Eastern Europe Power Amplifier Market Market Y-o-Y Growth Rate Comparison by By Type (2016-2032)
- Table 62: Eastern Europe Power Amplifier Market Market Y-o-Y Growth Rate Comparison by By Material (2016-2032)
- Table 63: Eastern Europe Power Amplifier Market Market Y-o-Y Growth Rate Comparison by By End-user (2016-2032)
- Table 64: Eastern Europe Power Amplifier Market Market Share Comparison by Country (2016-2032)
- Table 65: Eastern Europe Power Amplifier Market Market Share Comparison by By Type (2016-2032)
- Table 66: Eastern Europe Power Amplifier Market Market Share Comparison by By Material (2016-2032)
- Table 67: Eastern Europe Power Amplifier Market Market Share Comparison by By End-user (2016-2032)
- Table 68: APAC Power Amplifier Market Market Comparison by By Type (2016-2032)
- Table 69: APAC Power Amplifier Market Market Comparison by By Material (2016-2032)
- Table 70: APAC Power Amplifier Market Market Comparison by By End-user (2016-2032)
- Table 71: APAC Power Amplifier Market Revenue (US$ Mn) Comparison by Country (2016-2032)
- Table 72: APAC Power Amplifier Market Market Revenue (US$ Mn) (2016-2032)
- Table 73: APAC Power Amplifier Market Market Revenue (US$ Mn) Comparison by Country (2016-2032)
- Table 74: APAC Power Amplifier Market Market Revenue (US$ Mn) Comparison by By Type (2016-2032)
- Table 75: APAC Power Amplifier Market Market Revenue (US$ Mn) Comparison by By Material (2016-2032)
- Table 76: APAC Power Amplifier Market Market Revenue (US$ Mn) Comparison by By End-user (2016-2032)
- Table 77: APAC Power Amplifier Market Market Y-o-Y Growth Rate Comparison by Country (2016-2032)
- Table 78: APAC Power Amplifier Market Market Y-o-Y Growth Rate Comparison by By Type (2016-2032)
- Table 79: APAC Power Amplifier Market Market Y-o-Y Growth Rate Comparison by By Material (2016-2032)
- Table 80: APAC Power Amplifier Market Market Y-o-Y Growth Rate Comparison by By End-user (2016-2032)
- Table 81: APAC Power Amplifier Market Market Share Comparison by Country (2016-2032)
- Table 82: APAC Power Amplifier Market Market Share Comparison by By Type (2016-2032)
- Table 83: APAC Power Amplifier Market Market Share Comparison by By Material (2016-2032)
- Table 84: APAC Power Amplifier Market Market Share Comparison by By End-user (2016-2032)
- Table 85: Latin America Power Amplifier Market Market Comparison by By Type (2016-2032)
- Table 86: Latin America Power Amplifier Market Market Comparison by By Material (2016-2032)
- Table 87: Latin America Power Amplifier Market Market Comparison by By End-user (2016-2032)
- Table 88: Latin America Power Amplifier Market Revenue (US$ Mn) Comparison by Country (2016-2032)
- Table 89: Latin America Power Amplifier Market Market Revenue (US$ Mn) (2016-2032)
- Table 90: Latin America Power Amplifier Market Market Revenue (US$ Mn) Comparison by Country (2016-2032)
- Table 91: Latin America Power Amplifier Market Market Revenue (US$ Mn) Comparison by By Type (2016-2032)
- Table 92: Latin America Power Amplifier Market Market Revenue (US$ Mn) Comparison by By Material (2016-2032)
- Table 93: Latin America Power Amplifier Market Market Revenue (US$ Mn) Comparison by By End-user (2016-2032)
- Table 94: Latin America Power Amplifier Market Market Y-o-Y Growth Rate Comparison by Country (2016-2032)
- Table 95: Latin America Power Amplifier Market Market Y-o-Y Growth Rate Comparison by By Type (2016-2032)
- Table 96: Latin America Power Amplifier Market Market Y-o-Y Growth Rate Comparison by By Material (2016-2032)
- Table 97: Latin America Power Amplifier Market Market Y-o-Y Growth Rate Comparison by By End-user (2016-2032)
- Table 98: Latin America Power Amplifier Market Market Share Comparison by Country (2016-2032)
- Table 99: Latin America Power Amplifier Market Market Share Comparison by By Type (2016-2032)
- Table 100: Latin America Power Amplifier Market Market Share Comparison by By Material (2016-2032)
- Table 101: Latin America Power Amplifier Market Market Share Comparison by By End-user (2016-2032)
- Table 102: Middle East & Africa Power Amplifier Market Market Comparison by By Type (2016-2032)
- Table 103: Middle East & Africa Power Amplifier Market Market Comparison by By Material (2016-2032)
- Table 104: Middle East & Africa Power Amplifier Market Market Comparison by By End-user (2016-2032)
- Table 105: Middle East & Africa Power Amplifier Market Revenue (US$ Mn) Comparison by Country (2016-2032)
- Table 106: Middle East & Africa Power Amplifier Market Market Revenue (US$ Mn) (2016-2032)
- Table 107: Middle East & Africa Power Amplifier Market Market Revenue (US$ Mn) Comparison by Country (2016-2032)
- Table 108: Middle East & Africa Power Amplifier Market Market Revenue (US$ Mn) Comparison by By Type (2016-2032)
- Table 109: Middle East & Africa Power Amplifier Market Market Revenue (US$ Mn) Comparison by By Material (2016-2032)
- Table 110: Middle East & Africa Power Amplifier Market Market Revenue (US$ Mn) Comparison by By End-user (2016-2032)
- Table 111: Middle East & Africa Power Amplifier Market Market Y-o-Y Growth Rate Comparison by Country (2016-2032)
- Table 112: Middle East & Africa Power Amplifier Market Market Y-o-Y Growth Rate Comparison by By Type (2016-2032)
- Table 113: Middle East & Africa Power Amplifier Market Market Y-o-Y Growth Rate Comparison by By Material (2016-2032)
- Table 114: Middle East & Africa Power Amplifier Market Market Y-o-Y Growth Rate Comparison by By End-user (2016-2032)
- Table 115: Middle East & Africa Power Amplifier Market Market Share Comparison by Country (2016-2032)
- Table 116: Middle East & Africa Power Amplifier Market Market Share Comparison by By Type (2016-2032)
- Table 117: Middle East & Africa Power Amplifier Market Market Share Comparison by By Material (2016-2032)
- Table 118: Middle East & Africa Power Amplifier Market Market Share Comparison by By End-user (2016-2032)
- 1. Executive Summary
-
- Texas Instruments Inc.
- Renesas Electronics Corporation
- Qualcomm Incorporated.
- Skyworks Solutions, Inc.
- Infineon Technologies AG
- STMicroelectronics N.V.
- Broadcom Inc.
- Toshiba Corporation
- Analog Devices, Inc
- NXP Semiconductors N.V.
Our Clients


View Our Licence Options
