
Plastic Compounding Market By Product (High-density polyethylene, Low-density polyethylene, Polypropylene, and Others), By Application (Automotive, Construction, Packaging, and Others ), By Region And Companies - Industry Segment Outlook, Market Assessment, Competition Scenario, Trends, And Forecast 2023-2032
-
6768
-
May 2023
-
181
-


-
This report was compiled by Kalyani Khudsange Kalyani Khudsange is a Research Analyst at Prudour Pvt. Ltd. with 2.5 years of experience in market research and a strong technical background in Chemical Engineering and manufacturing. Correspondence Sr. Research Analyst Linkedin | Detailed Market research Methodology Our methodology involves a mix of primary research, including interviews with leading mental health experts, and secondary research from reputable medical journals and databases. View Detailed Methodology Page
-
Quick Navigation
Report Overview
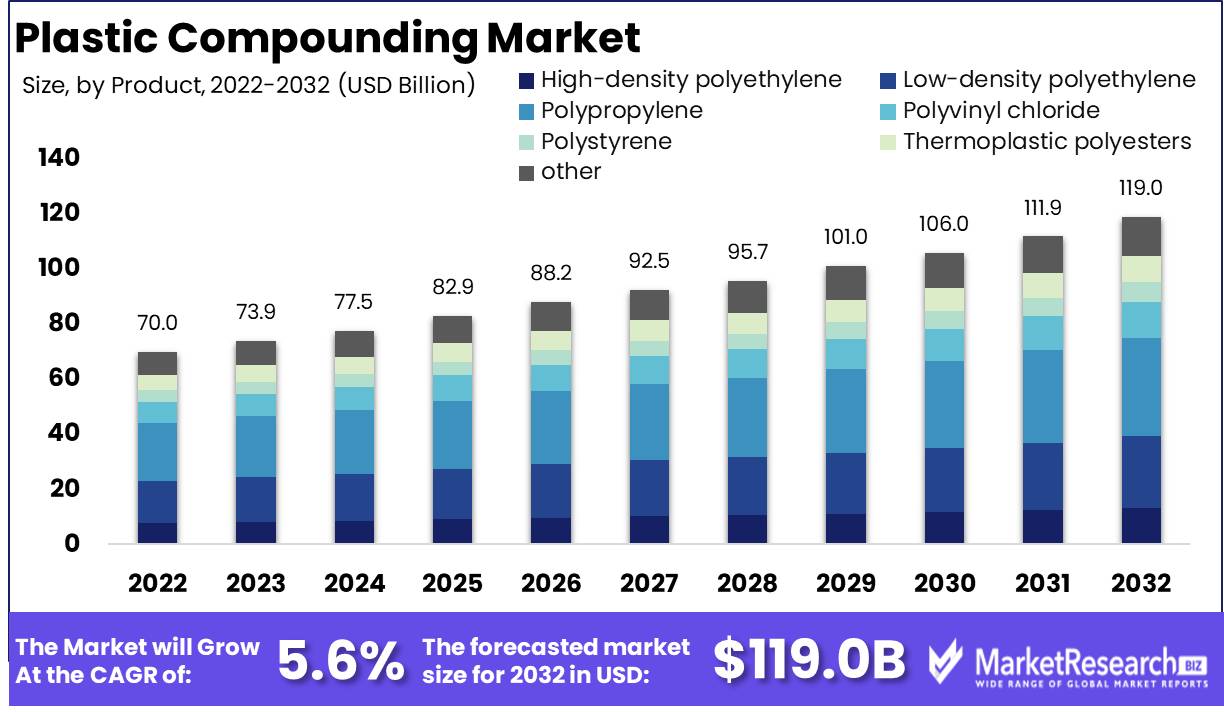
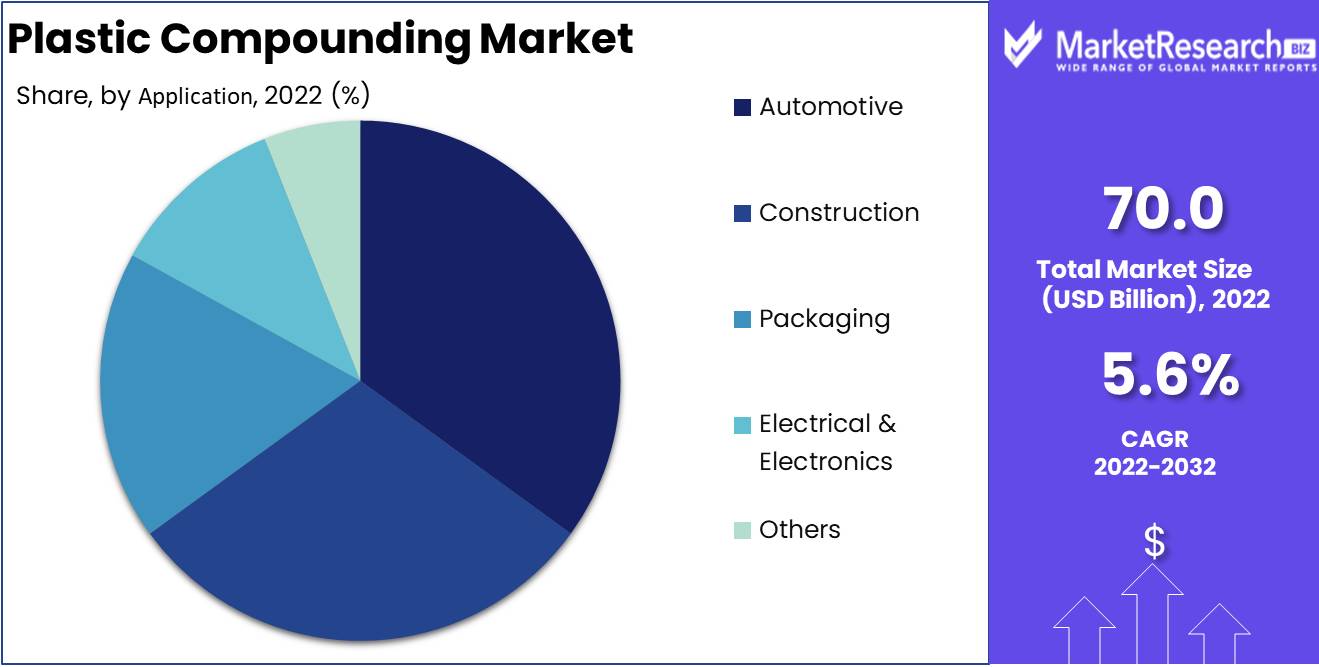
Plastic Compounding Market size is expected to be worth around USD 119.0 Bn by 2032 from USD 70.0 Bn in 2022, growing at a CAGR of 5.6% during the forecast period from 2023 to 2032.
The plastic compounding market has attracted a great deal of interest due to its increasing significance and advantageous applications. This market entails the process of combining multiple plastic materials to produce a new and superior combination. The purpose of plastic compounding is to improve the plastic's extant properties, such as its durability, strength, and resistance to various environmental factors. In recent years, the plastic compounding market has witnessed significant innovations, resulting in substantial investments and incorporation into numerous products and services.
The growth and applications of the plastic compounding market have been extraordinary, and industries have invested significantly in this sector. The market has become an essential component of numerous industries, including the automotive, construction, healthcare, and electronics sectors. The main drivers of the plastic compounding market are the demand for lightweight and durable materials, the rising demand for eco-friendly products, and the requirement for enhanced product functionality. However, ethical concerns and responsible use of plastic compounding have also become a significant concern, resulting in an emphasis on openness, explanation, and accountability.
The plastic compounding market has been integrated into a variety of business applications, resulting in the creation of novel goods and services. The automotive industry's use of plastic compounding to produce lightweight and durable car components is a notable instance. This has led to the development of environmentally-friendly, fuel-efficient automobiles. Another example is the use of plastic compounding in healthcare to create safe and effective medical devices. There are innumerable opportunities for future growth and innovation on the plastic compounding market due to recent developments.
Driving factors
Biodegradable and Bio-based Plastics Advancements
Advancements in biodegradable and bio-based polymers are expected to drive significant growth in the plastic compounding market. The demand for eco-friendly alternatives to conventional plastics has resulted in the creation of plastic compounds that not only reduce environmental impact, but also improve performance and durability.
Concentrate on the Recyclability of Plastic Compounds
Sustainable solutions for plastic waste management are acquiring prominence in the plastic compounding market. The development of recyclable plastic compounds is a step towards a more sustainable future, as it addresses the increase in plastic waste. The market is anticipated to expand as more industries adopt recyclable plastic compounds.
Three-dimensional Printing and Plastic Compounds
Utilizing plastic compounds in 3D printing is an emergent trend with positive market repercussions. Increasing demand for 3D printing across industries capitalizes on the capability of plastic compounds to create complex shapes and structures with high precision, thereby driving market expansion.
Stringent Rules and Sustainable Alternatives
Strict regulations on the use of plastic are driving the market development of sustainable alternatives. Globally, governments and regulatory bodies are instituting measures to reduce the consumption of traditional plastics, thereby creating opportunities for eco-friendly alternatives in the plastic compounding market.
Enhanced Rivalry and Innovation
Intensified competition among market leaders also drives market expansion. Companies are investing in R&D to pioneer innovative products and obtain a competitive advantage. This can lead to a variety of new products entering the market and satisfying the demand for sustainable plastic compounds.
Future Disruptors and Altering Consumer Behavior
Potential disruptors may have an impact on the competitive landscape of the plastic compounding market. Innovative products and technologies from new entrants can disrupt the market, compelling incumbents to remain proactive and competitive. Changing consumer behavior, such as a transition toward eco-friendly alternatives and a rising demand for sustainability, can have a substantial effect on market dynamics, compelling businesses to adapt and accommodate to evolving consumer preferences.
Restraining Factors
Reducing the consumption of plastic
To reduce consumption, over sixty nations have forbidden or taxed plastic packaging. These measures seek to reduce the current annual plastic consumption rate of over 300 million tons. These measures are necessary to mitigate the environmental harm caused by plastic consumption. However, reducing consumption alone is insufficient. To completely mitigate the issue, comprehensive solutions must be identified.
Absence of Regulations in Primary Plastic Production
The primary plastic production industry is not governed by stringent regulations. The absence of regulations makes it difficult to completely regulate the plastics industry. However, policies that target producers of basic materials can have indirect effects on the sector. Therefore, regulations or policies that target the production of basic materials could have a significant effect on the plastics industry.
Sustainable Plastics Contributing to Market Expansion
The manufacturing sector utilizes eco-friendly alternatives to plastics derived from petroleum oil, such as bioplastics. In manufacturing, sustainable plastics are acquiring traction, contributing to market expansion. Biodegradable sustainable plastics are derived from plant-based materials. This characteristic makes them eco-friendly and an ideal solution to the plastic problem.
Recycled Materials and Less Dependence on Fossil Fuels
Recycling plastic waste is crucial to reducing the global plastic waste problem. It can help reduce the negative effects of plastic consumption. In addition, it is crucial to reduce the plastics industry's reliance on fossil fuels. Reducing our reliance on nonrenewable fossil fuels will have a positive effect on the environment.
Production of Raw Materials Affected by Policies
The plastics industry can be indirectly impacted by policies aimed at raw material suppliers. To comply with these policies, companies involved in the production of basic materials may need to consider sustainable alternatives, such as bioplastics. Consequently, such policies can increase the demand for sustainable plastics, thereby contributing to market expansion.
Final Reflections
Reducing plastic consumption is essential for mitigating the negative environmental effects of plastic. Nonetheless, it is not a comprehensive solution. Sustainable plastics, such as bioplastics, are acquiring popularity in the manufacturing sector and could contribute to market expansion. Policies aimed at raw material production can have indirect effects on the entire plastics industry, and companies involved in raw material production may need to consider bioplastics and other sustainable alternatives in order to comply with the regulations. Globally, sustainable plastics offer a comprehensive solution to plastic consumption problems and promote the expansion of the plastics industry.
Product Analysis
Polypropylene Segment dominates plastic compounding market. Plastic compounding is rapidly gaining popularity as an effective way to enhance the properties of plastics, such as increase in strength, durability, and stiffness. Compounding involves blending multiple polymers, additives, and fillers, to create a customized plastic compound that meets the specific requirements of different industries. The polypropylene (PP) segment comprises the largest share of the plastic compounding market.
PP compounds offer excellent mechanical, thermal, and chemical resistance properties, which make them a preferred choice in various applications, including automotive, packaging, building and construction, and electrical and electronics. The fast-growing e-commerce industry is also driving the demand for PP-based compounds, primarily in the packaging industry. The development of e-commerce has resulted in the need for durable and secure packaging materials that can withstand the rigors of transportation and handling.
Application Analysis
Automotive Segment dominates plastic compounding market. The automotive industry is the largest consumer of plastic compounds, with the demand being driven by the increasing need for lightweight vehicles, enhanced safety features, and greater fuel efficiency. Plastic compounds are widely used in the manufacturing of various automotive parts, such as bumpers, instrument panels, and door trims, where they offer significant advantages compared to traditional materials, such as metal and glass.
Consumers are increasingly conscious about the safety and comfort features of their vehicles, and this has led to the growing demand for automotive parts that offer better performance and durability. Plastic compounds provide excellent thermal, mechanical, and chemical resistance properties, which make them an ideal choice for automotive applications.
Key Market Segments
By Product
- High-density polyethylene
- Low-density polyethylene
- Polypropylene
- Polyvinyl chloride
- Polystyrene
- Thermoplastic polyesters
- Others (polybutylene terephthalate, polyimide, polycarbonate, and acrylonitrile butadiene styrene)
By Application
- Automotive
- Construction
- Packaging
- Electrical & Electronics
- Others (industrial equipment and consumer goods)
Growth Opportunity
Performance is improved by bioplastic additives.
Clariant has introduced processing and dispersing additives derived from biomaterials for biopolymers. The additives improve the bio-plastics' rigidity, strength, durability, and thermal resistance, making them suitable for a variety of industrial applications. Clariant is positioning itself as a forerunner in the transition to a more sustainable future by investing in bio-plastic additives.
Functionally Superior Bio-Plastics
NeCycle, a high-performance bioplastic, was introduced by NEC Corporation. Produced from non-edible plant materials, it is reputed to have superior thermal resistance and mechanical strength. The company intends to supplant fossil-based materials in a variety of industries, including the automotive, electronics, and packaging sectors. NEC plays an essential role in the pursuit of a circular economy through the production of bio-plastics with high functionalities.
Bio-Plastic Substances
The demand for bio-based plastic compounds is driven by the demand for ecological plastics. To satisfy this demand, RTP Company is producing bio-plastic compounds with 20 to 80 percent bio-content. The bio-plastic compounds possess superior mechanical strength, chemical resistance, and shapeability. RTP's expertise in bio-plastic compounds enables industries to transition from plastics derived from fossil fuels to renewable plastics while saving money.
Demand is Fuelled by Sustainability
The increase in demand for bio-based plastic compounds is a result of the rising demand for eco-friendly and sustainable products. Utilizing bio-based compounds reduces greenhouse gas emissions and the carbon footprint. Additionally, consumers play an essential role by choosing ecological products in their daily lives. The transition to bio-based plastic compounds serves both environmental protection and the rising demand for eco-friendly products.
Latest Trends
Additives Identify the Properties of Blended Plastics
The properties of compounded plastics are largely determined by additives. Plastic compounders can enhance the durability, insulation, and weather resistance of plastic materials by adding various types and quantities of additives. The choice of additives depends on the final application of the plastic material. UV stabilizers, for instance, are added to outdoor applications to improve their resistance to deterioration, while flame retardants are added to electrical applications to improve their safety. Plastic compounders can produce plastics that are optimally adapted to their intended purpose by meticulously selecting the optimal additive combination.
Significant Compounders Creating New Additives
The plastic compounding industry is extremely competitive, and major compounders, such as Lanxess, continually invest in R&D to create new and improved additives. For instance, Lanxess has introduced a new line of glass fiber products that substantially improve the mechanical properties of plastics. It is anticipated that these novel products will find use in a variety of applications, including automotive, construction, and consumer goods.
Demand for Compound Plastics Is Growing
Diverse industries, including the culinary, beverage, textile, and consumer products sectors, are exhibiting a rising demand for compounded plastics. End-users favor packaging materials that are resilient, malleable, and aesthetically pleasing. In the food and beverage industry, the use of compounded plastics has increased expiration life and enhanced product quality. Additionally, compounded plastics are gaining popularity in the medical industry, where they can be sterilized to reduce the risk of infection.
Compound Plastics Decrease Contamination and Quality Decay
Not only do compounded plastics have superior properties to traditional plastics, but they also reduce the risk of product contamination and quality degradation. Improve the expiration life of food and beverage products, for instance, by reducing the moisture content of the packaging material. The enhanced chemical resistance and barrier properties of compound plastics further reduce the likelihood of contamination.
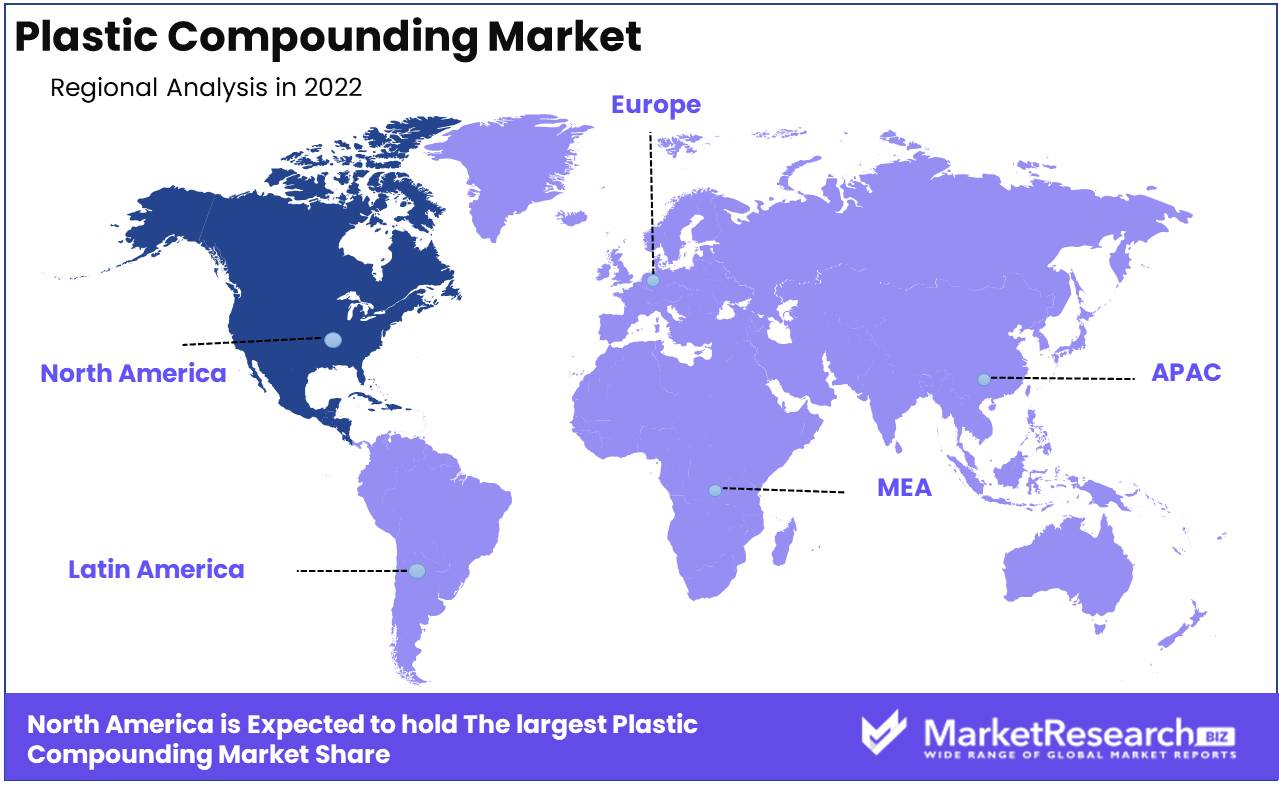
Regional Analysis
Comprehensive Analysis of the North American Plastic Compounding Market 2023-2032, according to the North American Plastic Compounding Market Forecast 2023-2032. Plastic compounds are utilized extensively in a variety of manufacturing and industrial applications due to their unique durability, flexibility, versatility, and strength. With technological advancements, the demand for high-performance plastic compounds has increased significantly.
The plastic compounding market in North America is segmented based on polymer type, product, application, and region. Polyethylene, polypropylene, polyvinyl chloride, polystyrene, and engineering thermoplastics are the primary polymer varieties. Color compounds, additive masterbatches, and performance polymer compounds comprise the product segment. Automotive, construction, packaging, electrical and electronic applications, and others, are the primary uses of plastic compounds in North America.
The United States dominates the North American plastic compounding market, followed by Canada and Mexico. Due to its advanced automotive, packaging, and construction industries, the United States is the largest regional consumer of plastic compounds. Canada has a high demand for plastic compounds, which is primarily driven by the automotive industry. The expansion of the construction industry and the rising demand for plastic compounds in the medical and aerospace industries have contributed to Mexico's rapid growth as a market.
The North American plastic compounding market is poised for steady development in the future years, driven by the increasing demand for lightweight and environmentally friendly materials across a variety of industries. The growing use of bioplastics and the introduction of new technologies such as 3D printing are also anticipated to generate new growth opportunities for plastic compound manufacturers. Nonetheless, the market confronts a number of obstacles, including environmental concerns associated with plastic usage and volatile raw material prices.
Key Regions and Countries
North America
- US
- Canada
- Mexico
Western Europe
- Germany
- France
- The UK
- Spain
- Italy
- Portugal
- Ireland
- Austria
- Switzerland
- Benelux
- Nordic
- Rest of Western Europe
Eastern Europe
- Russia
- Poland
- The Czech Republic
- Greece
- Rest of Eastern Europe
APAC
- China
- Japan
- South Korea
- India
- Australia & New Zealand
- Indonesia
- Malaysia
- Philippines
- Singapore
- Thailand
- Vietnam
- Rest of APAC
Latin America
- Brazil
- Colombia
- Chile
- Argentina
- Costa Rica
- Rest of Latin America
Middle East & Africa
- Algeria
- Egypt
- Israel
- Kuwait
- Nigeria
- Saudi Arabia
- South Africa
- Turkey
- United Arab Emirates
- Rest of MEA
Key Players Analysis
The plastic compounding market has gained significant traction, as plastic has become the most extensively used material in numerous industries. It is anticipated that Plastic Compounding Market will expand as manufacturers seek to expand their product offerings and develop new formulations for a variety of applications.
Akzo Nobel N.V., BASF SE, LyondellBasell Industries Holdings B.V., Covestro AG, SABIC, DuPont, and LG Chem are among the leading companies in the plastic compounding market. Each of these businesses has a comprehensive portfolio of products and services that caters to various market segments.
BASF SE is regarded as one of the most prominent participants in the plastic compounding market among these main players. Continuous acquisitions, collaborations, and partnerships have been executed by the company to expand its market presence. BASF SE offers a vast array of products and services for numerous industries, such as automotive, packaging, and electronics.
LyondellBasell Industries Holdings B.V. is an additional significant participant in the plastic compounding market that provides a wide variety of products for a variety of industrial applications. The company has been concentrating on portfolio optimization to increase its market presence. It has acquired A. Schulman Inc. to further solidify its position as an industry leader.
Top Key Players in Plastic Compounding Market
- LyondellBasell Industries N.V.
- BASF SE
- Saudi Basic Industries Corporation
- The Dow Chemical Company
- I. du Pont de Nemours and Company
- Kraton Polymers Inc.
- Solvay S.A.
- RTP Company, Inc.
- Schulman, Inc.
- Polyvisions Inc.
Recent Development
In 2020, BASF increased its production capacity in Mexico. This was in response to growing demand for the company's high-quality resins and compounds in Mexico and other Latin American markets.
In 2021, Arkema launched a new line of bio-based plastic compounds. These compounds are made from renewable materials, such as corn starch and sugarcane, and offer a more sustainable alternative to traditional plastics.
In 2022, Dow announced a new partnership with Solvay to develop high-performance plastic compounds. This partnership will allow the two companies to combine their expertise to develop new and innovative plastic compounds for a variety of applications.
In 2022, Kuraray opened a new compounding plant in China. This plant will produce a variety of plastic compounds for the Chinese market, which is one of the fastest-growing markets for plastics in the world.
Report Scope:
Report Features Description Market Value (2022) USD 70.0 Bn Forecast Revenue (2032) USD 119.0 Bn CAGR (2023-2032) 5.6% Base Year for Estimation 2022 Historic Period 2016-2022 Forecast Period 2023-2032 Report Coverage Revenue Forecast, Market Dynamics, COVID-19 Impact, Competitive Landscape, Recent Developments Segments Covered By Product (High-density polyethylene, Low-density polyethylene, Polypropylene, Polyvinyl chloride, Polystyrene, Thermoplastic polyesters, Others (polybutylene terephthalate, polyimide, polycarbonate, and acrylonitrile butadiene styrene))
By Application (Automotive, Construction, Packaging, Electrical & Electronics, Others (industrial equipment and consumer goods))Regional Analysis North America – The US, Canada, & Mexico; Western Europe – Germany, France, The UK, Spain, Italy, Portugal, Ireland, Austria, Switzerland, Benelux, Nordic, & Rest of Western Europe; Eastern Europe – Russia, Poland, The Czech Republic, Greece, & Rest of Eastern Europe; APAC – China, Japan, South Korea, India, Australia & New Zealand, Indonesia, Malaysia, Philippines, Singapore, Thailand, Vietnam, & Rest of APAC; Latin America – Brazil, Colombia, Chile, Argentina, Costa Rica, & Rest of Latin America; Middle East & Africa – Algeria, Egypt, Israel, Kuwait, Nigeria, Saudi Arabia, South Africa, Turkey, United Arab Emirates, & Rest of MEA Competitive Landscape LyondellBasell Industries N.V., BASF SE, Saudi Basic Industries Corporation, The Dow Chemical Company, I. du Pont de Nemours and Company, Kraton Polymers Inc., Solvay S.A., RTP Company, Inc., Schulman, Inc., Polyvisions Inc. Customization Scope Customization for segments, region/country-level will be provided. Moreover, additional customization can be done based on the requirements. Purchase Options We have three licenses to opt for: Single User License, Multi-User License (Up to 5 Users), Corporate Use License (Unlimited User and Printable PDF) -
- 1. Executive Summary
- 1.1. Definition
- 1.2. Taxonomy
- 1.3. Research Scope
- 1.4. Key Analysis
- 1.5. Key Findings by Major Segments
- 1.6. Top strategies by Major Players
- 2. Global Plastic Compounding Market Overview
- 2.1. Plastic Compounding Market Dynamics
- 2.1.1. Drivers
- 2.1.2. Opportunities
- 2.1.3. Restraints
- 2.1.4. Challenges
- 2.2. Macro-economic Factors
- 2.3. Regulatory Framework
- 2.4. Market Investment Feasibility Index
- 2.5. PEST Analysis
- 2.6. PORTER’S Five Force Analysis
- 2.7. Drivers & Restraints Impact Analysis
- 2.8. Industry Chain Analysis
- 2.9. Cost Structure Analysis
- 2.10. Marketing Strategy
- 2.11. Russia-Ukraine War Impact Analysis
- 2.12. Opportunity Map Analysis
- 2.13. Market Competition Scenario Analysis
- 2.14. Product Life Cycle Analysis
- 2.15. Opportunity Orbits
- 2.16. Manufacturer Intensity Map
- 2.17. Major Companies sales by Value & Volume
- 2.1. Plastic Compounding Market Dynamics
- 3. Global Plastic Compounding Market Analysis, Opportunity and Forecast, 2016-2032
- 3.1. Global Plastic Compounding Market Analysis, 2016-2021
- 3.2. Global Plastic Compounding Market Opportunity and Forecast, 2023-2032
- 3.3. Global Plastic Compounding Market Analysis, Opportunity and Forecast, By By Product, 2016-2032
- 3.3.1. Global Plastic Compounding Market Analysis by By Product: Introduction
- 3.3.2. Market Size Absolute $ Opportunity Analysis and Forecast, By By Product, 2016-2032
- 3.3.3. High-density polyethylene
- 3.3.4. Low-density polyethylene
- 3.3.5. Polypropylene
- 3.3.6. Polyvinyl chloride
- 3.3.7. Polystyrene
- 3.3.8. Thermoplastic polyesters
- 3.3.9. Others (polybutylene terephthalate, polyimide, polycarbonate, and acrylonitrile butadiene styrene)
- 3.4. Global Plastic Compounding Market Analysis, Opportunity and Forecast, By By Application, 2016-2032
- 3.4.1. Global Plastic Compounding Market Analysis by By Application: Introduction
- 3.4.2. Market Size Absolute $ Opportunity Analysis and Forecast, By By Application, 2016-2032
- 3.4.3. Automotive
- 3.4.4. Construction
- 3.4.5. Packaging
- 3.4.6. Electrical & Electronics
- 3.4.7. Others (industrial equipment and consumer goods)
- 4. North America Plastic Compounding Market Analysis, Opportunity and Forecast, 2016-2032
- 4.1. North America Plastic Compounding Market Analysis, 2016-2021
- 4.2. North America Plastic Compounding Market Opportunity and Forecast, 2023-2032
- 4.3. North America Plastic Compounding Market Analysis, Opportunity and Forecast, By By Product, 2016-2032
- 4.3.1. North America Plastic Compounding Market Analysis by By Product: Introduction
- 4.3.2. Market Size Absolute $ Opportunity Analysis and Forecast, By By Product, 2016-2032
- 4.3.3. High-density polyethylene
- 4.3.4. Low-density polyethylene
- 4.3.5. Polypropylene
- 4.3.6. Polyvinyl chloride
- 4.3.7. Polystyrene
- 4.3.8. Thermoplastic polyesters
- 4.3.9. Others (polybutylene terephthalate, polyimide, polycarbonate, and acrylonitrile butadiene styrene)
- 4.4. North America Plastic Compounding Market Analysis, Opportunity and Forecast, By By Application, 2016-2032
- 4.4.1. North America Plastic Compounding Market Analysis by By Application: Introduction
- 4.4.2. Market Size Absolute $ Opportunity Analysis and Forecast, By By Application, 2016-2032
- 4.4.3. Automotive
- 4.4.4. Construction
- 4.4.5. Packaging
- 4.4.6. Electrical & Electronics
- 4.4.7. Others (industrial equipment and consumer goods)
- 4.5. North America Plastic Compounding Market Analysis, Opportunity and Forecast, By Country , 2016-2032
- 4.5.1. North America Plastic Compounding Market Analysis by Country : Introduction
- 4.5.2. Market Size Absolute $ Opportunity Analysis and Forecast, Country , 2016-2032
- 4.5.2.1. The US
- 4.5.2.2. Canada
- 4.5.2.3. Mexico
- 5. Western Europe Plastic Compounding Market Analysis, Opportunity and Forecast, 2016-2032
- 5.1. Western Europe Plastic Compounding Market Analysis, 2016-2021
- 5.2. Western Europe Plastic Compounding Market Opportunity and Forecast, 2023-2032
- 5.3. Western Europe Plastic Compounding Market Analysis, Opportunity and Forecast, By By Product, 2016-2032
- 5.3.1. Western Europe Plastic Compounding Market Analysis by By Product: Introduction
- 5.3.2. Market Size Absolute $ Opportunity Analysis and Forecast, By By Product, 2016-2032
- 5.3.3. High-density polyethylene
- 5.3.4. Low-density polyethylene
- 5.3.5. Polypropylene
- 5.3.6. Polyvinyl chloride
- 5.3.7. Polystyrene
- 5.3.8. Thermoplastic polyesters
- 5.3.9. Others (polybutylene terephthalate, polyimide, polycarbonate, and acrylonitrile butadiene styrene)
- 5.4. Western Europe Plastic Compounding Market Analysis, Opportunity and Forecast, By By Application, 2016-2032
- 5.4.1. Western Europe Plastic Compounding Market Analysis by By Application: Introduction
- 5.4.2. Market Size Absolute $ Opportunity Analysis and Forecast, By By Application, 2016-2032
- 5.4.3. Automotive
- 5.4.4. Construction
- 5.4.5. Packaging
- 5.4.6. Electrical & Electronics
- 5.4.7. Others (industrial equipment and consumer goods)
- 5.5. Western Europe Plastic Compounding Market Analysis, Opportunity and Forecast, By Country , 2016-2032
- 5.5.1. Western Europe Plastic Compounding Market Analysis by Country : Introduction
- 5.5.2. Market Size Absolute $ Opportunity Analysis and Forecast, Country , 2016-2032
- 5.5.2.1. Germany
- 5.5.2.2. France
- 5.5.2.3. The UK
- 5.5.2.4. Spain
- 5.5.2.5. Italy
- 5.5.2.6. Portugal
- 5.5.2.7. Ireland
- 5.5.2.8. Austria
- 5.5.2.9. Switzerland
- 5.5.2.10. Benelux
- 5.5.2.11. Nordic
- 5.5.2.12. Rest of Western Europe
- 6. Eastern Europe Plastic Compounding Market Analysis, Opportunity and Forecast, 2016-2032
- 6.1. Eastern Europe Plastic Compounding Market Analysis, 2016-2021
- 6.2. Eastern Europe Plastic Compounding Market Opportunity and Forecast, 2023-2032
- 6.3. Eastern Europe Plastic Compounding Market Analysis, Opportunity and Forecast, By By Product, 2016-2032
- 6.3.1. Eastern Europe Plastic Compounding Market Analysis by By Product: Introduction
- 6.3.2. Market Size Absolute $ Opportunity Analysis and Forecast, By By Product, 2016-2032
- 6.3.3. High-density polyethylene
- 6.3.4. Low-density polyethylene
- 6.3.5. Polypropylene
- 6.3.6. Polyvinyl chloride
- 6.3.7. Polystyrene
- 6.3.8. Thermoplastic polyesters
- 6.3.9. Others (polybutylene terephthalate, polyimide, polycarbonate, and acrylonitrile butadiene styrene)
- 6.4. Eastern Europe Plastic Compounding Market Analysis, Opportunity and Forecast, By By Application, 2016-2032
- 6.4.1. Eastern Europe Plastic Compounding Market Analysis by By Application: Introduction
- 6.4.2. Market Size Absolute $ Opportunity Analysis and Forecast, By By Application, 2016-2032
- 6.4.3. Automotive
- 6.4.4. Construction
- 6.4.5. Packaging
- 6.4.6. Electrical & Electronics
- 6.4.7. Others (industrial equipment and consumer goods)
- 6.5. Eastern Europe Plastic Compounding Market Analysis, Opportunity and Forecast, By Country , 2016-2032
- 6.5.1. Eastern Europe Plastic Compounding Market Analysis by Country : Introduction
- 6.5.2. Market Size Absolute $ Opportunity Analysis and Forecast, Country , 2016-2032
- 6.5.2.1. Russia
- 6.5.2.2. Poland
- 6.5.2.3. The Czech Republic
- 6.5.2.4. Greece
- 6.5.2.5. Rest of Eastern Europe
- 7. APAC Plastic Compounding Market Analysis, Opportunity and Forecast, 2016-2032
- 7.1. APAC Plastic Compounding Market Analysis, 2016-2021
- 7.2. APAC Plastic Compounding Market Opportunity and Forecast, 2023-2032
- 7.3. APAC Plastic Compounding Market Analysis, Opportunity and Forecast, By By Product, 2016-2032
- 7.3.1. APAC Plastic Compounding Market Analysis by By Product: Introduction
- 7.3.2. Market Size Absolute $ Opportunity Analysis and Forecast, By By Product, 2016-2032
- 7.3.3. High-density polyethylene
- 7.3.4. Low-density polyethylene
- 7.3.5. Polypropylene
- 7.3.6. Polyvinyl chloride
- 7.3.7. Polystyrene
- 7.3.8. Thermoplastic polyesters
- 7.3.9. Others (polybutylene terephthalate, polyimide, polycarbonate, and acrylonitrile butadiene styrene)
- 7.4. APAC Plastic Compounding Market Analysis, Opportunity and Forecast, By By Application, 2016-2032
- 7.4.1. APAC Plastic Compounding Market Analysis by By Application: Introduction
- 7.4.2. Market Size Absolute $ Opportunity Analysis and Forecast, By By Application, 2016-2032
- 7.4.3. Automotive
- 7.4.4. Construction
- 7.4.5. Packaging
- 7.4.6. Electrical & Electronics
- 7.4.7. Others (industrial equipment and consumer goods)
- 7.5. APAC Plastic Compounding Market Analysis, Opportunity and Forecast, By Country , 2016-2032
- 7.5.1. APAC Plastic Compounding Market Analysis by Country : Introduction
- 7.5.2. Market Size Absolute $ Opportunity Analysis and Forecast, Country , 2016-2032
- 7.5.2.1. China
- 7.5.2.2. Japan
- 7.5.2.3. South Korea
- 7.5.2.4. India
- 7.5.2.5. Australia & New Zeland
- 7.5.2.6. Indonesia
- 7.5.2.7. Malaysia
- 7.5.2.8. Philippines
- 7.5.2.9. Singapore
- 7.5.2.10. Thailand
- 7.5.2.11. Vietnam
- 7.5.2.12. Rest of APAC
- 8. Latin America Plastic Compounding Market Analysis, Opportunity and Forecast, 2016-2032
- 8.1. Latin America Plastic Compounding Market Analysis, 2016-2021
- 8.2. Latin America Plastic Compounding Market Opportunity and Forecast, 2023-2032
- 8.3. Latin America Plastic Compounding Market Analysis, Opportunity and Forecast, By By Product, 2016-2032
- 8.3.1. Latin America Plastic Compounding Market Analysis by By Product: Introduction
- 8.3.2. Market Size Absolute $ Opportunity Analysis and Forecast, By By Product, 2016-2032
- 8.3.3. High-density polyethylene
- 8.3.4. Low-density polyethylene
- 8.3.5. Polypropylene
- 8.3.6. Polyvinyl chloride
- 8.3.7. Polystyrene
- 8.3.8. Thermoplastic polyesters
- 8.3.9. Others (polybutylene terephthalate, polyimide, polycarbonate, and acrylonitrile butadiene styrene)
- 8.4. Latin America Plastic Compounding Market Analysis, Opportunity and Forecast, By By Application, 2016-2032
- 8.4.1. Latin America Plastic Compounding Market Analysis by By Application: Introduction
- 8.4.2. Market Size Absolute $ Opportunity Analysis and Forecast, By By Application, 2016-2032
- 8.4.3. Automotive
- 8.4.4. Construction
- 8.4.5. Packaging
- 8.4.6. Electrical & Electronics
- 8.4.7. Others (industrial equipment and consumer goods)
- 8.5. Latin America Plastic Compounding Market Analysis, Opportunity and Forecast, By Country , 2016-2032
- 8.5.1. Latin America Plastic Compounding Market Analysis by Country : Introduction
- 8.5.2. Market Size Absolute $ Opportunity Analysis and Forecast, Country , 2016-2032
- 8.5.2.1. Brazil
- 8.5.2.2. Colombia
- 8.5.2.3. Chile
- 8.5.2.4. Argentina
- 8.5.2.5. Costa Rica
- 8.5.2.6. Rest of Latin America
- 9. Middle East & Africa Plastic Compounding Market Analysis, Opportunity and Forecast, 2016-2032
- 9.1. Middle East & Africa Plastic Compounding Market Analysis, 2016-2021
- 9.2. Middle East & Africa Plastic Compounding Market Opportunity and Forecast, 2023-2032
- 9.3. Middle East & Africa Plastic Compounding Market Analysis, Opportunity and Forecast, By By Product, 2016-2032
- 9.3.1. Middle East & Africa Plastic Compounding Market Analysis by By Product: Introduction
- 9.3.2. Market Size Absolute $ Opportunity Analysis and Forecast, By By Product, 2016-2032
- 9.3.3. High-density polyethylene
- 9.3.4. Low-density polyethylene
- 9.3.5. Polypropylene
- 9.3.6. Polyvinyl chloride
- 9.3.7. Polystyrene
- 9.3.8. Thermoplastic polyesters
- 9.3.9. Others (polybutylene terephthalate, polyimide, polycarbonate, and acrylonitrile butadiene styrene)
- 9.4. Middle East & Africa Plastic Compounding Market Analysis, Opportunity and Forecast, By By Application, 2016-2032
- 9.4.1. Middle East & Africa Plastic Compounding Market Analysis by By Application: Introduction
- 9.4.2. Market Size Absolute $ Opportunity Analysis and Forecast, By By Application, 2016-2032
- 9.4.3. Automotive
- 9.4.4. Construction
- 9.4.5. Packaging
- 9.4.6. Electrical & Electronics
- 9.4.7. Others (industrial equipment and consumer goods)
- 9.5. Middle East & Africa Plastic Compounding Market Analysis, Opportunity and Forecast, By Country , 2016-2032
- 9.5.1. Middle East & Africa Plastic Compounding Market Analysis by Country : Introduction
- 9.5.2. Market Size Absolute $ Opportunity Analysis and Forecast, Country , 2016-2032
- 9.5.2.1. Algeria
- 9.5.2.2. Egypt
- 9.5.2.3. Israel
- 9.5.2.4. Kuwait
- 9.5.2.5. Nigeria
- 9.5.2.6. Saudi Arabia
- 9.5.2.7. South Africa
- 9.5.2.8. Turkey
- 9.5.2.9. The UAE
- 9.5.2.10. Rest of MEA
- 10. Global Plastic Compounding Market Analysis, Opportunity and Forecast, By Region , 2016-2032
- 10.1. Global Plastic Compounding Market Analysis by Region : Introduction
- 10.2. Market Size Absolute $ Opportunity Analysis and Forecast, By Region , 2016-2032
- 10.2.1. North America
- 10.2.2. Western Europe
- 10.2.3. Eastern Europe
- 10.2.4. APAC
- 10.2.5. Latin America
- 10.2.6. Middle East & Africa
- 11. Global Plastic Compounding Market Competitive Landscape, Market Share Analysis, and Company Profiles
- 11.1. Market Share Analysis
- 11.2. Company Profiles
- 11.3. LyondellBasell Industries N.V.
- 11.3.1. Company Overview
- 11.3.2. Financial Highlights
- 11.3.3. Product Portfolio
- 11.3.4. SWOT Analysis
- 11.3.5. Key Strategies and Developments
- 11.4. BASF SE
- 11.4.1. Company Overview
- 11.4.2. Financial Highlights
- 11.4.3. Product Portfolio
- 11.4.4. SWOT Analysis
- 11.4.5. Key Strategies and Developments
- 11.5. Saudi Basic Industries Corporation
- 11.5.1. Company Overview
- 11.5.2. Financial Highlights
- 11.5.3. Product Portfolio
- 11.5.4. SWOT Analysis
- 11.5.5. Key Strategies and Developments
- 11.6. The Dow Chemical Company
- 11.6.1. Company Overview
- 11.6.2. Financial Highlights
- 11.6.3. Product Portfolio
- 11.6.4. SWOT Analysis
- 11.6.5. Key Strategies and Developments
- 11.7. I. du Pont de Nemours and Company
- 11.7.1. Company Overview
- 11.7.2. Financial Highlights
- 11.7.3. Product Portfolio
- 11.7.4. SWOT Analysis
- 11.7.5. Key Strategies and Developments
- 11.8. Kraton Polymers Inc.
- 11.8.1. Company Overview
- 11.8.2. Financial Highlights
- 11.8.3. Product Portfolio
- 11.8.4. SWOT Analysis
- 11.8.5. Key Strategies and Developments
- 11.9. Solvay S.A.
- 11.9.1. Company Overview
- 11.9.2. Financial Highlights
- 11.9.3. Product Portfolio
- 11.9.4. SWOT Analysis
- 11.9.5. Key Strategies and Developments
- 11.10. RTP Company, Inc.
- 11.10.1. Company Overview
- 11.10.2. Financial Highlights
- 11.10.3. Product Portfolio
- 11.10.4. SWOT Analysis
- 11.10.5. Key Strategies and Developments
- 11.11. Schulman, Inc.
- 11.11.1. Company Overview
- 11.11.2. Financial Highlights
- 11.11.3. Product Portfolio
- 11.11.4. SWOT Analysis
- 11.11.5. Key Strategies and Developments
- 11.12. Polyvisions Inc.
- 11.12.1. Company Overview
- 11.12.2. Financial Highlights
- 11.12.3. Product Portfolio
- 11.12.4. SWOT Analysis
- 11.12.5. Key Strategies and Developments
- 12. Assumptions and Acronyms
- 13. Research Methodology
- 14. Contact
- List of Figures
- "
- Figure 1: Global Plastic Compounding Market Revenue (US$ Mn) Market Share by By Product in 2022
- Figure 2: Global Plastic Compounding Market Attractiveness Analysis by By Product, 2016-2032
- Figure 3: Global Plastic Compounding Market Revenue (US$ Mn) Market Share by By Applicationin 2022
- Figure 4: Global Plastic Compounding Market Attractiveness Analysis by By Application, 2016-2032
- Figure 5: Global Plastic Compounding Market Revenue (US$ Mn) Market Share by Region in 2022
- Figure 6: Global Plastic Compounding Market Attractiveness Analysis by Region, 2016-2032
- Figure 7: Global Plastic Compounding Market Revenue (US$ Mn) (2016-2032)
- Figure 8: Global Plastic Compounding Market Revenue (US$ Mn) Comparison by Region (2016-2032)
- Figure 9: Global Plastic Compounding Market Revenue (US$ Mn) Comparison by By Product (2016-2032)
- Figure 10: Global Plastic Compounding Market Revenue (US$ Mn) Comparison by By Application (2016-2032)
- Figure 11: Global Plastic Compounding Market Y-o-Y Growth Rate Comparison by Region (2016-2032)
- Figure 12: Global Plastic Compounding Market Y-o-Y Growth Rate Comparison by By Product (2016-2032)
- Figure 13: Global Plastic Compounding Market Y-o-Y Growth Rate Comparison by By Application (2016-2032)
- Figure 14: Global Plastic Compounding Market Share Comparison by Region (2016-2032)
- Figure 15: Global Plastic Compounding Market Share Comparison by By Product (2016-2032)
- Figure 16: Global Plastic Compounding Market Share Comparison by By Application (2016-2032)
- Figure 17: North America Plastic Compounding Market Revenue (US$ Mn) Market Share by By Productin 2022
- Figure 18: North America Plastic Compounding Market Attractiveness Analysis by By Product, 2016-2032
- Figure 19: North America Plastic Compounding Market Revenue (US$ Mn) Market Share by By Applicationin 2022
- Figure 20: North America Plastic Compounding Market Attractiveness Analysis by By Application, 2016-2032
- Figure 21: North America Plastic Compounding Market Revenue (US$ Mn) Market Share by Country in 2022
- Figure 22: North America Plastic Compounding Market Attractiveness Analysis by Country, 2016-2032
- Figure 23: North America Plastic Compounding Market Revenue (US$ Mn) (2016-2032)
- Figure 24: North America Plastic Compounding Market Revenue (US$ Mn) Comparison by Country (2016-2032)
- Figure 25: North America Plastic Compounding Market Revenue (US$ Mn) Comparison by By Product (2016-2032)
- Figure 26: North America Plastic Compounding Market Revenue (US$ Mn) Comparison by By Application (2016-2032)
- Figure 27: North America Plastic Compounding Market Y-o-Y Growth Rate Comparison by Country (2016-2032)
- Figure 28: North America Plastic Compounding Market Y-o-Y Growth Rate Comparison by By Product (2016-2032)
- Figure 29: North America Plastic Compounding Market Y-o-Y Growth Rate Comparison by By Application (2016-2032)
- Figure 30: North America Plastic Compounding Market Share Comparison by Country (2016-2032)
- Figure 31: North America Plastic Compounding Market Share Comparison by By Product (2016-2032)
- Figure 32: North America Plastic Compounding Market Share Comparison by By Application (2016-2032)
- Figure 33: Western Europe Plastic Compounding Market Revenue (US$ Mn) Market Share by By Productin 2022
- Figure 34: Western Europe Plastic Compounding Market Attractiveness Analysis by By Product, 2016-2032
- Figure 35: Western Europe Plastic Compounding Market Revenue (US$ Mn) Market Share by By Applicationin 2022
- Figure 36: Western Europe Plastic Compounding Market Attractiveness Analysis by By Application, 2016-2032
- Figure 37: Western Europe Plastic Compounding Market Revenue (US$ Mn) Market Share by Country in 2022
- Figure 38: Western Europe Plastic Compounding Market Attractiveness Analysis by Country, 2016-2032
- Figure 39: Western Europe Plastic Compounding Market Revenue (US$ Mn) (2016-2032)
- Figure 40: Western Europe Plastic Compounding Market Revenue (US$ Mn) Comparison by Country (2016-2032)
- Figure 41: Western Europe Plastic Compounding Market Revenue (US$ Mn) Comparison by By Product (2016-2032)
- Figure 42: Western Europe Plastic Compounding Market Revenue (US$ Mn) Comparison by By Application (2016-2032)
- Figure 43: Western Europe Plastic Compounding Market Y-o-Y Growth Rate Comparison by Country (2016-2032)
- Figure 44: Western Europe Plastic Compounding Market Y-o-Y Growth Rate Comparison by By Product (2016-2032)
- Figure 45: Western Europe Plastic Compounding Market Y-o-Y Growth Rate Comparison by By Application (2016-2032)
- Figure 46: Western Europe Plastic Compounding Market Share Comparison by Country (2016-2032)
- Figure 47: Western Europe Plastic Compounding Market Share Comparison by By Product (2016-2032)
- Figure 48: Western Europe Plastic Compounding Market Share Comparison by By Application (2016-2032)
- Figure 49: Eastern Europe Plastic Compounding Market Revenue (US$ Mn) Market Share by By Productin 2022
- Figure 50: Eastern Europe Plastic Compounding Market Attractiveness Analysis by By Product, 2016-2032
- Figure 51: Eastern Europe Plastic Compounding Market Revenue (US$ Mn) Market Share by By Applicationin 2022
- Figure 52: Eastern Europe Plastic Compounding Market Attractiveness Analysis by By Application, 2016-2032
- Figure 53: Eastern Europe Plastic Compounding Market Revenue (US$ Mn) Market Share by Country in 2022
- Figure 54: Eastern Europe Plastic Compounding Market Attractiveness Analysis by Country, 2016-2032
- Figure 55: Eastern Europe Plastic Compounding Market Revenue (US$ Mn) (2016-2032)
- Figure 56: Eastern Europe Plastic Compounding Market Revenue (US$ Mn) Comparison by Country (2016-2032)
- Figure 57: Eastern Europe Plastic Compounding Market Revenue (US$ Mn) Comparison by By Product (2016-2032)
- Figure 58: Eastern Europe Plastic Compounding Market Revenue (US$ Mn) Comparison by By Application (2016-2032)
- Figure 59: Eastern Europe Plastic Compounding Market Y-o-Y Growth Rate Comparison by Country (2016-2032)
- Figure 60: Eastern Europe Plastic Compounding Market Y-o-Y Growth Rate Comparison by By Product (2016-2032)
- Figure 61: Eastern Europe Plastic Compounding Market Y-o-Y Growth Rate Comparison by By Application (2016-2032)
- Figure 62: Eastern Europe Plastic Compounding Market Share Comparison by Country (2016-2032)
- Figure 63: Eastern Europe Plastic Compounding Market Share Comparison by By Product (2016-2032)
- Figure 64: Eastern Europe Plastic Compounding Market Share Comparison by By Application (2016-2032)
- Figure 65: APAC Plastic Compounding Market Revenue (US$ Mn) Market Share by By Productin 2022
- Figure 66: APAC Plastic Compounding Market Attractiveness Analysis by By Product, 2016-2032
- Figure 67: APAC Plastic Compounding Market Revenue (US$ Mn) Market Share by By Applicationin 2022
- Figure 68: APAC Plastic Compounding Market Attractiveness Analysis by By Application, 2016-2032
- Figure 69: APAC Plastic Compounding Market Revenue (US$ Mn) Market Share by Country in 2022
- Figure 70: APAC Plastic Compounding Market Attractiveness Analysis by Country, 2016-2032
- Figure 71: APAC Plastic Compounding Market Revenue (US$ Mn) (2016-2032)
- Figure 72: APAC Plastic Compounding Market Revenue (US$ Mn) Comparison by Country (2016-2032)
- Figure 73: APAC Plastic Compounding Market Revenue (US$ Mn) Comparison by By Product (2016-2032)
- Figure 74: APAC Plastic Compounding Market Revenue (US$ Mn) Comparison by By Application (2016-2032)
- Figure 75: APAC Plastic Compounding Market Y-o-Y Growth Rate Comparison by Country (2016-2032)
- Figure 76: APAC Plastic Compounding Market Y-o-Y Growth Rate Comparison by By Product (2016-2032)
- Figure 77: APAC Plastic Compounding Market Y-o-Y Growth Rate Comparison by By Application (2016-2032)
- Figure 78: APAC Plastic Compounding Market Share Comparison by Country (2016-2032)
- Figure 79: APAC Plastic Compounding Market Share Comparison by By Product (2016-2032)
- Figure 80: APAC Plastic Compounding Market Share Comparison by By Application (2016-2032)
- Figure 81: Latin America Plastic Compounding Market Revenue (US$ Mn) Market Share by By Productin 2022
- Figure 82: Latin America Plastic Compounding Market Attractiveness Analysis by By Product, 2016-2032
- Figure 83: Latin America Plastic Compounding Market Revenue (US$ Mn) Market Share by By Applicationin 2022
- Figure 84: Latin America Plastic Compounding Market Attractiveness Analysis by By Application, 2016-2032
- Figure 85: Latin America Plastic Compounding Market Revenue (US$ Mn) Market Share by Country in 2022
- Figure 86: Latin America Plastic Compounding Market Attractiveness Analysis by Country, 2016-2032
- Figure 87: Latin America Plastic Compounding Market Revenue (US$ Mn) (2016-2032)
- Figure 88: Latin America Plastic Compounding Market Revenue (US$ Mn) Comparison by Country (2016-2032)
- Figure 89: Latin America Plastic Compounding Market Revenue (US$ Mn) Comparison by By Product (2016-2032)
- Figure 90: Latin America Plastic Compounding Market Revenue (US$ Mn) Comparison by By Application (2016-2032)
- Figure 91: Latin America Plastic Compounding Market Y-o-Y Growth Rate Comparison by Country (2016-2032)
- Figure 92: Latin America Plastic Compounding Market Y-o-Y Growth Rate Comparison by By Product (2016-2032)
- Figure 93: Latin America Plastic Compounding Market Y-o-Y Growth Rate Comparison by By Application (2016-2032)
- Figure 94: Latin America Plastic Compounding Market Share Comparison by Country (2016-2032)
- Figure 95: Latin America Plastic Compounding Market Share Comparison by By Product (2016-2032)
- Figure 96: Latin America Plastic Compounding Market Share Comparison by By Application (2016-2032)
- Figure 97: Middle East & Africa Plastic Compounding Market Revenue (US$ Mn) Market Share by By Productin 2022
- Figure 98: Middle East & Africa Plastic Compounding Market Attractiveness Analysis by By Product, 2016-2032
- Figure 99: Middle East & Africa Plastic Compounding Market Revenue (US$ Mn) Market Share by By Applicationin 2022
- Figure 100: Middle East & Africa Plastic Compounding Market Attractiveness Analysis by By Application, 2016-2032
- Figure 101: Middle East & Africa Plastic Compounding Market Revenue (US$ Mn) Market Share by Country in 2022
- Figure 102: Middle East & Africa Plastic Compounding Market Attractiveness Analysis by Country, 2016-2032
- Figure 103: Middle East & Africa Plastic Compounding Market Revenue (US$ Mn) (2016-2032)
- Figure 104: Middle East & Africa Plastic Compounding Market Revenue (US$ Mn) Comparison by Country (2016-2032)
- Figure 105: Middle East & Africa Plastic Compounding Market Revenue (US$ Mn) Comparison by By Product (2016-2032)
- Figure 106: Middle East & Africa Plastic Compounding Market Revenue (US$ Mn) Comparison by By Application (2016-2032)
- Figure 107: Middle East & Africa Plastic Compounding Market Y-o-Y Growth Rate Comparison by Country (2016-2032)
- Figure 108: Middle East & Africa Plastic Compounding Market Y-o-Y Growth Rate Comparison by By Product (2016-2032)
- Figure 109: Middle East & Africa Plastic Compounding Market Y-o-Y Growth Rate Comparison by By Application (2016-2032)
- Figure 110: Middle East & Africa Plastic Compounding Market Share Comparison by Country (2016-2032)
- Figure 111: Middle East & Africa Plastic Compounding Market Share Comparison by By Product (2016-2032)
- Figure 112: Middle East & Africa Plastic Compounding Market Share Comparison by By Application (2016-2032)
- List of Tables
- Table 1: Global Plastic Compounding Market Comparison by By Product (2016-2032)
- Table 2: Global Plastic Compounding Market Comparison by By Application (2016-2032)
- Table 3: Global Plastic Compounding Market Revenue (US$ Mn) Comparison by Region (2016-2032)
- Table 4: Global Plastic Compounding Market Revenue (US$ Mn) (2016-2032)
- Table 5: Global Plastic Compounding Market Revenue (US$ Mn) Comparison by Region (2016-2032)
- Table 6: Global Plastic Compounding Market Revenue (US$ Mn) Comparison by By Product (2016-2032)
- Table 7: Global Plastic Compounding Market Revenue (US$ Mn) Comparison by By Application (2016-2032)
- Table 8: Global Plastic Compounding Market Y-o-Y Growth Rate Comparison by Region (2016-2032)
- Table 9: Global Plastic Compounding Market Y-o-Y Growth Rate Comparison by By Product (2016-2032)
- Table 10: Global Plastic Compounding Market Y-o-Y Growth Rate Comparison by By Application (2016-2032)
- Table 11: Global Plastic Compounding Market Share Comparison by Region (2016-2032)
- Table 12: Global Plastic Compounding Market Share Comparison by By Product (2016-2032)
- Table 13: Global Plastic Compounding Market Share Comparison by By Application (2016-2032)
- Table 14: North America Plastic Compounding Market Comparison by By Application (2016-2032)
- Table 15: North America Plastic Compounding Market Revenue (US$ Mn) Comparison by Country (2016-2032)
- Table 16: North America Plastic Compounding Market Revenue (US$ Mn) (2016-2032)
- Table 17: North America Plastic Compounding Market Revenue (US$ Mn) Comparison by Country (2016-2032)
- Table 18: North America Plastic Compounding Market Revenue (US$ Mn) Comparison by By Product (2016-2032)
- Table 19: North America Plastic Compounding Market Revenue (US$ Mn) Comparison by By Application (2016-2032)
- Table 20: North America Plastic Compounding Market Y-o-Y Growth Rate Comparison by Country (2016-2032)
- Table 21: North America Plastic Compounding Market Y-o-Y Growth Rate Comparison by By Product (2016-2032)
- Table 22: North America Plastic Compounding Market Y-o-Y Growth Rate Comparison by By Application (2016-2032)
- Table 23: North America Plastic Compounding Market Share Comparison by Country (2016-2032)
- Table 24: North America Plastic Compounding Market Share Comparison by By Product (2016-2032)
- Table 25: North America Plastic Compounding Market Share Comparison by By Application (2016-2032)
- Table 26: Western Europe Plastic Compounding Market Comparison by By Product (2016-2032)
- Table 27: Western Europe Plastic Compounding Market Comparison by By Application (2016-2032)
- Table 28: Western Europe Plastic Compounding Market Revenue (US$ Mn) Comparison by Country (2016-2032)
- Table 29: Western Europe Plastic Compounding Market Revenue (US$ Mn) (2016-2032)
- Table 30: Western Europe Plastic Compounding Market Revenue (US$ Mn) Comparison by Country (2016-2032)
- Table 31: Western Europe Plastic Compounding Market Revenue (US$ Mn) Comparison by By Product (2016-2032)
- Table 32: Western Europe Plastic Compounding Market Revenue (US$ Mn) Comparison by By Application (2016-2032)
- Table 33: Western Europe Plastic Compounding Market Y-o-Y Growth Rate Comparison by Country (2016-2032)
- Table 34: Western Europe Plastic Compounding Market Y-o-Y Growth Rate Comparison by By Product (2016-2032)
- Table 35: Western Europe Plastic Compounding Market Y-o-Y Growth Rate Comparison by By Application (2016-2032)
- Table 36: Western Europe Plastic Compounding Market Share Comparison by Country (2016-2032)
- Table 37: Western Europe Plastic Compounding Market Share Comparison by By Product (2016-2032)
- Table 38: Western Europe Plastic Compounding Market Share Comparison by By Application (2016-2032)
- Table 39: Eastern Europe Plastic Compounding Market Comparison by By Product (2016-2032)
- Table 40: Eastern Europe Plastic Compounding Market Comparison by By Application (2016-2032)
- Table 41: Eastern Europe Plastic Compounding Market Revenue (US$ Mn) Comparison by Country (2016-2032)
- Table 42: Eastern Europe Plastic Compounding Market Revenue (US$ Mn) (2016-2032)
- Table 43: Eastern Europe Plastic Compounding Market Revenue (US$ Mn) Comparison by Country (2016-2032)
- Table 44: Eastern Europe Plastic Compounding Market Revenue (US$ Mn) Comparison by By Product (2016-2032)
- Table 45: Eastern Europe Plastic Compounding Market Revenue (US$ Mn) Comparison by By Application (2016-2032)
- Table 46: Eastern Europe Plastic Compounding Market Y-o-Y Growth Rate Comparison by Country (2016-2032)
- Table 47: Eastern Europe Plastic Compounding Market Y-o-Y Growth Rate Comparison by By Product (2016-2032)
- Table 48: Eastern Europe Plastic Compounding Market Y-o-Y Growth Rate Comparison by By Application (2016-2032)
- Table 49: Eastern Europe Plastic Compounding Market Share Comparison by Country (2016-2032)
- Table 50: Eastern Europe Plastic Compounding Market Share Comparison by By Product (2016-2032)
- Table 51: Eastern Europe Plastic Compounding Market Share Comparison by By Application (2016-2032)
- Table 52: APAC Plastic Compounding Market Comparison by By Product (2016-2032)
- Table 53: APAC Plastic Compounding Market Comparison by By Application (2016-2032)
- Table 54: APAC Plastic Compounding Market Revenue (US$ Mn) Comparison by Country (2016-2032)
- Table 55: APAC Plastic Compounding Market Revenue (US$ Mn) (2016-2032)
- Table 56: APAC Plastic Compounding Market Revenue (US$ Mn) Comparison by Country (2016-2032)
- Table 57: APAC Plastic Compounding Market Revenue (US$ Mn) Comparison by By Product (2016-2032)
- Table 58: APAC Plastic Compounding Market Revenue (US$ Mn) Comparison by By Application (2016-2032)
- Table 59: APAC Plastic Compounding Market Y-o-Y Growth Rate Comparison by Country (2016-2032)
- Table 60: APAC Plastic Compounding Market Y-o-Y Growth Rate Comparison by By Product (2016-2032)
- Table 61: APAC Plastic Compounding Market Y-o-Y Growth Rate Comparison by By Application (2016-2032)
- Table 62: APAC Plastic Compounding Market Share Comparison by Country (2016-2032)
- Table 63: APAC Plastic Compounding Market Share Comparison by By Product (2016-2032)
- Table 64: APAC Plastic Compounding Market Share Comparison by By Application (2016-2032)
- Table 65: Latin America Plastic Compounding Market Comparison by By Product (2016-2032)
- Table 66: Latin America Plastic Compounding Market Comparison by By Application (2016-2032)
- Table 67: Latin America Plastic Compounding Market Revenue (US$ Mn) Comparison by Country (2016-2032)
- Table 68: Latin America Plastic Compounding Market Revenue (US$ Mn) (2016-2032)
- Table 69: Latin America Plastic Compounding Market Revenue (US$ Mn) Comparison by Country (2016-2032)
- Table 70: Latin America Plastic Compounding Market Revenue (US$ Mn) Comparison by By Product (2016-2032)
- Table 71: Latin America Plastic Compounding Market Revenue (US$ Mn) Comparison by By Application (2016-2032)
- Table 72: Latin America Plastic Compounding Market Y-o-Y Growth Rate Comparison by Country (2016-2032)
- Table 73: Latin America Plastic Compounding Market Y-o-Y Growth Rate Comparison by By Product (2016-2032)
- Table 74: Latin America Plastic Compounding Market Y-o-Y Growth Rate Comparison by By Application (2016-2032)
- Table 75: Latin America Plastic Compounding Market Share Comparison by Country (2016-2032)
- Table 76: Latin America Plastic Compounding Market Share Comparison by By Product (2016-2032)
- Table 77: Latin America Plastic Compounding Market Share Comparison by By Application (2016-2032)
- Table 78: Middle East & Africa Plastic Compounding Market Comparison by By Product (2016-2032)
- Table 79: Middle East & Africa Plastic Compounding Market Comparison by By Application (2016-2032)
- Table 80: Middle East & Africa Plastic Compounding Market Revenue (US$ Mn) Comparison by Country (2016-2032)
- Table 81: Middle East & Africa Plastic Compounding Market Revenue (US$ Mn) (2016-2032)
- Table 82: Middle East & Africa Plastic Compounding Market Revenue (US$ Mn) Comparison by Country (2016-2032)
- Table 83: Middle East & Africa Plastic Compounding Market Revenue (US$ Mn) Comparison by By Product (2016-2032)
- Table 84: Middle East & Africa Plastic Compounding Market Revenue (US$ Mn) Comparison by By Application (2016-2032)
- Table 85: Middle East & Africa Plastic Compounding Market Y-o-Y Growth Rate Comparison by Country (2016-2032)
- Table 86: Middle East & Africa Plastic Compounding Market Y-o-Y Growth Rate Comparison by By Product (2016-2032)
- Table 87: Middle East & Africa Plastic Compounding Market Y-o-Y Growth Rate Comparison by By Application (2016-2032)
- Table 88: Middle East & Africa Plastic Compounding Market Share Comparison by Country (2016-2032)
- Table 89: Middle East & Africa Plastic Compounding Market Share Comparison by By Product (2016-2032)
- Table 90: Middle East & Africa Plastic Compounding Market Share Comparison by By Application (2016-2032)
- 1. Executive Summary
-
- LyondellBasell Industries N.V.
- BASF SE
- Saudi Basic Industries Corporation
- The Dow Chemical Company
- I. du Pont de Nemours and Company
- Kraton Polymers Inc.
- Solvay S.A.
- RTP Company, Inc.
- Schulman, Inc.
- Polyvisions Inc.
Our Clients


View Our Licence Options
