
Plastic Additives Market By Type (Plasticizers, Stabilizers, Flame retardants, and Others), By Plastic (Commodity plastic, Engineering plastic, High performance plastic), By Application (Packaging, Automotive, Consumer Goods, Construction, Others), By Region And Companies - Industry Segment Outlook, Market Assessment, Competition Scenario, Trends, And Forecast 2023-2032
-
10533
-
May 2023
-
160
-


-
This report was compiled by Shreyas Rokade Shreyas Rokade is a seasoned Research Analyst with CMFE, bringing extensive expertise in market research and consulting, with a strong background in Chemical Engineering. Correspondence Team Lead-CMFE Linkedin | Detailed Market research Methodology Our methodology involves a mix of primary research, including interviews with leading mental health experts, and secondary research from reputable medical journals and databases. View Detailed Methodology Page
-
Quick Navigation
Report Overview
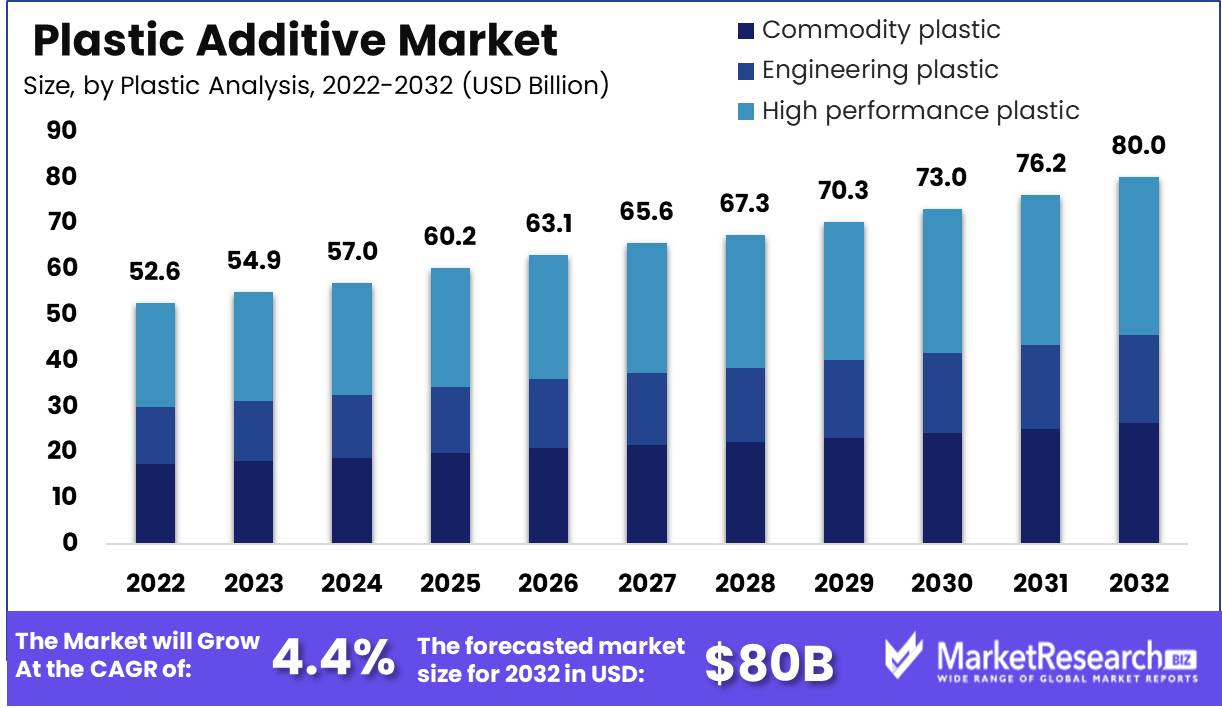
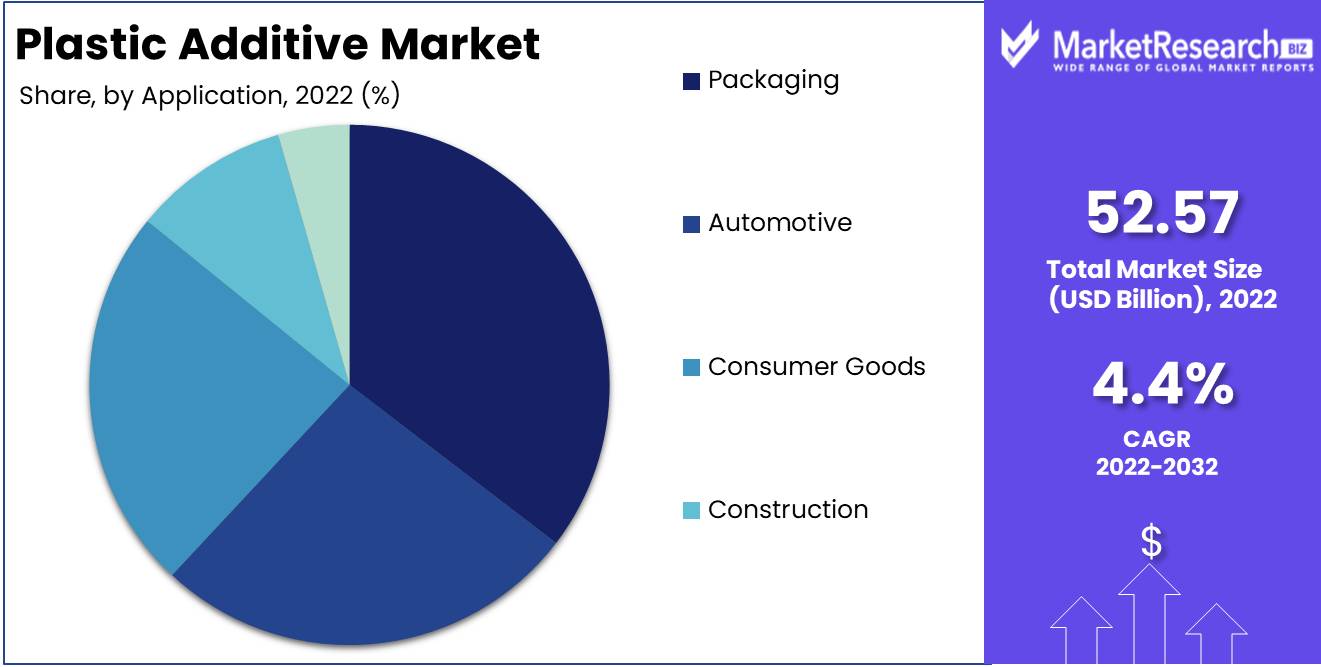
Plastic Additives Market size is expected to be worth around USD 80.86 Bn by 2032 from USD 52.57 Bn in 2022, growing at a CAGR of 4.4% during the forecast period from 2023 to 2032.
The indispensability of plastic Additivess has contributed to the market's phenomenal growth over the years, as its extensive applications in numerous industries have rendered it indispensable. It has incorporated seamlessly with the plastics industry, enabling manufacturers to infuse their plastic products with unmatched enhancements. This report seeks to provide a comprehensive overview of the plastic Additives market, including its definition, significance, innovation, investments, growth, and applications.
A plastic Additives is a chemical compound that, when incorporated into plastic, has a transformative effect on its physical and chemical properties. The primary objective of the plastic Additives market is to revolutionise the quality of plastic products, extend their durability, and provide manufacturers with the ability to customise products to meet specific needs.
The plastic Additives market heralds a plethora of benefits, spanning from increasing the durability and longevity of plastic products to enhancing their aesthetic appeal and functionality and bolstering their resistance to external factors such as heat, chemicals, and ultraviolet light. These advantages inherently inspire consumers with a sense of desirability, providing manufacturers with unprecedented opportunities to increase their revenue generation.
In recent years, the market for plastic Additivess has been a crucible for significant innovations that have significantly contributed to its growth and development. These innovations include, to mention a few, the development of eco-friendly biodegradable Additivess to address environmental concerns, the application of nanotechnology to optimise the mechanical properties of plastic, and the introduction of flame-retardant Additivess.
As the market for plastic Additivess continues to expand, ethical concerns regarding its environmental and human impact have surfaced, prompting an urgent need to prioritise transparency, accountability, and explanation in the processes and products involved. The ethical implications of the plastic Additivess market have brought into clear focus the development and use of sustainable and biodegradable plastic Additivess, which are increasingly viewed as the industry's responsible path forward.
Driving factors
Plastic Additivess Market on an Expansionary Trend
The global Plastic Additives Market is poised for rapid expansion in the near future due to a variety of factors. The market research report by market.us highlights the key driving factors, such as the rising demand for plastic Additivess in the packaging industry, the expanding construction industry and the rising utilisation of plastics in the construction sector, the rising demand for lightweight and fuel-efficient automobiles, and the rising demand for plastic Additivess in the consumer goods industry.
Plastics in the Packaging Sector
Increasing demand for plastic Additivess in the packaging industry can be ascribed to the numerous advantages they provide, such as enhancing the physical and chemical properties of plastics, increasing their durability, and enhancing their appearance. Due to the development of online retail, the packaging industry, which uses plastics extensively for both food and non-food items, has experienced a significant increase in demand.
Potential Changes in Regulation
However, regulatory changes could have an impact on the Plastic Additives Market, as governments around the world have been implementing regulations to reduce plastic usage due to its negative impact on the environment. This may have an impact on the demand for plastic Additivess.
Evolution of Bioplastics
It is possible that in the not too distant future, the introduction of bioplastics & biopolymers, which are produced from renewable resources, will also have an impact on the market for plastic Additivess. This could result in a reduced reliance on traditional plastics and an increased demand for alternatives that are more environmentally friendly.
Technological Disruptions and the Circular Economy
The development of new plastic Additivess with improved performance and sustainability are potential market-altering factors that could affect the competitive landscape of the plastic Additives market. The expansion of the circular economy, which emphasises the reuse and recycling of materials, could also have a substantial effect on the market.
Restraining Factors
Restrictive Regulations: An Obstacle to Growth
Due to stringent government regulations, the Plastic Additives market has been confronting severe constraints. The regulations are geared towards restricting the use of plastic Additivess with negative effects on the environment and human health. The scrutiny of plastic Additivess used in various industries, such as consumer products, automotive components, and packaging materials, has increased production costs and decreased plastic Additives consumption. Regulations have compelled Plastic Additives market participants to operate in a constrained setting, making it difficult for them to operate profitably.
Fluctuating Raw Material Prices: A Profitability Obstacle
The prices of the basic materials used to manufacture plastic Additivess are highly volatile and susceptible to fluctuations. In addition to other factors, the cost of logistics and transportation contributes to the price increase. The fluctuating prices of raw materials can have a significant impact on the profit margins of manufacturers, resulting in an increase in the prices of final products that may deter consumers. Companies find it difficult to price their products competitively and establish a favourable market environment due to the high cost of raw materials.
Concern for the Environment: A Plea for Sustainable Products
The market for Plastic Additivess is under increasing pressure to resolve environmental concerns regarding the disposal of plastic waste. There is a developing demand for waste-reduction and sustainability-promoting eco-friendly products. Utilising plastic compounds in the production of goods exacerbates the issue of plastic waste disposal. Currently, the plastics industry is one of the greatest contributors to global pollution. In order to address the problem of plastic waste disposal, the Plastic Additives market must discover sustainable ways to manufacture Additivess. To address environmental concerns relating to the dispersal of plastic waste, inventive methods must be developed to produce eco-friendly and sustainable products.
Health Dangers: A Danger to Public Safety
Concerning potential health risks associated with the use of plastic Additivess, the Plastic Additives market confronts a significant obstacle. The public is becoming increasingly aware of the potential hazards associated with the use of Bisphenol A (BPA), phthalates, and flame retardants, among others, in plastics. These chemicals have been linked to infertility, developmental disorders, and several types of cancer. Consequently, proactive measures must be taken to promote the safe use of plastic Additivess and reduce the health risks they pose.
Strategies for Mitigation: Collaborative Efforts
To mitigate the challenges facing the Plastic Additives market, all industry participants must work collaboratively. Governments, industry players, and other stakeholders must collaborate to find innovative solutions to create sustainable and environmentally friendly products in order to resolve the challenges. To promote the safe use of plastic Additivess and reduce the health risks associated with them, the participants in the Plastic Additives market must take proactive steps. Moreover, collaborations must be established between industry participants and other stakeholders in order to mitigate the effects of fluctuating raw material costs and stringent regulations.
By Type Analysis
The field of plastic Additivess is multifaceted, with a variety of types and applications that have garnered traction in recent years. Anti-Microbial Additivess have emerged as a major player in the Plastic Additives Market, with pervasive applications in the healthcare, food packaging, and construction industries, to name a few. Anti-Microbial Additivess provide effective protection against a broad spectrum of microorganisms, mould, and bacteria, which has become increasingly essential in today's health- and safety-conscious society.
As consumer awareness of the need for safety has increased, the demand for Anti-Microbial products has skyrocketed. Manufacturers are incorporating these Additivess into a wide variety of products, including apparel, footwear, personal care products, kitchenware, and keyboards, to name a few. Anti-Microbial Additivess are in high demand because consumers are increasingly prepared to pay a premium for products that provide additional protection against dangerous bacteria.
Plastic Analysis
In terms of plastic types, high performance plastic dominates the market for plastic Additivess, holding the greatest market share. Due to their superior mechanical, thermal, and chemical properties, high performance plastics are favoured over traditional plastics in a variety of applications, including aerospace, automotive, electronics, and medical devices. Environmentally conscientious consumers who are increasingly aware of the environmental impact of plastics can also be catered to by high-performance plastics derived from bio-based or recycled materials.
High performance plastics are an ideal option for products that require long-lasting performance due to their superior durability and resistance to wear and tear. In addition, the improved performance of high performance plastics makes them an attractive option for applications where performance is crucial, such as in the aerospace industry or in medical devices. In spite of the fact that high performance plastics can be more expensive than conventional plastics, their long-lasting durability and superior performance can eventually mitigate the additional expense.
By Application Analysis
The Packaging segment dominates the Plastic Additives Market, holding the highest market share. The segment consists of a wide variety of Additivess, including UV stabilisers, anti-blocking agents, slide Additivess, and anti-static Additivess, among others. Plastic packaging has become an essential component of the food and beverage industry, among other applications, and is projected to expand substantially as a result of the economic growth of emerging economies.
Changing consumer lifestyles have increased the demand for convenience products, which in turn has increased the demand for packaging, particularly for on-the-go meals and munchies. In addition to urbanisation and the rise of modern retail formats such as supermarkets, hypermarkets, and online channels, urbanisation and the rise of modern retail formats have increased demand for packaging. Increasing consumer awareness of the environment's impact has resulted in a preference for eco-friendly packaging solutions, propelling the demand for sustainable packaging Additivess.
Key Market Segments
By Type
Plasticizers
Stabilizers
Flame retardants
Impact modifiers
Anti-Microbial
Others (Antistatic Agents, Blowing Agent, Fillers, and Nucleating Agents)By Plastic
Commodity plastic
Engineering plastic
High performance plasticBy Application
Packaging
Automotive
Consumer Goods
Construction
Others (pharmaceutical, sports, furniture, and agriculture)Growth Opportunity
A Necessary Component With Effects Similar to a Double-Edged Sword
Plastic, a lightweight and adaptable material, has had a significant impact on modern living by being utilised in a wide range of industries. Concerns have been expressed about its impact on the environment, prompting an investigation into plastic Additivess that play a crucial role in enhancing the material's properties. According to the findings of this investigation, the expansion of the plastic Additivess market is being driven by the use of biodegradable plastic Additivess, ecological technology, and high-performance plastic Additivess.
Biodegradable Additivess for Plastic
Biodegradable plastic Additivess have emerged as a game-changer in the plastics industry due to their ability to decompose into harmless natural components, thereby reducing the environmental impact of plastic products. An explosion in the demand for biodegradable plastic Additivess has resulted from the increasing public awareness of the negative effects of plastic on the natural environment. The use of these Additivess in packaging, bundling, and other applications is anticipated to contribute significantly to the expansion of the plastic Additivess market.
The Green Technology Revolution Taking Place in Plastic Additivess
Green technology has become a popular topic of conversation in numerous industries, including those coping with plastic Additivess. "Green technology" in the context of plastic Additivess refers to the use of renewable and sustainable resources that are environmentally friendly and have a smaller carbon footprint. Increasing acceptance of environmentally favourable technologies in plastic Additivess is anticipated to significantly drive the expansion of the plastic Additives market. Starch, cellulose, and vegetable oil are examples of bio-based plastic Additivess acquiring popularity due to their sustainability and environmental friendliness.
Conditions of the plastic Additivess market in developing nations
Asia-Pacific, Latin America, and Africa are experiencing a surge in demand for plastic Additivess as a result of their expanding economies, increasing populations, and increased levels of disposable income. This pattern is anticipated to persist. The demand for plastic Additivess in these regions is fueled by the expanding use of plastic in a variety of industries, including packaging, construction, automotive, and electronic manufacturing, among others. It is anticipated that the expansion of these industries will significantly contribute to the expansion of the market for plastic Additivess, thereby presenting market participants with a lucrative opportunity.
High-Performance Plastics and Composites Additivess
It is anticipated that the development of high-performance plastic Additivess will create new opportunities for the expansion of the plastic Additivess market. These Additivess enhance the plastic's characteristics, such as its durability, resistance to the effects of external forces, and strength. Thus, the plastic is more suitable for high-end applications in a variety of industries. It is anticipated that the development of new and innovative plastic Additivess, such as flame retardants, UV stabilisers, and antistatic agents, will increase demand for plastic Additivess, thereby propelling the growth of the plastic Additives market. This will be achieved by developing novel and innovative plastic Additivess.
Latest Trends
Plastic Additivess That Are Environmentally Friendly
Growing global concern regarding the impact of plastic on the environment has led to an increase in the demand for plastic Additivess that are less detrimental to the environment. Manufacturers are searching more than ever for methods that will enable them to reduce their carbon footprint without sacrificing product quality. In recent years, a number of environmentally friendly Additivess for plastic have become available, providing a long-term solution to the problems caused by plastic waste. Not only are these Additivess environmentally friendly, but they are also inexpensive, making them the preferred choice for manufacturers.
Introducing a Revolution to the Plastic Additivess Market
As a direct consequence of the introduction of bio-based and renewable plastic Additivess, the market for plastic Additivess is experiencing a sea change. These biodegradable and sustainable alternatives, which are derived from renewable resources such as plant-based compounds, are a more environmentally responsible replacement for traditional Additivess derived from petroleum. It has been demonstrated that they are effective at increasing the durability and resilience of plastic products, further solidifying their position as an industry game-changer.
Adapting to Manufacturers' One-of-a-Kind Requirements
Customization is becoming increasingly prevalent on the Plastic Additives Market, which is an intriguing trend to observe. Manufacturers increasingly seek customised solutions that are tailored to their particular requirements. As a result, numerous specialised plastic Additivess have been developed in order to meet these requirements. Due to this development, producers now have an advantage over their competitors. Customization not only results in increased value for the producer, but also ensures the creation of unique, high-quality items.
Developing a Strategy for the Introduction of Innovative Enhancements
The game-changing use of nanotechnology in plastic Additivess is shaping the future of the industry. Nanoparticles, for instance, are added to plastic products to increase their tensile strength, abrasion resistance, and overall weight. This has directly resulted in the emergence of a new category of functional materials with previously unattainable qualities. In order to further shape the future of the plastic Additives market, nanotechnology will continue to advance, which promises to create even more inventive means of enhancing the performance of plastic Additivess. This will significantly influence the market.
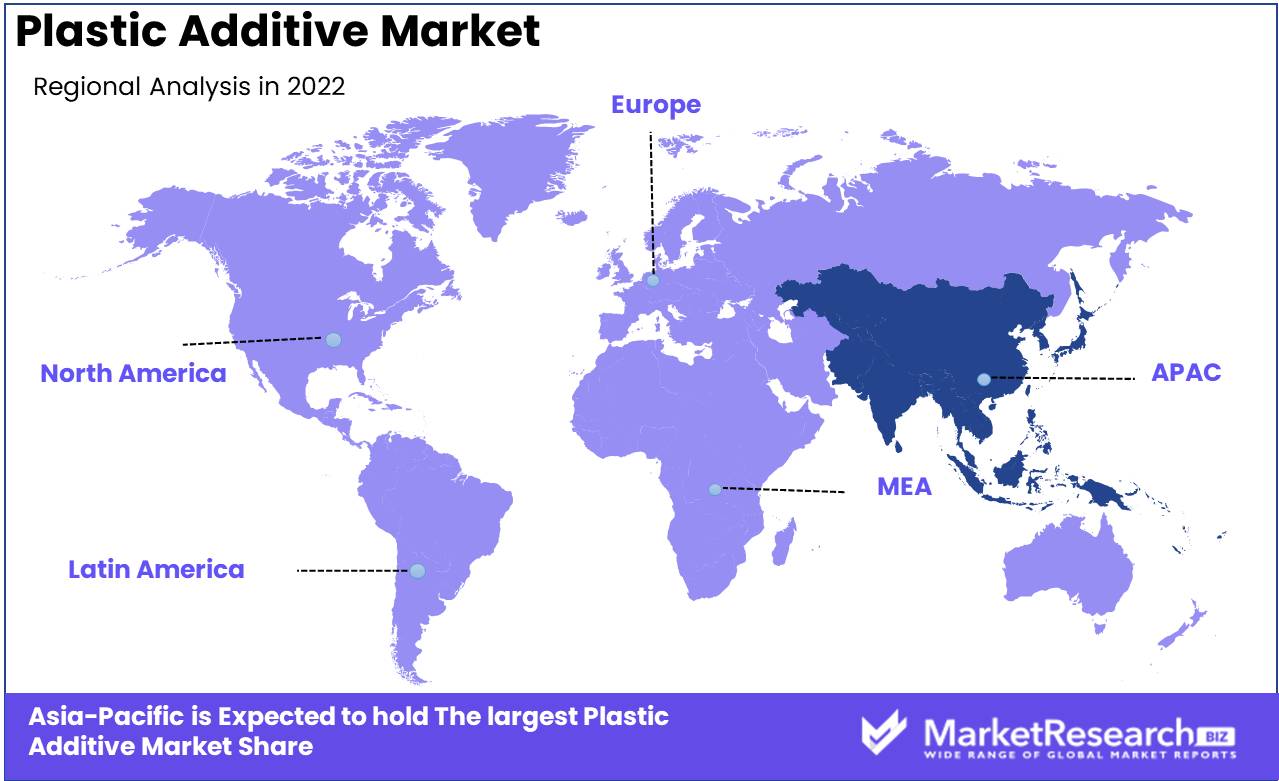
Regional Analysis
The manufacturing industry is undergoing a paradigm shift, and Asia-Pacific is expected to maintain a dominant market share position. Numerous manufacturers in the region have begun expanding, attracting investors, and delivering competitively priced, high-quality products. The Asia-Pacific manufacturing market has grown steadily in recent years due to the availability of inexpensive labour, enhanced infrastructure, and government support. Additionally, the region has benefited from favourable economic and technological conditions, paving the way for rapid industrialization.
Asia-Pacific has become a manufacturing hub due to its population of more than 4.5 billion people and extensive geographical diversity. The market is dominated by China, Japan, India, South Korea, and Taiwan, with China being the most significant producer of manufactured products worldwide. Japan and South Korea are renowned for their high-quality production of electronics, vehicles, and robots. In contrast, India's pharmaceutical and textile industries are thriving.
The region's unique business environment has contributed to its development, with the availability of low-cost labour serving as one of the primary drivers. The appropriate demographic dividend has allowed businesses to reduce labour expenses while attaining economies of scale. In addition, multinational corporations have a strong presence in the region, taking advantage of government incentives and employing millions of locals.
In the past decade, the Asia-Pacific region has made significant progress, with infrastructure investments enhancing connectivity and facilitating trade. Governments have also implemented tax incentives, reduced bureaucratic regulations, and streamlined procedures to promote industrialization. This has brought foreign investors to the region and increased demand for manufactured products.
Key Regions and Countries
North America
- US
- Canada
- Mexico
Western Europe
- Germany
- France
- The UK
- Spain
- Italy
- Portugal
- Ireland
- Austria
- Switzerland
- Benelux
- Nordic
- Rest of Western Europe
Eastern Europe
- Russia
- Poland
- The Czech Republic
- Greece
- Rest of Eastern Europe
APAC
- China
- Japan
- South Korea
- India
- Australia & New Zealand
- Indonesia
- Malaysia
- Philippines
- Singapore
- Thailand
- Vietnam
- Rest of APAC
Latin America
- Brazil
- Colombia
- Chile
- Argentina
- Costa Rica
- Rest of Latin America
Middle East & Africa
- Algeria
- Egypt
- Israel
- Kuwait
- Nigeria
- Saudi Arabia
- South Africa
- Turkey
- United Arab Emirates
- Rest of MEA
Key Players Analysis
Plastic Additivess market growth has become a global plastics industry hallmark. The plastic Additivess market aims to improve plastic characteristics. This market includes major international enterprises and small local manufacturers. These firms are striving to fulfil their clients' changing demands with new and effective solutions. In this highly competitive environment, BASF SE, The Dow Chemical Company, Eastman Chemical Company, Clariant AG, Evonik Industries AG, and Lanxess AG are fierce competitors. These companies are industry leaders.
German engineering giant BASF SE created many plastic Additivess, including stabilisers, antioxidants, flame retardants, and nucleating agents. Dow Chemical Company is the world's leading chemical and plastics supplier. The company sells processing aids, impact modifiers, and sliding agents, among other plastic Additivess. Eastman Chemical Company, noted for its wide range of speciality plastics and chemicals, makes plasticizers, flame retardants, and UV stabilisers. One of the industry's leading suppliers of plastic Additivess such antimicrobials, light stabilisers, and antioxidants is Switzerland-based Clariant AG. Germanic speciality chemical distributor Lanxess AG leads the market. Flame retardants, processing aids, and plasticizers are among the Additivess this company makes.
The most influential people in the plastic Additivess market are constantly coming up with new ideas, improving technology, and creating novel Additivess that improve functionality, durability, and environmental and occupational health and safety. They use their substantial expertise and skills to provide tailored solutions that fit their customers' needs and provide them an edge over competitors in the same market.
Top Key Players in Plastic Additives Market
- Saudi Basic Industries Corporation (SABIC)
- Covestro AG
- 3M Company
- Teijin Limited
- Mitsubishi Gas Chemical Company, Inc.
- Suzhou Omay Optical Material Co., Ltd.
- Rowland Technologies, An ORAFOL Company
- MacDermid Autotype Ltd.
- MGC Filsheet Co., Ltd.
- Dietrich Muller GmbH
Recent Development
In 2021, BASF introduced Tinuvin NOR 371 plastic Additivess. These compounds protect plastics against UV deterioration.
In 2020, Clariant released natural biodegradable plastic Additivess. Renewable Additivess improve plastic biodegradability and compostability.
In 2019, Dow introduced Amplify Si PE 1000 plastic Additivess. These Additivess improve polyethylene-silicone compatibility, enabling high-performance flexible packaging with stronger seals.
In 2018, Evonik Industries introduced TEGOMER AntiScratch plastic Additivess. These chemicals make plastics more scratch-resistant and durable.
In 2017, Lanxess AG introduced Levagard 2000 flame-retardant plastic Additivess. These Additivess make plastics safer for a range of uses by reducing their flammability.
Report Scope:
Report Features Description Market Value (2022) USD 52.57 Bn Forecast Revenue (2032) USD 80.86 Bn CAGR (2023-2032) 4.4% Base Year for Estimation 2022 Historic Period 2016-2022 Forecast Period 2023-2032 Report Coverage Revenue Forecast, Market Dynamics, COVID-19 Impact, Competitive Landscape, Recent Developments Segments Covered By Type: Plasticizers, Stabilizers, Flame retardants, Impact modifiers, Anti-Microbial, Others (Antistatic Agents, Blowing Agent, Fillers, and Nucleating Agents)
By Plastic: Commodity plastic, Engineering plastic, High performance plastic
By Application: Packaging, Automotive, Consumer Goods, Construction, Others (pharmaceutical, sports, furniture, and agriculture)Regional Analysis North America – The US, Canada, & Mexico; Western Europe – Germany, France, The UK, Spain, Italy, Portugal, Ireland, Austria, Switzerland, Benelux, Nordic, & Rest of Western Europe; Eastern Europe – Russia, Poland, The Czech Republic, Greece, & Rest of Eastern Europe; APAC – China, Japan, South Korea, India, Australia & New Zealand, Indonesia, Malaysia, Philippines, Singapore, Thailand, Vietnam, & Rest of APAC; Latin America – Brazil, Colombia, Chile, Argentina, Costa Rica, & Rest of Latin America; Middle East & Africa – Algeria, Egypt, Israel, Kuwait, Nigeria, Saudi Arabia, South Africa, Turkey, United Arab Emirates, & Rest of MEA Competitive Landscape Saudi Basic Industries Corporation (SABIC), Covestro AG, 3M Company, Teijin Limited, Mitsubishi Gas Chemical Company, Inc., Suzhou Omay Optical Material Co., Ltd., Rowland Technologies, An ORAFOL Company, MacDermid Autotype Ltd., MGC Filsheet Co., Ltd., Dietrich Muller GmbH Customization Scope Customization for segments, region/country-level will be provided. Moreover, additional customization can be done based on the requirements. Purchase Options We have three licenses to opt for: Single User License, Multi-User License (Up to 5 Users), Corporate Use License (Unlimited User and Printable PDF) -
-
- Saudi Basic Industries Corporation (SABIC)
- Covestro AG
- 3M Company
- Teijin Limited
- Mitsubishi Gas Chemical Company, Inc.
- Suzhou Omay Optical Material Co., Ltd.
- Rowland Technologies, An ORAFOL Company
- MacDermid Autotype Ltd.
- MGC Filsheet Co., Ltd.
- Dietrich Muller GmbH
Our Clients


View Our Licence Options
