Plant Biostimulants Market By Form (Dry and Liquid), By Active Ingredient (Acid Based, Seaweed Extract, Microbial, Others), By Crop Type (Cereals & grains, Fruits & vegetables, Turf & ornamentals, Oilseeds & pulses, Others), By Application (Foliar Treatment, Soil Treatment, Seed Treatment), By Region And Companies - Industry Segment Outlook, Market Assessment, Competition Scenario, Trends, And Forecast 2024-2033
-
48441
-
July 2024
-
300
-


-
This report was compiled by Shreyas Rokade Shreyas Rokade is a seasoned Research Analyst with CMFE, bringing extensive expertise in market research and consulting, with a strong background in Chemical Engineering. Correspondence Team Lead-CMFE Linkedin | Detailed Market research Methodology Our methodology involves a mix of primary research, including interviews with leading mental health experts, and secondary research from reputable medical journals and databases. View Detailed Methodology Page
-
Quick Navigation
Report Overview
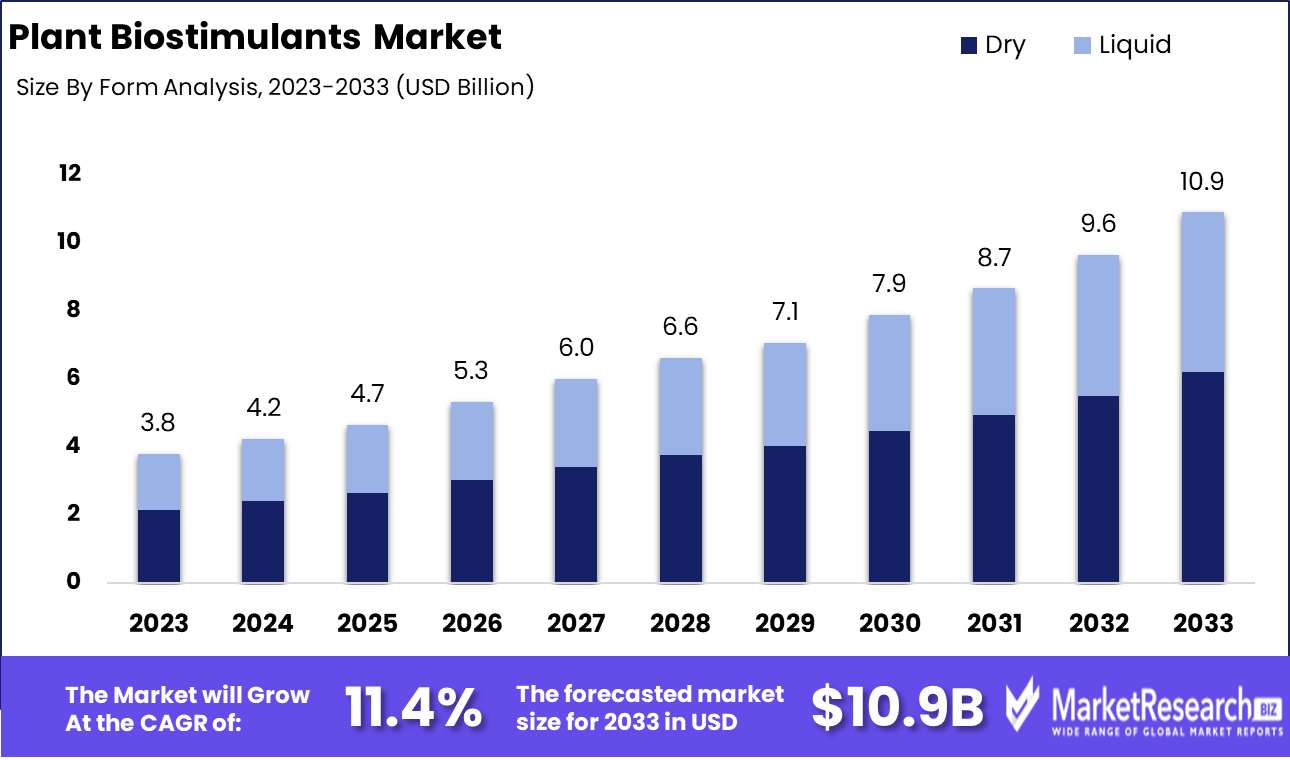
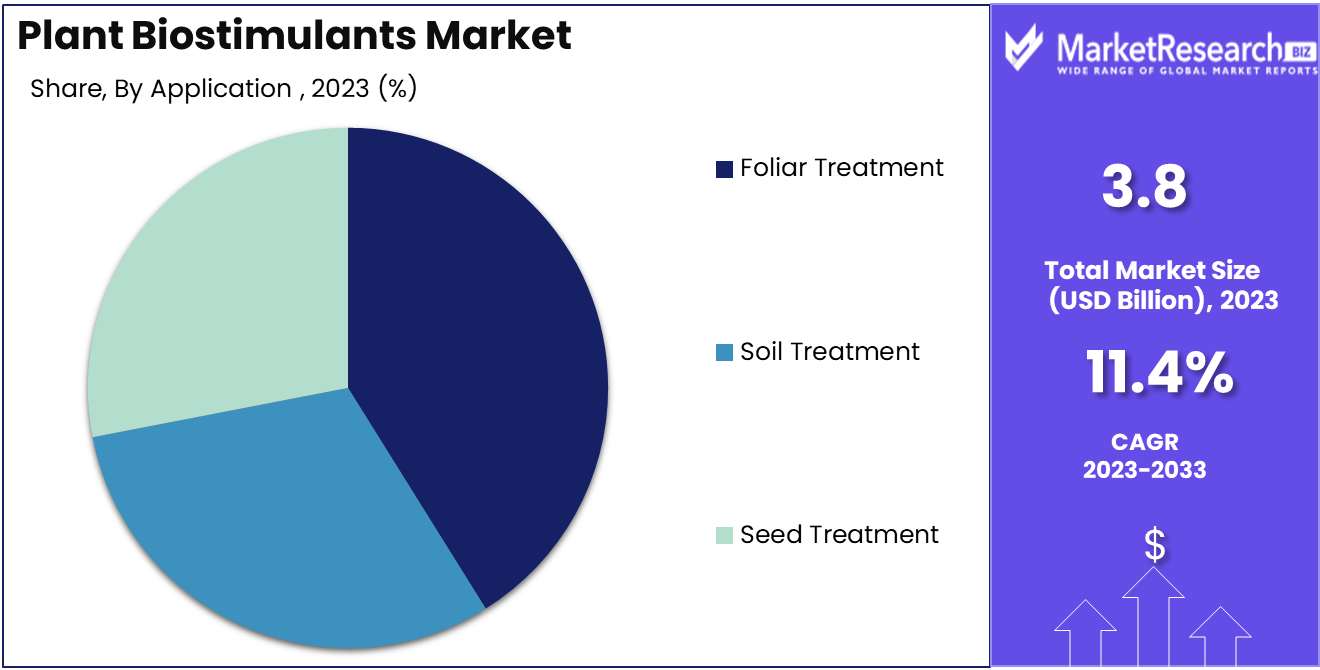
The Plant Biostimulants Market was valued at USD 3.8 billion in 2023. It is expected to reach USD 10.9 billion by 2033, with a CAGR of 11.4% during the forecast period from 2024 to 2033.
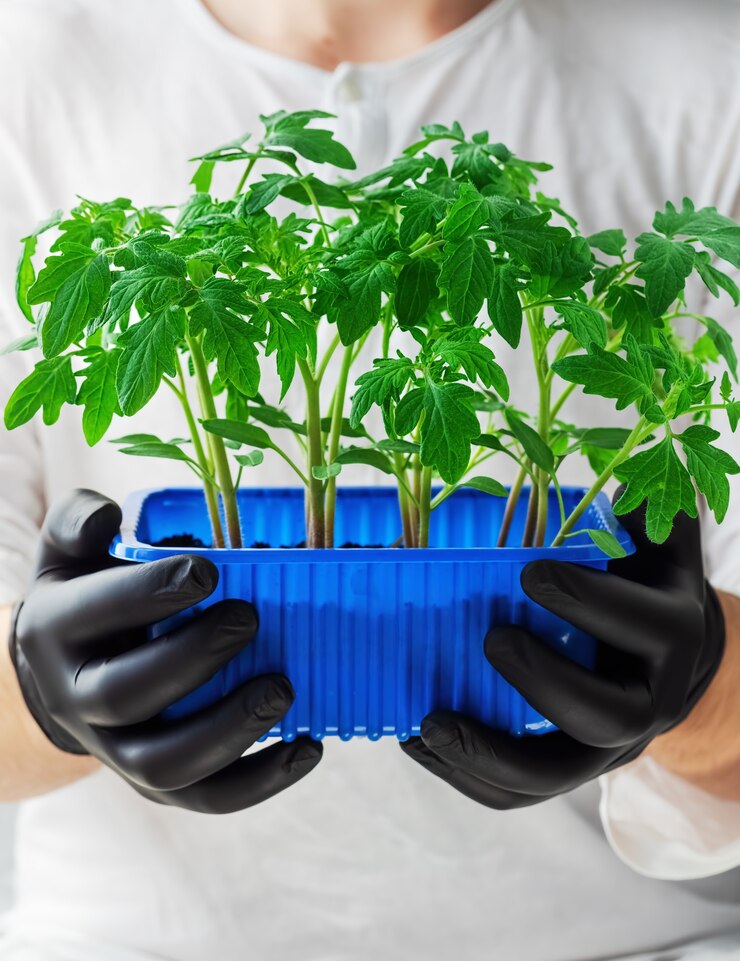
The Plant Biostimulants Market encompasses a range of biologically derived substances and microorganisms applied to plants or soils to enhance crop vigor, yield, quality, and resilience against abiotic stress. These products, distinct from fertilizers and pesticides, include natural compounds like humic acids, seaweed extracts, amino acids, and beneficial fungi and bacteria. They improve nutrient uptake, enhance root growth, and bolster plant metabolic processes. As sustainable agricultural practices gain prominence, the demand for plant biostimulants is driven by their ability to support environmentally friendly farming, improve crop productivity, and mitigate the impacts of climate change on agriculture.
The plant biostimulants market is poised for significant growth, driven by a confluence of factors that underscore its strategic importance in modern agriculture. As the demand for sustainable and organic agricultural practices intensifies, biostimulants are increasingly seen as essential for enhancing crop resilience and productivity. Farmers are becoming more aware of these products multifaceted benefits, such as improved nutrient uptake, better stress tolerance, and enhanced growth. This growing awareness is fueling market expansion, particularly as the agriculture sector seeks innovative solutions to meet rising food demands while minimizing environmental impact.
However, the market is not without its challenges. The high costs associated with biostimulant products remain a significant barrier to widespread adoption, especially among small-scale farmers. Additionally, regulatory challenges and the lack of standardized regulations across different countries pose hurdles for market participants. These disparities can complicate product approval processes and market entry strategies, potentially stifling innovation and growth. Despite these obstacles, the plant biostimulants market holds considerable promise.
Strategic investments in research and development, coupled with efforts to harmonize regulatory frameworks, could unlock substantial opportunities for growth and transformation in the agricultural landscape. As the sector evolves, stakeholders must navigate these complexities with agility and foresight to capitalize on the burgeoning demand for biostimulants.
Key Takeaways
- Market Growth: The Plant Biostimulants Market was valued at USD 3.8 billion in 2023. It is expected to reach USD 10.9 billion by 2033, with a CAGR of 11.4% during the forecast period from 2024 to 2033.
- By Form: Dry biostimulants dominated due to storage and transport advantages.
- By Active Ingredient: Acid-based biostimulants dominated due to enhancing plant resilience.
- By Crop Type: Cereals & grains dominated the Plant Biostimulants Market by crop type.
- By Application: Foliar Treatment dominated the plant biostimulants market by application.
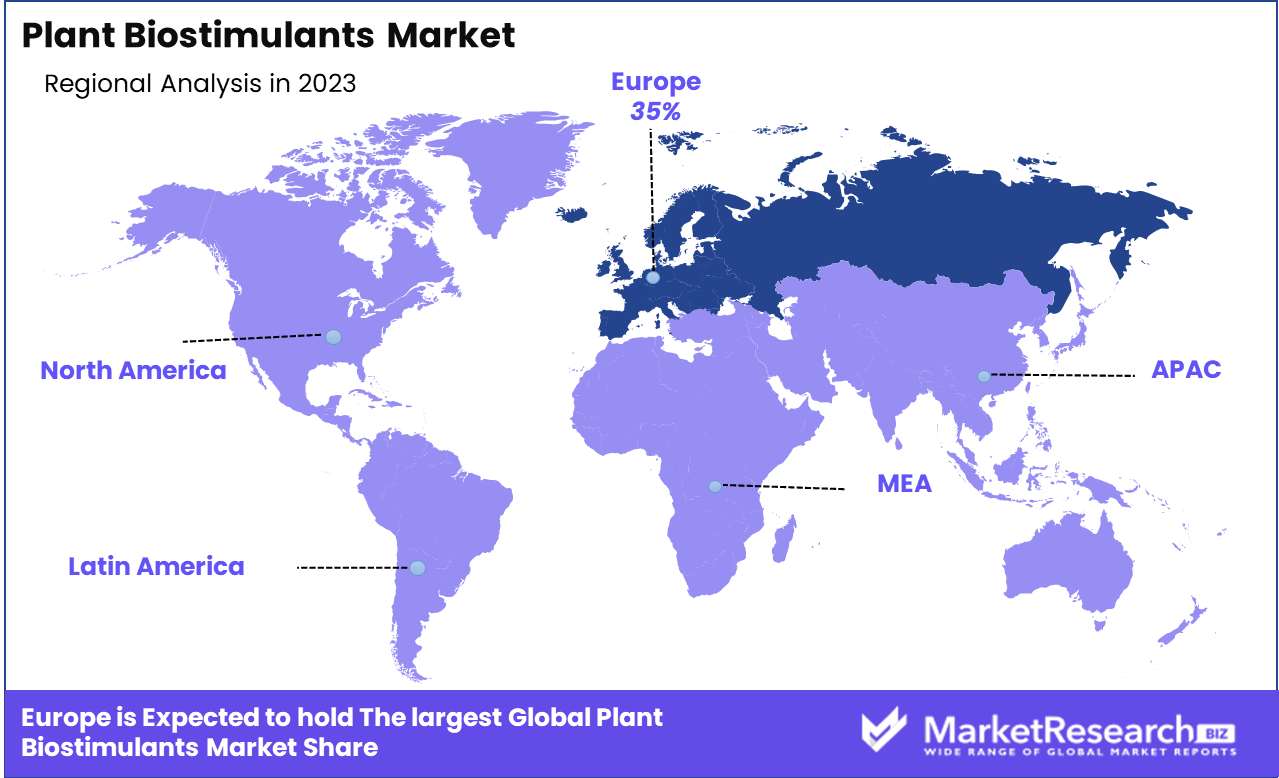
- Regional Dominance: Europe dominates the plant biostimulants market with a 35% global largest share.
- Growth Opportunity: The plant biostimulants market will thrive through formulation diversification and integration with digital farming technologies.
Driving factors
Increasing Demand for Sustainable and Eco-Friendly Agricultural Practices
The global shift towards sustainable and eco-friendly agricultural practices is significantly driving the growth of the plant biostimulants market. As awareness of environmental issues and the negative impacts of conventional farming methods grows, both farmers and policymakers are increasingly turning to biostimulants as a viable solution. Plant biostimulants, derived from natural substances, enhance nutrient uptake, increase stress tolerance, and improve crop quality, thereby aligning perfectly with the principles of sustainable agriculture. This alignment is evident in the rising adoption rates of biostimulants, which cater to the need for reducing chemical inputs and mitigating environmental footprints. According to recent market data, sustainable agricultural practices have been a key factor in the double-digit growth rate observed in the biostimulants sector over the past few years.
Rising Need to Enhance Crop Productivity and Yields
With the global population projected to reach 9.7 billion by 2050, the pressure on agricultural systems to enhance productivity and yields is immense. This need is a pivotal driver for the plant biostimulants market. Biostimulants play a critical role in this context by improving plant metabolism, enhancing root growth, and boosting resistance to abiotic stresses such as drought and salinity. These benefits directly translate to higher crop yields and better-quality produce. Industry reports indicate that crops treated with biostimulants can exhibit yield improvements ranging from 5% to 15%, depending on the crop type and environmental conditions. This substantial increase in productivity not only helps meet the growing food demand but also enhances farmers' profitability, further incentivizing the adoption of biostimulants.
Soil Degradation and Depletion of Natural Resources
Soil degradation and the depletion of natural resources pose significant challenges to global agricultural productivity. Factors such as erosion, nutrient depletion, and contamination have led to a decline in soil fertility, making it difficult to maintain high crop yields using traditional methods. Plant biostimulants offer a sustainable solution by improving soil structure, enhancing microbial activity, and increasing nutrient availability. These products help restore soil health and ensure the long-term sustainability of agricultural lands. Recent studies have shown that the use of biostimulants can improve soil organic matter content and microbial biomass, leading to more resilient and productive farming systems. As a result, the biostimulants market is experiencing robust growth, driven by the urgent need to combat soil degradation and ensure the efficient use of natural resources.
Restraining Factors
Lack of Standardized Regulations and Definitions: A Barrier to Market Expansion
The plant biostimulants market faces significant challenges due to the absence of standardized regulations and definitions across different regions. This inconsistency hampers the ability of manufacturers to achieve a uniform product quality and market entry strategy. The lack of clear regulatory frameworks creates ambiguity regarding product categorization, labeling, and permitted claims, which in turn affects market transparency and consumer trust.
Without harmonized regulations, companies struggle to comply with varying national and regional standards, leading to increased costs for regulatory approvals and compliance. This regulatory fragmentation can slow down the innovation and commercialization process, as companies may be reluctant to invest in developing new products without clear guidelines on regulatory approval processes and market requirements. Additionally, the absence of standardized definitions makes it difficult to communicate the benefits and applications of biostimulants to potential customers, thereby limiting market penetration and growth.
Unstable Supply Chain of Raw Materials: Impeding Consistent Production and Innovation
The plant biostimulants market is also constrained by the unstable supply chain of raw materials, which affects production consistency and innovation. The primary raw materials for biostimulants include seaweed extracts, humic substances, microbial inoculants, and various plant extracts. The supply of these materials can be highly variable due to factors such as seasonal availability, environmental conditions, and geopolitical issues.
For example, seaweed extracts, a key ingredient in many biostimulants, are subject to fluctuations in supply due to overharvesting, climate change, and regulatory restrictions on harvesting practices. Such instability can lead to significant price volatility, which affects the overall cost structure for manufacturers and can reduce profit margins. Furthermore, supply chain disruptions can delay production schedules, impacting the timely delivery of products to the market and undermining customer satisfaction.
Inconsistent raw material supply also stifles innovation by limiting the availability of high-quality inputs necessary for research and development. Companies may be less willing to invest in new product formulations if they cannot secure a reliable supply of essential raw materials. This can slow the development of more effective and diverse biostimulant products, thereby constraining the market's potential to expand and meet evolving agricultural demands.
By Form Analysis
In 2023, Dry biostimulants dominated due to storage and transport advantages.
In 2023, The "Dry" form held a dominant market position in the "By Form" segment of the Plant Biostimulants Market. This predominance can be attributed to the several advantages dry biostimulants offer, including ease of storage, longer shelf life, and cost-effectiveness in transportation. These factors make them particularly attractive for large-scale agricultural operations and markets with fluctuating climates where liquid formulations might suffer degradation. Additionally, dry biostimulants are often preferred for their versatility in application methods, allowing for seamless integration into various soil types and crop management practices.
Conversely, the "Liquid" form of plant biostimulants is gaining traction due to its ease of application and rapid absorption by plants. Liquid formulations are favored in precision agriculture and controlled-environment agriculture (CEA) systems, where quick nutrient uptake is critical for optimizing plant growth cycles. Their popularity is also rising in regions with advanced agricultural technologies, where the immediate bioavailability of nutrients can significantly enhance crop yield and quality. Despite their higher cost and shorter shelf life compared to dry forms, the liquid biostimulants' efficacy in targeted applications ensures a robust growth trajectory within the market.
By Active Ingredient Analysis
In 2023, Acid-based biostimulants dominated due to enhancing plant resilience.
In 2023, Acid Based held a dominant market position in the Active Ingredient segment of the Plant Biostimulants Market. The superiority of acid-based biostimulants can be attributed to their proven efficacy in enhancing plant growth and resilience. These biostimulants, often derived from humic and fulvic acids, are highly regarded for their ability to improve nutrient uptake, soil structure, and stress tolerance in plants.
Seaweed extract-based biostimulants also saw significant use, benefiting from their rich composition of growth hormones, vitamins, and minerals, which collectively promote robust plant development. Seaweed extracts are particularly valued for their natural origin and environmental sustainability.
Microbial biostimulants, comprising beneficial bacteria and fungi, continued to gain traction due to their role in fostering symbiotic relationships that enhance nutrient availability and plant health. These microbial solutions are critical in promoting sustainable agricultural practices and reducing dependency on chemical fertilizers.
The Others category, encompassing protein hydrolysates and botanical extracts, contributed to market diversity by offering alternative mechanisms for stimulating plant growth and resilience. Collectively, these segments highlight the dynamic and evolving nature of the plant biostimulants market, driven by a growing demand for sustainable and efficient agricultural inputs.
By Crop Type Analysis
In 2023, Cereals & grains dominated the Plant Biostimulants Market by crop type.
In 2023, Cereals & grains held a dominant market position in the By Crop Type segment of the Plant Biostimulants Market. This segment's prominence can be attributed to the extensive cultivation and high global demand for cereals and grains, including wheat, rice, and maize. Plant biostimulants, known for enhancing nutrient uptake, stress tolerance, and crop yield, have found significant applications in these crops, driving their market dominance.
Fruits & vegetables represent the second-largest segment, driven by increasing consumer preference for healthy, fresh produce. The use of biostimulants in this sub-segment helps improve fruit set, quality, and resistance to pests and diseases, aligning with the rising demand for organic and sustainable farming practices.
Turf & ornamentals follow, with a growing market driven by landscaping and recreational spaces expansion, particularly in urban areas. Biostimulants contribute to the aesthetic quality and health of turf and ornamental plants, supporting their market growth.
Oilseeds & pulses also show significant potential due to the global demand for oils and proteins. Biostimulants enhance the germination, growth, and yield of crops like soybeans and peanuts, thus fostering this sub-segment's growth.
Finally, Others, including medicinal and aromatic plants, complete the market landscape. These crops, though niche, benefit from biostimulants to improve essential oil content and overall plant vigor, contributing to their specialized market growth.
By Application Analysis
In 2023, Foliar Treatment dominated the plant biostimulants market by application.
In 2023, Foliar Treatment held a dominant market position in the "By Application" segment of the Plant Biostimulants Market. Foliar treatment, which involves the direct application of biostimulants to plant leaves, accounted for the largest share due to its rapid absorption and immediate impact on plant health and growth. This method is favored for its efficiency in nutrient uptake and ability to swiftly address deficiencies, thus driving its widespread adoption among commercial growers and farmers.
Soil treatment, the second significant segment, leverages the application of biostimulants directly to the soil to enhance microbial activity and nutrient availability. This method supports root development and overall soil health, making it essential for sustainable agriculture practices. Its growing adoption is driven by the increasing emphasis on soil conservation and productivity.
Seed treatment, the third key segment, involves the coating of seeds with biostimulants before planting. This practice aims to improve seed germination rates and early plant vigor, offering a strong start to crop growth. While it holds a smaller market share compared to foliar and soil treatments, seed treatment is gaining traction due to its potential to enhance crop yields and resilience from the very beginning of the plant lifecycle.
Key Market Segments
By Form
- Dry
- Liquid
By Active Ingredient
- Acid Based
- Seaweed Extract
- Microbial
- Others
By Crop Type
- Cereals & grains
- Fruits & vegetables
- Turf & ornamentals
- Oilseeds & pulses
- Others
By Application
- Foliar Treatment
- Soil Treatment
- Seed Treatment
Growth Opportunity
Diversification of Biostimulant Formulations
The global plant biostimulants market is poised for significant growth, driven by the diversification of biostimulant formulations. This trend encompasses the development of novel products tailored to meet specific crop needs and environmental conditions. Companies are increasingly focusing on creating multi-functional biostimulants that combine various active ingredients, such as amino acids, humic substances, and seaweed extracts, to enhance plant growth and resilience. This diversification not only broadens the application range of biostimulants but also caters to the diverse demands of different agricultural sectors, thereby expanding market reach and fostering robust growth opportunities.
Integration with Digital Farming Technologies
Another pivotal opportunity lies in the integration of biostimulants with digital farming technologies. Precision agriculture, powered by advancements in IoT, AI, and big data analytics, allows for the precise application of biostimulants, optimizing their efficacy and minimizing waste. Smart sensors and drones can monitor plant health in real time, providing data that can be used to tailor biostimulant applications to the specific needs of crops at various growth stages. This synergy between biostimulants and digital technologies not only enhances crop yield and quality but also aligns with sustainable agricultural practices, meeting the growing consumer demand for eco-friendly farming solutions.
Latest Trends
Increasing Adoption of Organic and Sustainable Farming Practices
The plant biostimulants market is poised for significant growth, driven by the escalating adoption of organic and sustainable farming practices. As global agricultural sectors face mounting pressure to reduce their environmental impact, farmers and agribusinesses are increasingly turning to biostimulants as a viable alternative to traditional chemical inputs. These products, which enhance plant growth and resilience without harming the ecosystem, align perfectly with the principles of organic farming. Regulatory frameworks, such as the European Green Deal and the USDA Organic Certification, further incentivize the shift towards sustainable agriculture, fostering a fertile ground for biostimulant market expansion.
Rising Popularity of Amino Acid-based Biostimulants
Another critical trend influencing the market is the rising popularity of amino acid-based biostimulants. These products are gaining traction due to their proven efficacy in enhancing plant metabolism, improving nutrient uptake, and increasing stress tolerance. Farmers are increasingly recognizing the benefits of amino acid-based formulations, which not only boost crop yield and quality but also contribute to soil health. As research and development in this domain progress, more advanced and efficient products are expected to enter the market, further driving adoption. Key players in the industry are investing heavily in innovation, aiming to capitalize on this growing demand and solidify their market position.
Regional Analysis
Europe dominates the plant biostimulants market with a 35% global largest share.
The plant biostimulants market demonstrates significant regional variations, driven by differing agricultural practices, regulatory environments, and technological advancements. Europe dominates this market, accounting for approximately 35% of the global largest market share, primarily due to stringent environmental regulations and a strong emphasis on sustainable agriculture. Countries such as Spain, Italy, and France are at the forefront, driven by extensive R&D activities and robust organic farming practices sectors. North America follows, propelled by the adoption of advanced farming techniques and a high demand for organic produce. The U.S. leads this region, contributing significantly due to substantial investments in agricultural biotechnology.
In the Asia Pacific region, rapid population growth and increasing food security concerns fuel market expansion, with China and India being major contributors due to their large agricultural bases and government initiatives supporting sustainable farming. The Middle East & Africa region shows moderate growth, hindered by limited awareness and technological adoption, although countries like South Africa and Saudi Arabia are emerging markets.
Latin America, with its vast agricultural landscapes, particularly in Brazil and Argentina, is witnessing steady growth supported by the increasing shift towards eco-friendly agricultural inputs. Overall, Europe’s leading position is bolstered by favorable policies and substantial market investments, ensuring its continued dominance in the plant biostimulants market.
Key Regions and Countries
North America
- The US
- Canada
- Rest of North America
Europe
- Germany
- France
- The UK
- Spain
- Netherlands
- Russia
- Italy
- Rest of Europe
Asia-Pacific
- China
- Japan
- Singapore
- Thailand
- South Korea
- Vietnam
- India
- New Zealand
- Rest of Asia Pacific
Latin America
- Mexico
- Brazil
- Rest of Latin America
Middle East & Africa
- Saudi Arabia
- South Africa
- UAE
- Rest of the Middle East & Africa
Key Players Analysis
The global Plant Biostimulants Market is poised for significant growth in 2024, driven by the escalating demand for sustainable agricultural solutions. Key industry players are strategically positioned to leverage this trend.
BASF SE and Syngenta AG stand out due to their extensive research and development capabilities, enabling them to introduce innovative biostimulant products that enhance crop resilience and yield. Novozyme A/S is leveraging its expertise in enzyme and microbial technology to develop advanced biostimulants that improve nutrient uptake and stress tolerance in plants.
UPL Corporation Limited and FMC Corporation are focusing on integrating biostimulants with their existing crop protection solutions, providing comprehensive offerings to farmers. Isagro S.p.A. and Italpollina Spa are leveraging their biotechnological advancements to offer natural and organic biostimulants, catering to the growing preference for eco-friendly agricultural inputs.
Acadian Seaplants Limited and BioAtlantis Ltd. are capitalizing on their specialization in seaweed-based biostimulants, which are increasingly recognized for their efficacy in promoting plant growth and stress resistance. Agrinos AS and Micromix are emphasizing microbial biostimulants, addressing the need for sustainable soil health management.
Emerging players like Biostadt India Ltd. and Koppert B.V. are making significant inroads with region-specific products tailored to local agricultural practices. Trade Corporation International, Agricen, Omex Agrifluids Ltd., Valagro SpA, and Oxon Italia S.p.A. are also expanding their market presence through strategic collaborations and innovative product launches.
Overall, the competitive landscape of the Plant Biostimulants Market in 2024 is characterized by innovation, sustainability, and strategic alliances, positioning key players to meet the evolving needs of modern agriculture.
Market Key Players
- BASF SE
- Isagro Group
- Novozyme A/S
- UPL Corporation Limited
- FMC Corporation
- Acadian Seaplants Limited
- Agrinos AS
- BioAtlantis Ltd.
- Biostadt India Ltd.
- Koppert B.V.
- Italpollina Spa
- Micromix
- Syngenta AG
- Trade Corporation International
- Agricen
- Omex Agrifluids Ltd.
- Valagro SpA
- Oxon Italia S.p.A.
Recent Development
- In May 2024, Valagro introduced Talete™, a new biostimulant specifically designed to help plants cope with water stress. This launch is part of Valagro’s ongoing commitment to address critical agricultural challenges through advanced biostimulant technologies.
- In April 2024, UPL Limited unveiled its strategic partnership with Bioline Agrosciences to develop and commercialize innovative biostimulant solutions. This collaboration focuses on leveraging Bioline's expertise in biologicals with UPL's extensive market reach to enhance the adoption of biostimulants among global farmers.
- In June 2024, BASF SE announced the launch of their new biostimulant product, Revysol® Bio, which aims to enhance plant health and productivity. This product integrates novel biostimulant compounds with BASF’s existing agricultural solutions, offering farmers an effective tool to improve crop yields sustainably.
Report Scope
Report Features Description Market Value (2023) USD 3.8 Billion Forecast Revenue (2033) USD 10.9 Billion CAGR (2024-2032) 11.4% Base Year for Estimation 2023 Historic Period 2016-2023 Forecast Period 2024-2033 Report Coverage Revenue Forecast, Market Dynamics, COVID-19 Impact, Competitive Landscape, Recent Developments Segments Covered By Form (Dry and Liquid), By Active Ingredient (Acid Based, Seaweed Extract, Microbial, Others), By Crop Type (Cereals & grains, Fruits & vegetables, Turf & ornamentals, Oilseeds & pulses, Others), By Application (Foliar Treatment, Soil Treatment, Seed Treatment) Regional Analysis North America - The US, Canada, Rest of North America, Europe - Germany, France, The UK, Spain, Italy, Russia, Netherlands, Rest of Europe, Asia-Pacific - China, Japan, South Korea, India, New Zealand, Singapore, Thailand, Vietnam, Rest of Asia Pacific, Latin America - Brazil, Mexico, Rest of Latin America, Middle East & Africa - South Africa, Saudi Arabia, UAE, Rest of Middle East & Africa Competitive Landscape BASF SE, Isagro Group, Novozyme A/S, UPL Corporation Limited, FMC Corporation, Acadian Seaplants Limited, Agrinos AS, BioAtlantis Ltd., Biostadt India Ltd., Koppert B.V., Italpollina Spa, Micromix, Syngenta AG, Trade Corporation International, Agricen, Omex Agrifluids Ltd., Valagro SpA, Oxon Italia S.p.A. Customization Scope Customization for segments, region/country-level will be provided. Moreover, additional customization can be done based on the requirements. Purchase Options We have three licenses to opt for Single User License, Multi-User License (Up to 5 Users), Corporate Use License (Unlimited User and Printable PDF) -
- 1. Executive Summary
- 1.1. Definition
- 1.2. Taxonomy
- 1.3. Research Scope
- 1.4. Key Analysis
- 1.5. Key Findings by Major Segments
- 1.6. Top strategies by Major Players
- 2. Global Plant Biostimulants Market Overview
- 2.1. Plant Biostimulants Market Dynamics
- 2.1.1. Drivers
- 2.1.2. Opportunities
- 2.1.3. Restraints
- 2.1.4. Challenges
- 2.2. Macro-economic Factors
- 2.3. Regulatory Framework
- 2.4. Market Investment Feasibility Index
- 2.5. PEST Analysis
- 2.6. PORTER’S Five Force Analysis
- 2.7. Drivers & Restraints Impact Analysis
- 2.8. Industry Chain Analysis
- 2.9. Cost Structure Analysis
- 2.10. Marketing Strategy
- 2.11. Russia-Ukraine War Impact Analysis
- 2.12. Opportunity Map Analysis
- 2.13. Market Competition Scenario Analysis
- 2.14. Product Life Cycle Analysis
- 2.15. Opportunity Orbits
- 2.16. Manufacturer Intensity Map
- 2.17. Major Companies sales by Value & Volume
- 2.1. Plant Biostimulants Market Dynamics
- 3. Global Plant Biostimulants Market Analysis, Opportunity and Forecast, 2016-2032
- 3.1. Global Plant Biostimulants Market Analysis, 2016-2021
- 3.2. Global Plant Biostimulants Market Opportunity and Forecast, 2023-2032
- 3.3. Global Plant Biostimulants Market Analysis, Opportunity and Forecast, By Form, 2016-2032
- 3.3.1. Global Plant Biostimulants Market Analysis by Form: Introduction
- 3.3.2. Market Size Absolute $ Opportunity Analysis and Forecast, By Form, 2016-2032
- 3.3.3. Dry
- 3.3.4. Liquid
- 3.4. Global Plant Biostimulants Market Analysis, Opportunity and Forecast, By Active Ingredient , 2016-2032
- 3.4.1. Global Plant Biostimulants Market Analysis by Active Ingredient : Introduction
- 3.4.2. Market Size Absolute $ Opportunity Analysis and Forecast, By Active Ingredient , 2016-2032
- 3.4.3. Acid Based
- 3.4.4. Seaweed Extract
- 3.4.5. Microbial
- 3.4.6. Others
- 3.5. Global Plant Biostimulants Market Analysis, Opportunity and Forecast, By Crop Type, 2016-2032
- 3.5.1. Global Plant Biostimulants Market Analysis by Crop Type: Introduction
- 3.5.2. Market Size Absolute $ Opportunity Analysis and Forecast, By Crop Type, 2016-2032
- 3.5.3. Cereals & grains
- 3.5.4. Fruits & vegetables
- 3.5.5. Turf & ornamentals
- 3.5.6. Oilseeds & pulses
- 3.5.7. Others
- 3.6. Global Plant Biostimulants Market Analysis, Opportunity and Forecast, By Application, 2016-2032
- 3.6.1. Global Plant Biostimulants Market Analysis by Application: Introduction
- 3.6.2. Market Size Absolute $ Opportunity Analysis and Forecast, By Application, 2016-2032
- 3.6.3. Foliar Treatment
- 3.6.4. Soil Treatment
- 3.6.5. Seed Treatment
- 4. North America Plant Biostimulants Market Analysis, Opportunity and Forecast, 2016-2032
- 4.1. North America Plant Biostimulants Market Analysis, 2016-2021
- 4.2. North America Plant Biostimulants Market Opportunity and Forecast, 2023-2032
- 4.3. North America Plant Biostimulants Market Analysis, Opportunity and Forecast, By Form, 2016-2032
- 4.3.1. North America Plant Biostimulants Market Analysis by Form: Introduction
- 4.3.2. Market Size Absolute $ Opportunity Analysis and Forecast, By Form, 2016-2032
- 4.3.3. Dry
- 4.3.4. Liquid
- 4.4. North America Plant Biostimulants Market Analysis, Opportunity and Forecast, By Active Ingredient , 2016-2032
- 4.4.1. North America Plant Biostimulants Market Analysis by Active Ingredient : Introduction
- 4.4.2. Market Size Absolute $ Opportunity Analysis and Forecast, By Active Ingredient , 2016-2032
- 4.4.3. Acid Based
- 4.4.4. Seaweed Extract
- 4.4.5. Microbial
- 4.4.6. Others
- 4.5. North America Plant Biostimulants Market Analysis, Opportunity and Forecast, By Crop Type, 2016-2032
- 4.5.1. North America Plant Biostimulants Market Analysis by Crop Type: Introduction
- 4.5.2. Market Size Absolute $ Opportunity Analysis and Forecast, By Crop Type, 2016-2032
- 4.5.3. Cereals & grains
- 4.5.4. Fruits & vegetables
- 4.5.5. Turf & ornamentals
- 4.5.6. Oilseeds & pulses
- 4.5.7. Others
- 4.6. North America Plant Biostimulants Market Analysis, Opportunity and Forecast, By Application, 2016-2032
- 4.6.1. North America Plant Biostimulants Market Analysis by Application: Introduction
- 4.6.2. Market Size Absolute $ Opportunity Analysis and Forecast, By Application, 2016-2032
- 4.6.3. Foliar Treatment
- 4.6.4. Soil Treatment
- 4.6.5. Seed Treatment
- 4.7. North America Plant Biostimulants Market Analysis, Opportunity and Forecast, By Country , 2016-2032
- 4.7.1. North America Plant Biostimulants Market Analysis by Country : Introduction
- 4.7.2. Market Size Absolute $ Opportunity Analysis and Forecast, Country , 2016-2032
- 4.7.2.1. The US
- 4.7.2.2. Canada
- 4.7.2.3. Mexico
- 5. Western Europe Plant Biostimulants Market Analysis, Opportunity and Forecast, 2016-2032
- 5.1. Western Europe Plant Biostimulants Market Analysis, 2016-2021
- 5.2. Western Europe Plant Biostimulants Market Opportunity and Forecast, 2023-2032
- 5.3. Western Europe Plant Biostimulants Market Analysis, Opportunity and Forecast, By Form, 2016-2032
- 5.3.1. Western Europe Plant Biostimulants Market Analysis by Form: Introduction
- 5.3.2. Market Size Absolute $ Opportunity Analysis and Forecast, By Form, 2016-2032
- 5.3.3. Dry
- 5.3.4. Liquid
- 5.4. Western Europe Plant Biostimulants Market Analysis, Opportunity and Forecast, By Active Ingredient , 2016-2032
- 5.4.1. Western Europe Plant Biostimulants Market Analysis by Active Ingredient : Introduction
- 5.4.2. Market Size Absolute $ Opportunity Analysis and Forecast, By Active Ingredient , 2016-2032
- 5.4.3. Acid Based
- 5.4.4. Seaweed Extract
- 5.4.5. Microbial
- 5.4.6. Others
- 5.5. Western Europe Plant Biostimulants Market Analysis, Opportunity and Forecast, By Crop Type, 2016-2032
- 5.5.1. Western Europe Plant Biostimulants Market Analysis by Crop Type: Introduction
- 5.5.2. Market Size Absolute $ Opportunity Analysis and Forecast, By Crop Type, 2016-2032
- 5.5.3. Cereals & grains
- 5.5.4. Fruits & vegetables
- 5.5.5. Turf & ornamentals
- 5.5.6. Oilseeds & pulses
- 5.5.7. Others
- 5.6. Western Europe Plant Biostimulants Market Analysis, Opportunity and Forecast, By Application, 2016-2032
- 5.6.1. Western Europe Plant Biostimulants Market Analysis by Application: Introduction
- 5.6.2. Market Size Absolute $ Opportunity Analysis and Forecast, By Application, 2016-2032
- 5.6.3. Foliar Treatment
- 5.6.4. Soil Treatment
- 5.6.5. Seed Treatment
- 5.7. Western Europe Plant Biostimulants Market Analysis, Opportunity and Forecast, By Country , 2016-2032
- 5.7.1. Western Europe Plant Biostimulants Market Analysis by Country : Introduction
- 5.7.2. Market Size Absolute $ Opportunity Analysis and Forecast, Country , 2016-2032
- 5.7.2.1. Germany
- 5.7.2.2. France
- 5.7.2.3. The UK
- 5.7.2.4. Spain
- 5.7.2.5. Italy
- 5.7.2.6. Portugal
- 5.7.2.7. Ireland
- 5.7.2.8. Austria
- 5.7.2.9. Switzerland
- 5.7.2.10. Benelux
- 5.7.2.11. Nordic
- 5.7.2.12. Rest of Western Europe
- 6. Eastern Europe Plant Biostimulants Market Analysis, Opportunity and Forecast, 2016-2032
- 6.1. Eastern Europe Plant Biostimulants Market Analysis, 2016-2021
- 6.2. Eastern Europe Plant Biostimulants Market Opportunity and Forecast, 2023-2032
- 6.3. Eastern Europe Plant Biostimulants Market Analysis, Opportunity and Forecast, By Form, 2016-2032
- 6.3.1. Eastern Europe Plant Biostimulants Market Analysis by Form: Introduction
- 6.3.2. Market Size Absolute $ Opportunity Analysis and Forecast, By Form, 2016-2032
- 6.3.3. Dry
- 6.3.4. Liquid
- 6.4. Eastern Europe Plant Biostimulants Market Analysis, Opportunity and Forecast, By Active Ingredient , 2016-2032
- 6.4.1. Eastern Europe Plant Biostimulants Market Analysis by Active Ingredient : Introduction
- 6.4.2. Market Size Absolute $ Opportunity Analysis and Forecast, By Active Ingredient , 2016-2032
- 6.4.3. Acid Based
- 6.4.4. Seaweed Extract
- 6.4.5. Microbial
- 6.4.6. Others
- 6.5. Eastern Europe Plant Biostimulants Market Analysis, Opportunity and Forecast, By Crop Type, 2016-2032
- 6.5.1. Eastern Europe Plant Biostimulants Market Analysis by Crop Type: Introduction
- 6.5.2. Market Size Absolute $ Opportunity Analysis and Forecast, By Crop Type, 2016-2032
- 6.5.3. Cereals & grains
- 6.5.4. Fruits & vegetables
- 6.5.5. Turf & ornamentals
- 6.5.6. Oilseeds & pulses
- 6.5.7. Others
- 6.6. Eastern Europe Plant Biostimulants Market Analysis, Opportunity and Forecast, By Application, 2016-2032
- 6.6.1. Eastern Europe Plant Biostimulants Market Analysis by Application: Introduction
- 6.6.2. Market Size Absolute $ Opportunity Analysis and Forecast, By Application, 2016-2032
- 6.6.3. Foliar Treatment
- 6.6.4. Soil Treatment
- 6.6.5. Seed Treatment
- 6.7. Eastern Europe Plant Biostimulants Market Analysis, Opportunity and Forecast, By Country , 2016-2032
- 6.7.1. Eastern Europe Plant Biostimulants Market Analysis by Country : Introduction
- 6.7.2. Market Size Absolute $ Opportunity Analysis and Forecast, Country , 2016-2032
- 6.7.2.1. Russia
- 6.7.2.2. Poland
- 6.7.2.3. The Czech Republic
- 6.7.2.4. Greece
- 6.7.2.5. Rest of Eastern Europe
- 7. APAC Plant Biostimulants Market Analysis, Opportunity and Forecast, 2016-2032
- 7.1. APAC Plant Biostimulants Market Analysis, 2016-2021
- 7.2. APAC Plant Biostimulants Market Opportunity and Forecast, 2023-2032
- 7.3. APAC Plant Biostimulants Market Analysis, Opportunity and Forecast, By Form, 2016-2032
- 7.3.1. APAC Plant Biostimulants Market Analysis by Form: Introduction
- 7.3.2. Market Size Absolute $ Opportunity Analysis and Forecast, By Form, 2016-2032
- 7.3.3. Dry
- 7.3.4. Liquid
- 7.4. APAC Plant Biostimulants Market Analysis, Opportunity and Forecast, By Active Ingredient , 2016-2032
- 7.4.1. APAC Plant Biostimulants Market Analysis by Active Ingredient : Introduction
- 7.4.2. Market Size Absolute $ Opportunity Analysis and Forecast, By Active Ingredient , 2016-2032
- 7.4.3. Acid Based
- 7.4.4. Seaweed Extract
- 7.4.5. Microbial
- 7.4.6. Others
- 7.5. APAC Plant Biostimulants Market Analysis, Opportunity and Forecast, By Crop Type, 2016-2032
- 7.5.1. APAC Plant Biostimulants Market Analysis by Crop Type: Introduction
- 7.5.2. Market Size Absolute $ Opportunity Analysis and Forecast, By Crop Type, 2016-2032
- 7.5.3. Cereals & grains
- 7.5.4. Fruits & vegetables
- 7.5.5. Turf & ornamentals
- 7.5.6. Oilseeds & pulses
- 7.5.7. Others
- 7.6. APAC Plant Biostimulants Market Analysis, Opportunity and Forecast, By Application, 2016-2032
- 7.6.1. APAC Plant Biostimulants Market Analysis by Application: Introduction
- 7.6.2. Market Size Absolute $ Opportunity Analysis and Forecast, By Application, 2016-2032
- 7.6.3. Foliar Treatment
- 7.6.4. Soil Treatment
- 7.6.5. Seed Treatment
- 7.7. APAC Plant Biostimulants Market Analysis, Opportunity and Forecast, By Country , 2016-2032
- 7.7.1. APAC Plant Biostimulants Market Analysis by Country : Introduction
- 7.7.2. Market Size Absolute $ Opportunity Analysis and Forecast, Country , 2016-2032
- 7.7.2.1. China
- 7.7.2.2. Japan
- 7.7.2.3. South Korea
- 7.7.2.4. India
- 7.7.2.5. Australia & New Zeland
- 7.7.2.6. Indonesia
- 7.7.2.7. Malaysia
- 7.7.2.8. Philippines
- 7.7.2.9. Singapore
- 7.7.2.10. Thailand
- 7.7.2.11. Vietnam
- 7.7.2.12. Rest of APAC
- 8. Latin America Plant Biostimulants Market Analysis, Opportunity and Forecast, 2016-2032
- 8.1. Latin America Plant Biostimulants Market Analysis, 2016-2021
- 8.2. Latin America Plant Biostimulants Market Opportunity and Forecast, 2023-2032
- 8.3. Latin America Plant Biostimulants Market Analysis, Opportunity and Forecast, By Form, 2016-2032
- 8.3.1. Latin America Plant Biostimulants Market Analysis by Form: Introduction
- 8.3.2. Market Size Absolute $ Opportunity Analysis and Forecast, By Form, 2016-2032
- 8.3.3. Dry
- 8.3.4. Liquid
- 8.4. Latin America Plant Biostimulants Market Analysis, Opportunity and Forecast, By Active Ingredient , 2016-2032
- 8.4.1. Latin America Plant Biostimulants Market Analysis by Active Ingredient : Introduction
- 8.4.2. Market Size Absolute $ Opportunity Analysis and Forecast, By Active Ingredient , 2016-2032
- 8.4.3. Acid Based
- 8.4.4. Seaweed Extract
- 8.4.5. Microbial
- 8.4.6. Others
- 8.5. Latin America Plant Biostimulants Market Analysis, Opportunity and Forecast, By Crop Type, 2016-2032
- 8.5.1. Latin America Plant Biostimulants Market Analysis by Crop Type: Introduction
- 8.5.2. Market Size Absolute $ Opportunity Analysis and Forecast, By Crop Type, 2016-2032
- 8.5.3. Cereals & grains
- 8.5.4. Fruits & vegetables
- 8.5.5. Turf & ornamentals
- 8.5.6. Oilseeds & pulses
- 8.5.7. Others
- 8.6. Latin America Plant Biostimulants Market Analysis, Opportunity and Forecast, By Application, 2016-2032
- 8.6.1. Latin America Plant Biostimulants Market Analysis by Application: Introduction
- 8.6.2. Market Size Absolute $ Opportunity Analysis and Forecast, By Application, 2016-2032
- 8.6.3. Foliar Treatment
- 8.6.4. Soil Treatment
- 8.6.5. Seed Treatment
- 8.7. Latin America Plant Biostimulants Market Analysis, Opportunity and Forecast, By Country , 2016-2032
- 8.7.1. Latin America Plant Biostimulants Market Analysis by Country : Introduction
- 8.7.2. Market Size Absolute $ Opportunity Analysis and Forecast, Country , 2016-2032
- 8.7.2.1. Brazil
- 8.7.2.2. Colombia
- 8.7.2.3. Chile
- 8.7.2.4. Argentina
- 8.7.2.5. Costa Rica
- 8.7.2.6. Rest of Latin America
- 9. Middle East & Africa Plant Biostimulants Market Analysis, Opportunity and Forecast, 2016-2032
- 9.1. Middle East & Africa Plant Biostimulants Market Analysis, 2016-2021
- 9.2. Middle East & Africa Plant Biostimulants Market Opportunity and Forecast, 2023-2032
- 9.3. Middle East & Africa Plant Biostimulants Market Analysis, Opportunity and Forecast, By Form, 2016-2032
- 9.3.1. Middle East & Africa Plant Biostimulants Market Analysis by Form: Introduction
- 9.3.2. Market Size Absolute $ Opportunity Analysis and Forecast, By Form, 2016-2032
- 9.3.3. Dry
- 9.3.4. Liquid
- 9.4. Middle East & Africa Plant Biostimulants Market Analysis, Opportunity and Forecast, By Active Ingredient , 2016-2032
- 9.4.1. Middle East & Africa Plant Biostimulants Market Analysis by Active Ingredient : Introduction
- 9.4.2. Market Size Absolute $ Opportunity Analysis and Forecast, By Active Ingredient , 2016-2032
- 9.4.3. Acid Based
- 9.4.4. Seaweed Extract
- 9.4.5. Microbial
- 9.4.6. Others
- 9.5. Middle East & Africa Plant Biostimulants Market Analysis, Opportunity and Forecast, By Crop Type, 2016-2032
- 9.5.1. Middle East & Africa Plant Biostimulants Market Analysis by Crop Type: Introduction
- 9.5.2. Market Size Absolute $ Opportunity Analysis and Forecast, By Crop Type, 2016-2032
- 9.5.3. Cereals & grains
- 9.5.4. Fruits & vegetables
- 9.5.5. Turf & ornamentals
- 9.5.6. Oilseeds & pulses
- 9.5.7. Others
- 9.6. Middle East & Africa Plant Biostimulants Market Analysis, Opportunity and Forecast, By Application, 2016-2032
- 9.6.1. Middle East & Africa Plant Biostimulants Market Analysis by Application: Introduction
- 9.6.2. Market Size Absolute $ Opportunity Analysis and Forecast, By Application, 2016-2032
- 9.6.3. Foliar Treatment
- 9.6.4. Soil Treatment
- 9.6.5. Seed Treatment
- 9.7. Middle East & Africa Plant Biostimulants Market Analysis, Opportunity and Forecast, By Country , 2016-2032
- 9.7.1. Middle East & Africa Plant Biostimulants Market Analysis by Country : Introduction
- 9.7.2. Market Size Absolute $ Opportunity Analysis and Forecast, Country , 2016-2032
- 9.7.2.1. Algeria
- 9.7.2.2. Egypt
- 9.7.2.3. Israel
- 9.7.2.4. Kuwait
- 9.7.2.5. Nigeria
- 9.7.2.6. Saudi Arabia
- 9.7.2.7. South Africa
- 9.7.2.8. Turkey
- 9.7.2.9. The UAE
- 9.7.2.10. Rest of MEA
- 10. Global Plant Biostimulants Market Analysis, Opportunity and Forecast, By Region , 2016-2032
- 10.1. Global Plant Biostimulants Market Analysis by Region : Introduction
- 10.2. Market Size Absolute $ Opportunity Analysis and Forecast, By Region , 2016-2032
- 10.2.1. North America
- 10.2.2. Western Europe
- 10.2.3. Eastern Europe
- 10.2.4. APAC
- 10.2.5. Latin America
- 10.2.6. Middle East & Africa
- 11. Global Plant Biostimulants Market Competitive Landscape, Market Share Analysis, and Company Profiles
- 11.1. Market Share Analysis
- 11.2. Company Profiles
- 11.3. BASF SE
- 11.3.1. Company Overview
- 11.3.2. Financial Highlights
- 11.3.3. Product Portfolio
- 11.3.4. SWOT Analysis
- 11.3.5. Key Strategies and Developments
- 11.4. Isagro Group
- 11.4.1. Company Overview
- 11.4.2. Financial Highlights
- 11.4.3. Product Portfolio
- 11.4.4. SWOT Analysis
- 11.4.5. Key Strategies and Developments
- 11.5. Novozyme A/S
- 11.5.1. Company Overview
- 11.5.2. Financial Highlights
- 11.5.3. Product Portfolio
- 11.5.4. SWOT Analysis
- 11.5.5. Key Strategies and Developments
- 11.6. UPL Corporation Limited
- 11.6.1. Company Overview
- 11.6.2. Financial Highlights
- 11.6.3. Product Portfolio
- 11.6.4. SWOT Analysis
- 11.6.5. Key Strategies and Developments
- 11.7. FMC Corporation
- 11.7.1. Company Overview
- 11.7.2. Financial Highlights
- 11.7.3. Product Portfolio
- 11.7.4. SWOT Analysis
- 11.7.5. Key Strategies and Developments
- 11.8. Acadian Seaplants Limited
- 11.8.1. Company Overview
- 11.8.2. Financial Highlights
- 11.8.3. Product Portfolio
- 11.8.4. SWOT Analysis
- 11.8.5. Key Strategies and Developments
- 11.9. Agrinos AS
- 11.9.1. Company Overview
- 11.9.2. Financial Highlights
- 11.9.3. Product Portfolio
- 11.9.4. SWOT Analysis
- 11.9.5. Key Strategies and Developments
- 11.10. BioAtlantis Ltd.
- 11.10.1. Company Overview
- 11.10.2. Financial Highlights
- 11.10.3. Product Portfolio
- 11.10.4. SWOT Analysis
- 11.10.5. Key Strategies and Developments
- 11.11. Biostadt India Ltd.
- 11.11.1. Company Overview
- 11.11.2. Financial Highlights
- 11.11.3. Product Portfolio
- 11.11.4. SWOT Analysis
- 11.11.5. Key Strategies and Developments
- 11.12. Koppert B.V.
- 11.12.1. Company Overview
- 11.12.2. Financial Highlights
- 11.12.3. Product Portfolio
- 11.12.4. SWOT Analysis
- 11.12.5. Key Strategies and Developments
- 11.13.1. Company Overview
- 11.13.2. Financial Highlights
- 11.13.3. Product Portfolio
- 11.13.4. SWOT Analysis
- 11.13.5. Key Strategies and Developments
- 11.14. Italpollina Spa
- 11.14.1. Company Overview
- 11.14.2. Financial Highlights
- 11.14.3. Product Portfolio
- 11.14.4. SWOT Analysis
- 11.14.5. Key Strategies and Developments
- 11.15. Syngenta AG
- 11.15.1. Company Overview
- 11.15.2. Financial Highlights
- 11.15.3. Product Portfolio
- 11.15.4. SWOT Analysis
- 11.15.5. Key Strategies and Developments
- 11.16. Trade Corporation International
- 11.16.1. Company Overview
- 11.16.2. Financial Highlights
- 11.16.3. Product Portfolio
- 11.16.4. SWOT Analysis
- 11.16.5. Key Strategies and Developments
- 11.17. Agricen
- 11.17.1. Company Overview
- 11.17.2. Financial Highlights
- 11.17.3. Product Portfolio
- 11.17.4. SWOT Analysis
- 11.17.5. Key Strategies and Developments
- 11.18. Omex Agrifluids Ltd.
- 11.18.1. Company Overview
- 11.18.2. Financial Highlights
- 11.18.3. Product Portfolio
- 11.18.4. SWOT Analysis
- 11.18.5. Key Strategies and Developments
- 11.19. Valagro SpA
- 11.19.1. Company Overview
- 11.19.2. Financial Highlights
- 11.19.3. Product Portfolio
- 11.19.4. SWOT Analysis
- 11.19.5. Key Strategies and Developments
- 11.20. Oxon Italia S.p.A.
- 11.20.1. Company Overview
- 11.20.2. Financial Highlights
- 11.20.3. Product Portfolio
- 11.20.4. SWOT Analysis
- 11.20.5. Key Strategies and Developments
- 12. Assumptions and Acronyms
- 13. Research Methodology
- 14. Contact
"
- List of Figures
- "
- Figure 1: Global Plant Biostimulants Market Revenue (US$ Mn) Market Share by Form in 2022
- Figure 2: Global Plant Biostimulants Market Market Attractiveness Analysis by Form, 2016-2032
- Figure 3: Global Plant Biostimulants Market Revenue (US$ Mn) Market Share by Active Ingredient in 2022
- Figure 4: Global Plant Biostimulants Market Market Attractiveness Analysis by Active Ingredient , 2016-2032
- Figure 5: Global Plant Biostimulants Market Revenue (US$ Mn) Market Share by Crop Typein 2022
- Figure 6: Global Plant Biostimulants Market Market Attractiveness Analysis by Crop Type, 2016-2032
- Figure 7: Global Plant Biostimulants Market Revenue (US$ Mn) Market Share by Applicationin 2022
- Figure 8: Global Plant Biostimulants Market Market Attractiveness Analysis by Application, 2016-2032
- Figure 9: Global Plant Biostimulants Market Revenue (US$ Mn) Market Share by Region in 2022
- Figure 10: Global Plant Biostimulants Market Market Attractiveness Analysis by Region, 2016-2032
- Figure 11: Global Plant Biostimulants Market Market Revenue (US$ Mn) (2016-2032)
- Figure 12: Global Plant Biostimulants Market Market Revenue (US$ Mn) Comparison by Region (2016-2032)
- Figure 13: Global Plant Biostimulants Market Market Revenue (US$ Mn) Comparison by Form (2016-2032)
- Figure 14: Global Plant Biostimulants Market Market Revenue (US$ Mn) Comparison by Active Ingredient (2016-2032)
- Figure 15: Global Plant Biostimulants Market Market Revenue (US$ Mn) Comparison by Crop Type (2016-2032)
- Figure 16: Global Plant Biostimulants Market Market Revenue (US$ Mn) Comparison by Application (2016-2032)
- Figure 17: Global Plant Biostimulants Market Market Y-o-Y Growth Rate Comparison by Region (2016-2032)
- Figure 18: Global Plant Biostimulants Market Market Y-o-Y Growth Rate Comparison by Form (2016-2032)
- Figure 19: Global Plant Biostimulants Market Market Y-o-Y Growth Rate Comparison by Active Ingredient (2016-2032)
- Figure 20: Global Plant Biostimulants Market Market Y-o-Y Growth Rate Comparison by Crop Type (2016-2032)
- Figure 21: Global Plant Biostimulants Market Market Y-o-Y Growth Rate Comparison by Application (2016-2032)
- Figure 22: Global Plant Biostimulants Market Market Share Comparison by Region (2016-2032)
- Figure 23: Global Plant Biostimulants Market Market Share Comparison by Form (2016-2032)
- Figure 24: Global Plant Biostimulants Market Market Share Comparison by Active Ingredient (2016-2032)
- Figure 25: Global Plant Biostimulants Market Market Share Comparison by Crop Type (2016-2032)
- Figure 26: Global Plant Biostimulants Market Market Share Comparison by Application (2016-2032)
- Figure 27: North America Plant Biostimulants Market Revenue (US$ Mn) Market Share by Formin 2022
- Figure 28: North America Plant Biostimulants Market Market Attractiveness Analysis by Form, 2016-2032
- Figure 29: North America Plant Biostimulants Market Revenue (US$ Mn) Market Share by Active Ingredient in 2022
- Figure 30: North America Plant Biostimulants Market Market Attractiveness Analysis by Active Ingredient , 2016-2032
- Figure 31: North America Plant Biostimulants Market Revenue (US$ Mn) Market Share by Crop Typein 2022
- Figure 32: North America Plant Biostimulants Market Market Attractiveness Analysis by Crop Type, 2016-2032
- Figure 33: North America Plant Biostimulants Market Revenue (US$ Mn) Market Share by Applicationin 2022
- Figure 34: North America Plant Biostimulants Market Market Attractiveness Analysis by Application, 2016-2032
- Figure 35: North America Plant Biostimulants Market Revenue (US$ Mn) Market Share by Country in 2022
- Figure 36: North America Plant Biostimulants Market Market Attractiveness Analysis by Country, 2016-2032
- Figure 37: North America Plant Biostimulants Market Market Revenue (US$ Mn) (2016-2032)
- Figure 38: North America Plant Biostimulants Market Market Revenue (US$ Mn) Comparison by Country (2016-2032)
- Figure 39: North America Plant Biostimulants Market Market Revenue (US$ Mn) Comparison by Form (2016-2032)
- Figure 40: North America Plant Biostimulants Market Market Revenue (US$ Mn) Comparison by Active Ingredient (2016-2032)
- Figure 41: North America Plant Biostimulants Market Market Revenue (US$ Mn) Comparison by Crop Type (2016-2032)
- Figure 42: North America Plant Biostimulants Market Market Revenue (US$ Mn) Comparison by Application (2016-2032)
- Figure 43: North America Plant Biostimulants Market Market Y-o-Y Growth Rate Comparison by Country (2016-2032)
- Figure 44: North America Plant Biostimulants Market Market Y-o-Y Growth Rate Comparison by Form (2016-2032)
- Figure 45: North America Plant Biostimulants Market Market Y-o-Y Growth Rate Comparison by Active Ingredient (2016-2032)
- Figure 46: North America Plant Biostimulants Market Market Y-o-Y Growth Rate Comparison by Crop Type (2016-2032)
- Figure 47: North America Plant Biostimulants Market Market Y-o-Y Growth Rate Comparison by Application (2016-2032)
- Figure 48: North America Plant Biostimulants Market Market Share Comparison by Country (2016-2032)
- Figure 49: North America Plant Biostimulants Market Market Share Comparison by Form (2016-2032)
- Figure 50: North America Plant Biostimulants Market Market Share Comparison by Active Ingredient (2016-2032)
- Figure 51: North America Plant Biostimulants Market Market Share Comparison by Crop Type (2016-2032)
- Figure 52: North America Plant Biostimulants Market Market Share Comparison by Application (2016-2032)
- Figure 53: Western Europe Plant Biostimulants Market Revenue (US$ Mn) Market Share by Formin 2022
- Figure 54: Western Europe Plant Biostimulants Market Market Attractiveness Analysis by Form, 2016-2032
- Figure 55: Western Europe Plant Biostimulants Market Revenue (US$ Mn) Market Share by Active Ingredient in 2022
- Figure 56: Western Europe Plant Biostimulants Market Market Attractiveness Analysis by Active Ingredient , 2016-2032
- Figure 57: Western Europe Plant Biostimulants Market Revenue (US$ Mn) Market Share by Crop Typein 2022
- Figure 58: Western Europe Plant Biostimulants Market Market Attractiveness Analysis by Crop Type, 2016-2032
- Figure 59: Western Europe Plant Biostimulants Market Revenue (US$ Mn) Market Share by Applicationin 2022
- Figure 60: Western Europe Plant Biostimulants Market Market Attractiveness Analysis by Application, 2016-2032
- Figure 61: Western Europe Plant Biostimulants Market Revenue (US$ Mn) Market Share by Country in 2022
- Figure 62: Western Europe Plant Biostimulants Market Market Attractiveness Analysis by Country, 2016-2032
- Figure 63: Western Europe Plant Biostimulants Market Market Revenue (US$ Mn) (2016-2032)
- Figure 64: Western Europe Plant Biostimulants Market Market Revenue (US$ Mn) Comparison by Country (2016-2032)
- Figure 65: Western Europe Plant Biostimulants Market Market Revenue (US$ Mn) Comparison by Form (2016-2032)
- Figure 66: Western Europe Plant Biostimulants Market Market Revenue (US$ Mn) Comparison by Active Ingredient (2016-2032)
- Figure 67: Western Europe Plant Biostimulants Market Market Revenue (US$ Mn) Comparison by Crop Type (2016-2032)
- Figure 68: Western Europe Plant Biostimulants Market Market Revenue (US$ Mn) Comparison by Application (2016-2032)
- Figure 69: Western Europe Plant Biostimulants Market Market Y-o-Y Growth Rate Comparison by Country (2016-2032)
- Figure 70: Western Europe Plant Biostimulants Market Market Y-o-Y Growth Rate Comparison by Form (2016-2032)
- Figure 71: Western Europe Plant Biostimulants Market Market Y-o-Y Growth Rate Comparison by Active Ingredient (2016-2032)
- Figure 72: Western Europe Plant Biostimulants Market Market Y-o-Y Growth Rate Comparison by Crop Type (2016-2032)
- Figure 73: Western Europe Plant Biostimulants Market Market Y-o-Y Growth Rate Comparison by Application (2016-2032)
- Figure 74: Western Europe Plant Biostimulants Market Market Share Comparison by Country (2016-2032)
- Figure 75: Western Europe Plant Biostimulants Market Market Share Comparison by Form (2016-2032)
- Figure 76: Western Europe Plant Biostimulants Market Market Share Comparison by Active Ingredient (2016-2032)
- Figure 77: Western Europe Plant Biostimulants Market Market Share Comparison by Crop Type (2016-2032)
- Figure 78: Western Europe Plant Biostimulants Market Market Share Comparison by Application (2016-2032)
- Figure 79: Eastern Europe Plant Biostimulants Market Revenue (US$ Mn) Market Share by Formin 2022
- Figure 80: Eastern Europe Plant Biostimulants Market Market Attractiveness Analysis by Form, 2016-2032
- Figure 81: Eastern Europe Plant Biostimulants Market Revenue (US$ Mn) Market Share by Active Ingredient in 2022
- Figure 82: Eastern Europe Plant Biostimulants Market Market Attractiveness Analysis by Active Ingredient , 2016-2032
- Figure 83: Eastern Europe Plant Biostimulants Market Revenue (US$ Mn) Market Share by Crop Typein 2022
- Figure 84: Eastern Europe Plant Biostimulants Market Market Attractiveness Analysis by Crop Type, 2016-2032
- Figure 85: Eastern Europe Plant Biostimulants Market Revenue (US$ Mn) Market Share by Applicationin 2022
- Figure 86: Eastern Europe Plant Biostimulants Market Market Attractiveness Analysis by Application, 2016-2032
- Figure 87: Eastern Europe Plant Biostimulants Market Revenue (US$ Mn) Market Share by Country in 2022
- Figure 88: Eastern Europe Plant Biostimulants Market Market Attractiveness Analysis by Country, 2016-2032
- Figure 89: Eastern Europe Plant Biostimulants Market Market Revenue (US$ Mn) (2016-2032)
- Figure 90: Eastern Europe Plant Biostimulants Market Market Revenue (US$ Mn) Comparison by Country (2016-2032)
- Figure 91: Eastern Europe Plant Biostimulants Market Market Revenue (US$ Mn) Comparison by Form (2016-2032)
- Figure 92: Eastern Europe Plant Biostimulants Market Market Revenue (US$ Mn) Comparison by Active Ingredient (2016-2032)
- Figure 93: Eastern Europe Plant Biostimulants Market Market Revenue (US$ Mn) Comparison by Crop Type (2016-2032)
- Figure 94: Eastern Europe Plant Biostimulants Market Market Revenue (US$ Mn) Comparison by Application (2016-2032)
- Figure 95: Eastern Europe Plant Biostimulants Market Market Y-o-Y Growth Rate Comparison by Country (2016-2032)
- Figure 96: Eastern Europe Plant Biostimulants Market Market Y-o-Y Growth Rate Comparison by Form (2016-2032)
- Figure 97: Eastern Europe Plant Biostimulants Market Market Y-o-Y Growth Rate Comparison by Active Ingredient (2016-2032)
- Figure 98: Eastern Europe Plant Biostimulants Market Market Y-o-Y Growth Rate Comparison by Crop Type (2016-2032)
- Figure 99: Eastern Europe Plant Biostimulants Market Market Y-o-Y Growth Rate Comparison by Application (2016-2032)
- Figure 100: Eastern Europe Plant Biostimulants Market Market Share Comparison by Country (2016-2032)
- Figure 101: Eastern Europe Plant Biostimulants Market Market Share Comparison by Form (2016-2032)
- Figure 102: Eastern Europe Plant Biostimulants Market Market Share Comparison by Active Ingredient (2016-2032)
- Figure 103: Eastern Europe Plant Biostimulants Market Market Share Comparison by Crop Type (2016-2032)
- Figure 104: Eastern Europe Plant Biostimulants Market Market Share Comparison by Application (2016-2032)
- Figure 105: APAC Plant Biostimulants Market Revenue (US$ Mn) Market Share by Formin 2022
- Figure 106: APAC Plant Biostimulants Market Market Attractiveness Analysis by Form, 2016-2032
- Figure 107: APAC Plant Biostimulants Market Revenue (US$ Mn) Market Share by Active Ingredient in 2022
- Figure 108: APAC Plant Biostimulants Market Market Attractiveness Analysis by Active Ingredient , 2016-2032
- Figure 109: APAC Plant Biostimulants Market Revenue (US$ Mn) Market Share by Crop Typein 2022
- Figure 110: APAC Plant Biostimulants Market Market Attractiveness Analysis by Crop Type, 2016-2032
- Figure 111: APAC Plant Biostimulants Market Revenue (US$ Mn) Market Share by Applicationin 2022
- Figure 112: APAC Plant Biostimulants Market Market Attractiveness Analysis by Application, 2016-2032
- Figure 113: APAC Plant Biostimulants Market Revenue (US$ Mn) Market Share by Country in 2022
- Figure 114: APAC Plant Biostimulants Market Market Attractiveness Analysis by Country, 2016-2032
- Figure 115: APAC Plant Biostimulants Market Market Revenue (US$ Mn) (2016-2032)
- Figure 116: APAC Plant Biostimulants Market Market Revenue (US$ Mn) Comparison by Country (2016-2032)
- Figure 117: APAC Plant Biostimulants Market Market Revenue (US$ Mn) Comparison by Form (2016-2032)
- Figure 118: APAC Plant Biostimulants Market Market Revenue (US$ Mn) Comparison by Active Ingredient (2016-2032)
- Figure 119: APAC Plant Biostimulants Market Market Revenue (US$ Mn) Comparison by Crop Type (2016-2032)
- Figure 120: APAC Plant Biostimulants Market Market Revenue (US$ Mn) Comparison by Application (2016-2032)
- Figure 121: APAC Plant Biostimulants Market Market Y-o-Y Growth Rate Comparison by Country (2016-2032)
- Figure 122: APAC Plant Biostimulants Market Market Y-o-Y Growth Rate Comparison by Form (2016-2032)
- Figure 123: APAC Plant Biostimulants Market Market Y-o-Y Growth Rate Comparison by Active Ingredient (2016-2032)
- Figure 124: APAC Plant Biostimulants Market Market Y-o-Y Growth Rate Comparison by Crop Type (2016-2032)
- Figure 125: APAC Plant Biostimulants Market Market Y-o-Y Growth Rate Comparison by Application (2016-2032)
- Figure 126: APAC Plant Biostimulants Market Market Share Comparison by Country (2016-2032)
- Figure 127: APAC Plant Biostimulants Market Market Share Comparison by Form (2016-2032)
- Figure 128: APAC Plant Biostimulants Market Market Share Comparison by Active Ingredient (2016-2032)
- Figure 129: APAC Plant Biostimulants Market Market Share Comparison by Crop Type (2016-2032)
- Figure 130: APAC Plant Biostimulants Market Market Share Comparison by Application (2016-2032)
- Figure 131: Latin America Plant Biostimulants Market Revenue (US$ Mn) Market Share by Formin 2022
- Figure 132: Latin America Plant Biostimulants Market Market Attractiveness Analysis by Form, 2016-2032
- Figure 133: Latin America Plant Biostimulants Market Revenue (US$ Mn) Market Share by Active Ingredient in 2022
- Figure 134: Latin America Plant Biostimulants Market Market Attractiveness Analysis by Active Ingredient , 2016-2032
- Figure 135: Latin America Plant Biostimulants Market Revenue (US$ Mn) Market Share by Crop Typein 2022
- Figure 136: Latin America Plant Biostimulants Market Market Attractiveness Analysis by Crop Type, 2016-2032
- Figure 137: Latin America Plant Biostimulants Market Revenue (US$ Mn) Market Share by Applicationin 2022
- Figure 138: Latin America Plant Biostimulants Market Market Attractiveness Analysis by Application, 2016-2032
- Figure 139: Latin America Plant Biostimulants Market Revenue (US$ Mn) Market Share by Country in 2022
- Figure 140: Latin America Plant Biostimulants Market Market Attractiveness Analysis by Country, 2016-2032
- Figure 141: Latin America Plant Biostimulants Market Market Revenue (US$ Mn) (2016-2032)
- Figure 142: Latin America Plant Biostimulants Market Market Revenue (US$ Mn) Comparison by Country (2016-2032)
- Figure 143: Latin America Plant Biostimulants Market Market Revenue (US$ Mn) Comparison by Form (2016-2032)
- Figure 144: Latin America Plant Biostimulants Market Market Revenue (US$ Mn) Comparison by Active Ingredient (2016-2032)
- Figure 145: Latin America Plant Biostimulants Market Market Revenue (US$ Mn) Comparison by Crop Type (2016-2032)
- Figure 146: Latin America Plant Biostimulants Market Market Revenue (US$ Mn) Comparison by Application (2016-2032)
- Figure 147: Latin America Plant Biostimulants Market Market Y-o-Y Growth Rate Comparison by Country (2016-2032)
- Figure 148: Latin America Plant Biostimulants Market Market Y-o-Y Growth Rate Comparison by Form (2016-2032)
- Figure 149: Latin America Plant Biostimulants Market Market Y-o-Y Growth Rate Comparison by Active Ingredient (2016-2032)
- Figure 150: Latin America Plant Biostimulants Market Market Y-o-Y Growth Rate Comparison by Crop Type (2016-2032)
- Figure 151: Latin America Plant Biostimulants Market Market Y-o-Y Growth Rate Comparison by Application (2016-2032)
- Figure 152: Latin America Plant Biostimulants Market Market Share Comparison by Country (2016-2032)
- Figure 153: Latin America Plant Biostimulants Market Market Share Comparison by Form (2016-2032)
- Figure 154: Latin America Plant Biostimulants Market Market Share Comparison by Active Ingredient (2016-2032)
- Figure 155: Latin America Plant Biostimulants Market Market Share Comparison by Crop Type (2016-2032)
- Figure 156: Latin America Plant Biostimulants Market Market Share Comparison by Application (2016-2032)
- Figure 157: Middle East & Africa Plant Biostimulants Market Revenue (US$ Mn) Market Share by Formin 2022
- Figure 158: Middle East & Africa Plant Biostimulants Market Market Attractiveness Analysis by Form, 2016-2032
- Figure 159: Middle East & Africa Plant Biostimulants Market Revenue (US$ Mn) Market Share by Active Ingredient in 2022
- Figure 160: Middle East & Africa Plant Biostimulants Market Market Attractiveness Analysis by Active Ingredient , 2016-2032
- Figure 161: Middle East & Africa Plant Biostimulants Market Revenue (US$ Mn) Market Share by Crop Typein 2022
- Figure 162: Middle East & Africa Plant Biostimulants Market Market Attractiveness Analysis by Crop Type, 2016-2032
- Figure 163: Middle East & Africa Plant Biostimulants Market Revenue (US$ Mn) Market Share by Applicationin 2022
- Figure 164: Middle East & Africa Plant Biostimulants Market Market Attractiveness Analysis by Application, 2016-2032
- Figure 165: Middle East & Africa Plant Biostimulants Market Revenue (US$ Mn) Market Share by Country in 2022
- Figure 166: Middle East & Africa Plant Biostimulants Market Market Attractiveness Analysis by Country, 2016-2032
- Figure 167: Middle East & Africa Plant Biostimulants Market Market Revenue (US$ Mn) (2016-2032)
- Figure 168: Middle East & Africa Plant Biostimulants Market Market Revenue (US$ Mn) Comparison by Country (2016-2032)
- Figure 169: Middle East & Africa Plant Biostimulants Market Market Revenue (US$ Mn) Comparison by Form (2016-2032)
- Figure 170: Middle East & Africa Plant Biostimulants Market Market Revenue (US$ Mn) Comparison by Active Ingredient (2016-2032)
- Figure 171: Middle East & Africa Plant Biostimulants Market Market Revenue (US$ Mn) Comparison by Crop Type (2016-2032)
- Figure 172: Middle East & Africa Plant Biostimulants Market Market Revenue (US$ Mn) Comparison by Application (2016-2032)
- Figure 173: Middle East & Africa Plant Biostimulants Market Market Y-o-Y Growth Rate Comparison by Country (2016-2032)
- Figure 174: Middle East & Africa Plant Biostimulants Market Market Y-o-Y Growth Rate Comparison by Form (2016-2032)
- Figure 175: Middle East & Africa Plant Biostimulants Market Market Y-o-Y Growth Rate Comparison by Active Ingredient (2016-2032)
- Figure 176: Middle East & Africa Plant Biostimulants Market Market Y-o-Y Growth Rate Comparison by Crop Type (2016-2032)
- Figure 177: Middle East & Africa Plant Biostimulants Market Market Y-o-Y Growth Rate Comparison by Application (2016-2032)
- Figure 178: Middle East & Africa Plant Biostimulants Market Market Share Comparison by Country (2016-2032)
- Figure 179: Middle East & Africa Plant Biostimulants Market Market Share Comparison by Form (2016-2032)
- Figure 180: Middle East & Africa Plant Biostimulants Market Market Share Comparison by Active Ingredient (2016-2032)
- Figure 181: Middle East & Africa Plant Biostimulants Market Market Share Comparison by Crop Type (2016-2032)
- Figure 182: Middle East & Africa Plant Biostimulants Market Market Share Comparison by Application (2016-2032)
"
- List of Tables
- "
- Table 1: Global Plant Biostimulants Market Market Comparison by Form (2016-2032)
- Table 2: Global Plant Biostimulants Market Market Comparison by Active Ingredient (2016-2032)
- Table 3: Global Plant Biostimulants Market Market Comparison by Crop Type (2016-2032)
- Table 4: Global Plant Biostimulants Market Market Comparison by Application (2016-2032)
- Table 5: Global Plant Biostimulants Market Revenue (US$ Mn) Comparison by Region (2016-2032)
- Table 6: Global Plant Biostimulants Market Market Revenue (US$ Mn) (2016-2032)
- Table 7: Global Plant Biostimulants Market Market Revenue (US$ Mn) Comparison by Region (2016-2032)
- Table 8: Global Plant Biostimulants Market Market Revenue (US$ Mn) Comparison by Form (2016-2032)
- Table 9: Global Plant Biostimulants Market Market Revenue (US$ Mn) Comparison by Active Ingredient (2016-2032)
- Table 10: Global Plant Biostimulants Market Market Revenue (US$ Mn) Comparison by Crop Type (2016-2032)
- Table 11: Global Plant Biostimulants Market Market Revenue (US$ Mn) Comparison by Application (2016-2032)
- Table 12: Global Plant Biostimulants Market Market Y-o-Y Growth Rate Comparison by Region (2016-2032)
- Table 13: Global Plant Biostimulants Market Market Y-o-Y Growth Rate Comparison by Form (2016-2032)
- Table 14: Global Plant Biostimulants Market Market Y-o-Y Growth Rate Comparison by Active Ingredient (2016-2032)
- Table 15: Global Plant Biostimulants Market Market Y-o-Y Growth Rate Comparison by Crop Type (2016-2032)
- Table 16: Global Plant Biostimulants Market Market Y-o-Y Growth Rate Comparison by Application (2016-2032)
- Table 17: Global Plant Biostimulants Market Market Share Comparison by Region (2016-2032)
- Table 18: Global Plant Biostimulants Market Market Share Comparison by Form (2016-2032)
- Table 19: Global Plant Biostimulants Market Market Share Comparison by Active Ingredient (2016-2032)
- Table 20: Global Plant Biostimulants Market Market Share Comparison by Crop Type (2016-2032)
- Table 21: Global Plant Biostimulants Market Market Share Comparison by Application (2016-2032)
- Table 22: North America Plant Biostimulants Market Market Comparison by Active Ingredient (2016-2032)
- Table 23: North America Plant Biostimulants Market Market Comparison by Crop Type (2016-2032)
- Table 24: North America Plant Biostimulants Market Market Comparison by Application (2016-2032)
- Table 25: North America Plant Biostimulants Market Revenue (US$ Mn) Comparison by Country (2016-2032)
- Table 26: North America Plant Biostimulants Market Market Revenue (US$ Mn) (2016-2032)
- Table 27: North America Plant Biostimulants Market Market Revenue (US$ Mn) Comparison by Country (2016-2032)
- Table 28: North America Plant Biostimulants Market Market Revenue (US$ Mn) Comparison by Form (2016-2032)
- Table 29: North America Plant Biostimulants Market Market Revenue (US$ Mn) Comparison by Active Ingredient (2016-2032)
- Table 30: North America Plant Biostimulants Market Market Revenue (US$ Mn) Comparison by Crop Type (2016-2032)
- Table 31: North America Plant Biostimulants Market Market Revenue (US$ Mn) Comparison by Application (2016-2032)
- Table 32: North America Plant Biostimulants Market Market Y-o-Y Growth Rate Comparison by Country (2016-2032)
- Table 33: North America Plant Biostimulants Market Market Y-o-Y Growth Rate Comparison by Form (2016-2032)
- Table 34: North America Plant Biostimulants Market Market Y-o-Y Growth Rate Comparison by Active Ingredient (2016-2032)
- Table 35: North America Plant Biostimulants Market Market Y-o-Y Growth Rate Comparison by Crop Type (2016-2032)
- Table 36: North America Plant Biostimulants Market Market Y-o-Y Growth Rate Comparison by Application (2016-2032)
- Table 37: North America Plant Biostimulants Market Market Share Comparison by Country (2016-2032)
- Table 38: North America Plant Biostimulants Market Market Share Comparison by Form (2016-2032)
- Table 39: North America Plant Biostimulants Market Market Share Comparison by Active Ingredient (2016-2032)
- Table 40: North America Plant Biostimulants Market Market Share Comparison by Crop Type (2016-2032)
- Table 41: North America Plant Biostimulants Market Market Share Comparison by Application (2016-2032)
- Table 42: Western Europe Plant Biostimulants Market Market Comparison by Form (2016-2032)
- Table 43: Western Europe Plant Biostimulants Market Market Comparison by Active Ingredient (2016-2032)
- Table 44: Western Europe Plant Biostimulants Market Market Comparison by Crop Type (2016-2032)
- Table 45: Western Europe Plant Biostimulants Market Market Comparison by Application (2016-2032)
- Table 46: Western Europe Plant Biostimulants Market Revenue (US$ Mn) Comparison by Country (2016-2032)
- Table 47: Western Europe Plant Biostimulants Market Market Revenue (US$ Mn) (2016-2032)
- Table 48: Western Europe Plant Biostimulants Market Market Revenue (US$ Mn) Comparison by Country (2016-2032)
- Table 49: Western Europe Plant Biostimulants Market Market Revenue (US$ Mn) Comparison by Form (2016-2032)
- Table 50: Western Europe Plant Biostimulants Market Market Revenue (US$ Mn) Comparison by Active Ingredient (2016-2032)
- Table 51: Western Europe Plant Biostimulants Market Market Revenue (US$ Mn) Comparison by Crop Type (2016-2032)
- Table 52: Western Europe Plant Biostimulants Market Market Revenue (US$ Mn) Comparison by Application (2016-2032)
- Table 53: Western Europe Plant Biostimulants Market Market Y-o-Y Growth Rate Comparison by Country (2016-2032)
- Table 54: Western Europe Plant Biostimulants Market Market Y-o-Y Growth Rate Comparison by Form (2016-2032)
- Table 55: Western Europe Plant Biostimulants Market Market Y-o-Y Growth Rate Comparison by Active Ingredient (2016-2032)
- Table 56: Western Europe Plant Biostimulants Market Market Y-o-Y Growth Rate Comparison by Crop Type (2016-2032)
- Table 57: Western Europe Plant Biostimulants Market Market Y-o-Y Growth Rate Comparison by Application (2016-2032)
- Table 58: Western Europe Plant Biostimulants Market Market Share Comparison by Country (2016-2032)
- Table 59: Western Europe Plant Biostimulants Market Market Share Comparison by Form (2016-2032)
- Table 60: Western Europe Plant Biostimulants Market Market Share Comparison by Active Ingredient (2016-2032)
- Table 61: Western Europe Plant Biostimulants Market Market Share Comparison by Crop Type (2016-2032)
- Table 62: Western Europe Plant Biostimulants Market Market Share Comparison by Application (2016-2032)
- Table 63: Eastern Europe Plant Biostimulants Market Market Comparison by Form (2016-2032)
- Table 64: Eastern Europe Plant Biostimulants Market Market Comparison by Active Ingredient (2016-2032)
- Table 65: Eastern Europe Plant Biostimulants Market Market Comparison by Crop Type (2016-2032)
- Table 66: Eastern Europe Plant Biostimulants Market Market Comparison by Application (2016-2032)
- Table 67: Eastern Europe Plant Biostimulants Market Revenue (US$ Mn) Comparison by Country (2016-2032)
- Table 68: Eastern Europe Plant Biostimulants Market Market Revenue (US$ Mn) (2016-2032)
- Table 69: Eastern Europe Plant Biostimulants Market Market Revenue (US$ Mn) Comparison by Country (2016-2032)
- Table 70: Eastern Europe Plant Biostimulants Market Market Revenue (US$ Mn) Comparison by Form (2016-2032)
- Table 71: Eastern Europe Plant Biostimulants Market Market Revenue (US$ Mn) Comparison by Active Ingredient (2016-2032)
- Table 72: Eastern Europe Plant Biostimulants Market Market Revenue (US$ Mn) Comparison by Crop Type (2016-2032)
- Table 73: Eastern Europe Plant Biostimulants Market Market Revenue (US$ Mn) Comparison by Application (2016-2032)
- Table 74: Eastern Europe Plant Biostimulants Market Market Y-o-Y Growth Rate Comparison by Country (2016-2032)
- Table 75: Eastern Europe Plant Biostimulants Market Market Y-o-Y Growth Rate Comparison by Form (2016-2032)
- Table 76: Eastern Europe Plant Biostimulants Market Market Y-o-Y Growth Rate Comparison by Active Ingredient (2016-2032)
- Table 77: Eastern Europe Plant Biostimulants Market Market Y-o-Y Growth Rate Comparison by Crop Type (2016-2032)
- Table 78: Eastern Europe Plant Biostimulants Market Market Y-o-Y Growth Rate Comparison by Application (2016-2032)
- Table 79: Eastern Europe Plant Biostimulants Market Market Share Comparison by Country (2016-2032)
- Table 80: Eastern Europe Plant Biostimulants Market Market Share Comparison by Form (2016-2032)
- Table 81: Eastern Europe Plant Biostimulants Market Market Share Comparison by Active Ingredient (2016-2032)
- Table 82: Eastern Europe Plant Biostimulants Market Market Share Comparison by Crop Type (2016-2032)
- Table 83: Eastern Europe Plant Biostimulants Market Market Share Comparison by Application (2016-2032)
- Table 84: APAC Plant Biostimulants Market Market Comparison by Form (2016-2032)
- Table 85: APAC Plant Biostimulants Market Market Comparison by Active Ingredient (2016-2032)
- Table 86: APAC Plant Biostimulants Market Market Comparison by Crop Type (2016-2032)
- Table 87: APAC Plant Biostimulants Market Market Comparison by Application (2016-2032)
- Table 88: APAC Plant Biostimulants Market Revenue (US$ Mn) Comparison by Country (2016-2032)
- Table 89: APAC Plant Biostimulants Market Market Revenue (US$ Mn) (2016-2032)
- Table 90: APAC Plant Biostimulants Market Market Revenue (US$ Mn) Comparison by Country (2016-2032)
- Table 91: APAC Plant Biostimulants Market Market Revenue (US$ Mn) Comparison by Form (2016-2032)
- Table 92: APAC Plant Biostimulants Market Market Revenue (US$ Mn) Comparison by Active Ingredient (2016-2032)
- Table 93: APAC Plant Biostimulants Market Market Revenue (US$ Mn) Comparison by Crop Type (2016-2032)
- Table 94: APAC Plant Biostimulants Market Market Revenue (US$ Mn) Comparison by Application (2016-2032)
- Table 95: APAC Plant Biostimulants Market Market Y-o-Y Growth Rate Comparison by Country (2016-2032)
- Table 96: APAC Plant Biostimulants Market Market Y-o-Y Growth Rate Comparison by Form (2016-2032)
- Table 97: APAC Plant Biostimulants Market Market Y-o-Y Growth Rate Comparison by Active Ingredient (2016-2032)
- Table 98: APAC Plant Biostimulants Market Market Y-o-Y Growth Rate Comparison by Crop Type (2016-2032)
- Table 99: APAC Plant Biostimulants Market Market Y-o-Y Growth Rate Comparison by Application (2016-2032)
- Table 100: APAC Plant Biostimulants Market Market Share Comparison by Country (2016-2032)
- Table 101: APAC Plant Biostimulants Market Market Share Comparison by Form (2016-2032)
- Table 102: APAC Plant Biostimulants Market Market Share Comparison by Active Ingredient (2016-2032)
- Table 103: APAC Plant Biostimulants Market Market Share Comparison by Crop Type (2016-2032)
- Table 104: APAC Plant Biostimulants Market Market Share Comparison by Application (2016-2032)
- Table 105: Latin America Plant Biostimulants Market Market Comparison by Form (2016-2032)
- Table 106: Latin America Plant Biostimulants Market Market Comparison by Active Ingredient (2016-2032)
- Table 107: Latin America Plant Biostimulants Market Market Comparison by Crop Type (2016-2032)
- Table 108: Latin America Plant Biostimulants Market Market Comparison by Application (2016-2032)
- Table 109: Latin America Plant Biostimulants Market Revenue (US$ Mn) Comparison by Country (2016-2032)
- Table 110: Latin America Plant Biostimulants Market Market Revenue (US$ Mn) (2016-2032)
- Table 111: Latin America Plant Biostimulants Market Market Revenue (US$ Mn) Comparison by Country (2016-2032)
- Table 112: Latin America Plant Biostimulants Market Market Revenue (US$ Mn) Comparison by Form (2016-2032)
- Table 113: Latin America Plant Biostimulants Market Market Revenue (US$ Mn) Comparison by Active Ingredient (2016-2032)
- Table 114: Latin America Plant Biostimulants Market Market Revenue (US$ Mn) Comparison by Crop Type (2016-2032)
- Table 115: Latin America Plant Biostimulants Market Market Revenue (US$ Mn) Comparison by Application (2016-2032)
- Table 116: Latin America Plant Biostimulants Market Market Y-o-Y Growth Rate Comparison by Country (2016-2032)
- Table 117: Latin America Plant Biostimulants Market Market Y-o-Y Growth Rate Comparison by Form (2016-2032)
- Table 118: Latin America Plant Biostimulants Market Market Y-o-Y Growth Rate Comparison by Active Ingredient (2016-2032)
- Table 119: Latin America Plant Biostimulants Market Market Y-o-Y Growth Rate Comparison by Crop Type (2016-2032)
- Table 120: Latin America Plant Biostimulants Market Market Y-o-Y Growth Rate Comparison by Application (2016-2032)
- Table 121: Latin America Plant Biostimulants Market Market Share Comparison by Country (2016-2032)
- Table 122: Latin America Plant Biostimulants Market Market Share Comparison by Form (2016-2032)
- Table 123: Latin America Plant Biostimulants Market Market Share Comparison by Active Ingredient (2016-2032)
- Table 124: Latin America Plant Biostimulants Market Market Share Comparison by Crop Type (2016-2032)
- Table 125: Latin America Plant Biostimulants Market Market Share Comparison by Application (2016-2032)
- Table 126: Middle East & Africa Plant Biostimulants Market Market Comparison by Form (2016-2032)
- Table 127: Middle East & Africa Plant Biostimulants Market Market Comparison by Active Ingredient (2016-2032)
- Table 128: Middle East & Africa Plant Biostimulants Market Market Comparison by Crop Type (2016-2032)
- Table 129: Middle East & Africa Plant Biostimulants Market Market Comparison by Application (2016-2032)
- Table 130: Middle East & Africa Plant Biostimulants Market Revenue (US$ Mn) Comparison by Country (2016-2032)
- Table 131: Middle East & Africa Plant Biostimulants Market Market Revenue (US$ Mn) (2016-2032)
- Table 132: Middle East & Africa Plant Biostimulants Market Market Revenue (US$ Mn) Comparison by Country (2016-2032)
- Table 133: Middle East & Africa Plant Biostimulants Market Market Revenue (US$ Mn) Comparison by Form (2016-2032)
- Table 134: Middle East & Africa Plant Biostimulants Market Market Revenue (US$ Mn) Comparison by Active Ingredient (2016-2032)
- Table 135: Middle East & Africa Plant Biostimulants Market Market Revenue (US$ Mn) Comparison by Crop Type (2016-2032)
- Table 136: Middle East & Africa Plant Biostimulants Market Market Revenue (US$ Mn) Comparison by Application (2016-2032)
- Table 137: Middle East & Africa Plant Biostimulants Market Market Y-o-Y Growth Rate Comparison by Country (2016-2032)
- Table 138: Middle East & Africa Plant Biostimulants Market Market Y-o-Y Growth Rate Comparison by Form (2016-2032)
- Table 139: Middle East & Africa Plant Biostimulants Market Market Y-o-Y Growth Rate Comparison by Active Ingredient (2016-2032)
- Table 140: Middle East & Africa Plant Biostimulants Market Market Y-o-Y Growth Rate Comparison by Crop Type (2016-2032)
- Table 141: Middle East & Africa Plant Biostimulants Market Market Y-o-Y Growth Rate Comparison by Application (2016-2032)
- Table 142: Middle East & Africa Plant Biostimulants Market Market Share Comparison by Country (2016-2032)
- Table 143: Middle East & Africa Plant Biostimulants Market Market Share Comparison by Form (2016-2032)
- Table 144: Middle East & Africa Plant Biostimulants Market Market Share Comparison by Active Ingredient (2016-2032)
- Table 145: Middle East & Africa Plant Biostimulants Market Market Share Comparison by Crop Type (2016-2032)
- Table 146: Middle East & Africa Plant Biostimulants Market Market Share Comparison by Application (2016-2032)
- 1. Executive Summary
-
- BASF SE
- Isagro Group
- Novozyme A/S
- UPL Corporation Limited
- FMC Corporation
- Acadian Seaplants Limited
- Agrinos AS
- BioAtlantis Ltd.
- Biostadt India Ltd.
- Koppert B.V.
- Italpollina Spa
- Micromix
- Syngenta AG
- Trade Corporation International
- Agricen
- Omex Agrifluids Ltd.
- Valagro SpA
- Oxon Italia S.p.A.
Our Clients


View Our Licence Options
