
Global Phosphorus Trichloride Market By Grade(Analytical Reagent, Pure), By Application(Chemical Intermediate, A Gasoline Additive, Pharmaceuticals, Agrochemicals, Plasticizer, Pesticides, Others), By Sales Channel(Distribution Channel, Direct Channel), By Region And Companies - Industry Segment Outlook, Market Assessment, Competition Scenario, Trends, And Forecast 2024-2033
-
46107
-
May 2024
-
300
-


-
This report was compiled by Shreyas Rokade Shreyas Rokade is a seasoned Research Analyst with CMFE, bringing extensive expertise in market research and consulting, with a strong background in Chemical Engineering. Correspondence Team Lead-CMFE Linkedin | Detailed Market research Methodology Our methodology involves a mix of primary research, including interviews with leading mental health experts, and secondary research from reputable medical journals and databases. View Detailed Methodology Page
-
Quick Navigation
Report Overview
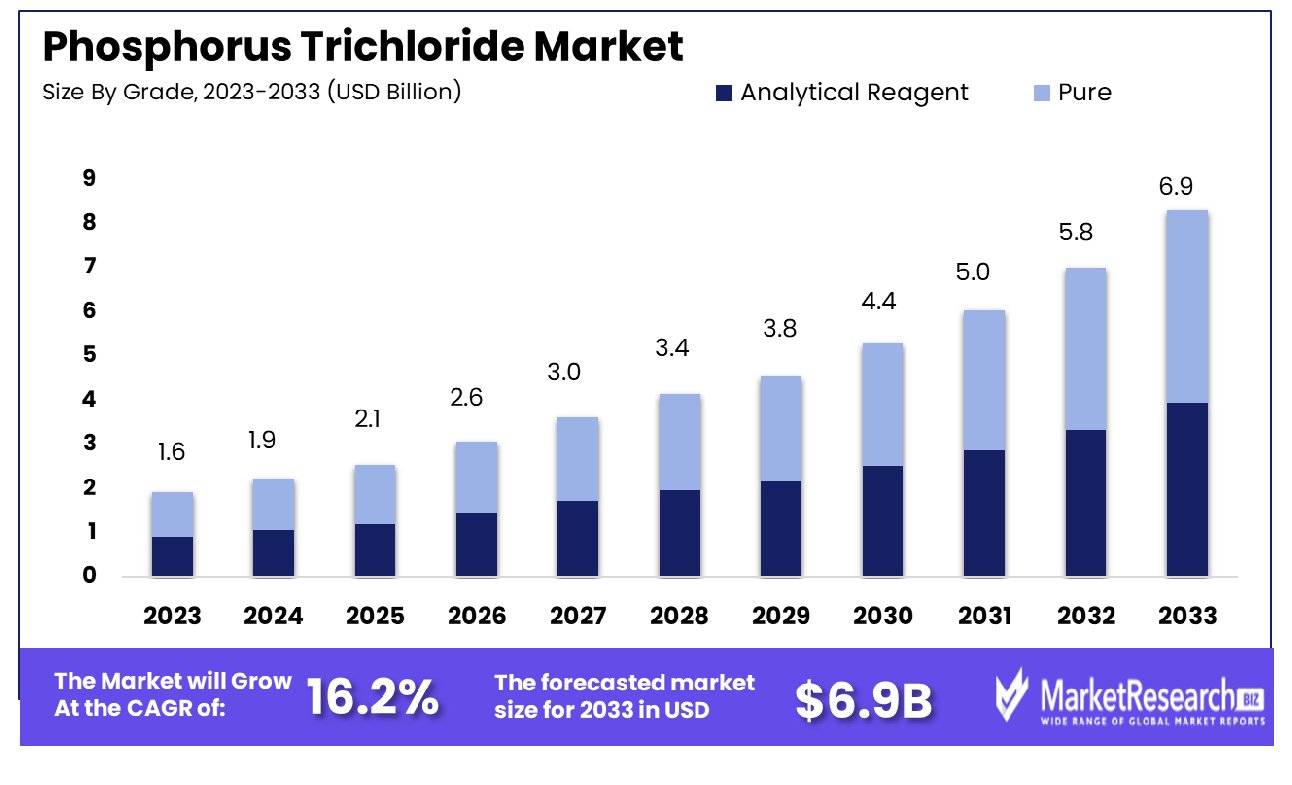
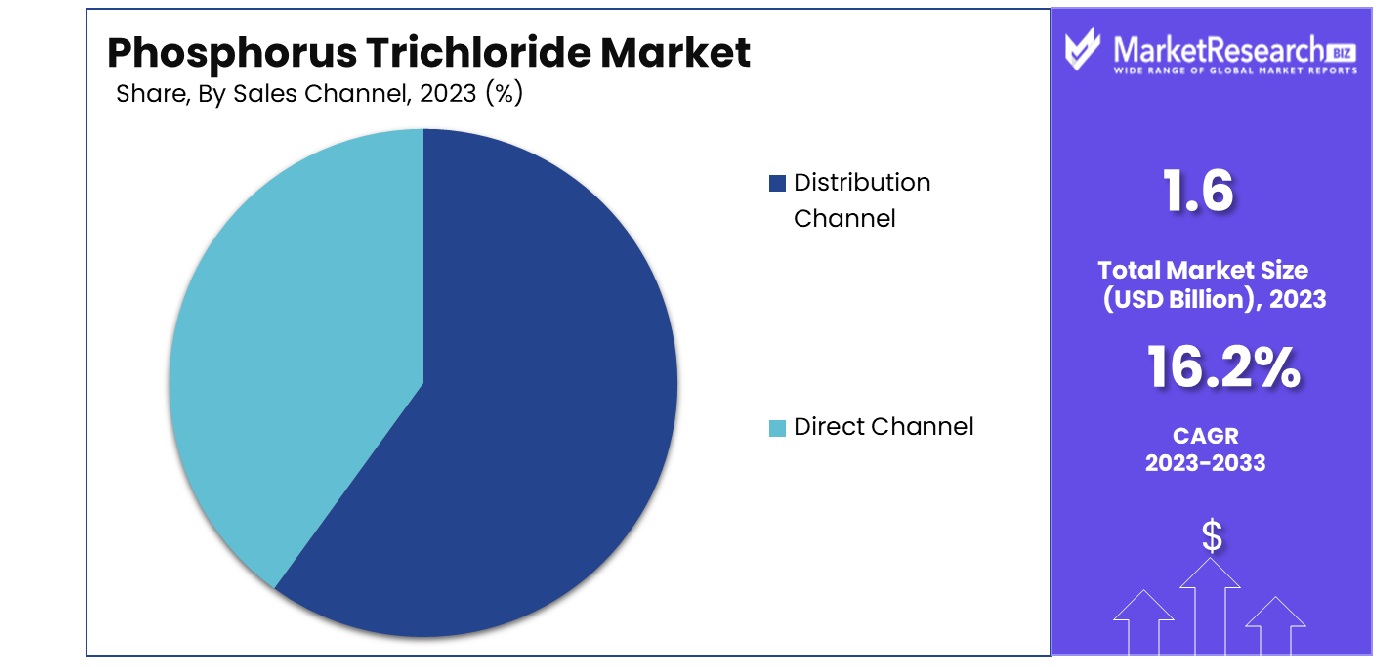
The Global Phosphorus Trichloride Market was valued at USD 1.6 billion in 2023. It is expected to reach USD 6.9 billion by 2033, with a CAGR of 16.2% during the forecast period from 2024 to 2033.
The Phosphorus Trichloride (PCl3) Market encompasses the global production, distribution, and utilization of phosphorus trichloride, a key chemical intermediate used extensively in various industries. Phosphorus trichloride is a crucial precursor in the manufacture of organophosphorus compounds, which are integral to agrochemicals, flame retardants, plasticizers, and pharmaceuticals.
The market dynamics are driven by the demand for these end-use products, advancements in chemical manufacturing processes, and regulatory policies. Strategic insights into the PCl3 market reveal growth opportunities through innovation in applications and expansion in emerging markets, essential for product managers aiming to capitalize on this sector.
The Phosphorus Trichloride market has been under rigorous analysis due to its pivotal role in various industrial applications, primarily in the production of pesticides and other organophosphorus compounds. In terms of regulatory frameworks, chemicals such as Phosphorus Trichloride (IS 4581:1978) require specific certifications like the BIS for export to markets like India, ensuring compliance with safety and environmental standards.
The global production capacity for Phosphorus Trichloride was estimated at around 0.8 million tonnes in 2002, signifying a robust manufacturing infrastructure predominantly in OECD countries and some non-member nations. In 2001, the United States reported a production capacity of approximately 315,000 tonnes and a consumption rate of about 277,000 tonnes, underscoring its significant domestic demand. Furthermore, European manufacturers like Bayer have historically contributed substantial quantities to the market, highlighting a strong presence in Western Europe.
This data suggests a well-established yet regionally varied market landscape, where regulatory compliance and production capabilities play critical roles in shaping market dynamics. Future market strategies should focus on compliance with international standards, enhancing production efficiency, and tapping into emerging markets that demonstrate increasing demand for industrial chemicals.
Key Takeaways
- Market Growth: The Global Phosphorus Trichloride Market was valued at USD 1.6 billion in 2023. It is expected to reach USD 6.9 billion by 2033, with a CAGR of 16.2% during the forecast period from 2024 to 2033.
- By Grade: In the pure segment, dominance is evident across all grades.
- By Application: Pharmaceutical applications overwhelmingly lead to market dominance.
- By Sales Channel: Distribution channels assert dominance in sales across various sectors.
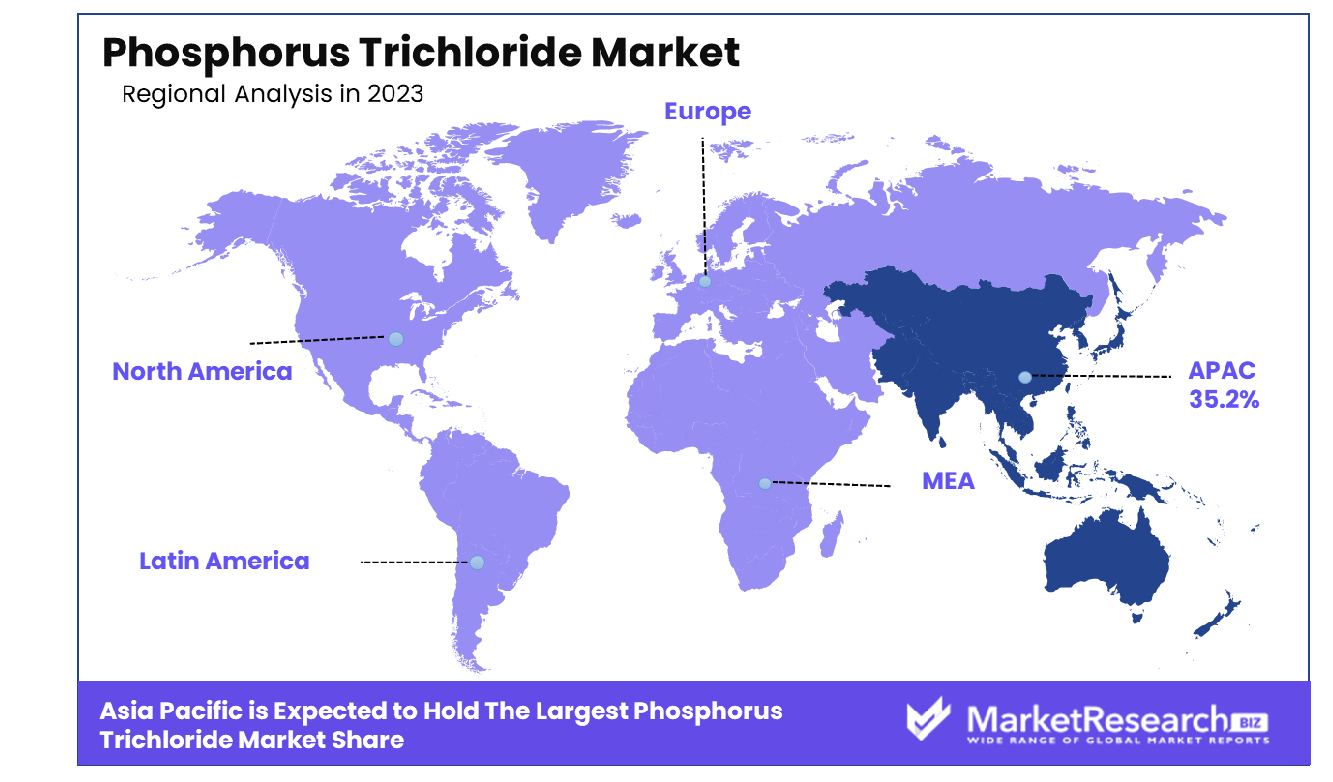
- Regional Dominance: Asia Pacific holds 35.2% of the global phosphorus trichloride market.
- Growth Opportunity: The phosphorus trichloride market is set to grow, driven by increased demand in water treatment and construction sectors, particularly in regions facing water scarcity and rapid urbanization.
Driving factors
Increasing Demand from the Pharmaceutical and Agrochemical Industries
Phosphorus trichloride is a critical raw material in the synthesis of several key intermediates used in pharmaceuticals and agrochemicals. The pharmaceutical industry relies on it for the production of essential drugs such as painkillers, tranquilizers, and anticonvulsants. As global healthcare demands escalate, partly driven by aging populations and increased chronic disease prevalence, the demand for these pharmaceuticals is surging, thereby boosting the phosphorus trichloride market.
Similarly, in the agrochemical sector, it is used to manufacture herbicides and insecticides. With the global population projected to reach 9.7 billion by 2050, there is an increasing need for high-yield crops, which fuels the demand for agrochemicals and consequently, for phosphorus trichloride.
Growing Production of Phosphate-based Chemicals
The production of phosphate-based chemicals, particularly for industrial applications, is a substantial driver for the phosphorus trichloride market. These chemicals are extensively used in the manufacturing of plasticizers, flame retardants, oil additives, and various industrial cleaners. The growth in industries such as automotive, construction, and electronics directly correlates with the increased demand for these phosphate-based products.
As these sectors continue to expand, especially in emerging economies, the demand for phosphorus trichloride is expected to rise in tandem. This is particularly notable in regions such as Asia-Pacific, where industrial growth is at its peak.
Rising Demand for Phosphoric Acid and Its Derivatives
Phosphoric acid production is another significant use of phosphorus trichloride. This acid and its derivatives play a crucial role in numerous sectors, including food and beverage, where they are used as food additives, and in water treatment, where they serve as corrosion inhibitors and scale inhibitors.
The global increase in processed foods and beverages, coupled with stringent water purification standards, propels the demand for phosphoric acid. This, in turn, boosts the phosphorus trichloride market. The synergy between the growing sectors of processed food and water treatment creates a compounded demand for phosphorus trichloride, further expanding its market reach.
Restraining Factors
High Initial Investment Required for Development
The production of phosphorus trichloride involves complex and costly infrastructure, including advanced chemical processing facilities that adhere to stringent safety and environmental standards. The high initial investment required for setting up these production plants acts as a significant barrier to entry for new players in the market. This restricts the market's growth by limiting the number of producers and, consequently, the overall supply of phosphorus trichloride.
Additionally, the need for ongoing investment in technology upgrades to improve efficiency and reduce environmental impact further escalates the operational costs. These financial demands can deter investment in phosphorus trichloride production, particularly in regions where capital is scarce or where investors are wary of the chemical industry's volatility.
Regulatory Constraints and Standards Compliance Challenges
Phosphorus trichloride is a highly toxic and corrosive substance, which makes its production, handling, and disposal subject to stringent regulatory oversight globally. Compliance with these regulations, which aim to protect human health and the environment, requires significant investment in safety measures, environmental controls, and waste management systems. These regulatory constraints can hinder market growth as they increase the operational costs and complexity for manufacturers.
Furthermore, the variation in regulations across different regions adds to the compliance challenge, affecting the international trade and distribution of phosphorus trichloride. Manufacturers must navigate a complex web of international, national, and local regulations, which can delay product launches, restrict market access, and ultimately limit market growth.
By Grade Analysis
The pure grade segment dominated, reflecting its high purity and extensive utility.
In 2023, Pure established a dominant market position in the Grade segment of the Phosphorus Trichloride market, particularly within the Analytical Reagent and Pure categories. This strategic dominance can be attributed to several key factors, including advanced production techniques, stringent quality control measures, and robust distribution networks, which enhanced its market reach and reliability among end-users.
The demand for Phosphorus Trichloride, especially in high-purity forms such as Analytical Reagent and Pure, has been driven by its extensive applications in the pharmaceutical and agricultural industries. In pharmaceuticals, Pure grade Phosphorus Trichloride is crucial for synthesizing glycerophosphates, a component of many medicinal products. Similarly, in agriculture, it is used in the production of organophosphorus pesticides, which are essential for pest control and crop yield enhancement.
The market dynamics are further influenced by regulatory frameworks that mandate the use of high-quality chemicals to ensure safety and efficacy in end products. Companies like Pure, with their ability to comply with these stringent regulations, are positioned favorably in the market. Additionally, the ongoing innovations in chemical synthesis and a growing emphasis on sustainable practices have prompted companies to improve their operational efficiencies and environmental compliance, which in turn supports market growth.
Looking ahead, the market for Phosphorus Trichloride is expected to continue growing, propelled by increasing demand in key industries and technological advancements in chemical processing. Companies that maintain high standards of purity and adapt to regulatory changes will likely see sustained success and could expand their market share in the coming years.
By Application Analysis
Pharmaceuticals led, underscoring the sector's robust demand for premium quality products.
In 2023, Pharmaceuticals held a dominant market position in the By Application segment of the Phosphorus Trichloride market. This prominence is largely due to the critical role Phosphorus Trichloride plays as a key intermediate in the synthesis of various pharmaceutical compounds. Its application in producing vital organophosphorus compounds, which are integral to a wide range of therapeutic drugs, underscores its significance within the pharmaceutical industry.
The demand for Phosphorus Trichloride in pharmaceutical applications has been consistently strong, driven by the global increase in healthcare expenditures and the ongoing development of new medications requiring complex synthesis. As populations age and the prevalence of chronic diseases rises, the pharmaceutical industry's demand for high-purity chemical intermediates like Phosphorus Trichloride is expected to grow further.
Moreover, the stringent regulatory environment governing pharmaceutical production standards has necessitated the use of high-quality and pure chemical intermediates. Phosphorus Trichloride, known for its effectiveness and reliability in pharmaceutical applications, enables manufacturers to adhere to these rigorous quality controls, thereby enhancing their production capabilities.
Looking forward, the Pharmaceuticals segment of the Phosphorus Trichloride market is poised for continued growth. Innovations in drug development and an increasing focus on personalized medicine are likely to expand the range of applications for Phosphorus Trichloride. As the pharmaceutical industry seeks more efficient and safer synthesis routes, the demand for specialized chemical intermediates like Phosphorus Trichloride will undoubtedly rise, ensuring its pivotal role in the market persists.
By Sales Channel Analysis
The distribution channel prevailed, highlighting its critical role in market penetration.
In 2023, the Distribution Channel held a dominant market position in the By Sales Channel segment of the Phosphorus Trichloride market. This channel's predominance is attributed to its extensive network and efficiency in delivering Phosphorus Trichloride to various end-use industries such as pharmaceuticals, agrochemicals, and others. The widespread preference for distribution channels is primarily due to their ability to manage complex logistics and provide value-added services such as just-in-time delivery, inventory management, and after-sales support.
The effectiveness of distribution channels in bridging the gap between manufacturers and end-users has been crucial. Distributors play a pivotal role in ensuring a steady supply of Phosphorus Trichloride, particularly in regions where direct access to manufacturers is limited. This is especially important given the chemical’s critical applications in sensitive industries, where purity and timely availability are paramount.
Furthermore, distributors have adapted to the digital transformation within the market. Many now offer online ordering platforms, which have enhanced their reach and appeal, particularly among small to medium-sized enterprises that may not engage directly with large chemical producers. These platforms not only simplify the procurement process but also provide customers with detailed product information, competitive pricing, and transparent transaction processes.
As the market for Phosphorus Trichloride continues to expand, the role of distributors is expected to become even more integral. Their ability to navigate regulatory landscapes, manage logistics efficiently, and cater to a geographically dispersed client base will drive their continued dominance in the sales channel structure. This will likely result in sustained growth and potentially an increase in market share within this segment in the forthcoming years.
Key Market Segments
By Grade
- Analytical Reagent
- Pure
By Application
- Chemical Intermediate
- A Gasoline Additive
- Pharmaceuticals
- Agrochemicals
- Plasticizer
- Pesticides
- Others
By Sales Channel
- Distribution Channel
- Direct Channel
Growth Opportunity
Opportunities in Water Treatment Applications
The global phosphorus trichloride market is poised for significant growth within the water treatment sector. Phosphorus trichloride, a key chemical used in the production of water treatment chemicals such as phosphorus oxychloride and phosphoric acid, plays a crucial role in the purification processes. As global water scarcity issues intensify and the demand for clean and safe water rises, the market for water treatment chemicals is expected to witness robust growth.
This scenario is anticipated to drive substantial demand for phosphorus trichloride, particularly in regions grappling with water quality challenges. Strategic investments in water treatment infrastructure, coupled with stringent environmental regulations, are likely to further bolster the market expansion. Thus, the segment presents lucrative growth opportunities for market participants, especially in emerging economies where urbanization and industrial activities are escalating.
Expansion of Construction and Infrastructure Sector
Phosphorus trichloride finds extensive applications in the construction and infrastructure sector, primarily due to its use in the synthesis of phosphorus-based flame retardants and plasticizers. The global surge in construction activities, fueled by urbanization and governmental infrastructural investments, directly correlates with the increased consumption of materials requiring flame-retardant properties.
This trend is particularly pronounced in the Asia-Pacific region, which is experiencing rapid economic development and substantial infrastructural expansion. The ongoing growth in this sector is expected to drive the demand for phosphorus trichloride, thereby creating significant opportunities for market players. Manufacturers and distributors within the phosphorus trichloride market could potentially expand their operations and increase their market presence by leveraging this uptick in construction activities.
Latest Trends
Focus on Safety and Regulatory Compliance in Handling Phosphorus Trichloride
In 2023, the global phosphorus trichloride market is significantly influenced by a heightened focus on safety and regulatory compliance. Phosphorus trichloride, recognized for its reactive and corrosive nature, mandates stringent handling and storage protocols to prevent occupational hazards and environmental contamination. Regulatory bodies worldwide are intensifying scrutiny and tightening regulations concerning chemical handling, which compels manufacturers to invest in safer production technologies and advanced containment systems.
This regulatory pressure is not only reshaping operational standards but also driving innovation in safe handling practices, which is pivotal for maintaining industry sustainability and protecting worker health and safety. Companies adhering to these enhanced safety measures are likely to gain competitive advantages, fostering trust and reliability among stakeholders and regulators.
Expansion of the Electronics and Semiconductor Industries
The expansion of the electronics and semiconductor industries presents a promising avenue for the phosphorus trichloride market. As a critical raw material in the manufacture of phosphorus oxychloride and phosphorus pentachloride, which are used extensively in the production of flame retardants and plasticizers for electronic components, phosphorus trichloride is directly benefiting from the surge in electronics demand.
This trend is particularly robust due to the ongoing digital transformation and the proliferation of consumer electronics. Moreover, the semiconductor industry's growth, fueled by advancements in technology and an increase in semiconductor fabrication plants, especially in Asia-Pacific, further amplifies the demand for phosphorus trichloride. These developments signify a substantial growth potential for market participants, underpinned by technological advancements and global economic recovery, enhancing the market's dynamics and expansion prospects.
Regional Analysis
In 2023, the Asia Pacific region held a 35.2% share of the global phosphorus trichloride market.
The global phosphorus trichloride market exhibits varied growth dynamics across different regions, reflecting distinct industrial, regulatory, and economic landscapes. In 2023, Asia Pacific emerged as the dominating region, accounting for 35.2% of the global market.
This substantial share is primarily driven by the rapid industrialization in countries such as China and India, coupled with significant investments in the electronics and water treatment sectors. The region's dominance is further bolstered by its robust manufacturing base and the extensive use of phosphorus trichloride in the production of agrochemicals and flame retardants.
In North America, the market for phosphorus trichloride is mature, with a strong emphasis on regulatory compliance and safety in chemical processing. The region’s market is supported by advanced technological infrastructure and stringent environmental regulations, which ensure safe handling and usage of hazardous chemicals. This focus on safety and compliance aids in maintaining a steady demand for phosphorus trichloride, particularly in the pharmaceutical and agrochemical sectors.
Europe, similar to North America, showcases a highly regulated market where safety and environmental sustainability are paramount. The European market is characterized by high demand in the chemical industry, with additional growth potential in the flame retardants segment due to increasing regulations on fire safety in the construction and automotive industries.
Meanwhile, the Middle East & Africa and Latin America regions are gradually expanding their market presence. These regions exhibit potential for growth due to developing industrial sectors and increasing awareness of water purification needs. Investments in infrastructure and an uptick in industrial activities contribute to the rising demand for phosphorus trichloride, although these markets are still nascent compared to Asia Pacific, North America, and Europe.
Key Regions and Countries
North America
- The US
- Canada
- Rest of North America
Europe
- Germany
- France
- The UK
- Spain
- Netherlands
- Russia
- Italy
- Rest of Europe
Asia-Pacific
- China
- Japan
- Singapore
- Thailand
- South Korea
- Vietnam
- India
- New Zealand
- Rest of Asia Pacific
Latin America
- Mexico
- Brazil
- Rest of Latin America
Middle East & Africa
- Saudi Arabia
- South Africa
- UAE
- Rest of Middle East & Africa
Key Players Analysis
In 2023, the global Phosphorus Trichloride market is marked by the participation of several key players that underscore the competitive dynamics and regional dispersion of the industry. Among these, Bayer AG and Merck KGaA stand out due to their robust R&D capabilities and strong global presence. Bayer AG, headquartered in the U.S., continues to leverage its expansive distribution networks and innovation-driven strategy to maintain its dominance. Similarly, Germany's Merck KGaA emphasizes advanced chemical solutions, which augment its market position.
Solvay and LANXESS, both from Belgium and Germany respectively, are notable for their commitment to sustainable chemical manufacturing practices, aligning with global regulatory standards and environmental considerations. This not only enhances their brand reputation but also appeals to environmentally conscious stakeholders.
Further, companies like ICL from Israel and UPL Limited from India represent strategic regional players who adapt swiftly to local market demands and regulatory frameworks, ensuring a steady supply chain and localized market penetration.
Emerging players from Asia, such as Xuzhou Jianping Chemical Co., Ltd and Zhejiang Xinan Chemical Industrial Group Co., Ltd from China, demonstrate significant growth potential through strategic partnerships and capacity expansions to cater to the vast Asian and global markets.
The participation of specialized companies like PCC Rokita from Poland and SANDHYA GROUP from India highlights the niche innovations and customized solutions that smaller players bring to the table, challenging the market norms and introducing competitive pressures on larger incumbents.
Overall, the diversity of these companies, ranging from established conglomerates to dynamic regional players, creates a vibrant ecosystem in the Phosphorus Trichloride market, characterized by technological innovations, strategic expansions, and a focus on sustainability and regulatory compliance.
Market Key Players
- Bayer AG (U.S.)
- Solvay (Belgium)
- Merck KGaA (Germany)
- LAXNESS (Germany)
- PCC Rokita Spólka Akcyjna (Poland)
- ICL (Israel)
- SANDHYA GROUP (India)
- Parchem fine & specialty chemicals (U.S.)
- Xuzhou Jianping Chemical Co., Ltd (China)
- Anhui Guangxin Agrochemical Co., Ltd. (China)
- Excel Industries Ltd (India)
- Shandong Futong Chemical Co., Ltd. (China)
- Henan Qingshuiyuan Technology Co., Ltd. (China)
- Jiangsu Tianyuan Chemical Co., Ltd. (China)
- Jiangsu Yoke Technology Co., Ltd. (China)
- Shandong Yangmei Hengtong Chemical Co., Ltd. (China)
- UPL Limited (India)
- Xuzhou Jianping Chemical Co., Ltd. (China)
- Xuzhou Yongli Fine Chemical Co., Ltd. (China)
- Zhejiang Xinan Chemical Industrial Group Co., Ltd, (China)
Recent Development
- In February 2024, ESIM Chemicals expanded with a new facility for phosphorus trichloride (PCI3) reactions, enhancing its capability as a reliable partner for sensitive phosphorus compounds. The Linz-based company focuses on sustainable supply to the European market.
- In June 2023, TU Dresden researchers developed a two-step method for producing phosphorus-containing chemicals, bypassing toxic intermediates. Their innovation offers sustainability and independence from third countries in chemical production.
Report Scope
Report Features Description Market Value (2023) USD 1.6 Billion Forecast Revenue (2033) USD 6.9 Billion CAGR (2024-2032) 16.2% Base Year for Estimation 2023 Historic Period 2016-2023 Forecast Period 2024-2033 Report Coverage Revenue Forecast, Market Dynamics, COVID-19 Impact, Competitive Landscape, Recent Developments Segments Covered By Grade(Analytical Reagent, Pure), By Application(Chemical Intermediate, A Gasoline Additive, Pharmaceuticals, Agrochemicals, Plasticizer, Pesticides, Others), By Sales Channel(Distribution Channel, Direct Channel) Regional Analysis North America - The US, Canada, Rest of North America, Europe - Germany, France, The UK, Spain, Italy, Russia, Netherlands, Rest of Europe, Asia-Pacific - China, Japan, South Korea, India, New Zealand, Singapore, Thailand, Vietnam, Rest of Asia Pacific, Latin America - Brazil, Mexico, Rest of Latin America, Middle East & Africa - South Africa, Saudi Arabia, UAE, Rest of Middle East & Africa Competitive Landscape Bayer AG (U.S.), Solvay (Belgium), Merck KGaA (Germany), LAXNESS (Germany), PCC Rokita Spólka Akcyjna (Poland), ICL (Israel), SANDHYA GROUP (India), Parchem fine & specialty chemicals (U.S.), Xuzhou Jianping Chemical Co., Ltd (China), Anhui Guangxin Agrochemical Co., Ltd. (China), Excel Industries Ltd (India), Shandong Futong Chemical Co., Ltd. (China), Henan Qingshuiyuan Technology Co., Ltd. (China), Jiangsu Tianyuan Chemical Co., Ltd. (China), Jiangsu Yoke Technology Co., Ltd. (China), Shandong Yangmei Hengtong Chemical Co., Ltd. (China), UPL Limited (India), Xuzhou Jianping Chemical Co., Ltd. (China), Xuzhou Yongli Fine Chemical Co., Ltd. (China), Zhejiang Xinan Chemical Industrial Group Co., Ltd, (China) Customization Scope Customization for segments, region/country-level will be provided. Moreover, additional customization can be done based on the requirements. Purchase Options We have three licenses to opt for Single User License, Multi-User License (Up to 5 Users), Corporate Use License (Unlimited User and Printable PDF) -
- 1. Executive Summary
- 1.1. Definition
- 1.2. Taxonomy
- 1.3. Research Scope
- 1.4. Key Analysis
- 1.5. Key Findings by Major Segments
- 1.6. Top strategies by Major Players
- 2. Global Phosphorus Trichloride Market Overview
- 2.1. Phosphorus Trichloride Market Dynamics
- 2.1.1. Drivers
- 2.1.2. Opportunities
- 2.1.3. Restraints
- 2.1.4. Challenges
- 2.2. Macro-economic Factors
- 2.3. Regulatory Framework
- 2.4. Market Investment Feasibility Index
- 2.5. PEST Analysis
- 2.6. PORTER’S Five Force Analysis
- 2.7. Drivers & Restraints Impact Analysis
- 2.8. Industry Chain Analysis
- 2.9. Cost Structure Analysis
- 2.10. Marketing Strategy
- 2.11. Russia-Ukraine War Impact Analysis
- 2.12. Opportunity Map Analysis
- 2.13. Market Competition Scenario Analysis
- 2.14. Product Life Cycle Analysis
- 2.15. Opportunity Orbits
- 2.16. Manufacturer Intensity Map
- 2.17. Major Companies sales by Value & Volume
- 2.1. Phosphorus Trichloride Market Dynamics
- 3. Global Phosphorus Trichloride Market Analysis, Opportunity and Forecast, 2016-2032
- 3.1. Global Phosphorus Trichloride Market Analysis, 2016-2021
- 3.2. Global Phosphorus Trichloride Market Opportunity and Forecast, 2023-2032
- 3.3. Global Phosphorus Trichloride Market Analysis, Opportunity and Forecast, By By Grade, 2016-2032
- 3.3.1. Global Phosphorus Trichloride Market Analysis by By Grade: Introduction
- 3.3.2. Market Size Absolute $ Opportunity Analysis and Forecast, By By Grade, 2016-2032
- 3.3.3. Analytical Reagent
- 3.3.4. Pure
- 3.4. Global Phosphorus Trichloride Market Analysis, Opportunity and Forecast, By By Application, 2016-2032
- 3.4.1. Global Phosphorus Trichloride Market Analysis by By Application: Introduction
- 3.4.2. Market Size Absolute $ Opportunity Analysis and Forecast, By By Application, 2016-2032
- 3.4.3. Chemical Intermediate
- 3.4.4. A Gasoline Additive
- 3.4.5. Pharmaceuticals
- 3.4.6. Agrochemicals
- 3.4.7. Plasticizer
- 3.4.8. Pesticides
- 3.4.9. Others
- 3.5. Global Phosphorus Trichloride Market Analysis, Opportunity and Forecast, By By Sales Channel, 2016-2032
- 3.5.1. Global Phosphorus Trichloride Market Analysis by By Sales Channel: Introduction
- 3.5.2. Market Size Absolute $ Opportunity Analysis and Forecast, By By Sales Channel, 2016-2032
- 3.5.3. Distribution Channel
- 3.5.4. Direct Channel
- 4. North America Phosphorus Trichloride Market Analysis, Opportunity and Forecast, 2016-2032
- 4.1. North America Phosphorus Trichloride Market Analysis, 2016-2021
- 4.2. North America Phosphorus Trichloride Market Opportunity and Forecast, 2023-2032
- 4.3. North America Phosphorus Trichloride Market Analysis, Opportunity and Forecast, By By Grade, 2016-2032
- 4.3.1. North America Phosphorus Trichloride Market Analysis by By Grade: Introduction
- 4.3.2. Market Size Absolute $ Opportunity Analysis and Forecast, By By Grade, 2016-2032
- 4.3.3. Analytical Reagent
- 4.3.4. Pure
- 4.4. North America Phosphorus Trichloride Market Analysis, Opportunity and Forecast, By By Application, 2016-2032
- 4.4.1. North America Phosphorus Trichloride Market Analysis by By Application: Introduction
- 4.4.2. Market Size Absolute $ Opportunity Analysis and Forecast, By By Application, 2016-2032
- 4.4.3. Chemical Intermediate
- 4.4.4. A Gasoline Additive
- 4.4.5. Pharmaceuticals
- 4.4.6. Agrochemicals
- 4.4.7. Plasticizer
- 4.4.8. Pesticides
- 4.4.9. Others
- 4.5. North America Phosphorus Trichloride Market Analysis, Opportunity and Forecast, By By Sales Channel, 2016-2032
- 4.5.1. North America Phosphorus Trichloride Market Analysis by By Sales Channel: Introduction
- 4.5.2. Market Size Absolute $ Opportunity Analysis and Forecast, By By Sales Channel, 2016-2032
- 4.5.3. Distribution Channel
- 4.5.4. Direct Channel
- 4.6. North America Phosphorus Trichloride Market Analysis, Opportunity and Forecast, By Country , 2016-2032
- 4.6.1. North America Phosphorus Trichloride Market Analysis by Country : Introduction
- 4.6.2. Market Size Absolute $ Opportunity Analysis and Forecast, Country , 2016-2032
- 4.6.2.1. The US
- 4.6.2.2. Canada
- 4.6.2.3. Mexico
- 5. Western Europe Phosphorus Trichloride Market Analysis, Opportunity and Forecast, 2016-2032
- 5.1. Western Europe Phosphorus Trichloride Market Analysis, 2016-2021
- 5.2. Western Europe Phosphorus Trichloride Market Opportunity and Forecast, 2023-2032
- 5.3. Western Europe Phosphorus Trichloride Market Analysis, Opportunity and Forecast, By By Grade, 2016-2032
- 5.3.1. Western Europe Phosphorus Trichloride Market Analysis by By Grade: Introduction
- 5.3.2. Market Size Absolute $ Opportunity Analysis and Forecast, By By Grade, 2016-2032
- 5.3.3. Analytical Reagent
- 5.3.4. Pure
- 5.4. Western Europe Phosphorus Trichloride Market Analysis, Opportunity and Forecast, By By Application, 2016-2032
- 5.4.1. Western Europe Phosphorus Trichloride Market Analysis by By Application: Introduction
- 5.4.2. Market Size Absolute $ Opportunity Analysis and Forecast, By By Application, 2016-2032
- 5.4.3. Chemical Intermediate
- 5.4.4. A Gasoline Additive
- 5.4.5. Pharmaceuticals
- 5.4.6. Agrochemicals
- 5.4.7. Plasticizer
- 5.4.8. Pesticides
- 5.4.9. Others
- 5.5. Western Europe Phosphorus Trichloride Market Analysis, Opportunity and Forecast, By By Sales Channel, 2016-2032
- 5.5.1. Western Europe Phosphorus Trichloride Market Analysis by By Sales Channel: Introduction
- 5.5.2. Market Size Absolute $ Opportunity Analysis and Forecast, By By Sales Channel, 2016-2032
- 5.5.3. Distribution Channel
- 5.5.4. Direct Channel
- 5.6. Western Europe Phosphorus Trichloride Market Analysis, Opportunity and Forecast, By Country , 2016-2032
- 5.6.1. Western Europe Phosphorus Trichloride Market Analysis by Country : Introduction
- 5.6.2. Market Size Absolute $ Opportunity Analysis and Forecast, Country , 2016-2032
- 5.6.2.1. Germany
- 5.6.2.2. France
- 5.6.2.3. The UK
- 5.6.2.4. Spain
- 5.6.2.5. Italy
- 5.6.2.6. Portugal
- 5.6.2.7. Ireland
- 5.6.2.8. Austria
- 5.6.2.9. Switzerland
- 5.6.2.10. Benelux
- 5.6.2.11. Nordic
- 5.6.2.12. Rest of Western Europe
- 6. Eastern Europe Phosphorus Trichloride Market Analysis, Opportunity and Forecast, 2016-2032
- 6.1. Eastern Europe Phosphorus Trichloride Market Analysis, 2016-2021
- 6.2. Eastern Europe Phosphorus Trichloride Market Opportunity and Forecast, 2023-2032
- 6.3. Eastern Europe Phosphorus Trichloride Market Analysis, Opportunity and Forecast, By By Grade, 2016-2032
- 6.3.1. Eastern Europe Phosphorus Trichloride Market Analysis by By Grade: Introduction
- 6.3.2. Market Size Absolute $ Opportunity Analysis and Forecast, By By Grade, 2016-2032
- 6.3.3. Analytical Reagent
- 6.3.4. Pure
- 6.4. Eastern Europe Phosphorus Trichloride Market Analysis, Opportunity and Forecast, By By Application, 2016-2032
- 6.4.1. Eastern Europe Phosphorus Trichloride Market Analysis by By Application: Introduction
- 6.4.2. Market Size Absolute $ Opportunity Analysis and Forecast, By By Application, 2016-2032
- 6.4.3. Chemical Intermediate
- 6.4.4. A Gasoline Additive
- 6.4.5. Pharmaceuticals
- 6.4.6. Agrochemicals
- 6.4.7. Plasticizer
- 6.4.8. Pesticides
- 6.4.9. Others
- 6.5. Eastern Europe Phosphorus Trichloride Market Analysis, Opportunity and Forecast, By By Sales Channel, 2016-2032
- 6.5.1. Eastern Europe Phosphorus Trichloride Market Analysis by By Sales Channel: Introduction
- 6.5.2. Market Size Absolute $ Opportunity Analysis and Forecast, By By Sales Channel, 2016-2032
- 6.5.3. Distribution Channel
- 6.5.4. Direct Channel
- 6.6. Eastern Europe Phosphorus Trichloride Market Analysis, Opportunity and Forecast, By Country , 2016-2032
- 6.6.1. Eastern Europe Phosphorus Trichloride Market Analysis by Country : Introduction
- 6.6.2. Market Size Absolute $ Opportunity Analysis and Forecast, Country , 2016-2032
- 6.6.2.1. Russia
- 6.6.2.2. Poland
- 6.6.2.3. The Czech Republic
- 6.6.2.4. Greece
- 6.6.2.5. Rest of Eastern Europe
- 7. APAC Phosphorus Trichloride Market Analysis, Opportunity and Forecast, 2016-2032
- 7.1. APAC Phosphorus Trichloride Market Analysis, 2016-2021
- 7.2. APAC Phosphorus Trichloride Market Opportunity and Forecast, 2023-2032
- 7.3. APAC Phosphorus Trichloride Market Analysis, Opportunity and Forecast, By By Grade, 2016-2032
- 7.3.1. APAC Phosphorus Trichloride Market Analysis by By Grade: Introduction
- 7.3.2. Market Size Absolute $ Opportunity Analysis and Forecast, By By Grade, 2016-2032
- 7.3.3. Analytical Reagent
- 7.3.4. Pure
- 7.4. APAC Phosphorus Trichloride Market Analysis, Opportunity and Forecast, By By Application, 2016-2032
- 7.4.1. APAC Phosphorus Trichloride Market Analysis by By Application: Introduction
- 7.4.2. Market Size Absolute $ Opportunity Analysis and Forecast, By By Application, 2016-2032
- 7.4.3. Chemical Intermediate
- 7.4.4. A Gasoline Additive
- 7.4.5. Pharmaceuticals
- 7.4.6. Agrochemicals
- 7.4.7. Plasticizer
- 7.4.8. Pesticides
- 7.4.9. Others
- 7.5. APAC Phosphorus Trichloride Market Analysis, Opportunity and Forecast, By By Sales Channel, 2016-2032
- 7.5.1. APAC Phosphorus Trichloride Market Analysis by By Sales Channel: Introduction
- 7.5.2. Market Size Absolute $ Opportunity Analysis and Forecast, By By Sales Channel, 2016-2032
- 7.5.3. Distribution Channel
- 7.5.4. Direct Channel
- 7.6. APAC Phosphorus Trichloride Market Analysis, Opportunity and Forecast, By Country , 2016-2032
- 7.6.1. APAC Phosphorus Trichloride Market Analysis by Country : Introduction
- 7.6.2. Market Size Absolute $ Opportunity Analysis and Forecast, Country , 2016-2032
- 7.6.2.1. China
- 7.6.2.2. Japan
- 7.6.2.3. South Korea
- 7.6.2.4. India
- 7.6.2.5. Australia & New Zeland
- 7.6.2.6. Indonesia
- 7.6.2.7. Malaysia
- 7.6.2.8. Philippines
- 7.6.2.9. Singapore
- 7.6.2.10. Thailand
- 7.6.2.11. Vietnam
- 7.6.2.12. Rest of APAC
- 8. Latin America Phosphorus Trichloride Market Analysis, Opportunity and Forecast, 2016-2032
- 8.1. Latin America Phosphorus Trichloride Market Analysis, 2016-2021
- 8.2. Latin America Phosphorus Trichloride Market Opportunity and Forecast, 2023-2032
- 8.3. Latin America Phosphorus Trichloride Market Analysis, Opportunity and Forecast, By By Grade, 2016-2032
- 8.3.1. Latin America Phosphorus Trichloride Market Analysis by By Grade: Introduction
- 8.3.2. Market Size Absolute $ Opportunity Analysis and Forecast, By By Grade, 2016-2032
- 8.3.3. Analytical Reagent
- 8.3.4. Pure
- 8.4. Latin America Phosphorus Trichloride Market Analysis, Opportunity and Forecast, By By Application, 2016-2032
- 8.4.1. Latin America Phosphorus Trichloride Market Analysis by By Application: Introduction
- 8.4.2. Market Size Absolute $ Opportunity Analysis and Forecast, By By Application, 2016-2032
- 8.4.3. Chemical Intermediate
- 8.4.4. A Gasoline Additive
- 8.4.5. Pharmaceuticals
- 8.4.6. Agrochemicals
- 8.4.7. Plasticizer
- 8.4.8. Pesticides
- 8.4.9. Others
- 8.5. Latin America Phosphorus Trichloride Market Analysis, Opportunity and Forecast, By By Sales Channel, 2016-2032
- 8.5.1. Latin America Phosphorus Trichloride Market Analysis by By Sales Channel: Introduction
- 8.5.2. Market Size Absolute $ Opportunity Analysis and Forecast, By By Sales Channel, 2016-2032
- 8.5.3. Distribution Channel
- 8.5.4. Direct Channel
- 8.6. Latin America Phosphorus Trichloride Market Analysis, Opportunity and Forecast, By Country , 2016-2032
- 8.6.1. Latin America Phosphorus Trichloride Market Analysis by Country : Introduction
- 8.6.2. Market Size Absolute $ Opportunity Analysis and Forecast, Country , 2016-2032
- 8.6.2.1. Brazil
- 8.6.2.2. Colombia
- 8.6.2.3. Chile
- 8.6.2.4. Argentina
- 8.6.2.5. Costa Rica
- 8.6.2.6. Rest of Latin America
- 9. Middle East & Africa Phosphorus Trichloride Market Analysis, Opportunity and Forecast, 2016-2032
- 9.1. Middle East & Africa Phosphorus Trichloride Market Analysis, 2016-2021
- 9.2. Middle East & Africa Phosphorus Trichloride Market Opportunity and Forecast, 2023-2032
- 9.3. Middle East & Africa Phosphorus Trichloride Market Analysis, Opportunity and Forecast, By By Grade, 2016-2032
- 9.3.1. Middle East & Africa Phosphorus Trichloride Market Analysis by By Grade: Introduction
- 9.3.2. Market Size Absolute $ Opportunity Analysis and Forecast, By By Grade, 2016-2032
- 9.3.3. Analytical Reagent
- 9.3.4. Pure
- 9.4. Middle East & Africa Phosphorus Trichloride Market Analysis, Opportunity and Forecast, By By Application, 2016-2032
- 9.4.1. Middle East & Africa Phosphorus Trichloride Market Analysis by By Application: Introduction
- 9.4.2. Market Size Absolute $ Opportunity Analysis and Forecast, By By Application, 2016-2032
- 9.4.3. Chemical Intermediate
- 9.4.4. A Gasoline Additive
- 9.4.5. Pharmaceuticals
- 9.4.6. Agrochemicals
- 9.4.7. Plasticizer
- 9.4.8. Pesticides
- 9.4.9. Others
- 9.5. Middle East & Africa Phosphorus Trichloride Market Analysis, Opportunity and Forecast, By By Sales Channel, 2016-2032
- 9.5.1. Middle East & Africa Phosphorus Trichloride Market Analysis by By Sales Channel: Introduction
- 9.5.2. Market Size Absolute $ Opportunity Analysis and Forecast, By By Sales Channel, 2016-2032
- 9.5.3. Distribution Channel
- 9.5.4. Direct Channel
- 9.6. Middle East & Africa Phosphorus Trichloride Market Analysis, Opportunity and Forecast, By Country , 2016-2032
- 9.6.1. Middle East & Africa Phosphorus Trichloride Market Analysis by Country : Introduction
- 9.6.2. Market Size Absolute $ Opportunity Analysis and Forecast, Country , 2016-2032
- 9.6.2.1. Algeria
- 9.6.2.2. Egypt
- 9.6.2.3. Israel
- 9.6.2.4. Kuwait
- 9.6.2.5. Nigeria
- 9.6.2.6. Saudi Arabia
- 9.6.2.7. South Africa
- 9.6.2.8. Turkey
- 9.6.2.9. The UAE
- 9.6.2.10. Rest of MEA
- 10. Global Phosphorus Trichloride Market Analysis, Opportunity and Forecast, By Region , 2016-2032
- 10.1. Global Phosphorus Trichloride Market Analysis by Region : Introduction
- 10.2. Market Size Absolute $ Opportunity Analysis and Forecast, By Region , 2016-2032
- 10.2.1. North America
- 10.2.2. Western Europe
- 10.2.3. Eastern Europe
- 10.2.4. APAC
- 10.2.5. Latin America
- 10.2.6. Middle East & Africa
- 11. Global Phosphorus Trichloride Market Competitive Landscape, Market Share Analysis, and Company Profiles
- 11.1. Market Share Analysis
- 11.2. Company Profiles
- 11.3. Bayer AG (U.S.)
- 11.3.1. Company Overview
- 11.3.2. Financial Highlights
- 11.3.3. Product Portfolio
- 11.3.4. SWOT Analysis
- 11.3.5. Key Strategies and Developments
- 11.4. Solvay (Belgium)
- 11.4.1. Company Overview
- 11.4.2. Financial Highlights
- 11.4.3. Product Portfolio
- 11.4.4. SWOT Analysis
- 11.4.5. Key Strategies and Developments
- 11.5. Merck KGaA (Germany)
- 11.5.1. Company Overview
- 11.5.2. Financial Highlights
- 11.5.3. Product Portfolio
- 11.5.4. SWOT Analysis
- 11.5.5. Key Strategies and Developments
- 11.6. LAXNESS (Germany)
- 11.6.1. Company Overview
- 11.6.2. Financial Highlights
- 11.6.3. Product Portfolio
- 11.6.4. SWOT Analysis
- 11.6.5. Key Strategies and Developments
- 11.7. PCC Rokita Spólka Akcyjna (Poland)
- 11.7.1. Company Overview
- 11.7.2. Financial Highlights
- 11.7.3. Product Portfolio
- 11.7.4. SWOT Analysis
- 11.7.5. Key Strategies and Developments
- 11.8. ICL (Israel)
- 11.8.1. Company Overview
- 11.8.2. Financial Highlights
- 11.8.3. Product Portfolio
- 11.8.4. SWOT Analysis
- 11.8.5. Key Strategies and Developments
- 11.9. SANDHYA GROUP (India)
- 11.9.1. Company Overview
- 11.9.2. Financial Highlights
- 11.9.3. Product Portfolio
- 11.9.4. SWOT Analysis
- 11.9.5. Key Strategies and Developments
- 11.10. Parchem fine & specialty chemicals (U.S.)
- 11.10.1. Company Overview
- 11.10.2. Financial Highlights
- 11.10.3. Product Portfolio
- 11.10.4. SWOT Analysis
- 11.10.5. Key Strategies and Developments
- 11.11. Xuzhou Jianping Chemical Co., Ltd (China)
- 11.11.1. Company Overview
- 11.11.2. Financial Highlights
- 11.11.3. Product Portfolio
- 11.11.4. SWOT Analysis
- 11.11.5. Key Strategies and Developments
- 11.12. Anhui Guangxin Agrochemical Co., Ltd. (China)
- 11.12.1. Company Overview
- 11.12.2. Financial Highlights
- 11.12.3. Product Portfolio
- 11.12.4. SWOT Analysis
- 11.12.5. Key Strategies and Developments
- 11.13.1. Company Overview
- 11.13.2. Financial Highlights
- 11.13.3. Product Portfolio
- 11.13.4. SWOT Analysis
- 11.13.5. Key Strategies and Developments
- 11.14. Excel Industries Ltd (India)
- 11.14.1. Company Overview
- 11.14.2. Financial Highlights
- 11.14.3. Product Portfolio
- 11.14.4. SWOT Analysis
- 11.14.5. Key Strategies and Developments
- 11.15. Henan Qingshuiyuan Technology Co., Ltd. (China)
- 11.15.1. Company Overview
- 11.15.2. Financial Highlights
- 11.15.3. Product Portfolio
- 11.15.4. SWOT Analysis
- 11.15.5. Key Strategies and Developments
- 11.16. Jiangsu Tianyuan Chemical Co., Ltd. (China)
- 11.16.1. Company Overview
- 11.16.2. Financial Highlights
- 11.16.3. Product Portfolio
- 11.16.4. SWOT Analysis
- 11.16.5. Key Strategies and Developments
- 11.17. Jiangsu Yoke Technology Co., Ltd. (China)
- 11.17.1. Company Overview
- 11.17.2. Financial Highlights
- 11.17.3. Product Portfolio
- 11.17.4. SWOT Analysis
- 11.17.5. Key Strategies and Developments
- 11.18. Shandong Yangmei Hengtong Chemical Co., Ltd. (China)
- 11.18.1. Company Overview
- 11.18.2. Financial Highlights
- 11.18.3. Product Portfolio
- 11.18.4. SWOT Analysis
- 11.18.5. Key Strategies and Developments
- 11.19. UPL Limited (India)
- 11.19.1. Company Overview
- 11.19.2. Financial Highlights
- 11.19.3. Product Portfolio
- 11.19.4. SWOT Analysis
- 11.19.5. Key Strategies and Developments
- 11.20. Xuzhou Jianping Chemical Co., Ltd. (China)
- 11.20.1. Company Overview
- 11.20.2. Financial Highlights
- 11.20.3. Product Portfolio
- 11.20.4. SWOT Analysis
- 11.20.5. Key Strategies and Developments
- 11.21. Xuzhou Yongli Fine Chemical Co., Ltd. (China)
- 11.21.1. Company Overview
- 11.21.2. Financial Highlights
- 11.21.3. Product Portfolio
- 11.21.4. SWOT Analysis
- 11.21.5. Key Strategies and Developments
- 11.22. Zhejiang Xinan Chemical Industrial Group Co., Ltd, (China)
- 11.22.1. Company Overview
- 11.22.2. Financial Highlights
- 11.22.3. Product Portfolio
- 11.22.4. SWOT Analysis
- 11.22.5. Key Strategies and Developments
- 12. Assumptions and Acronyms
- 13. Research Methodology
- 14. Contact
"
- List of Figures
- "
- Figure 1: Global Phosphorus Trichloride Market Revenue (US$ Mn) Market Share by By Grade in 2022
- Figure 2: Global Phosphorus Trichloride Market Market Attractiveness Analysis by By Grade, 2016-2032
- Figure 3: Global Phosphorus Trichloride Market Revenue (US$ Mn) Market Share by By Applicationin 2022
- Figure 4: Global Phosphorus Trichloride Market Market Attractiveness Analysis by By Application, 2016-2032
- Figure 5: Global Phosphorus Trichloride Market Revenue (US$ Mn) Market Share by By Sales Channelin 2022
- Figure 6: Global Phosphorus Trichloride Market Market Attractiveness Analysis by By Sales Channel, 2016-2032
- Figure 7: Global Phosphorus Trichloride Market Revenue (US$ Mn) Market Share by Region in 2022
- Figure 8: Global Phosphorus Trichloride Market Market Attractiveness Analysis by Region, 2016-2032
- Figure 9: Global Phosphorus Trichloride Market Market Revenue (US$ Mn) (2016-2032)
- Figure 10: Global Phosphorus Trichloride Market Market Revenue (US$ Mn) Comparison by Region (2016-2032)
- Figure 11: Global Phosphorus Trichloride Market Market Revenue (US$ Mn) Comparison by By Grade (2016-2032)
- Figure 12: Global Phosphorus Trichloride Market Market Revenue (US$ Mn) Comparison by By Application (2016-2032)
- Figure 13: Global Phosphorus Trichloride Market Market Revenue (US$ Mn) Comparison by By Sales Channel (2016-2032)
- Figure 14: Global Phosphorus Trichloride Market Market Y-o-Y Growth Rate Comparison by Region (2016-2032)
- Figure 15: Global Phosphorus Trichloride Market Market Y-o-Y Growth Rate Comparison by By Grade (2016-2032)
- Figure 16: Global Phosphorus Trichloride Market Market Y-o-Y Growth Rate Comparison by By Application (2016-2032)
- Figure 17: Global Phosphorus Trichloride Market Market Y-o-Y Growth Rate Comparison by By Sales Channel (2016-2032)
- Figure 18: Global Phosphorus Trichloride Market Market Share Comparison by Region (2016-2032)
- Figure 19: Global Phosphorus Trichloride Market Market Share Comparison by By Grade (2016-2032)
- Figure 20: Global Phosphorus Trichloride Market Market Share Comparison by By Application (2016-2032)
- Figure 21: Global Phosphorus Trichloride Market Market Share Comparison by By Sales Channel (2016-2032)
- Figure 22: North America Phosphorus Trichloride Market Revenue (US$ Mn) Market Share by By Gradein 2022
- Figure 23: North America Phosphorus Trichloride Market Market Attractiveness Analysis by By Grade, 2016-2032
- Figure 24: North America Phosphorus Trichloride Market Revenue (US$ Mn) Market Share by By Applicationin 2022
- Figure 25: North America Phosphorus Trichloride Market Market Attractiveness Analysis by By Application, 2016-2032
- Figure 26: North America Phosphorus Trichloride Market Revenue (US$ Mn) Market Share by By Sales Channelin 2022
- Figure 27: North America Phosphorus Trichloride Market Market Attractiveness Analysis by By Sales Channel, 2016-2032
- Figure 28: North America Phosphorus Trichloride Market Revenue (US$ Mn) Market Share by Country in 2022
- Figure 29: North America Phosphorus Trichloride Market Market Attractiveness Analysis by Country, 2016-2032
- Figure 30: North America Phosphorus Trichloride Market Market Revenue (US$ Mn) (2016-2032)
- Figure 31: North America Phosphorus Trichloride Market Market Revenue (US$ Mn) Comparison by Country (2016-2032)
- Figure 32: North America Phosphorus Trichloride Market Market Revenue (US$ Mn) Comparison by By Grade (2016-2032)
- Figure 33: North America Phosphorus Trichloride Market Market Revenue (US$ Mn) Comparison by By Application (2016-2032)
- Figure 34: North America Phosphorus Trichloride Market Market Revenue (US$ Mn) Comparison by By Sales Channel (2016-2032)
- Figure 35: North America Phosphorus Trichloride Market Market Y-o-Y Growth Rate Comparison by Country (2016-2032)
- Figure 36: North America Phosphorus Trichloride Market Market Y-o-Y Growth Rate Comparison by By Grade (2016-2032)
- Figure 37: North America Phosphorus Trichloride Market Market Y-o-Y Growth Rate Comparison by By Application (2016-2032)
- Figure 38: North America Phosphorus Trichloride Market Market Y-o-Y Growth Rate Comparison by By Sales Channel (2016-2032)
- Figure 39: North America Phosphorus Trichloride Market Market Share Comparison by Country (2016-2032)
- Figure 40: North America Phosphorus Trichloride Market Market Share Comparison by By Grade (2016-2032)
- Figure 41: North America Phosphorus Trichloride Market Market Share Comparison by By Application (2016-2032)
- Figure 42: North America Phosphorus Trichloride Market Market Share Comparison by By Sales Channel (2016-2032)
- Figure 43: Western Europe Phosphorus Trichloride Market Revenue (US$ Mn) Market Share by By Gradein 2022
- Figure 44: Western Europe Phosphorus Trichloride Market Market Attractiveness Analysis by By Grade, 2016-2032
- Figure 45: Western Europe Phosphorus Trichloride Market Revenue (US$ Mn) Market Share by By Applicationin 2022
- Figure 46: Western Europe Phosphorus Trichloride Market Market Attractiveness Analysis by By Application, 2016-2032
- Figure 47: Western Europe Phosphorus Trichloride Market Revenue (US$ Mn) Market Share by By Sales Channelin 2022
- Figure 48: Western Europe Phosphorus Trichloride Market Market Attractiveness Analysis by By Sales Channel, 2016-2032
- Figure 49: Western Europe Phosphorus Trichloride Market Revenue (US$ Mn) Market Share by Country in 2022
- Figure 50: Western Europe Phosphorus Trichloride Market Market Attractiveness Analysis by Country, 2016-2032
- Figure 51: Western Europe Phosphorus Trichloride Market Market Revenue (US$ Mn) (2016-2032)
- Figure 52: Western Europe Phosphorus Trichloride Market Market Revenue (US$ Mn) Comparison by Country (2016-2032)
- Figure 53: Western Europe Phosphorus Trichloride Market Market Revenue (US$ Mn) Comparison by By Grade (2016-2032)
- Figure 54: Western Europe Phosphorus Trichloride Market Market Revenue (US$ Mn) Comparison by By Application (2016-2032)
- Figure 55: Western Europe Phosphorus Trichloride Market Market Revenue (US$ Mn) Comparison by By Sales Channel (2016-2032)
- Figure 56: Western Europe Phosphorus Trichloride Market Market Y-o-Y Growth Rate Comparison by Country (2016-2032)
- Figure 57: Western Europe Phosphorus Trichloride Market Market Y-o-Y Growth Rate Comparison by By Grade (2016-2032)
- Figure 58: Western Europe Phosphorus Trichloride Market Market Y-o-Y Growth Rate Comparison by By Application (2016-2032)
- Figure 59: Western Europe Phosphorus Trichloride Market Market Y-o-Y Growth Rate Comparison by By Sales Channel (2016-2032)
- Figure 60: Western Europe Phosphorus Trichloride Market Market Share Comparison by Country (2016-2032)
- Figure 61: Western Europe Phosphorus Trichloride Market Market Share Comparison by By Grade (2016-2032)
- Figure 62: Western Europe Phosphorus Trichloride Market Market Share Comparison by By Application (2016-2032)
- Figure 63: Western Europe Phosphorus Trichloride Market Market Share Comparison by By Sales Channel (2016-2032)
- Figure 64: Eastern Europe Phosphorus Trichloride Market Revenue (US$ Mn) Market Share by By Gradein 2022
- Figure 65: Eastern Europe Phosphorus Trichloride Market Market Attractiveness Analysis by By Grade, 2016-2032
- Figure 66: Eastern Europe Phosphorus Trichloride Market Revenue (US$ Mn) Market Share by By Applicationin 2022
- Figure 67: Eastern Europe Phosphorus Trichloride Market Market Attractiveness Analysis by By Application, 2016-2032
- Figure 68: Eastern Europe Phosphorus Trichloride Market Revenue (US$ Mn) Market Share by By Sales Channelin 2022
- Figure 69: Eastern Europe Phosphorus Trichloride Market Market Attractiveness Analysis by By Sales Channel, 2016-2032
- Figure 70: Eastern Europe Phosphorus Trichloride Market Revenue (US$ Mn) Market Share by Country in 2022
- Figure 71: Eastern Europe Phosphorus Trichloride Market Market Attractiveness Analysis by Country, 2016-2032
- Figure 72: Eastern Europe Phosphorus Trichloride Market Market Revenue (US$ Mn) (2016-2032)
- Figure 73: Eastern Europe Phosphorus Trichloride Market Market Revenue (US$ Mn) Comparison by Country (2016-2032)
- Figure 74: Eastern Europe Phosphorus Trichloride Market Market Revenue (US$ Mn) Comparison by By Grade (2016-2032)
- Figure 75: Eastern Europe Phosphorus Trichloride Market Market Revenue (US$ Mn) Comparison by By Application (2016-2032)
- Figure 76: Eastern Europe Phosphorus Trichloride Market Market Revenue (US$ Mn) Comparison by By Sales Channel (2016-2032)
- Figure 77: Eastern Europe Phosphorus Trichloride Market Market Y-o-Y Growth Rate Comparison by Country (2016-2032)
- Figure 78: Eastern Europe Phosphorus Trichloride Market Market Y-o-Y Growth Rate Comparison by By Grade (2016-2032)
- Figure 79: Eastern Europe Phosphorus Trichloride Market Market Y-o-Y Growth Rate Comparison by By Application (2016-2032)
- Figure 80: Eastern Europe Phosphorus Trichloride Market Market Y-o-Y Growth Rate Comparison by By Sales Channel (2016-2032)
- Figure 81: Eastern Europe Phosphorus Trichloride Market Market Share Comparison by Country (2016-2032)
- Figure 82: Eastern Europe Phosphorus Trichloride Market Market Share Comparison by By Grade (2016-2032)
- Figure 83: Eastern Europe Phosphorus Trichloride Market Market Share Comparison by By Application (2016-2032)
- Figure 84: Eastern Europe Phosphorus Trichloride Market Market Share Comparison by By Sales Channel (2016-2032)
- Figure 85: APAC Phosphorus Trichloride Market Revenue (US$ Mn) Market Share by By Gradein 2022
- Figure 86: APAC Phosphorus Trichloride Market Market Attractiveness Analysis by By Grade, 2016-2032
- Figure 87: APAC Phosphorus Trichloride Market Revenue (US$ Mn) Market Share by By Applicationin 2022
- Figure 88: APAC Phosphorus Trichloride Market Market Attractiveness Analysis by By Application, 2016-2032
- Figure 89: APAC Phosphorus Trichloride Market Revenue (US$ Mn) Market Share by By Sales Channelin 2022
- Figure 90: APAC Phosphorus Trichloride Market Market Attractiveness Analysis by By Sales Channel, 2016-2032
- Figure 91: APAC Phosphorus Trichloride Market Revenue (US$ Mn) Market Share by Country in 2022
- Figure 92: APAC Phosphorus Trichloride Market Market Attractiveness Analysis by Country, 2016-2032
- Figure 93: APAC Phosphorus Trichloride Market Market Revenue (US$ Mn) (2016-2032)
- Figure 94: APAC Phosphorus Trichloride Market Market Revenue (US$ Mn) Comparison by Country (2016-2032)
- Figure 95: APAC Phosphorus Trichloride Market Market Revenue (US$ Mn) Comparison by By Grade (2016-2032)
- Figure 96: APAC Phosphorus Trichloride Market Market Revenue (US$ Mn) Comparison by By Application (2016-2032)
- Figure 97: APAC Phosphorus Trichloride Market Market Revenue (US$ Mn) Comparison by By Sales Channel (2016-2032)
- Figure 98: APAC Phosphorus Trichloride Market Market Y-o-Y Growth Rate Comparison by Country (2016-2032)
- Figure 99: APAC Phosphorus Trichloride Market Market Y-o-Y Growth Rate Comparison by By Grade (2016-2032)
- Figure 100: APAC Phosphorus Trichloride Market Market Y-o-Y Growth Rate Comparison by By Application (2016-2032)
- Figure 101: APAC Phosphorus Trichloride Market Market Y-o-Y Growth Rate Comparison by By Sales Channel (2016-2032)
- Figure 102: APAC Phosphorus Trichloride Market Market Share Comparison by Country (2016-2032)
- Figure 103: APAC Phosphorus Trichloride Market Market Share Comparison by By Grade (2016-2032)
- Figure 104: APAC Phosphorus Trichloride Market Market Share Comparison by By Application (2016-2032)
- Figure 105: APAC Phosphorus Trichloride Market Market Share Comparison by By Sales Channel (2016-2032)
- Figure 106: Latin America Phosphorus Trichloride Market Revenue (US$ Mn) Market Share by By Gradein 2022
- Figure 107: Latin America Phosphorus Trichloride Market Market Attractiveness Analysis by By Grade, 2016-2032
- Figure 108: Latin America Phosphorus Trichloride Market Revenue (US$ Mn) Market Share by By Applicationin 2022
- Figure 109: Latin America Phosphorus Trichloride Market Market Attractiveness Analysis by By Application, 2016-2032
- Figure 110: Latin America Phosphorus Trichloride Market Revenue (US$ Mn) Market Share by By Sales Channelin 2022
- Figure 111: Latin America Phosphorus Trichloride Market Market Attractiveness Analysis by By Sales Channel, 2016-2032
- Figure 112: Latin America Phosphorus Trichloride Market Revenue (US$ Mn) Market Share by Country in 2022
- Figure 113: Latin America Phosphorus Trichloride Market Market Attractiveness Analysis by Country, 2016-2032
- Figure 114: Latin America Phosphorus Trichloride Market Market Revenue (US$ Mn) (2016-2032)
- Figure 115: Latin America Phosphorus Trichloride Market Market Revenue (US$ Mn) Comparison by Country (2016-2032)
- Figure 116: Latin America Phosphorus Trichloride Market Market Revenue (US$ Mn) Comparison by By Grade (2016-2032)
- Figure 117: Latin America Phosphorus Trichloride Market Market Revenue (US$ Mn) Comparison by By Application (2016-2032)
- Figure 118: Latin America Phosphorus Trichloride Market Market Revenue (US$ Mn) Comparison by By Sales Channel (2016-2032)
- Figure 119: Latin America Phosphorus Trichloride Market Market Y-o-Y Growth Rate Comparison by Country (2016-2032)
- Figure 120: Latin America Phosphorus Trichloride Market Market Y-o-Y Growth Rate Comparison by By Grade (2016-2032)
- Figure 121: Latin America Phosphorus Trichloride Market Market Y-o-Y Growth Rate Comparison by By Application (2016-2032)
- Figure 122: Latin America Phosphorus Trichloride Market Market Y-o-Y Growth Rate Comparison by By Sales Channel (2016-2032)
- Figure 123: Latin America Phosphorus Trichloride Market Market Share Comparison by Country (2016-2032)
- Figure 124: Latin America Phosphorus Trichloride Market Market Share Comparison by By Grade (2016-2032)
- Figure 125: Latin America Phosphorus Trichloride Market Market Share Comparison by By Application (2016-2032)
- Figure 126: Latin America Phosphorus Trichloride Market Market Share Comparison by By Sales Channel (2016-2032)
- Figure 127: Middle East & Africa Phosphorus Trichloride Market Revenue (US$ Mn) Market Share by By Gradein 2022
- Figure 128: Middle East & Africa Phosphorus Trichloride Market Market Attractiveness Analysis by By Grade, 2016-2032
- Figure 129: Middle East & Africa Phosphorus Trichloride Market Revenue (US$ Mn) Market Share by By Applicationin 2022
- Figure 130: Middle East & Africa Phosphorus Trichloride Market Market Attractiveness Analysis by By Application, 2016-2032
- Figure 131: Middle East & Africa Phosphorus Trichloride Market Revenue (US$ Mn) Market Share by By Sales Channelin 2022
- Figure 132: Middle East & Africa Phosphorus Trichloride Market Market Attractiveness Analysis by By Sales Channel, 2016-2032
- Figure 133: Middle East & Africa Phosphorus Trichloride Market Revenue (US$ Mn) Market Share by Country in 2022
- Figure 134: Middle East & Africa Phosphorus Trichloride Market Market Attractiveness Analysis by Country, 2016-2032
- Figure 135: Middle East & Africa Phosphorus Trichloride Market Market Revenue (US$ Mn) (2016-2032)
- Figure 136: Middle East & Africa Phosphorus Trichloride Market Market Revenue (US$ Mn) Comparison by Country (2016-2032)
- Figure 137: Middle East & Africa Phosphorus Trichloride Market Market Revenue (US$ Mn) Comparison by By Grade (2016-2032)
- Figure 138: Middle East & Africa Phosphorus Trichloride Market Market Revenue (US$ Mn) Comparison by By Application (2016-2032)
- Figure 139: Middle East & Africa Phosphorus Trichloride Market Market Revenue (US$ Mn) Comparison by By Sales Channel (2016-2032)
- Figure 140: Middle East & Africa Phosphorus Trichloride Market Market Y-o-Y Growth Rate Comparison by Country (2016-2032)
- Figure 141: Middle East & Africa Phosphorus Trichloride Market Market Y-o-Y Growth Rate Comparison by By Grade (2016-2032)
- Figure 142: Middle East & Africa Phosphorus Trichloride Market Market Y-o-Y Growth Rate Comparison by By Application (2016-2032)
- Figure 143: Middle East & Africa Phosphorus Trichloride Market Market Y-o-Y Growth Rate Comparison by By Sales Channel (2016-2032)
- Figure 144: Middle East & Africa Phosphorus Trichloride Market Market Share Comparison by Country (2016-2032)
- Figure 145: Middle East & Africa Phosphorus Trichloride Market Market Share Comparison by By Grade (2016-2032)
- Figure 146: Middle East & Africa Phosphorus Trichloride Market Market Share Comparison by By Application (2016-2032)
- Figure 147: Middle East & Africa Phosphorus Trichloride Market Market Share Comparison by By Sales Channel (2016-2032)
"
- List of Tables
- "
- Table 1: Global Phosphorus Trichloride Market Market Comparison by By Grade (2016-2032)
- Table 2: Global Phosphorus Trichloride Market Market Comparison by By Application (2016-2032)
- Table 3: Global Phosphorus Trichloride Market Market Comparison by By Sales Channel (2016-2032)
- Table 4: Global Phosphorus Trichloride Market Revenue (US$ Mn) Comparison by Region (2016-2032)
- Table 5: Global Phosphorus Trichloride Market Market Revenue (US$ Mn) (2016-2032)
- Table 6: Global Phosphorus Trichloride Market Market Revenue (US$ Mn) Comparison by Region (2016-2032)
- Table 7: Global Phosphorus Trichloride Market Market Revenue (US$ Mn) Comparison by By Grade (2016-2032)
- Table 8: Global Phosphorus Trichloride Market Market Revenue (US$ Mn) Comparison by By Application (2016-2032)
- Table 9: Global Phosphorus Trichloride Market Market Revenue (US$ Mn) Comparison by By Sales Channel (2016-2032)
- Table 10: Global Phosphorus Trichloride Market Market Y-o-Y Growth Rate Comparison by Region (2016-2032)
- Table 11: Global Phosphorus Trichloride Market Market Y-o-Y Growth Rate Comparison by By Grade (2016-2032)
- Table 12: Global Phosphorus Trichloride Market Market Y-o-Y Growth Rate Comparison by By Application (2016-2032)
- Table 13: Global Phosphorus Trichloride Market Market Y-o-Y Growth Rate Comparison by By Sales Channel (2016-2032)
- Table 14: Global Phosphorus Trichloride Market Market Share Comparison by Region (2016-2032)
- Table 15: Global Phosphorus Trichloride Market Market Share Comparison by By Grade (2016-2032)
- Table 16: Global Phosphorus Trichloride Market Market Share Comparison by By Application (2016-2032)
- Table 17: Global Phosphorus Trichloride Market Market Share Comparison by By Sales Channel (2016-2032)
- Table 18: North America Phosphorus Trichloride Market Market Comparison by By Application (2016-2032)
- Table 19: North America Phosphorus Trichloride Market Market Comparison by By Sales Channel (2016-2032)
- Table 20: North America Phosphorus Trichloride Market Revenue (US$ Mn) Comparison by Country (2016-2032)
- Table 21: North America Phosphorus Trichloride Market Market Revenue (US$ Mn) (2016-2032)
- Table 22: North America Phosphorus Trichloride Market Market Revenue (US$ Mn) Comparison by Country (2016-2032)
- Table 23: North America Phosphorus Trichloride Market Market Revenue (US$ Mn) Comparison by By Grade (2016-2032)
- Table 24: North America Phosphorus Trichloride Market Market Revenue (US$ Mn) Comparison by By Application (2016-2032)
- Table 25: North America Phosphorus Trichloride Market Market Revenue (US$ Mn) Comparison by By Sales Channel (2016-2032)
- Table 26: North America Phosphorus Trichloride Market Market Y-o-Y Growth Rate Comparison by Country (2016-2032)
- Table 27: North America Phosphorus Trichloride Market Market Y-o-Y Growth Rate Comparison by By Grade (2016-2032)
- Table 28: North America Phosphorus Trichloride Market Market Y-o-Y Growth Rate Comparison by By Application (2016-2032)
- Table 29: North America Phosphorus Trichloride Market Market Y-o-Y Growth Rate Comparison by By Sales Channel (2016-2032)
- Table 30: North America Phosphorus Trichloride Market Market Share Comparison by Country (2016-2032)
- Table 31: North America Phosphorus Trichloride Market Market Share Comparison by By Grade (2016-2032)
- Table 32: North America Phosphorus Trichloride Market Market Share Comparison by By Application (2016-2032)
- Table 33: North America Phosphorus Trichloride Market Market Share Comparison by By Sales Channel (2016-2032)
- Table 34: Western Europe Phosphorus Trichloride Market Market Comparison by By Grade (2016-2032)
- Table 35: Western Europe Phosphorus Trichloride Market Market Comparison by By Application (2016-2032)
- Table 36: Western Europe Phosphorus Trichloride Market Market Comparison by By Sales Channel (2016-2032)
- Table 37: Western Europe Phosphorus Trichloride Market Revenue (US$ Mn) Comparison by Country (2016-2032)
- Table 38: Western Europe Phosphorus Trichloride Market Market Revenue (US$ Mn) (2016-2032)
- Table 39: Western Europe Phosphorus Trichloride Market Market Revenue (US$ Mn) Comparison by Country (2016-2032)
- Table 40: Western Europe Phosphorus Trichloride Market Market Revenue (US$ Mn) Comparison by By Grade (2016-2032)
- Table 41: Western Europe Phosphorus Trichloride Market Market Revenue (US$ Mn) Comparison by By Application (2016-2032)
- Table 42: Western Europe Phosphorus Trichloride Market Market Revenue (US$ Mn) Comparison by By Sales Channel (2016-2032)
- Table 43: Western Europe Phosphorus Trichloride Market Market Y-o-Y Growth Rate Comparison by Country (2016-2032)
- Table 44: Western Europe Phosphorus Trichloride Market Market Y-o-Y Growth Rate Comparison by By Grade (2016-2032)
- Table 45: Western Europe Phosphorus Trichloride Market Market Y-o-Y Growth Rate Comparison by By Application (2016-2032)
- Table 46: Western Europe Phosphorus Trichloride Market Market Y-o-Y Growth Rate Comparison by By Sales Channel (2016-2032)
- Table 47: Western Europe Phosphorus Trichloride Market Market Share Comparison by Country (2016-2032)
- Table 48: Western Europe Phosphorus Trichloride Market Market Share Comparison by By Grade (2016-2032)
- Table 49: Western Europe Phosphorus Trichloride Market Market Share Comparison by By Application (2016-2032)
- Table 50: Western Europe Phosphorus Trichloride Market Market Share Comparison by By Sales Channel (2016-2032)
- Table 51: Eastern Europe Phosphorus Trichloride Market Market Comparison by By Grade (2016-2032)
- Table 52: Eastern Europe Phosphorus Trichloride Market Market Comparison by By Application (2016-2032)
- Table 53: Eastern Europe Phosphorus Trichloride Market Market Comparison by By Sales Channel (2016-2032)
- Table 54: Eastern Europe Phosphorus Trichloride Market Revenue (US$ Mn) Comparison by Country (2016-2032)
- Table 55: Eastern Europe Phosphorus Trichloride Market Market Revenue (US$ Mn) (2016-2032)
- Table 56: Eastern Europe Phosphorus Trichloride Market Market Revenue (US$ Mn) Comparison by Country (2016-2032)
- Table 57: Eastern Europe Phosphorus Trichloride Market Market Revenue (US$ Mn) Comparison by By Grade (2016-2032)
- Table 58: Eastern Europe Phosphorus Trichloride Market Market Revenue (US$ Mn) Comparison by By Application (2016-2032)
- Table 59: Eastern Europe Phosphorus Trichloride Market Market Revenue (US$ Mn) Comparison by By Sales Channel (2016-2032)
- Table 60: Eastern Europe Phosphorus Trichloride Market Market Y-o-Y Growth Rate Comparison by Country (2016-2032)
- Table 61: Eastern Europe Phosphorus Trichloride Market Market Y-o-Y Growth Rate Comparison by By Grade (2016-2032)
- Table 62: Eastern Europe Phosphorus Trichloride Market Market Y-o-Y Growth Rate Comparison by By Application (2016-2032)
- Table 63: Eastern Europe Phosphorus Trichloride Market Market Y-o-Y Growth Rate Comparison by By Sales Channel (2016-2032)
- Table 64: Eastern Europe Phosphorus Trichloride Market Market Share Comparison by Country (2016-2032)
- Table 65: Eastern Europe Phosphorus Trichloride Market Market Share Comparison by By Grade (2016-2032)
- Table 66: Eastern Europe Phosphorus Trichloride Market Market Share Comparison by By Application (2016-2032)
- Table 67: Eastern Europe Phosphorus Trichloride Market Market Share Comparison by By Sales Channel (2016-2032)
- Table 68: APAC Phosphorus Trichloride Market Market Comparison by By Grade (2016-2032)
- Table 69: APAC Phosphorus Trichloride Market Market Comparison by By Application (2016-2032)
- Table 70: APAC Phosphorus Trichloride Market Market Comparison by By Sales Channel (2016-2032)
- Table 71: APAC Phosphorus Trichloride Market Revenue (US$ Mn) Comparison by Country (2016-2032)
- Table 72: APAC Phosphorus Trichloride Market Market Revenue (US$ Mn) (2016-2032)
- Table 73: APAC Phosphorus Trichloride Market Market Revenue (US$ Mn) Comparison by Country (2016-2032)
- Table 74: APAC Phosphorus Trichloride Market Market Revenue (US$ Mn) Comparison by By Grade (2016-2032)
- Table 75: APAC Phosphorus Trichloride Market Market Revenue (US$ Mn) Comparison by By Application (2016-2032)
- Table 76: APAC Phosphorus Trichloride Market Market Revenue (US$ Mn) Comparison by By Sales Channel (2016-2032)
- Table 77: APAC Phosphorus Trichloride Market Market Y-o-Y Growth Rate Comparison by Country (2016-2032)
- Table 78: APAC Phosphorus Trichloride Market Market Y-o-Y Growth Rate Comparison by By Grade (2016-2032)
- Table 79: APAC Phosphorus Trichloride Market Market Y-o-Y Growth Rate Comparison by By Application (2016-2032)
- Table 80: APAC Phosphorus Trichloride Market Market Y-o-Y Growth Rate Comparison by By Sales Channel (2016-2032)
- Table 81: APAC Phosphorus Trichloride Market Market Share Comparison by Country (2016-2032)
- Table 82: APAC Phosphorus Trichloride Market Market Share Comparison by By Grade (2016-2032)
- Table 83: APAC Phosphorus Trichloride Market Market Share Comparison by By Application (2016-2032)
- Table 84: APAC Phosphorus Trichloride Market Market Share Comparison by By Sales Channel (2016-2032)
- Table 85: Latin America Phosphorus Trichloride Market Market Comparison by By Grade (2016-2032)
- Table 86: Latin America Phosphorus Trichloride Market Market Comparison by By Application (2016-2032)
- Table 87: Latin America Phosphorus Trichloride Market Market Comparison by By Sales Channel (2016-2032)
- Table 88: Latin America Phosphorus Trichloride Market Revenue (US$ Mn) Comparison by Country (2016-2032)
- Table 89: Latin America Phosphorus Trichloride Market Market Revenue (US$ Mn) (2016-2032)
- Table 90: Latin America Phosphorus Trichloride Market Market Revenue (US$ Mn) Comparison by Country (2016-2032)
- Table 91: Latin America Phosphorus Trichloride Market Market Revenue (US$ Mn) Comparison by By Grade (2016-2032)
- Table 92: Latin America Phosphorus Trichloride Market Market Revenue (US$ Mn) Comparison by By Application (2016-2032)
- Table 93: Latin America Phosphorus Trichloride Market Market Revenue (US$ Mn) Comparison by By Sales Channel (2016-2032)
- Table 94: Latin America Phosphorus Trichloride Market Market Y-o-Y Growth Rate Comparison by Country (2016-2032)
- Table 95: Latin America Phosphorus Trichloride Market Market Y-o-Y Growth Rate Comparison by By Grade (2016-2032)
- Table 96: Latin America Phosphorus Trichloride Market Market Y-o-Y Growth Rate Comparison by By Application (2016-2032)
- Table 97: Latin America Phosphorus Trichloride Market Market Y-o-Y Growth Rate Comparison by By Sales Channel (2016-2032)
- Table 98: Latin America Phosphorus Trichloride Market Market Share Comparison by Country (2016-2032)
- Table 99: Latin America Phosphorus Trichloride Market Market Share Comparison by By Grade (2016-2032)
- Table 100: Latin America Phosphorus Trichloride Market Market Share Comparison by By Application (2016-2032)
- Table 101: Latin America Phosphorus Trichloride Market Market Share Comparison by By Sales Channel (2016-2032)
- Table 102: Middle East & Africa Phosphorus Trichloride Market Market Comparison by By Grade (2016-2032)
- Table 103: Middle East & Africa Phosphorus Trichloride Market Market Comparison by By Application (2016-2032)
- Table 104: Middle East & Africa Phosphorus Trichloride Market Market Comparison by By Sales Channel (2016-2032)
- Table 105: Middle East & Africa Phosphorus Trichloride Market Revenue (US$ Mn) Comparison by Country (2016-2032)
- Table 106: Middle East & Africa Phosphorus Trichloride Market Market Revenue (US$ Mn) (2016-2032)
- Table 107: Middle East & Africa Phosphorus Trichloride Market Market Revenue (US$ Mn) Comparison by Country (2016-2032)
- Table 108: Middle East & Africa Phosphorus Trichloride Market Market Revenue (US$ Mn) Comparison by By Grade (2016-2032)
- Table 109: Middle East & Africa Phosphorus Trichloride Market Market Revenue (US$ Mn) Comparison by By Application (2016-2032)
- Table 110: Middle East & Africa Phosphorus Trichloride Market Market Revenue (US$ Mn) Comparison by By Sales Channel (2016-2032)
- Table 111: Middle East & Africa Phosphorus Trichloride Market Market Y-o-Y Growth Rate Comparison by Country (2016-2032)
- Table 112: Middle East & Africa Phosphorus Trichloride Market Market Y-o-Y Growth Rate Comparison by By Grade (2016-2032)
- Table 113: Middle East & Africa Phosphorus Trichloride Market Market Y-o-Y Growth Rate Comparison by By Application (2016-2032)
- Table 114: Middle East & Africa Phosphorus Trichloride Market Market Y-o-Y Growth Rate Comparison by By Sales Channel (2016-2032)
- Table 115: Middle East & Africa Phosphorus Trichloride Market Market Share Comparison by Country (2016-2032)
- Table 116: Middle East & Africa Phosphorus Trichloride Market Market Share Comparison by By Grade (2016-2032)
- Table 117: Middle East & Africa Phosphorus Trichloride Market Market Share Comparison by By Application (2016-2032)
- Table 118: Middle East & Africa Phosphorus Trichloride Market Market Share Comparison by By Sales Channel (2016-2032)
- 1. Executive Summary
-
- Bayer AG (U.S.)
- Solvay (Belgium)
- Merck KGaA (Germany)
- LAXNESS (Germany)
- PCC Rokita Spólka Akcyjna (Poland)
- ICL (Israel)
- SANDHYA GROUP (India)
- Parchem fine & specialty chemicals (U.S.)
- Xuzhou Jianping Chemical Co., Ltd (China)
- Anhui Guangxin Agrochemical Co., Ltd. (China)
- Excel Industries Ltd (India)
- Shandong Futong Chemical Co., Ltd. (China)
- Henan Qingshuiyuan Technology Co., Ltd. (China)
- Jiangsu Tianyuan Chemical Co., Ltd. (China)
- Jiangsu Yoke Technology Co., Ltd. (China)
- Shandong Yangmei Hengtong Chemical Co., Ltd. (China)
- UPL Limited (India)
- Xuzhou Jianping Chemical Co., Ltd. (China)
- Xuzhou Yongli Fine Chemical Co., Ltd. (China)
- Zhejiang Xinan Chemical Industrial Group Co., Ltd, (China)
Our Clients


View Our Licence Options
