PET Preforms Market By Neck Size (25mm, 28mm, 29mm & 30mm) By Application (Carbonated Drinks, Bottled Water, Other Drinks, Edible Oil, Food Items) and Region - Global Forecast to 2026
-
4854
-
March 2023
-
157
-
-
This report was compiled by Correspondence Linkedin | Detailed Market research Methodology Our methodology involves a mix of primary research, including interviews with leading mental health experts, and secondary research from reputable medical journals and databases. View Detailed Methodology Page
-
Global PET Preforms Market Overview
The global PET preforms market was valued at US$ 17.6 Bn in 2017 and is expected to register a CAGR of over 5%.
PET preforms are made of PET (polyethylene terephthalate), one of the most common thermoplastic polymer resin in polyester family. PET preforms are molded products of certain shape, form, and size, which are then further blown to make bottles in blowing machines. A key characteristic of PET preform is that the products (or bottles) made from it are durable, sturdy, transparent, smooth and sparkly, which can attract buyer’s attention. PET bottles are gaining preference owing to its lightweight, good resistance, durable, non-breakable, cost-effective, and reusable nature.
Global PET performs Dynamics:
Rapid development of the fast-moving consumer goods (FMCG) industry is one of the key driver expected to boost growth of the global PET preforms market. Rinsing consumption of FMCG such as carbonated drinks, juices, cosmetics, and food items, has led to an increased usage of PET preforms for the production of PET bottles, jars, tubes, and others. In addition, availability of PET bottles in all sizes, and other properties such as convenience to carry, hygienic, ease of handling, durable, and lightweight, is increasing adoption of PET bottles globally, thus driving consumption of PET preforms globally.
[report-coverage short_image=" https://marketresearch.biz/wp-content/uploads/2018/07/global-pet-preforms-market-segment.jpg"]
PET preforms and bottles are also extremely cost-effective, durable, and safe. PET bottles cost less than US$ 0.60 for a 500 ml bottle or lesser when bought in bulk. Food & beverages, and personal care product companies find PET bottles highly cost-effective, as compared to other alternatives such as glass, and aluminum bottles. Also, PET bottles or plastic is considered most environmentally friendly among glass, and aluminum, and is more durable compared to other options. In the PET preforms market, Generative AI in FMCG optimizes production processes for efficiency and sustainability.
Rise in tourism is also expected to boost consumption of bottled water, which is another factor expected to boost growth of the global PET preforms market over the forecast period. In addition, increasing incidence of waterborne diseases such as typhoid, hepatitis A, diarrhea, and others, and increasing health awareness are fueling consumption of bottled mineral water.
PET bottles have rose to prominence, and are continuously replacing glass bottles, which are susceptible to breakage and are not user-friendly. These factors are driving growth of the global PET preforms market over the forecast period.
PET preforms are the most efficient and economical way of producing PET bottles of various shapes, and sizes
Market Analysis by Neck Size:

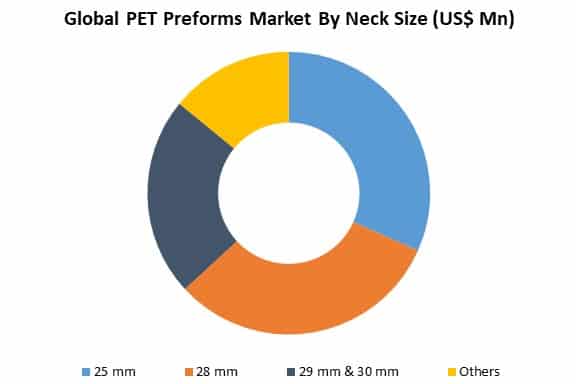
On the basis of neck size, 28mm segment is expected to contribute major revenue share in the global PET preforms market, and witness highest CAGR of over 5%, in terms of revenue over the forecast period. This can be attributed increasing usage of 28mm neck size for making bottles for carbonated drinks, mineral water, juices, and edible oil. 28mm segment accounts for highest share among the other segments, owing to its wide application across soft drinks, food items, cosmetics, and others
Among the neck size segment, market share of 25mm, and others segment in the global PET preforms market is projected to increase steadily during the forecast period (2016–2026). This can be attributed to increasing consumption of liquor, cosmetics, and other food items.
Market Analysis by Application:

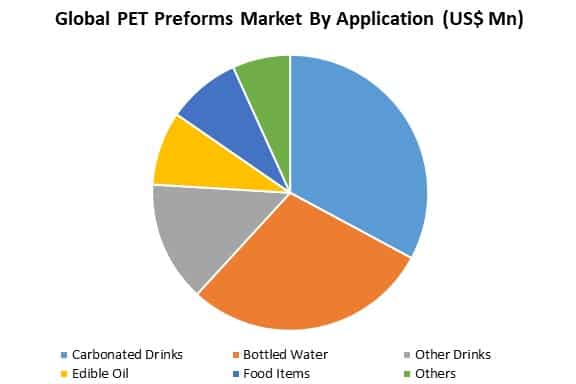
Among application segment, the market share of carbonated drinks segment in the global PET preforms market is projected to increase considerably during the forecast period (2016–2026). This can be attributed to increasing consumption of carbonated soft drinks, owing to increasing young population, and increasing disposable income of consumers.
The market shares of bottled water, and others segment in the global PET preforms market is expected to register a steady growth during the forecast period (2016–2026), owing to increasing processed food & beverages demand, coupled with rising population.
Though, carbonated drinks market has seen a decline in matured markets such as North America, and Europe, due to consumers looking to cut down their sugar and calorie intake, these soft drinks are still highly popular in emerging markets. Increasing demand for carbonated drinks with low sugar content, and regular product launches is expected to provide sustainable growth of carbonated drinks, which is expected to drive growth of the carbonated drinks segment in the global PET preforms market.
Market Analysis by Region:

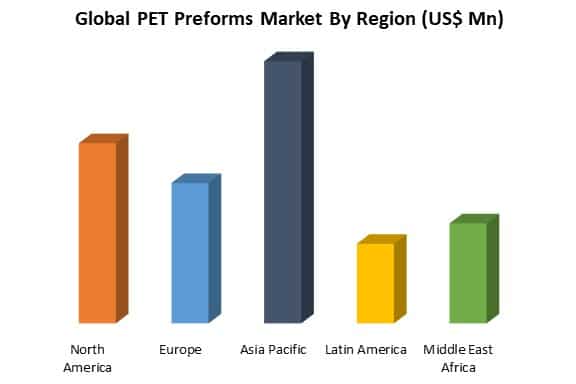
Asia Pacific is the fastest growing region in PET preforms market. There is high demand for PET preforms in emerging economies such as China, Japan, and India. China is the largest market for PET preform in this region. Due to the growing population in economies such as India and China, the increasing demand for carbonated soft drinks, purified water, food, beverages, and pharmaceutical liquor, the demand for plastic products and plastic industries, fueling the PET preform market in this region.
Revenue from the PET preforms market in Asia Pacific is projected to register highest CAGR of over 6% between 2016 and 2026. The market in Asia Pacific also accounted for highest revenue contribution in the global PET preforms market in 2016, and is expected to continue its dominance over the forecast period. China is estimated to be the largest market for PET preforms in Asia Pacific, followed by Japan and India. China is projected to be the fastest-growing market for PET preforms in this region. Increasing young population, with high disposable income has increased consumption of carbonated soft drinks, liquor, personal care products, food products, and others. The health conscious population has led to an increased consumption of juices, and non-carbonated drinks.
The market in North America accounted for revenue share of XX% in the global PET preforms market in 2016, and was valued at US$ 3,955.2 Mn, and is projected reach US$ XXXX.X Mn in 2026 at a CAGR of over 5%. Rising demand for carbonated soft drinks, bottled mineral water, juices, liquor, and personal care products is expected to drive the the PET preforms market growth in the region. Increasing consumption of carbonated soft drinks in the region is driven by consumers across all ages, owing increasing disposable income, to the indulgence, and taste associated with products. In addition, the US is the leading market for consumption of soft drinks, and is expected to remain dominant over the forecast period.
Europe shows steady growth in plastic industry market from last five years. Germany, Italy, France, and the UK are the major economies in producing plastic products in this region. The alcoholic beverages market in Europe is one of the largest in the world, and is estimated to be valued at approximately US$ 87.5 billion in 2017, which is also expected to drive growth of the PET preforms market in the region.
Market Segmentation of Global PET Preforms Market:
Segmentation by neck size:
- 25mm
- 28mm
- 29mm & 30mm
- Others
Segmentation by application:
- Carbonated Drinks
- Bottled Water
- Other Drinks
- Edible Oil
- Food Items
- Others
Segmentation by region:
- North America
- Europe
- Asia Pacific
- Latin America
- Middle East & Africa
-
1.0 Chapter 1
- 1.1 Preface
- 1.2 Assumptions
- 1.3 Abbreviations
2.0 Chapter 2
- 2.1 Introduction
- 2.1.1 Product Information
- 2.1.2 Manufacturing Process Analysis
- 2.1.3 Flow Chart of PET Preforms
3.0 Chapter 3
- 3.1 Report Description
- 3.1.1 Market Definition and Scope
- 3.1.2 Opportunity Map Analysis
- 3.2 Executive Summary
- 3.2.1 Market Snapshot, By Neck Size
- 3.2.2 Market Snapshot, By Application
- 3.2.3 Market Snapshot, By Region
- 3.2.4 Opportunity Map Analysis
4.0 Chapter 4
- 4.1 Global PET Preform Market Dynamics
- 4.1.1 Drivers
- 4.1.2 Restraints
- 4.1.3 Opportunities
- 4.1.4 Drivers and Restrains Impact Analysis
- 4.1.5 Regulatory Scenario
- 4.1.6 Supply Chain Analysis
- 4.1.7 PEST Analysis
- 4.1.8 Porter’s Five Forces Analysis
- 4.1.9 Global Consumption of Plastic Bottles
- 4.1.10 Highest Soft Drinks Consumption by Country
- 4.1.11 Consumption of Bottled Water by Country
5.0 Chapter 5
- 5.0.1 Global PET Preform Market Analysis, by Neck Size
- 5.0.2 Overview
- 5.0.3 Segment Trends
- 5.0.4 Market Share and Forecast, and Y-o-Y Growth, 2016–2026, (US$ Mn)
- 5.0.5 Various neck sizes and its applications
- 5.1 25mm
- 5.1.1 Overview
- 5.1.2 Market Share and Forecast, and Y-o-Y Growth, 2016–2026, (US$ Mn)
- 5.2 28mm
- 5.2.1 Overview
- 5.2.2 Market Share and Forecast, and Y-o-Y Growth, 2016–2026, (US$ Mn)
- 5.3 29mm & 30mm
- 5.3.1 Overview
- 5.3.2 Market Share and Forecast, and Y-o-Y Growth, 2016–2026, (US$ Mn)
- 5.4 Others
- 5.4.1 Overview
- 5.4.2 Market Share and Forecast, and Y-o-Y Growth, 2016–2026, (US$ Mn)
6.0 Chapter 6
- 6.0.1 Global PET Preform Market Analysis, by Application
- 6.0.2 Overview
- 6.0.3 Segment Trends
- 6.0.4 Market Share and Forecast, and Y-o-Y Growth, 2016–2026, (US$ Mn)
- 6.1 Carbonated Drinks
- 6.1.1 Overview
- 6.1.2 Market Share and Forecast, and Y-o-Y Growth, 2016–2026, (US$ Mn)
- 6.2 Bottled Water
- 6.2.1 Overview
- 6.2.2 Market Share and Forecast, and Y-o-Y Growth, 2016–2026, (US$ Mn)
- 6.3 Other Drinks
- 6.3.1 Overview
- 6.3.2 Market Share and Forecast, and Y-o-Y Growth, 2016–2026, (US$ Mn)
- 6.4 Edible Oil
- 6.4.1 Overview
- 6.4.2 Market Share and Forecast, and Y-o-Y Growth, 2016–2026, (US$ Mn)
- 6.5 Food Items
- 6.5.1 Overview
- 6.5.2 Market Share and Forecast, and Y-o-Y Growth, 2016–2026, (US$ Mn)
- 6.6 Others
- 6.6.1 Overview
- 6.6.2 Market Share and Forecast, and Y-o-Y Growth, 2016–2026, (US$ Mn)
7.0 Chapter 7
- 7.0.1 Global PET Preform Market Analysis, by Region
- 7.0.2 Overview
- 7.0.3 Regional Trends
- 7.0.4 Market Share and Forecast, and Y-o-Y Growth, 2016–2026, (US$ Mn)
- 7.0.5 Market Attractiveness Index
- 7.1 North America
- 7.1.1 Overview
- 7.1.2 Country Trends
- 7.1.3 Market Share and Forecast, and Y-o-Y Growth, 2016–2026, (US$ Mn)
- 7.1.4 U.S
- 7.1.4.1 Market Value and Forecast, 2016–2026, (US$ Mn)
- 7.1.5 Canada
- 7.1.5.1 Market Value and Forecast, 2016–2026, (US$ Mn)
- 7.1.6 List of Vendors
- 7.1.7 North America Import – Export of PET Preforms
- 7.2 Europe
- 7.2.1 Overview
- 7.2.2 Country Trends
- 7.2.3 Market Share and Forecast, and Y-o-Y Growth, 2016–2026, (US$ Mn)
- 7.2.4 Germany
- 7.2.4.1 Market Value and Forecast, 2016–2026, (US$ Mn)
- 7.2.5 UK
- 7.2.5.1 Market Value and Forecast, 2016–2026, (US$ Mn)
- 7.2.6 France
- 7.2.6.1 Market Value and Forecast, 2016–2026, (US$ Mn)
- 7.2.7 Russia
- 7.2.7.1 Market Value and Forecast, 2016–2026, (US$ Mn)
- 7.2.8 Italy
- 7.2.8.1 Market Value and Forecast, 2016–2026, (US$ Mn)
- 7.2.9 Rest of Europe
- 7.2.9.1 Market Value and Forecast, 2016–2026, (US$ Mn)
- 7.2.10 List of Vendors
- 7.2.11 Europe Import – Export of PET Preforms
- 7.3. Asia Pacific
- 7.3.1 Overview
- 7.3.2 Country Trends
- 7.3.3 Market Share and Forecast, and Y-o-Y Growth, 2016–2026, (US$ Mn)
- 7.3.4 China
- 7.3.4.1 Market Value and Forecast, 2016–2026, (US$ Mn)
- 7.3.5 India
- 7.3.5.1 Market Value and Forecast, 2016–2026, (US$ Mn)
- 7.3.6 Japan
- 7.3.6.1 Market Value and Forecast, 2016–2026, (US$ Mn)
- 7.3.7 Australia
- 7.3.7.1 Market Value and Forecast, 2016–2026, (US$ Mn)
- 7.3.8 Rest of APAC
- 7.3.8.1 Market Value and Forecast, 2016–2026, (US$ Mn)
- 7.3.9 List of Vendors
- 7.3.10 Asia Pacific Import – Export of PET Preforms
- 7.4. Latin America
- 7.4.1 Overview
- 7.4.2 Country Trends
- 7.4.3 Market Share and Forecast, and Y-o-Y Growth, 2016–2026, (US$ Mn)
- 7.4.4 Brazil
- 7.4.4.1 Market Value and Forecast, 2016–2026, (US$ Mn)
- 7.4.5 Mexico
- 7.4.5.1 Market Value and Forecast, 2016–2026, (US$ Mn)
- 7.4.6 Rest of Latin America
- 7.4.6.1 Market Value and Forecast, 2016–2026, (US$ Mn)
- 7.4.7 List of Vendors
- 7.4.8 Latin America Import – Export of PET Preforms
- 7.5 Middle East & Africa
- 7.5.1 Overview
- 7.5.2 Country Trends
- 7.5.3 Market Share and Forecast, and Y-o-Y Growth, 2016–2026, (US$ Mn)
- 7.5.4 GCC
- 7.5.4.1 Market Value and Forecast, 2016–2026, (US$ Mn)
- 7.5.5 Israel
- 7.5.5.1 Market Value and Forecast, 2016–2026, (US$ Mn)
- 7.5.6 South Africa
- 7.5.6.1 Market Value and Forecast, 2016–2026, (US$ Mn)
- 7.5.7 Rest of Middle East & Africa
- 7.5.7.1 Market Value and Forecast, 2016–2026, (US$ Mn)
- 7.5.8 List of Vendors
- 7.5.9 Middle East & Africa Import – Export of PET Preforms
8.0 Chapter 8
- 8.0.1 Company Profiles
- 8.0.2 Heat Map Analysis
- 8.0.3 Competitive Analysis
- 8.1 Retal Industries LTD.
- 8.1.1 Company Overview
- 8.1.2 Product Portfolio
- 8.1.3 Financial Overview
- 8.1.4 Key Developments
- 8.1.5 SWOT Analysis
- 8.2 Plastipak Holdings, Inc.
- 8.2.1 Company Overview
- 8.2.2 Product Portfolio
- 8.2.3 Financial Overview
- 8.2.4 Key Developments
- 8.2.5 SWOT Analysis
- 8.3 RESILUX NV
- 8.3.1 Company Overview
- 8.3.2 Product Portfolio
- 8.3.3 Financial Overview
- 8.3.4 Key Developments
- 8.3.5 SWOT Analysis
- 8.4 Taiwan Hon Chuan Enterprise Co., Ltd.
- 8.4.1 Company Overview
- 8.4.2 Product Portfolio
- 8.4.3 Financial Overview
- 8.4.4 Key Developments
- 8.4.5 SWOT Analysis
- 8.5 Zhuhai Zhongfu Enterprise Co. Ltd.
- 8.5.1 Company Overview
- 8.5.2 Product Portfolio
- 8.5.3 Financial Overview
- 8.5.4 Key Developments
- 8.5.5 SWOT Analysis
- 8.6 Rawasy Al Khaleej Plastic Ind.
- 8.6.1 Company Overview
- 8.6.2 Product Portfolio
- 8.6.3 Financial Overview
- 8.6.4 Key Developments
- 8.6.5 SWOT Analysis
- 8.7 Societe Generale des Techniques
- 8.7.1 Company Overview
- 8.7.2 Product Portfolio
- 8.7.3 Financial Overview
- 8.7.4 Key Developments
- 8.7.5 SWOT Analysis
- 8.8 Indorama Ventures Public Company Limited
- 8.8.1 Company Overview
- 8.8.2 Product Portfolio
- 8.8.3 Financial Overview
- 8.8.4 Key Developments
- 8.8.5 SWOT Analysis
- 8.9 ALPLA Werke Alwin Lehner GmbH & Co KG
- 8.9.1 Company Overview
- 8.9.2 Product Portfolio
- 8.9.3 Financial Overview
- 8.9.4 Key Developments
- 8.9.5 SWOT Analysis
- 8.10 KOKSAN Pet Packaging Industry Co.
- 8.10.1 Company Overview
- 8.10.2 Product Portfolio
- 8.10.3 Financial Overview
- 8.10.4 Key Developments
- 8.10.5 SWOT Analysis
9.0 Chapter 9
- 9.1 Research Methodology
- 9.2 Disclaimer
- 9.3 About Us
-
- Retal Industries LTD.
- Plastipak Holdings, Inc.
- RESILUX NV
- Taiwan Hon Chuan Enterprise Co., Ltd.
- Zhuhai Zhongfu Enterprise Co. Ltd.
- Rawasy Al Khaleej Plastic Ind.
- Societe Generale des Techniques
- Indorama Ventures Public Company Limited
- ALPLA Werke Alwin Lehner GmbH & Co KG
- KOKSAN Pet Packaging Industry Co.


