Pet Food Ingredients Market By Source(Plant Derivatives, Animal Derivatives, Additives, Synthetic), By Form(Wet, Dry, Mixture), By Animal Type(Dog, Cat, Bird, Fish, Others), By Ingredient (Vegetables & Fruits, Meat & Meat products, Cereals, Fats), By Region And Companies - Industry Segment Outlook, Market Assessment, Competition Scenario, Trends, And Forecast 2023-2032
-
2393
-
May 2023
-
165
-


-
This report was compiled by Shreyas Rokade Shreyas Rokade is a seasoned Research Analyst with CMFE, bringing extensive expertise in market research and consulting, with a strong background in Chemical Engineering. Correspondence Team Lead-CMFE Linkedin | Detailed Market research Methodology Our methodology involves a mix of primary research, including interviews with leading mental health experts, and secondary research from reputable medical journals and databases. View Detailed Methodology Page
-
Quick Navigation
Report Overview
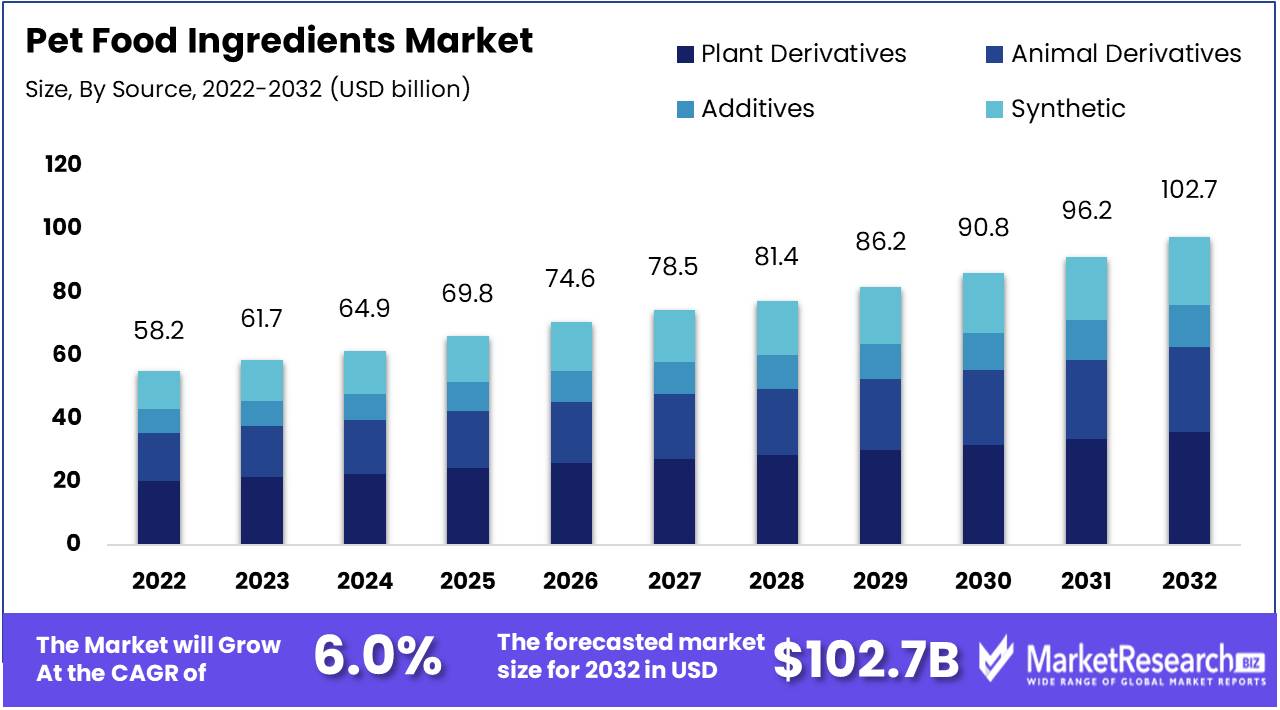
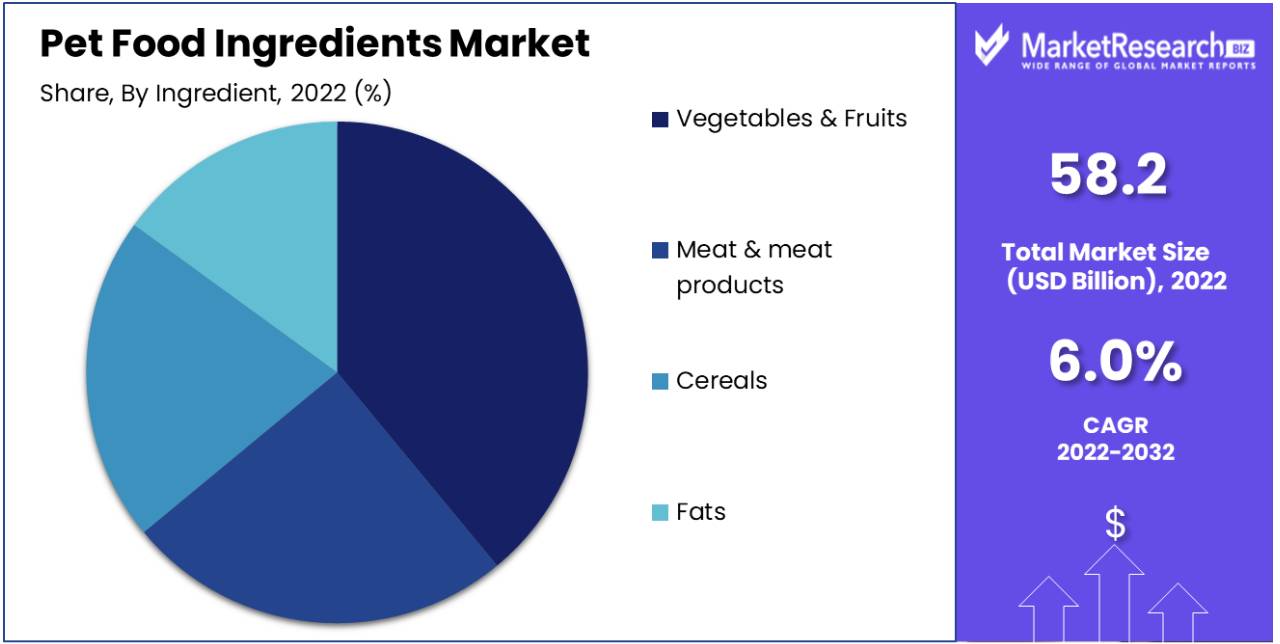
Pet Food Ingredients Market size is expected to be worth around USD 102.7 Bn by 2032 from USD 58.2 Bn in 2022, growing at a CAGR of 6% during the forecast period from 2023 to 2032.
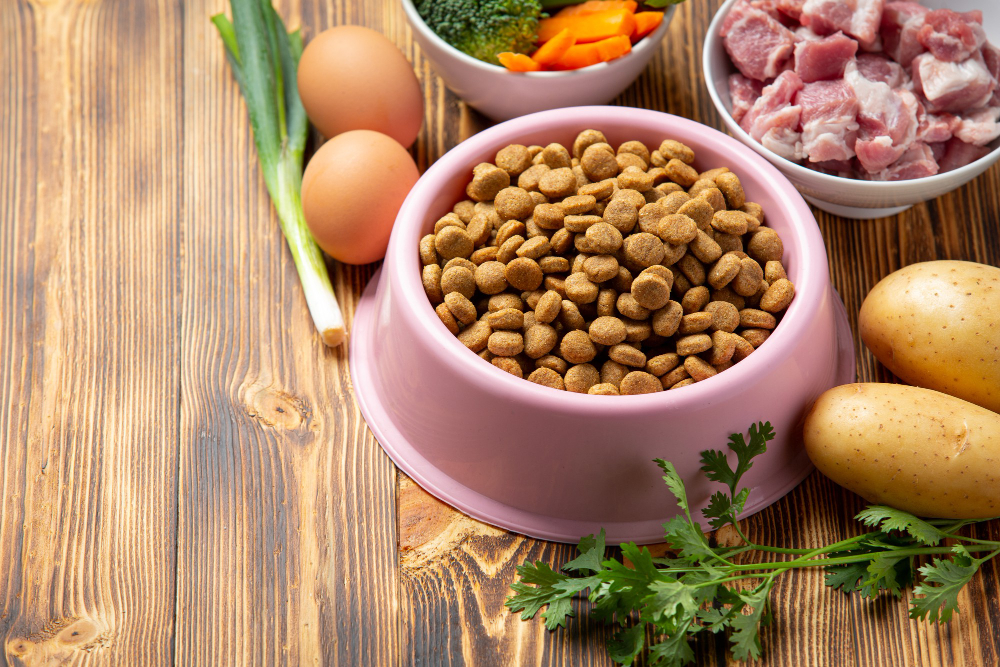
The pet food industry has witnessed remarkable growth in recent years, and its success is intrinsically linked to the quality and diversity of the pet food ingredient market. These ingredients play a pivotal role in ensuring the health, nutrition, and overall well-being of our beloved four-legged companions.
In the Pet Food Ingredients Market, the annual growth rate continues to surge, with pet adoption driving demand. The largest market share of this industry is dominated by essential components like amino acids and omega-6 fatty acids, ensuring the health of pets. These ingredients hold the fastest growth in the food ingredient market share, benefiting our beloved pet animals.
A noteworthy development came in June 2023, when DSM Nutritional Products, a Dutch company, announced plans for a new pre-mix animal food facility in Tonganoxie Business Park, offering competitive wages, even for entry-level positions, averaging $72,000 per year. This reflects the industry's commitment to quality and talent attraction.
These advancements align with consumer preferences for premium products and high-quality ingredients in pet food. Pet owners are increasingly seeking ingredients that promote the health and well-being of their pets. The investment in modern, state-of-the-art facilities reflects the industry's dedication to meeting these demands.
Moreover, in June 2023, Anchor Ingredient Co. began construction on a cutting-edge $40 million ingredient processing facility in Richmond, Indiana, strategically located at the heart of pet food manufacturing. This facility promises a steady supply of high-quality ingredients.
Such developments drive the pet food ingredient market by enhancing production capacity, improving supply chain efficiency, attracting skilled talent, meeting consumer demands for high-quality ingredients, and aligning with sustainability and ethical considerations. As a result, the pet food ingredient market is poised for continued growth and innovation.
Driving factors
Rising Pet Ownership
One of the primary driving forces behind the growth of the pet food ingredient market is the increasing number of pet owners worldwide. As more people choose to bring pets into their homes, the demand for pet food and related ingredients rises. This trend is fueled by factors such as changing lifestyles, urbanization, and the companionship that pets provide.
Growing Awareness of Pet Health and Nutrition
Pet owners are becoming increasingly conscious of their pets' health and well-being. This heightened awareness has led to a greater focus on the quality and nutritional value of pet edibles. Pet owners are more likely to seek out products with high-quality ingredients that cater to their pets' specific dietary needs, contributing to the growth of the pet food ingredient market.
Increasing Demand for Premium and Specialty Pet Food
The demand for premium and specialty pet meals is on the rise. Pet owners are willing to spend more on high-quality, nutritious, and specialized pet food products. This trend is driven by the desire to provide the best possible nutrition for pets and to address specific health concerns or dietary preferences. Manufacturers are responding by incorporating premium ingredients into their products.
Restraining Factors
High Cost of Raw Materials
The pet food ingredients market faces challenges due to the high cost of sourcing quality raw materials. Ingredients such as high-grade meat, fish, and specialty grains can be expensive to procure, impacting overall production costs.
Stringent Regulations
Stringent regulations and standards govern the pet food industry, which can act as a restraining factor. Compliance with these regulations can be costly and time-consuming for manufacturers, and any non-compliance can result in product recalls and legal issues.
Rising Demand for Sustainable and Ethical Ingredients
As consumer awareness about sustainability and ethical practices increases, there is a growing demand for pet food made from ingredients that are sourced responsibly. This demand puts pressure on manufacturers to invest in ethical sourcing and sustainable production processes, which can be expensive to implement.
Growing Popularity of Plant-Based Pet Food
The rising popularity of plant-based pet edibles is another factor that can restrain traditional pet meal ingredient markets. As more pet owners seek plant-based and vegetarian options for their pets, traditional ingredient suppliers may face challenges in adapting to this shift in consumer preferences.
By Source
Plant Derivatives is a dominant player in the pet food ingredients market. Plant-derived ingredients in pet meals are sourced from a variety of plants, such as peas, lentils, potatoes, and sweet potatoes. These ingredients are rich in essential nutrients, including protein, fiber, vitamins, and minerals, making them a viable and nutritious alternative to traditional animal-based ingredients.
One of the key advantages of plant-derived ingredients is their lower environmental footprint. Producing plant-based ingredients generally requires fewer resources and generates fewer greenhouse gas emissions compared to raising livestock for meat production. This aligns with the growing concern for sustainability among consumers and pet owners.
Additionally, the plant-based pet food ingredient market caters to the dietary needs of pets with specific health conditions, such as meal allergies or sensitivities. They can also be a suitable option for pet owners who follow vegetarian or vegan lifestyles and want to extend their dietary choices to their animal companions.
In the rapidly growing pet snack Ingredients business, the demand for Plant Derived Ingredients is on the rise, as pet owners increasingly seek healthier options. These ingredients not only cater to the pet meals segment but also serve as essential animal feed additives. Their inclusion enhances the maintenance and overall well-being of pets, aligning with the evolving preferences of the pet food sector.
By Form
The wet form type has emerged as a dominant player in the pet food ingredients market. Wet pet snack, often referred to as canned or moist edibles, is characterized by its high moisture content, typically around 70-80%. This form type offers several advantages that appeal to pet owners. Firstly, it is palatable and appetizing for pets, making it an excellent choice for picky eaters. The moisture content also helps maintain hydration in pets, which is particularly important for cats who may not drink enough water on their own.
Furthermore, wet pet food ingredients are often considered to be nutritionally balanced and easily digestible, making them suitable for pets with specific dietary requirements or sensitivities. It is also commonly used for senior pets or those with dental issues, as the soft texture is gentler on their teeth and gums.
In recent years, the premiumization trend in the pet food market has boosted the popularity of wet, as pet owners seek higher-quality and more specialized options for their beloved companions. Manufacturers have responded by introducing a wide range of flavors, ingredients, and formulations, catering to diverse tastes and dietary needs.
By Animal Type
The pet food ingredients market is witnessing significant growth, with dogs dominating the animal type segment. This trend can be attributed to the ever-increasing number of households worldwide that own dogs as pets. Dogs are not only beloved companions but also an integral part of many families, which has driven the demand for high-quality food items.
The preference for premium and organic food products has fueled the growth of this market. Pet owners are increasingly conscious of their furry friend's health and well-being, leading them to seek pet food made from wholesome ingredients. This shift has prompted manufacturers to focus on incorporating premium ingredients such as real meat, vegetables, and grains into their products.
In the Pet Food Ingredients industry, there is a growing demand for quality, with a particular focus on organic ingredients. Key developments are centered around meat & meat products, aiming to provide nutritious options for pet care. By-product meal utilization is a challenge that the industry is addressing to enhance product quality.
Furthermore, the rise in pet humanization, where pets are treated as family members, has resulted in a greater emphasis on pet nutrition. This, in turn, has led to the development of specialized diets catering to dogs' unique dietary requirements based on their age, breed, and activity level.
The pet food Ingredients industry offers several benefits of animal feed, driving segment growth. It's witnessing the fastest growth due to rising demand for high-quality animal products. Ingredients like animal digest play a pivotal role in enhancing pet snack quality, further fueling the adoption of pets.
By Ingredient
The pet food industry has seen a significant shift towards healthier and more natural ingredients, with vegetables and fruits dominating the ingredient list in many pet food products. This trend is driven by pet owners who are increasingly concerned about the well-being and longevity of their furry companions.
Vegetable oil and fruits are rich sources of essential vitamins, minerals, and antioxidants, making them an ideal choice for pet food formulations. They offer a wide range of health benefits, including improved digestion, a strengthened immune system, and enhanced coat and skin health. Moreover, they contribute to the overall taste and palatability of pet food, making it more appealing to pets.
This shift towards vegetable oil and fruit-based ingredients aligns with the growing demand for organic and natural pet food. Pet owners are becoming more discerning, seeking products that mimic their own dietary choices, which often include fresh produce. As a result, pet food manufacturers are incorporating ingredients like sweet potatoes, peas, blueberries, and spinach into their formulations.
Key Market Segments
By Source
- Plant Derivatives
- Animal Derivatives
- Additives
- Synthetic
By Form
- Wet
- Dry
- Mixture
By Animal Type
- Dog
- Cat
- Bird
- Fish
- Others
By Ingredient
- Vegetables and Fruits
- Meat and meat products
- Cereals
- Fats
Growth Opportunity
Rising Pet Ownership
The increasing trend of pet ownership worldwide is a significant driver for the pet food ingredients market. More people are adopting pets, leading to a larger customer base for pet food products. This trend is fueled by factors like companionship, stress relief, and a desire for a healthier lifestyle.
Increasing Focus on Pet Health and Nutrition
Pet owners are becoming increasingly conscious of their pets' health and well-being. They are willing to invest in high-quality pet food products that offer nutritional benefits and address specific health concerns. This growing awareness presents an opportunity for the pet food ingredients market to develop innovative, health-focused products.
Growing Popularity of Functional Pet Food
Functional pet foods, which offer benefits beyond basic nutrition, are gaining traction. These may include ingredients that support joint health, digestive health, weight management, and more. As pet owners seek products that cater to their pet's specific needs, there is a substantial growth potential for functional pet food ingredients.
Shift Towards Sustainable and Ethical Pet Food Products
Consumers are increasingly concerned about the environmental and ethical aspects of the products they purchase, including pet food. There is a growing demand for sustainable and ethically sourced pet nutrition ingredients. Companies that incorporate eco-friendly and ethical practices into their supply chain can tap into this market niche.
Plant-Based Pet Food Ingredients
The popularity of plant-based diets is not limited to human nutrition; it extends to pet food as well. As more people adopt vegetarian or vegan lifestyles, they seek plant-based alternatives for their pets. This trend offers a promising opportunity for the development and marketing of plant-based pet nutrition ingredients.
Latest Trends
Rising Demand for High-Quality, Natural Ingredients
Pet owners are increasingly seeking pet food products that contain high-quality and natural ingredients. They are concerned about the health and well-being of their pets and are willing to invest in premium pet edibles made from real, recognizable ingredients. The market is witnessing a shift towards grain-free, gluten-free products, and organic pet snack options, reflecting a desire for clean labels and transparency in ingredient sourcing. Natural food antioxidants and preservatives like tocopherols and rosemary extract are preferred over artificial additives.
Growing Interest in Functional Ingredients
Functional ingredients in pet edibles are becoming more popular as pet owners look for products that offer specific health benefits to their pets. Ingredients such as probiotics, prebiotics, and fiber are being incorporated to support digestive health and improve nutrient absorption. Omega-3 fatty acids, glucosamine, and chondroitin are added for joint health and overall mobility, catering to the aging pet population.
Increasing Demand for Novel Protein Sources
Pet food manufacturers are exploring novel protein sources to meet the demand for variety and address potential allergens in traditional protein sources like chicken and beef. Alternative proteins such as lamb, venison, and bison, and even plant-based proteins like peas and lentils are gaining popularity. Exotic protein sources like kangaroo, rabbit, and insect-based proteins are also emerging as options for environmentally-conscious pet owners.
Insect Protein
Insect protein is gaining traction as a sustainable and highly nutritious alternative protein source for pet food. Insects, such as black soldier fly larvae and crickets, are rich in protein, vitamins, and minerals, making them an attractive choice for pet food formulations. The environmental benefits of insect farming, such as reduced greenhouse gas emissions and less water usage compared to traditional livestock, align with the sustainability trend.
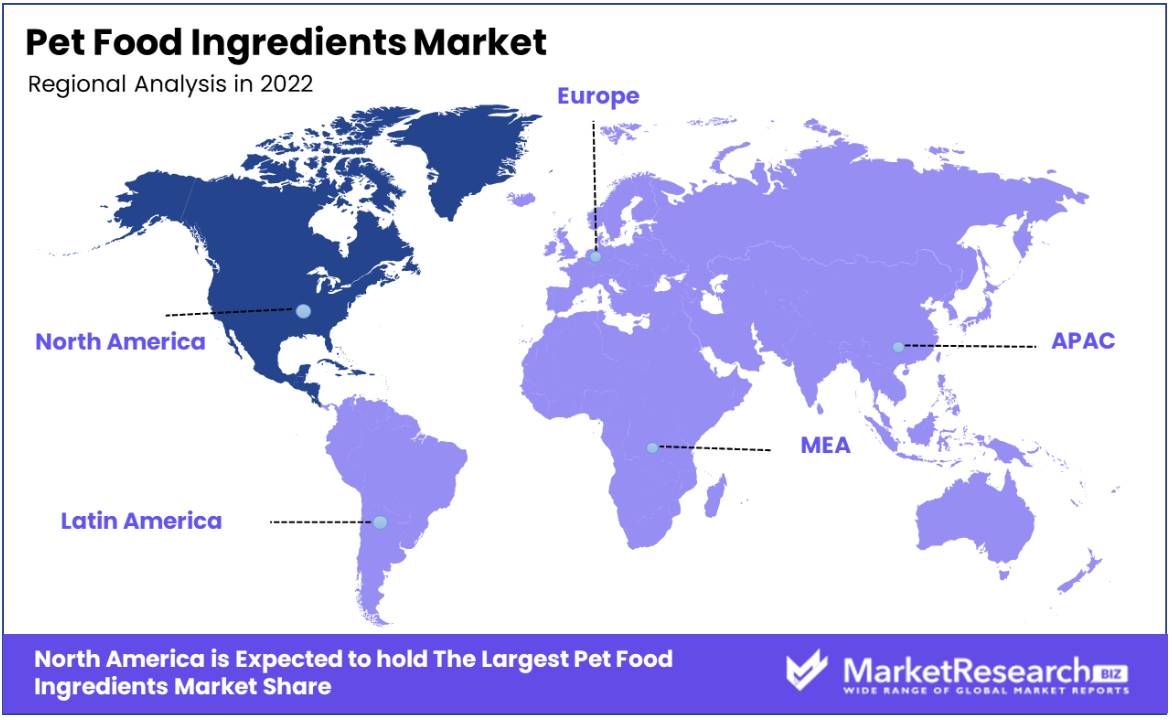
Regional Analysis
North America is indeed a dominant region in the global Pet Food Ingredients Market, and its prominence can be attributed to several key factors.
United States: The United States is the largest market for pet food ingredients in North America and one of the largest globally. Several factors contribute to its dominance, including a high pet ownership rate, a strong pet humanization trend, and a focus on premium and specialty pet nutrition. The U.S. is home to many major factors of pet food manufacturers, both large corporations and smaller, niche players. These companies constantly innovate to meet the evolving demands of pet owners, driving the demand for diverse pet food ingredients.
Canada: Canada is another significant player in the North American pet food ingredients market. It has a thriving pet food industry, with a focus on quality and natural ingredients. The Canadian market benefits from a strong economy and a population that values pet health and wellness, leading to a growing demand for high-quality pet food ingredients.
Mexico: Mexico's pet food market is rapidly expanding due to a rising middle-class population and increasing urbanization. The country has seen a shift in consumer preferences towards premium pet food products, including those with high-quality ingredients. This has led to a growing demand for pet nutrition ingredients in Mexico, making it an essential part of the North American market.
North America, as a whole, has stringent regulatory standards for pet food ingredients. The U.S. Food and Drug Administration (FDA) and the Canadian Food Inspection Agency (CFIA) have specific regulations and guidelines in place to ensure the safety and quality of pet nutrition ingredients. These regulations help maintain consumer trust in the market and ensure the highest standards are met.
The North American region is known for its research and development efforts in the pet food industry. This includes the development of novel ingredients, such as alternative proteins (insect-based, plant-based), functional ingredients, and formulations that cater to specific pet health needs. These innovations drive market growth and keep North America at the forefront of the industry.
Key Regions and Countries
North America
- US
- Canada
- Mexico
Western Europe
- Germany
- France
- The UK
- Spain
- Italy
- Portugal
- Ireland
- Austria
- Switzerland
- Benelux
- Nordic
- Rest of Western Europe
Eastern Europe
- Russia
- Poland
- The Czech Republic
- Greece
- Rest of Eastern Europe
APAC
- China
- Japan
- South Korea
- India
- Australia and New Zealand
- Indonesia
- Malaysia
- Philippines
- Singapore
- Thailand
- Vietnam
- Rest of APAC
Latin America
- Brazil
- Colombia
- Chile
- Argentina
- Costa Rica
- Rest of Latin America
Middle East and Africa
- Algeria
- Egypt
- Israel
- Kuwait
- Nigeria
- Saudi Arabia
- South Africa
- Turkey
- United Arab Emirates
- Rest of MEA
Key Players Analysis
BASF SE stands out as a major prominent player. BASF SE is a global chemical company that provides a wide range of ingredients for pet food production. With a strong commitment to sustainability and innovation, BASF SE has positioned itself as a leader in the development of high-quality and nutritionally balanced ingredients for pet food, catering to the growing demand for premium pet products.
Koninklijke DSM N.V. is another significant player in the pet food ingredients industry. Known for its expertise in nutrition and health, DSM offers a variety of ingredients designed to enhance the nutritional value of pet food products. Their focus on research and development has allowed them to develop innovative solutions that meet the evolving dietary needs of pets, making them a prominent choice for pet food manufacturers.
Colgate-Palmolive Company, although more renowned for its oral care and consumer products, has also made a notable player presence in the pet food ingredients industry. Through its subsidiary Hill's Pet Nutrition, Colgate-Palmolive produces high-quality pet food ingredients that emphasize animal health and well-being. Leveraging its extensive consumer reach and brand recognition, Colgate-Palmolive has successfully established itself as a trusted name in the pet food industry. There are some major players are as follows:
Top Key Players in the Pet Food Ingredients Market
- BASF SE
- Koninklijke DSM N.V.
- Colgate-Palmolive Company
- Archer Daniels Midland Company
- Agrolimen SA
- Nutriara Alimentos Ltd.
- The Nutro Company
- Darling Ingredients Inc.
- Marshall Ingredient
- The Scoular Company.
- FoodSafe Technologies
- Alltech
- Symrise
- Elanco
- DuPont Nutrition and Health
- Kemin Industries, Inc.
- Omega Protein Corporation
- Lallemand Inc.
- Balchem Inc.
- Cargill Inc.
Recent Development
- In Sept 2023, Nutrideer Launches NZ Deer Milk Supplements: Nutrideer, a pet supplement company from New Zealand, launches a new range of products containing NZ Deer Milk as a novel ingredient for pet nutrition, highlighting it as a remarkable discovery.
- In July 2023, Nor-Feed announced plans to invest in expanding its factory's production capacities in Anjou, western France. This expansion is driven by the company's increasing export sales and the need to meet the rising demand for its products in Europe. Nor-Feed aims to continue serving its pet edibles-producing partners with documented and standardized botanicals.
- In July 2023, Purina PetCare Contribution: Purina PetCare is highlighted for its contributions to Nestle in H1 2023.
- In June 2023, Anchor Ingredient Co. broke ground on its new $40 million ingredient processing facility in Richmond, Indiana. The facility will be located in the Midwest Industrial Park, at the heart of pet manufacturing.
- In June 2023, A Dutch company, DSM Nutritional Products, revealed plans to build a new pre-mix animal edibles facility in Tonganoxie Business Park. The proposed ingredient plant for the pet food industry is expected to pay an average wage of $72,000 per year, even for entry-level positions.
- In May 2023, Ÿnsect, a mealworm nutrition supplier, introduced a new pet food ingredients brand called Sprÿng.
Report Scope
Report Features Description Market Value (2022) USD 58.2 Bn Forecast Revenue (2032) USD 102.7 Bn CAGR (2023-2032) 6.0% Base Year for Estimation 2022 Historic Period 2016-2022 Forecast Period 2023-2032 Report Coverage Revenue Forecast, Market Dynamics, COVID-19 Impact, Competitive Landscape, Recent Developments Segments Covered By Source (Plant Derivatives, Animal Derivatives, Additives, Synthetic), By Form (Wet, Dry, Mixture), By Animal Type (Dog, Cat, Bird, Fish, Others), By Ingredient (Vegetables and Fruits, Meat and Meat products, Cereals, Fats) Regional Analysis North America – The US, Canada, Mexico, Latin America – Brazil, Colombia, Chile, Argentina, Costa Rica, and Rest of Latin America, Eastern Europe – Russia, Poland, The Czech Republic, Greece, Rest of Eastern Europe, Western Europe – Germany, France, The UK, Spain, Italy, Portugal, Ireland, Austria, Switzerland, Benelux, Nordic, Rest of Western Europe, APAC – China, Japan, South Korea, India, Australia and New Zealand, Indonesia, Malaysia, Philippines, Singapore, Thailand, Vietnam, Rest of APAC, Middle East and Africa – Algeria, Egypt, Israel, Kuwait, Nigeria, Saudi Arabia, South Africa, Turkey, United Arab Emirates, Rest of MEA Competitive Landscape BASF SE, Koninklijke DSM N.V., Colgate-Palmolive Company, Archer Daniels Midland Company, Agrolimen SA, Nutriara Alimentos Ltd., The Nutro Company, Darling Ingredients Inc., Marshall Ingredient, The Scoular Company., FoodSafe Technologies, Alltech, Symrise, Elanco, DuPont Nutrition and Health, Kemin Industries, Inc., Omega Protein Corporation, allemand Inc., Balchem Inc., Cargill Inc. Customization Scope Customization for segments, region/country-level will be provided. Moreover, additional customization can be done based on the requirements. Purchase Options We have three licenses to opt for: Single User License, Multi-User License (Up to 5 Users), Corporate Use License (Unlimited User and Printable PDF) -
- 1. Executive Summary
- 1.1. Definition
- 1.2. Taxonomy
- 1.3. Research Scope
- 1.4. Key Analysis
- 1.5. Key Findings by Major Segments
- 1.6. Top strategies by Major Players
- 2. Global Pet Food Ingredients Market Overview
- 2.1. Pet Food Ingredients Market Dynamics
- 2.1.1. Drivers
- 2.1.2. Opportunities
- 2.1.3. Restraints
- 2.1.4. Challenges
- 2.2. Macro-economic Factors
- 2.3. Regulatory Framework
- 2.4. Market Investment Feasibility Index
- 2.5. PEST Analysis
- 2.6. PORTER’S Five Force Analysis
- 2.7. Drivers & Restraints Impact Analysis
- 2.8. Industry Chain Analysis
- 2.9. Cost Structure Analysis
- 2.10. Marketing Strategy
- 2.11. Russia-Ukraine War Impact Analysis
- 2.12. Opportunity Map Analysis
- 2.13. Market Competition Scenario Analysis
- 2.14. Product Life Cycle Analysis
- 2.15. Opportunity Orbits
- 2.16. Manufacturer Intensity Map
- 2.17. Major Companies sales by Value & Volume
- 2.1. Pet Food Ingredients Market Dynamics
- 3. Global Pet Food Ingredients Market Analysis, Opportunity and Forecast, 2016-2032
- 3.1. Global Pet Food Ingredients Market Analysis, 2016-2021
- 3.2. Global Pet Food Ingredients Market Opportunity and Forecast, 2023-2032
- 3.3. Global Pet Food Ingredients Market Analysis, Opportunity and Forecast, By Source, 2016-2032
- 3.3.1. Global Pet Food Ingredients Market Analysis by Source: Introduction
- 3.3.2. Market Size Absolute $ Opportunity Analysis and Forecast, By Source, 2016-2032
- 3.3.3. Plant Derivatives
- 3.3.4. Animal Derivatives
- 3.4. Global Pet Food Ingredients Market Analysis, Opportunity and Forecast, By Form, 2016-2032
- 3.4.1. Global Pet Food Ingredients Market Analysis by Form: Introduction
- 3.4.2. Market Size Absolute $ Opportunity Analysis and Forecast, By Form, 2016-2032
- 3.4.3. Wet
- 3.4.4. Dry
- 3.4.5. Mixture
- 3.5. Global Pet Food Ingredients Market Analysis, Opportunity and Forecast, By Animal Type, 2016-2032
- 3.5.1. Global Pet Food Ingredients Market Analysis by Animal Type: Introduction
- 3.5.2. Market Size Absolute $ Opportunity Analysis and Forecast, By Animal Type, 2016-2032
- 3.5.3. Dog
- 3.5.4. Cat
- 3.5.5. Bird
- 3.5.6. Fish
- 3.5.7. Others
- 3.6. Global Pet Food Ingredients Market Analysis, Opportunity and Forecast, By Ingredient, 2016-2032
- 3.6.1. Global Pet Food Ingredients Market Analysis by Ingredient: Introduction
- 3.6.2. Market Size Absolute $ Opportunity Analysis and Forecast, By Ingredient, 2016-2032
- 3.6.3. Vegetables & Fruits
- 3.6.4. Meat & meat products
- 3.6.5. Cereals
- 3.6.6. Fats
- 4. North America Pet Food Ingredients Market Analysis, Opportunity and Forecast, 2016-2032
- 4.1. North America Pet Food Ingredients Market Analysis, 2016-2021
- 4.2. North America Pet Food Ingredients Market Opportunity and Forecast, 2023-2032
- 4.3. North America Pet Food Ingredients Market Analysis, Opportunity and Forecast, By Source, 2016-2032
- 4.3.1. North America Pet Food Ingredients Market Analysis by Source: Introduction
- 4.3.2. Market Size Absolute $ Opportunity Analysis and Forecast, By Source, 2016-2032
- 4.3.3. Plant Derivatives
- 4.3.4. Animal Derivatives
- 4.4. North America Pet Food Ingredients Market Analysis, Opportunity and Forecast, By Form, 2016-2032
- 4.4.1. North America Pet Food Ingredients Market Analysis by Form: Introduction
- 4.4.2. Market Size Absolute $ Opportunity Analysis and Forecast, By Form, 2016-2032
- 4.4.3. Wet
- 4.4.4. Dry
- 4.4.5. Mixture
- 4.5. North America Pet Food Ingredients Market Analysis, Opportunity and Forecast, By Animal Type, 2016-2032
- 4.5.1. North America Pet Food Ingredients Market Analysis by Animal Type: Introduction
- 4.5.2. Market Size Absolute $ Opportunity Analysis and Forecast, By Animal Type, 2016-2032
- 4.5.3. Dog
- 4.5.4. Cat
- 4.5.5. Bird
- 4.5.6. Fish
- 4.5.7. Others
- 4.6. North America Pet Food Ingredients Market Analysis, Opportunity and Forecast, By Ingredient, 2016-2032
- 4.6.1. North America Pet Food Ingredients Market Analysis by Ingredient: Introduction
- 4.6.2. Market Size Absolute $ Opportunity Analysis and Forecast, By Ingredient, 2016-2032
- 4.6.3. Vegetables & Fruits
- 4.6.4. Meat & meat products
- 4.6.5. Cereals
- 4.6.6. Fats
- 4.7. North America Pet Food Ingredients Market Analysis, Opportunity and Forecast, By Country , 2016-2032
- 4.7.1. North America Pet Food Ingredients Market Analysis by Country : Introduction
- 4.7.2. Market Size Absolute $ Opportunity Analysis and Forecast, Country , 2016-2032
- 4.7.2.1. The US
- 4.7.2.2. Canada
- 4.7.2.3. Mexico
- 5. Western Europe Pet Food Ingredients Market Analysis, Opportunity and Forecast, 2016-2032
- 5.1. Western Europe Pet Food Ingredients Market Analysis, 2016-2021
- 5.2. Western Europe Pet Food Ingredients Market Opportunity and Forecast, 2023-2032
- 5.3. Western Europe Pet Food Ingredients Market Analysis, Opportunity and Forecast, By Source, 2016-2032
- 5.3.1. Western Europe Pet Food Ingredients Market Analysis by Source: Introduction
- 5.3.2. Market Size Absolute $ Opportunity Analysis and Forecast, By Source, 2016-2032
- 5.3.3. Plant Derivatives
- 5.3.4. Animal Derivatives
- 5.4. Western Europe Pet Food Ingredients Market Analysis, Opportunity and Forecast, By Form, 2016-2032
- 5.4.1. Western Europe Pet Food Ingredients Market Analysis by Form: Introduction
- 5.4.2. Market Size Absolute $ Opportunity Analysis and Forecast, By Form, 2016-2032
- 5.4.3. Wet
- 5.4.4. Dry
- 5.4.5. Mixture
- 5.5. Western Europe Pet Food Ingredients Market Analysis, Opportunity and Forecast, By Animal Type, 2016-2032
- 5.5.1. Western Europe Pet Food Ingredients Market Analysis by Animal Type: Introduction
- 5.5.2. Market Size Absolute $ Opportunity Analysis and Forecast, By Animal Type, 2016-2032
- 5.5.3. Dog
- 5.5.4. Cat
- 5.5.5. Bird
- 5.5.6. Fish
- 5.5.7. Others
- 5.6. Western Europe Pet Food Ingredients Market Analysis, Opportunity and Forecast, By Ingredient, 2016-2032
- 5.6.1. Western Europe Pet Food Ingredients Market Analysis by Ingredient: Introduction
- 5.6.2. Market Size Absolute $ Opportunity Analysis and Forecast, By Ingredient, 2016-2032
- 5.6.3. Vegetables & Fruits
- 5.6.4. Meat & meat products
- 5.6.5. Cereals
- 5.6.6. Fats
- 5.7. Western Europe Pet Food Ingredients Market Analysis, Opportunity and Forecast, By Country , 2016-2032
- 5.7.1. Western Europe Pet Food Ingredients Market Analysis by Country : Introduction
- 5.7.2. Market Size Absolute $ Opportunity Analysis and Forecast, Country , 2016-2032
- 5.7.2.1. Germany
- 5.7.2.2. France
- 5.7.2.3. The UK
- 5.7.2.4. Spain
- 5.7.2.5. Italy
- 5.7.2.6. Portugal
- 5.7.2.7. Ireland
- 5.7.2.8. Austria
- 5.7.2.9. Switzerland
- 5.7.2.10. Benelux
- 5.7.2.11. Nordic
- 5.7.2.12. Rest of Western Europe
- 6. Eastern Europe Pet Food Ingredients Market Analysis, Opportunity and Forecast, 2016-2032
- 6.1. Eastern Europe Pet Food Ingredients Market Analysis, 2016-2021
- 6.2. Eastern Europe Pet Food Ingredients Market Opportunity and Forecast, 2023-2032
- 6.3. Eastern Europe Pet Food Ingredients Market Analysis, Opportunity and Forecast, By Source, 2016-2032
- 6.3.1. Eastern Europe Pet Food Ingredients Market Analysis by Source: Introduction
- 6.3.2. Market Size Absolute $ Opportunity Analysis and Forecast, By Source, 2016-2032
- 6.3.3. Plant Derivatives
- 6.3.4. Animal Derivatives
- 6.4. Eastern Europe Pet Food Ingredients Market Analysis, Opportunity and Forecast, By Form, 2016-2032
- 6.4.1. Eastern Europe Pet Food Ingredients Market Analysis by Form: Introduction
- 6.4.2. Market Size Absolute $ Opportunity Analysis and Forecast, By Form, 2016-2032
- 6.4.3. Wet
- 6.4.4. Dry
- 6.4.5. Mixture
- 6.5. Eastern Europe Pet Food Ingredients Market Analysis, Opportunity and Forecast, By Animal Type, 2016-2032
- 6.5.1. Eastern Europe Pet Food Ingredients Market Analysis by Animal Type: Introduction
- 6.5.2. Market Size Absolute $ Opportunity Analysis and Forecast, By Animal Type, 2016-2032
- 6.5.3. Dog
- 6.5.4. Cat
- 6.5.5. Bird
- 6.5.6. Fish
- 6.5.7. Others
- 6.6. Eastern Europe Pet Food Ingredients Market Analysis, Opportunity and Forecast, By Ingredient, 2016-2032
- 6.6.1. Eastern Europe Pet Food Ingredients Market Analysis by Ingredient: Introduction
- 6.6.2. Market Size Absolute $ Opportunity Analysis and Forecast, By Ingredient, 2016-2032
- 6.6.3. Vegetables & Fruits
- 6.6.4. Meat & meat products
- 6.6.5. Cereals
- 6.6.6. Fats
- 6.7. Eastern Europe Pet Food Ingredients Market Analysis, Opportunity and Forecast, By Country , 2016-2032
- 6.7.1. Eastern Europe Pet Food Ingredients Market Analysis by Country : Introduction
- 6.7.2. Market Size Absolute $ Opportunity Analysis and Forecast, Country , 2016-2032
- 6.7.2.1. Russia
- 6.7.2.2. Poland
- 6.7.2.3. The Czech Republic
- 6.7.2.4. Greece
- 6.7.2.5. Rest of Eastern Europe
- 7. APAC Pet Food Ingredients Market Analysis, Opportunity and Forecast, 2016-2032
- 7.1. APAC Pet Food Ingredients Market Analysis, 2016-2021
- 7.2. APAC Pet Food Ingredients Market Opportunity and Forecast, 2023-2032
- 7.3. APAC Pet Food Ingredients Market Analysis, Opportunity and Forecast, By Source, 2016-2032
- 7.3.1. APAC Pet Food Ingredients Market Analysis by Source: Introduction
- 7.3.2. Market Size Absolute $ Opportunity Analysis and Forecast, By Source, 2016-2032
- 7.3.3. Plant Derivatives
- 7.3.4. Animal Derivatives
- 7.4. APAC Pet Food Ingredients Market Analysis, Opportunity and Forecast, By Form, 2016-2032
- 7.4.1. APAC Pet Food Ingredients Market Analysis by Form: Introduction
- 7.4.2. Market Size Absolute $ Opportunity Analysis and Forecast, By Form, 2016-2032
- 7.4.3. Wet
- 7.4.4. Dry
- 7.4.5. Mixture
- 7.5. APAC Pet Food Ingredients Market Analysis, Opportunity and Forecast, By Animal Type, 2016-2032
- 7.5.1. APAC Pet Food Ingredients Market Analysis by Animal Type: Introduction
- 7.5.2. Market Size Absolute $ Opportunity Analysis and Forecast, By Animal Type, 2016-2032
- 7.5.3. Dog
- 7.5.4. Cat
- 7.5.5. Bird
- 7.5.6. Fish
- 7.5.7. Others
- 7.6. APAC Pet Food Ingredients Market Analysis, Opportunity and Forecast, By Ingredient, 2016-2032
- 7.6.1. APAC Pet Food Ingredients Market Analysis by Ingredient: Introduction
- 7.6.2. Market Size Absolute $ Opportunity Analysis and Forecast, By Ingredient, 2016-2032
- 7.6.3. Vegetables & Fruits
- 7.6.4. Meat & meat products
- 7.6.5. Cereals
- 7.6.6. Fats
- 7.7. APAC Pet Food Ingredients Market Analysis, Opportunity and Forecast, By Country , 2016-2032
- 7.7.1. APAC Pet Food Ingredients Market Analysis by Country : Introduction
- 7.7.2. Market Size Absolute $ Opportunity Analysis and Forecast, Country , 2016-2032
- 7.7.2.1. China
- 7.7.2.2. Japan
- 7.7.2.3. South Korea
- 7.7.2.4. India
- 7.7.2.5. Australia & New Zeland
- 7.7.2.6. Indonesia
- 7.7.2.7. Malaysia
- 7.7.2.8. Philippines
- 7.7.2.9. Singapore
- 7.7.2.10. Thailand
- 7.7.2.11. Vietnam
- 7.7.2.12. Rest of APAC
- 8. Latin America Pet Food Ingredients Market Analysis, Opportunity and Forecast, 2016-2032
- 8.1. Latin America Pet Food Ingredients Market Analysis, 2016-2021
- 8.2. Latin America Pet Food Ingredients Market Opportunity and Forecast, 2023-2032
- 8.3. Latin America Pet Food Ingredients Market Analysis, Opportunity and Forecast, By Source, 2016-2032
- 8.3.1. Latin America Pet Food Ingredients Market Analysis by Source: Introduction
- 8.3.2. Market Size Absolute $ Opportunity Analysis and Forecast, By Source, 2016-2032
- 8.3.3. Plant Derivatives
- 8.3.4. Animal Derivatives
- 8.4. Latin America Pet Food Ingredients Market Analysis, Opportunity and Forecast, By Form, 2016-2032
- 8.4.1. Latin America Pet Food Ingredients Market Analysis by Form: Introduction
- 8.4.2. Market Size Absolute $ Opportunity Analysis and Forecast, By Form, 2016-2032
- 8.4.3. Wet
- 8.4.4. Dry
- 8.4.5. Mixture
- 8.5. Latin America Pet Food Ingredients Market Analysis, Opportunity and Forecast, By Animal Type, 2016-2032
- 8.5.1. Latin America Pet Food Ingredients Market Analysis by Animal Type: Introduction
- 8.5.2. Market Size Absolute $ Opportunity Analysis and Forecast, By Animal Type, 2016-2032
- 8.5.3. Dog
- 8.5.4. Cat
- 8.5.5. Bird
- 8.5.6. Fish
- 8.5.7. Others
- 8.6. Latin America Pet Food Ingredients Market Analysis, Opportunity and Forecast, By Ingredient, 2016-2032
- 8.6.1. Latin America Pet Food Ingredients Market Analysis by Ingredient: Introduction
- 8.6.2. Market Size Absolute $ Opportunity Analysis and Forecast, By Ingredient, 2016-2032
- 8.6.3. Vegetables & Fruits
- 8.6.4. Meat & meat products
- 8.6.5. Cereals
- 8.6.6. Fats
- 8.7. Latin America Pet Food Ingredients Market Analysis, Opportunity and Forecast, By Country , 2016-2032
- 8.7.1. Latin America Pet Food Ingredients Market Analysis by Country : Introduction
- 8.7.2. Market Size Absolute $ Opportunity Analysis and Forecast, Country , 2016-2032
- 8.7.2.1. Brazil
- 8.7.2.2. Colombia
- 8.7.2.3. Chile
- 8.7.2.4. Argentina
- 8.7.2.5. Costa Rica
- 8.7.2.6. Rest of Latin America
- 9. Middle East & Africa Pet Food Ingredients Market Analysis, Opportunity and Forecast, 2016-2032
- 9.1. Middle East & Africa Pet Food Ingredients Market Analysis, 2016-2021
- 9.2. Middle East & Africa Pet Food Ingredients Market Opportunity and Forecast, 2023-2032
- 9.3. Middle East & Africa Pet Food Ingredients Market Analysis, Opportunity and Forecast, By Source, 2016-2032
- 9.3.1. Middle East & Africa Pet Food Ingredients Market Analysis by Source: Introduction
- 9.3.2. Market Size Absolute $ Opportunity Analysis and Forecast, By Source, 2016-2032
- 9.3.3. Plant Derivatives
- 9.3.4. Animal Derivatives
- 9.4. Middle East & Africa Pet Food Ingredients Market Analysis, Opportunity and Forecast, By Form, 2016-2032
- 9.4.1. Middle East & Africa Pet Food Ingredients Market Analysis by Form: Introduction
- 9.4.2. Market Size Absolute $ Opportunity Analysis and Forecast, By Form, 2016-2032
- 9.4.3. Wet
- 9.4.4. Dry
- 9.4.5. Mixture
- 9.5. Middle East & Africa Pet Food Ingredients Market Analysis, Opportunity and Forecast, By Animal Type, 2016-2032
- 9.5.1. Middle East & Africa Pet Food Ingredients Market Analysis by Animal Type: Introduction
- 9.5.2. Market Size Absolute $ Opportunity Analysis and Forecast, By Animal Type, 2016-2032
- 9.5.3. Dog
- 9.5.4. Cat
- 9.5.5. Bird
- 9.5.6. Fish
- 9.5.7. Others
- 9.6. Middle East & Africa Pet Food Ingredients Market Analysis, Opportunity and Forecast, By Ingredient, 2016-2032
- 9.6.1. Middle East & Africa Pet Food Ingredients Market Analysis by Ingredient: Introduction
- 9.6.2. Market Size Absolute $ Opportunity Analysis and Forecast, By Ingredient, 2016-2032
- 9.6.3. Vegetables & Fruits
- 9.6.4. Meat & meat products
- 9.6.5. Cereals
- 9.6.6. Fats
- 9.7. Middle East & Africa Pet Food Ingredients Market Analysis, Opportunity and Forecast, By Country , 2016-2032
- 9.7.1. Middle East & Africa Pet Food Ingredients Market Analysis by Country : Introduction
- 9.7.2. Market Size Absolute $ Opportunity Analysis and Forecast, Country , 2016-2032
- 9.7.2.1. Algeria
- 9.7.2.2. Egypt
- 9.7.2.3. Israel
- 9.7.2.4. Kuwait
- 9.7.2.5. Nigeria
- 9.7.2.6. Saudi Arabia
- 9.7.2.7. South Africa
- 9.7.2.8. Turkey
- 9.7.2.9. The UAE
- 9.7.2.10. Rest of MEA
- 10. Global Pet Food Ingredients Market Analysis, Opportunity and Forecast, By Region , 2016-2032
- 10.1. Global Pet Food Ingredients Market Analysis by Region : Introduction
- 10.2. Market Size Absolute $ Opportunity Analysis and Forecast, By Region , 2016-2032
- 10.2.1. North America
- 10.2.2. Western Europe
- 10.2.3. Eastern Europe
- 10.2.4. APAC
- 10.2.5. Latin America
- 10.2.6. Middle East & Africa
- 11. Global Pet Food Ingredients Market Competitive Landscape, Market Share Analysis, and Company Profiles
- 11.1. Market Share Analysis
- 11.2. Company Profiles
- 11.3. BASF SE
- 11.3.1. Company Overview
- 11.3.2. Financial Highlights
- 11.3.3. Product Portfolio
- 11.3.4. SWOT Analysis
- 11.3.5. Key Strategies and Developments
- 11.4. Koninklijke DSM N.V.
- 11.4.1. Company Overview
- 11.4.2. Financial Highlights
- 11.4.3. Product Portfolio
- 11.4.4. SWOT Analysis
- 11.4.5. Key Strategies and Developments
- 11.5. Colgate-Palmolive Company
- 11.5.1. Company Overview
- 11.5.2. Financial Highlights
- 11.5.3. Product Portfolio
- 11.5.4. SWOT Analysis
- 11.5.5. Key Strategies and Developments
- 11.6. Archer Daniels Midland Company
- 11.6.1. Company Overview
- 11.6.2. Financial Highlights
- 11.6.3. Product Portfolio
- 11.6.4. SWOT Analysis
- 11.6.5. Key Strategies and Developments
- 11.7. Agrolimen SA
- 11.7.1. Company Overview
- 11.7.2. Financial Highlights
- 11.7.3. Product Portfolio
- 11.7.4. SWOT Analysis
- 11.7.5. Key Strategies and Developments
- 11.8. Nutriara Alimentos Ltd.
- 11.8.1. Company Overview
- 11.8.2. Financial Highlights
- 11.8.3. Product Portfolio
- 11.8.4. SWOT Analysis
- 11.8.5. Key Strategies and Developments
- 11.9. The Nutro Company
- 11.9.1. Company Overview
- 11.9.2. Financial Highlights
- 11.9.3. Product Portfolio
- 11.9.4. SWOT Analysis
- 11.9.5. Key Strategies and Developments
- 11.10. Darling Ingredients Inc.
- 11.10.1. Company Overview
- 11.10.2. Financial Highlights
- 11.10.3. Product Portfolio
- 11.10.4. SWOT Analysis
- 11.10.5. Key Strategies and Developments
- 11.11.1. Company Overview
- 11.11.2. Financial Highlights
- 11.11.3. Product Portfolio
- 11.11.4. SWOT Analysis
- 11.11.5. Key Strategies and Developments
- 11.12. The Scoular Company.
- 11.12.1. Company Overview
- 11.12.2. Financial Highlights
- 11.12.3. Product Portfolio
- 11.12.4. SWOT Analysis
- 11.12.5. Key Strategies and Developments
- 11.13.1. Company Overview
- 11.13.2. Financial Highlights
- 11.13.3. Product Portfolio
- 11.13.4. SWOT Analysis
- 11.13.5. Key Strategies and Developments
- 11.14. Marshall Ingredient
- 11.14.1. Company Overview
- 11.14.2. Financial Highlights
- 11.14.3. Product Portfolio
- 11.14.4. SWOT Analysis
- 11.14.5. Key Strategies and Developments
- 11.15. Symrise
- 11.15.1. Company Overview
- 11.15.2. Financial Highlights
- 11.15.3. Product Portfolio
- 11.15.4. SWOT Analysis
- 11.15.5. Key Strategies and Developments
- 11.16. Elanco
- 11.16.1. Company Overview
- 11.16.2. Financial Highlights
- 11.16.3. Product Portfolio
- 11.16.4. SWOT Analysis
- 11.16.5. Key Strategies and Developments
- 11.17. DuPont Nutrition & Health
- 11.17.1. Company Overview
- 11.17.2. Financial Highlights
- 11.17.3. Product Portfolio
- 11.17.4. SWOT Analysis
- 11.17.5. Key Strategies and Developments
- 11.18. Other Key Players
- 11.18.1. Company Overview
- 11.18.2. Financial Highlights
- 11.18.3. Product Portfolio
- 11.18.4. SWOT Analysis
- 11.18.5. Key Strategies and Developments
- 12. Assumptions and Acronyms
- 13. Research Methodology
- 14. Contact
- List of Figures
- Figure 1: Global Pet Food Ingredients Market Revenue (US$ Mn) Market Share by Source in 2022
- Figure 2: Global Pet Food Ingredients Market Attractiveness Analysis by Source, 2016-2032
- Figure 3: Global Pet Food Ingredients Market Revenue (US$ Mn) Market Share by Formin 2022
- Figure 4: Global Pet Food Ingredients Market Attractiveness Analysis by Form, 2016-2032
- Figure 5: Global Pet Food Ingredients Market Revenue (US$ Mn) Market Share by Animal Typein 2022
- Figure 6: Global Pet Food Ingredients Market Attractiveness Analysis by Animal Type, 2016-2032
- Figure 7: Global Pet Food Ingredients Market Revenue (US$ Mn) Market Share by Ingredientin 2022
- Figure 8: Global Pet Food Ingredients Market Attractiveness Analysis by Ingredient, 2016-2032
- Figure 9: Global Pet Food Ingredients Market Revenue (US$ Mn) Market Share by Region in 2022
- Figure 10: Global Pet Food Ingredients Market Attractiveness Analysis by Region, 2016-2032
- Figure 11: Global Pet Food Ingredients Market Revenue (US$ Mn) (2016-2032)
- Figure 12: Global Pet Food Ingredients Market Revenue (US$ Mn) Comparison by Region (2016-2032)
- Figure 13: Global Pet Food Ingredients Market Revenue (US$ Mn) Comparison by Source (2016-2032)
- Figure 14: Global Pet Food Ingredients Market Revenue (US$ Mn) Comparison by Form (2016-2032)
- Figure 15: Global Pet Food Ingredients Market Revenue (US$ Mn) Comparison by Animal Type (2016-2032)
- Figure 16: Global Pet Food Ingredients Market Revenue (US$ Mn) Comparison by Ingredient (2016-2032)
- Figure 17: Global Pet Food Ingredients Market Y-o-Y Growth Rate Comparison by Region (2016-2032)
- Figure 18: Global Pet Food Ingredients Market Y-o-Y Growth Rate Comparison by Source (2016-2032)
- Figure 19: Global Pet Food Ingredients Market Y-o-Y Growth Rate Comparison by Form (2016-2032)
- Figure 20: Global Pet Food Ingredients Market Y-o-Y Growth Rate Comparison by Animal Type (2016-2032)
- Figure 21: Global Pet Food Ingredients Market Y-o-Y Growth Rate Comparison by Ingredient (2016-2032)
- Figure 22: Global Pet Food Ingredients Market Share Comparison by Region (2016-2032)
- Figure 23: Global Pet Food Ingredients Market Share Comparison by Source (2016-2032)
- Figure 24: Global Pet Food Ingredients Market Share Comparison by Form (2016-2032)
- Figure 25: Global Pet Food Ingredients Market Share Comparison by Animal Type (2016-2032)
- Figure 26: Global Pet Food Ingredients Market Share Comparison by Ingredient (2016-2032)
- Figure 27: North America Pet Food Ingredients Market Revenue (US$ Mn) Market Share by Sourcein 2022
- Figure 28: North America Pet Food Ingredients Market Attractiveness Analysis by Source, 2016-2032
- Figure 29: North America Pet Food Ingredients Market Revenue (US$ Mn) Market Share by Formin 2022
- Figure 30: North America Pet Food Ingredients Market Attractiveness Analysis by Form, 2016-2032
- Figure 31: North America Pet Food Ingredients Market Revenue (US$ Mn) Market Share by Animal Typein 2022
- Figure 32: North America Pet Food Ingredients Market Attractiveness Analysis by Animal Type, 2016-2032
- Figure 33: North America Pet Food Ingredients Market Revenue (US$ Mn) Market Share by Ingredientin 2022
- Figure 34: North America Pet Food Ingredients Market Attractiveness Analysis by Ingredient, 2016-2032
- Figure 35: North America Pet Food Ingredients Market Revenue (US$ Mn) Market Share by Country in 2022
- Figure 36: North America Pet Food Ingredients Market Attractiveness Analysis by Country, 2016-2032
- Figure 37: North America Pet Food Ingredients Market Revenue (US$ Mn) (2016-2032)
- Figure 38: North America Pet Food Ingredients Market Revenue (US$ Mn) Comparison by Country (2016-2032)
- Figure 39: North America Pet Food Ingredients Market Revenue (US$ Mn) Comparison by Source (2016-2032)
- Figure 40: North America Pet Food Ingredients Market Revenue (US$ Mn) Comparison by Form (2016-2032)
- Figure 41: North America Pet Food Ingredients Market Revenue (US$ Mn) Comparison by Animal Type (2016-2032)
- Figure 42: North America Pet Food Ingredients Market Revenue (US$ Mn) Comparison by Ingredient (2016-2032)
- Figure 43: North America Pet Food Ingredients Market Y-o-Y Growth Rate Comparison by Country (2016-2032)
- Figure 44: North America Pet Food Ingredients Market Y-o-Y Growth Rate Comparison by Source (2016-2032)
- Figure 45: North America Pet Food Ingredients Market Y-o-Y Growth Rate Comparison by Form (2016-2032)
- Figure 46: North America Pet Food Ingredients Market Y-o-Y Growth Rate Comparison by Animal Type (2016-2032)
- Figure 47: North America Pet Food Ingredients Market Y-o-Y Growth Rate Comparison by Ingredient (2016-2032)
- Figure 48: North America Pet Food Ingredients Market Share Comparison by Country (2016-2032)
- Figure 49: North America Pet Food Ingredients Market Share Comparison by Source (2016-2032)
- Figure 50: North America Pet Food Ingredients Market Share Comparison by Form (2016-2032)
- Figure 51: North America Pet Food Ingredients Market Share Comparison by Animal Type (2016-2032)
- Figure 52: North America Pet Food Ingredients Market Share Comparison by Ingredient (2016-2032)
- Figure 53: Western Europe Pet Food Ingredients Market Revenue (US$ Mn) Market Share by Sourcein 2022
- Figure 54: Western Europe Pet Food Ingredients Market Attractiveness Analysis by Source, 2016-2032
- Figure 55: Western Europe Pet Food Ingredients Market Revenue (US$ Mn) Market Share by Formin 2022
- Figure 56: Western Europe Pet Food Ingredients Market Attractiveness Analysis by Form, 2016-2032
- Figure 57: Western Europe Pet Food Ingredients Market Revenue (US$ Mn) Market Share by Animal Typein 2022
- Figure 58: Western Europe Pet Food Ingredients Market Attractiveness Analysis by Animal Type, 2016-2032
- Figure 59: Western Europe Pet Food Ingredients Market Revenue (US$ Mn) Market Share by Ingredientin 2022
- Figure 60: Western Europe Pet Food Ingredients Market Attractiveness Analysis by Ingredient, 2016-2032
- Figure 61: Western Europe Pet Food Ingredients Market Revenue (US$ Mn) Market Share by Country in 2022
- Figure 62: Western Europe Pet Food Ingredients Market Attractiveness Analysis by Country, 2016-2032
- Figure 63: Western Europe Pet Food Ingredients Market Revenue (US$ Mn) (2016-2032)
- Figure 64: Western Europe Pet Food Ingredients Market Revenue (US$ Mn) Comparison by Country (2016-2032)
- Figure 65: Western Europe Pet Food Ingredients Market Revenue (US$ Mn) Comparison by Source (2016-2032)
- Figure 66: Western Europe Pet Food Ingredients Market Revenue (US$ Mn) Comparison by Form (2016-2032)
- Figure 67: Western Europe Pet Food Ingredients Market Revenue (US$ Mn) Comparison by Animal Type (2016-2032)
- Figure 68: Western Europe Pet Food Ingredients Market Revenue (US$ Mn) Comparison by Ingredient (2016-2032)
- Figure 69: Western Europe Pet Food Ingredients Market Y-o-Y Growth Rate Comparison by Country (2016-2032)
- Figure 70: Western Europe Pet Food Ingredients Market Y-o-Y Growth Rate Comparison by Source (2016-2032)
- Figure 71: Western Europe Pet Food Ingredients Market Y-o-Y Growth Rate Comparison by Form (2016-2032)
- Figure 72: Western Europe Pet Food Ingredients Market Y-o-Y Growth Rate Comparison by Animal Type (2016-2032)
- Figure 73: Western Europe Pet Food Ingredients Market Y-o-Y Growth Rate Comparison by Ingredient (2016-2032)
- Figure 74: Western Europe Pet Food Ingredients Market Share Comparison by Country (2016-2032)
- Figure 75: Western Europe Pet Food Ingredients Market Share Comparison by Source (2016-2032)
- Figure 76: Western Europe Pet Food Ingredients Market Share Comparison by Form (2016-2032)
- Figure 77: Western Europe Pet Food Ingredients Market Share Comparison by Animal Type (2016-2032)
- Figure 78: Western Europe Pet Food Ingredients Market Share Comparison by Ingredient (2016-2032)
- Figure 79: Eastern Europe Pet Food Ingredients Market Revenue (US$ Mn) Market Share by Sourcein 2022
- Figure 80: Eastern Europe Pet Food Ingredients Market Attractiveness Analysis by Source, 2016-2032
- Figure 81: Eastern Europe Pet Food Ingredients Market Revenue (US$ Mn) Market Share by Formin 2022
- Figure 82: Eastern Europe Pet Food Ingredients Market Attractiveness Analysis by Form, 2016-2032
- Figure 83: Eastern Europe Pet Food Ingredients Market Revenue (US$ Mn) Market Share by Animal Typein 2022
- Figure 84: Eastern Europe Pet Food Ingredients Market Attractiveness Analysis by Animal Type, 2016-2032
- Figure 85: Eastern Europe Pet Food Ingredients Market Revenue (US$ Mn) Market Share by Ingredientin 2022
- Figure 86: Eastern Europe Pet Food Ingredients Market Attractiveness Analysis by Ingredient, 2016-2032
- Figure 87: Eastern Europe Pet Food Ingredients Market Revenue (US$ Mn) Market Share by Country in 2022
- Figure 88: Eastern Europe Pet Food Ingredients Market Attractiveness Analysis by Country, 2016-2032
- Figure 89: Eastern Europe Pet Food Ingredients Market Revenue (US$ Mn) (2016-2032)
- Figure 90: Eastern Europe Pet Food Ingredients Market Revenue (US$ Mn) Comparison by Country (2016-2032)
- Figure 91: Eastern Europe Pet Food Ingredients Market Revenue (US$ Mn) Comparison by Source (2016-2032)
- Figure 92: Eastern Europe Pet Food Ingredients Market Revenue (US$ Mn) Comparison by Form (2016-2032)
- Figure 93: Eastern Europe Pet Food Ingredients Market Revenue (US$ Mn) Comparison by Animal Type (2016-2032)
- Figure 94: Eastern Europe Pet Food Ingredients Market Revenue (US$ Mn) Comparison by Ingredient (2016-2032)
- Figure 95: Eastern Europe Pet Food Ingredients Market Y-o-Y Growth Rate Comparison by Country (2016-2032)
- Figure 96: Eastern Europe Pet Food Ingredients Market Y-o-Y Growth Rate Comparison by Source (2016-2032)
- Figure 97: Eastern Europe Pet Food Ingredients Market Y-o-Y Growth Rate Comparison by Form (2016-2032)
- Figure 98: Eastern Europe Pet Food Ingredients Market Y-o-Y Growth Rate Comparison by Animal Type (2016-2032)
- Figure 99: Eastern Europe Pet Food Ingredients Market Y-o-Y Growth Rate Comparison by Ingredient (2016-2032)
- Figure 100: Eastern Europe Pet Food Ingredients Market Share Comparison by Country (2016-2032)
- Figure 101: Eastern Europe Pet Food Ingredients Market Share Comparison by Source (2016-2032)
- Figure 102: Eastern Europe Pet Food Ingredients Market Share Comparison by Form (2016-2032)
- Figure 103: Eastern Europe Pet Food Ingredients Market Share Comparison by Animal Type (2016-2032)
- Figure 104: Eastern Europe Pet Food Ingredients Market Share Comparison by Ingredient (2016-2032)
- Figure 105: APAC Pet Food Ingredients Market Revenue (US$ Mn) Market Share by Sourcein 2022
- Figure 106: APAC Pet Food Ingredients Market Attractiveness Analysis by Source, 2016-2032
- Figure 107: APAC Pet Food Ingredients Market Revenue (US$ Mn) Market Share by Formin 2022
- Figure 108: APAC Pet Food Ingredients Market Attractiveness Analysis by Form, 2016-2032
- Figure 109: APAC Pet Food Ingredients Market Revenue (US$ Mn) Market Share by Animal Typein 2022
- Figure 110: APAC Pet Food Ingredients Market Attractiveness Analysis by Animal Type, 2016-2032
- Figure 111: APAC Pet Food Ingredients Market Revenue (US$ Mn) Market Share by Ingredientin 2022
- Figure 112: APAC Pet Food Ingredients Market Attractiveness Analysis by Ingredient, 2016-2032
- Figure 113: APAC Pet Food Ingredients Market Revenue (US$ Mn) Market Share by Country in 2022
- Figure 114: APAC Pet Food Ingredients Market Attractiveness Analysis by Country, 2016-2032
- Figure 115: APAC Pet Food Ingredients Market Revenue (US$ Mn) (2016-2032)
- Figure 116: APAC Pet Food Ingredients Market Revenue (US$ Mn) Comparison by Country (2016-2032)
- Figure 117: APAC Pet Food Ingredients Market Revenue (US$ Mn) Comparison by Source (2016-2032)
- Figure 118: APAC Pet Food Ingredients Market Revenue (US$ Mn) Comparison by Form (2016-2032)
- Figure 119: APAC Pet Food Ingredients Market Revenue (US$ Mn) Comparison by Animal Type (2016-2032)
- Figure 120: APAC Pet Food Ingredients Market Revenue (US$ Mn) Comparison by Ingredient (2016-2032)
- Figure 121: APAC Pet Food Ingredients Market Y-o-Y Growth Rate Comparison by Country (2016-2032)
- Figure 122: APAC Pet Food Ingredients Market Y-o-Y Growth Rate Comparison by Source (2016-2032)
- Figure 123: APAC Pet Food Ingredients Market Y-o-Y Growth Rate Comparison by Form (2016-2032)
- Figure 124: APAC Pet Food Ingredients Market Y-o-Y Growth Rate Comparison by Animal Type (2016-2032)
- Figure 125: APAC Pet Food Ingredients Market Y-o-Y Growth Rate Comparison by Ingredient (2016-2032)
- Figure 126: APAC Pet Food Ingredients Market Share Comparison by Country (2016-2032)
- Figure 127: APAC Pet Food Ingredients Market Share Comparison by Source (2016-2032)
- Figure 128: APAC Pet Food Ingredients Market Share Comparison by Form (2016-2032)
- Figure 129: APAC Pet Food Ingredients Market Share Comparison by Animal Type (2016-2032)
- Figure 130: APAC Pet Food Ingredients Market Share Comparison by Ingredient (2016-2032)
- Figure 131: Latin America Pet Food Ingredients Market Revenue (US$ Mn) Market Share by Sourcein 2022
- Figure 132: Latin America Pet Food Ingredients Market Attractiveness Analysis by Source, 2016-2032
- Figure 133: Latin America Pet Food Ingredients Market Revenue (US$ Mn) Market Share by Formin 2022
- Figure 134: Latin America Pet Food Ingredients Market Attractiveness Analysis by Form, 2016-2032
- Figure 135: Latin America Pet Food Ingredients Market Revenue (US$ Mn) Market Share by Animal Typein 2022
- Figure 136: Latin America Pet Food Ingredients Market Attractiveness Analysis by Animal Type, 2016-2032
- Figure 137: Latin America Pet Food Ingredients Market Revenue (US$ Mn) Market Share by Ingredientin 2022
- Figure 138: Latin America Pet Food Ingredients Market Attractiveness Analysis by Ingredient, 2016-2032
- Figure 139: Latin America Pet Food Ingredients Market Revenue (US$ Mn) Market Share by Country in 2022
- Figure 140: Latin America Pet Food Ingredients Market Attractiveness Analysis by Country, 2016-2032
- Figure 141: Latin America Pet Food Ingredients Market Revenue (US$ Mn) (2016-2032)
- Figure 142: Latin America Pet Food Ingredients Market Revenue (US$ Mn) Comparison by Country (2016-2032)
- Figure 143: Latin America Pet Food Ingredients Market Revenue (US$ Mn) Comparison by Source (2016-2032)
- Figure 144: Latin America Pet Food Ingredients Market Revenue (US$ Mn) Comparison by Form (2016-2032)
- Figure 145: Latin America Pet Food Ingredients Market Revenue (US$ Mn) Comparison by Animal Type (2016-2032)
- Figure 146: Latin America Pet Food Ingredients Market Revenue (US$ Mn) Comparison by Ingredient (2016-2032)
- Figure 147: Latin America Pet Food Ingredients Market Y-o-Y Growth Rate Comparison by Country (2016-2032)
- Figure 148: Latin America Pet Food Ingredients Market Y-o-Y Growth Rate Comparison by Source (2016-2032)
- Figure 149: Latin America Pet Food Ingredients Market Y-o-Y Growth Rate Comparison by Form (2016-2032)
- Figure 150: Latin America Pet Food Ingredients Market Y-o-Y Growth Rate Comparison by Animal Type (2016-2032)
- Figure 151: Latin America Pet Food Ingredients Market Y-o-Y Growth Rate Comparison by Ingredient (2016-2032)
- Figure 152: Latin America Pet Food Ingredients Market Share Comparison by Country (2016-2032)
- Figure 153: Latin America Pet Food Ingredients Market Share Comparison by Source (2016-2032)
- Figure 154: Latin America Pet Food Ingredients Market Share Comparison by Form (2016-2032)
- Figure 155: Latin America Pet Food Ingredients Market Share Comparison by Animal Type (2016-2032)
- Figure 156: Latin America Pet Food Ingredients Market Share Comparison by Ingredient (2016-2032)
- Figure 157: Middle East & Africa Pet Food Ingredients Market Revenue (US$ Mn) Market Share by Sourcein 2022
- Figure 158: Middle East & Africa Pet Food Ingredients Market Attractiveness Analysis by Source, 2016-2032
- Figure 159: Middle East & Africa Pet Food Ingredients Market Revenue (US$ Mn) Market Share by Formin 2022
- Figure 160: Middle East & Africa Pet Food Ingredients Market Attractiveness Analysis by Form, 2016-2032
- Figure 161: Middle East & Africa Pet Food Ingredients Market Revenue (US$ Mn) Market Share by Animal Typein 2022
- Figure 162: Middle East & Africa Pet Food Ingredients Market Attractiveness Analysis by Animal Type, 2016-2032
- Figure 163: Middle East & Africa Pet Food Ingredients Market Revenue (US$ Mn) Market Share by Ingredientin 2022
- Figure 164: Middle East & Africa Pet Food Ingredients Market Attractiveness Analysis by Ingredient, 2016-2032
- Figure 165: Middle East & Africa Pet Food Ingredients Market Revenue (US$ Mn) Market Share by Country in 2022
- Figure 166: Middle East & Africa Pet Food Ingredients Market Attractiveness Analysis by Country, 2016-2032
- Figure 167: Middle East & Africa Pet Food Ingredients Market Revenue (US$ Mn) (2016-2032)
- Figure 168: Middle East & Africa Pet Food Ingredients Market Revenue (US$ Mn) Comparison by Country (2016-2032)
- Figure 169: Middle East & Africa Pet Food Ingredients Market Revenue (US$ Mn) Comparison by Source (2016-2032)
- Figure 170: Middle East & Africa Pet Food Ingredients Market Revenue (US$ Mn) Comparison by Form (2016-2032)
- Figure 171: Middle East & Africa Pet Food Ingredients Market Revenue (US$ Mn) Comparison by Animal Type (2016-2032)
- Figure 172: Middle East & Africa Pet Food Ingredients Market Revenue (US$ Mn) Comparison by Ingredient (2016-2032)
- Figure 173: Middle East & Africa Pet Food Ingredients Market Y-o-Y Growth Rate Comparison by Country (2016-2032)
- Figure 174: Middle East & Africa Pet Food Ingredients Market Y-o-Y Growth Rate Comparison by Source (2016-2032)
- Figure 175: Middle East & Africa Pet Food Ingredients Market Y-o-Y Growth Rate Comparison by Form (2016-2032)
- Figure 176: Middle East & Africa Pet Food Ingredients Market Y-o-Y Growth Rate Comparison by Animal Type (2016-2032)
- Figure 177: Middle East & Africa Pet Food Ingredients Market Y-o-Y Growth Rate Comparison by Ingredient (2016-2032)
- Figure 178: Middle East & Africa Pet Food Ingredients Market Share Comparison by Country (2016-2032)
- Figure 179: Middle East & Africa Pet Food Ingredients Market Share Comparison by Source (2016-2032)
- Figure 180: Middle East & Africa Pet Food Ingredients Market Share Comparison by Form (2016-2032)
- Figure 181: Middle East & Africa Pet Food Ingredients Market Share Comparison by Animal Type (2016-2032)
- Figure 182: Middle East & Africa Pet Food Ingredients Market Share Comparison by Ingredient (2016-2032)
- List of Tables
- Table 1: Global Pet Food Ingredients Market Comparison by Source (2016-2032)
- Table 2: Global Pet Food Ingredients Market Comparison by Form (2016-2032)
- Table 3: Global Pet Food Ingredients Market Comparison by Animal Type (2016-2032)
- Table 4: Global Pet Food Ingredients Market Comparison by Ingredient (2016-2032)
- Table 5: Global Pet Food Ingredients Market Revenue (US$ Mn) Comparison by Region (2016-2032)
- Table 6: Global Pet Food Ingredients Market Revenue (US$ Mn) (2016-2032)
- Table 7: Global Pet Food Ingredients Market Revenue (US$ Mn) Comparison by Region (2016-2032)
- Table 8: Global Pet Food Ingredients Market Revenue (US$ Mn) Comparison by Source (2016-2032)
- Table 9: Global Pet Food Ingredients Market Revenue (US$ Mn) Comparison by Form (2016-2032)
- Table 10: Global Pet Food Ingredients Market Revenue (US$ Mn) Comparison by Animal Type (2016-2032)
- Table 11: Global Pet Food Ingredients Market Revenue (US$ Mn) Comparison by Ingredient (2016-2032)
- Table 12: Global Pet Food Ingredients Market Y-o-Y Growth Rate Comparison by Region (2016-2032)
- Table 13: Global Pet Food Ingredients Market Y-o-Y Growth Rate Comparison by Source (2016-2032)
- Table 14: Global Pet Food Ingredients Market Y-o-Y Growth Rate Comparison by Form (2016-2032)
- Table 15: Global Pet Food Ingredients Market Y-o-Y Growth Rate Comparison by Animal Type (2016-2032)
- Table 16: Global Pet Food Ingredients Market Y-o-Y Growth Rate Comparison by Ingredient (2016-2032)
- Table 17: Global Pet Food Ingredients Market Share Comparison by Region (2016-2032)
- Table 18: Global Pet Food Ingredients Market Share Comparison by Source (2016-2032)
- Table 19: Global Pet Food Ingredients Market Share Comparison by Form (2016-2032)
- Table 20: Global Pet Food Ingredients Market Share Comparison by Animal Type (2016-2032)
- Table 21: Global Pet Food Ingredients Market Share Comparison by Ingredient (2016-2032)
- Table 22: North America Pet Food Ingredients Market Comparison by Form (2016-2032)
- Table 23: North America Pet Food Ingredients Market Comparison by Animal Type (2016-2032)
- Table 24: North America Pet Food Ingredients Market Comparison by Ingredient (2016-2032)
- Table 25: North America Pet Food Ingredients Market Revenue (US$ Mn) Comparison by Country (2016-2032)
- Table 26: North America Pet Food Ingredients Market Revenue (US$ Mn) (2016-2032)
- Table 27: North America Pet Food Ingredients Market Revenue (US$ Mn) Comparison by Country (2016-2032)
- Table 28: North America Pet Food Ingredients Market Revenue (US$ Mn) Comparison by Source (2016-2032)
- Table 29: North America Pet Food Ingredients Market Revenue (US$ Mn) Comparison by Form (2016-2032)
- Table 30: North America Pet Food Ingredients Market Revenue (US$ Mn) Comparison by Animal Type (2016-2032)
- Table 31: North America Pet Food Ingredients Market Revenue (US$ Mn) Comparison by Ingredient (2016-2032)
- Table 32: North America Pet Food Ingredients Market Y-o-Y Growth Rate Comparison by Country (2016-2032)
- Table 33: North America Pet Food Ingredients Market Y-o-Y Growth Rate Comparison by Source (2016-2032)
- Table 34: North America Pet Food Ingredients Market Y-o-Y Growth Rate Comparison by Form (2016-2032)
- Table 35: North America Pet Food Ingredients Market Y-o-Y Growth Rate Comparison by Animal Type (2016-2032)
- Table 36: North America Pet Food Ingredients Market Y-o-Y Growth Rate Comparison by Ingredient (2016-2032)
- Table 37: North America Pet Food Ingredients Market Share Comparison by Country (2016-2032)
- Table 38: North America Pet Food Ingredients Market Share Comparison by Source (2016-2032)
- Table 39: North America Pet Food Ingredients Market Share Comparison by Form (2016-2032)
- Table 40: North America Pet Food Ingredients Market Share Comparison by Animal Type (2016-2032)
- Table 41: North America Pet Food Ingredients Market Share Comparison by Ingredient (2016-2032)
- Table 42: Western Europe Pet Food Ingredients Market Comparison by Source (2016-2032)
- Table 43: Western Europe Pet Food Ingredients Market Comparison by Form (2016-2032)
- Table 44: Western Europe Pet Food Ingredients Market Comparison by Animal Type (2016-2032)
- Table 45: Western Europe Pet Food Ingredients Market Comparison by Ingredient (2016-2032)
- Table 46: Western Europe Pet Food Ingredients Market Revenue (US$ Mn) Comparison by Country (2016-2032)
- Table 47: Western Europe Pet Food Ingredients Market Revenue (US$ Mn) (2016-2032)
- Table 48: Western Europe Pet Food Ingredients Market Revenue (US$ Mn) Comparison by Country (2016-2032)
- Table 49: Western Europe Pet Food Ingredients Market Revenue (US$ Mn) Comparison by Source (2016-2032)
- Table 50: Western Europe Pet Food Ingredients Market Revenue (US$ Mn) Comparison by Form (2016-2032)
- Table 51: Western Europe Pet Food Ingredients Market Revenue (US$ Mn) Comparison by Animal Type (2016-2032)
- Table 52: Western Europe Pet Food Ingredients Market Revenue (US$ Mn) Comparison by Ingredient (2016-2032)
- Table 53: Western Europe Pet Food Ingredients Market Y-o-Y Growth Rate Comparison by Country (2016-2032)
- Table 54: Western Europe Pet Food Ingredients Market Y-o-Y Growth Rate Comparison by Source (2016-2032)
- Table 55: Western Europe Pet Food Ingredients Market Y-o-Y Growth Rate Comparison by Form (2016-2032)
- Table 56: Western Europe Pet Food Ingredients Market Y-o-Y Growth Rate Comparison by Animal Type (2016-2032)
- Table 57: Western Europe Pet Food Ingredients Market Y-o-Y Growth Rate Comparison by Ingredient (2016-2032)
- Table 58: Western Europe Pet Food Ingredients Market Share Comparison by Country (2016-2032)
- Table 59: Western Europe Pet Food Ingredients Market Share Comparison by Source (2016-2032)
- Table 60: Western Europe Pet Food Ingredients Market Share Comparison by Form (2016-2032)
- Table 61: Western Europe Pet Food Ingredients Market Share Comparison by Animal Type (2016-2032)
- Table 62: Western Europe Pet Food Ingredients Market Share Comparison by Ingredient (2016-2032)
- Table 63: Eastern Europe Pet Food Ingredients Market Comparison by Source (2016-2032)
- Table 64: Eastern Europe Pet Food Ingredients Market Comparison by Form (2016-2032)
- Table 65: Eastern Europe Pet Food Ingredients Market Comparison by Animal Type (2016-2032)
- Table 66: Eastern Europe Pet Food Ingredients Market Comparison by Ingredient (2016-2032)
- Table 67: Eastern Europe Pet Food Ingredients Market Revenue (US$ Mn) Comparison by Country (2016-2032)
- Table 68: Eastern Europe Pet Food Ingredients Market Revenue (US$ Mn) (2016-2032)
- Table 69: Eastern Europe Pet Food Ingredients Market Revenue (US$ Mn) Comparison by Country (2016-2032)
- Table 70: Eastern Europe Pet Food Ingredients Market Revenue (US$ Mn) Comparison by Source (2016-2032)
- Table 71: Eastern Europe Pet Food Ingredients Market Revenue (US$ Mn) Comparison by Form (2016-2032)
- Table 72: Eastern Europe Pet Food Ingredients Market Revenue (US$ Mn) Comparison by Animal Type (2016-2032)
- Table 73: Eastern Europe Pet Food Ingredients Market Revenue (US$ Mn) Comparison by Ingredient (2016-2032)
- Table 74: Eastern Europe Pet Food Ingredients Market Y-o-Y Growth Rate Comparison by Country (2016-2032)
- Table 75: Eastern Europe Pet Food Ingredients Market Y-o-Y Growth Rate Comparison by Source (2016-2032)
- Table 76: Eastern Europe Pet Food Ingredients Market Y-o-Y Growth Rate Comparison by Form (2016-2032)
- Table 77: Eastern Europe Pet Food Ingredients Market Y-o-Y Growth Rate Comparison by Animal Type (2016-2032)
- Table 78: Eastern Europe Pet Food Ingredients Market Y-o-Y Growth Rate Comparison by Ingredient (2016-2032)
- Table 79: Eastern Europe Pet Food Ingredients Market Share Comparison by Country (2016-2032)
- Table 80: Eastern Europe Pet Food Ingredients Market Share Comparison by Source (2016-2032)
- Table 81: Eastern Europe Pet Food Ingredients Market Share Comparison by Form (2016-2032)
- Table 82: Eastern Europe Pet Food Ingredients Market Share Comparison by Animal Type (2016-2032)
- Table 83: Eastern Europe Pet Food Ingredients Market Share Comparison by Ingredient (2016-2032)
- Table 84: APAC Pet Food Ingredients Market Comparison by Source (2016-2032)
- Table 85: APAC Pet Food Ingredients Market Comparison by Form (2016-2032)
- Table 86: APAC Pet Food Ingredients Market Comparison by Animal Type (2016-2032)
- Table 87: APAC Pet Food Ingredients Market Comparison by Ingredient (2016-2032)
- Table 88: APAC Pet Food Ingredients Market Revenue (US$ Mn) Comparison by Country (2016-2032)
- Table 89: APAC Pet Food Ingredients Market Revenue (US$ Mn) (2016-2032)
- Table 90: APAC Pet Food Ingredients Market Revenue (US$ Mn) Comparison by Country (2016-2032)
- Table 91: APAC Pet Food Ingredients Market Revenue (US$ Mn) Comparison by Source (2016-2032)
- Table 92: APAC Pet Food Ingredients Market Revenue (US$ Mn) Comparison by Form (2016-2032)
- Table 93: APAC Pet Food Ingredients Market Revenue (US$ Mn) Comparison by Animal Type (2016-2032)
- Table 94: APAC Pet Food Ingredients Market Revenue (US$ Mn) Comparison by Ingredient (2016-2032)
- Table 95: APAC Pet Food Ingredients Market Y-o-Y Growth Rate Comparison by Country (2016-2032)
- Table 96: APAC Pet Food Ingredients Market Y-o-Y Growth Rate Comparison by Source (2016-2032)
- Table 97: APAC Pet Food Ingredients Market Y-o-Y Growth Rate Comparison by Form (2016-2032)
- Table 98: APAC Pet Food Ingredients Market Y-o-Y Growth Rate Comparison by Animal Type (2016-2032)
- Table 99: APAC Pet Food Ingredients Market Y-o-Y Growth Rate Comparison by Ingredient (2016-2032)
- Table 100: APAC Pet Food Ingredients Market Share Comparison by Country (2016-2032)
- Table 101: APAC Pet Food Ingredients Market Share Comparison by Source (2016-2032)
- Table 102: APAC Pet Food Ingredients Market Share Comparison by Form (2016-2032)
- Table 103: APAC Pet Food Ingredients Market Share Comparison by Animal Type (2016-2032)
- Table 104: APAC Pet Food Ingredients Market Share Comparison by Ingredient (2016-2032)
- Table 105: Latin America Pet Food Ingredients Market Comparison by Source (2016-2032)
- Table 106: Latin America Pet Food Ingredients Market Comparison by Form (2016-2032)
- Table 107: Latin America Pet Food Ingredients Market Comparison by Animal Type (2016-2032)
- Table 108: Latin America Pet Food Ingredients Market Comparison by Ingredient (2016-2032)
- Table 109: Latin America Pet Food Ingredients Market Revenue (US$ Mn) Comparison by Country (2016-2032)
- Table 110: Latin America Pet Food Ingredients Market Revenue (US$ Mn) (2016-2032)
- Table 111: Latin America Pet Food Ingredients Market Revenue (US$ Mn) Comparison by Country (2016-2032)
- Table 112: Latin America Pet Food Ingredients Market Revenue (US$ Mn) Comparison by Source (2016-2032)
- Table 113: Latin America Pet Food Ingredients Market Revenue (US$ Mn) Comparison by Form (2016-2032)
- Table 114: Latin America Pet Food Ingredients Market Revenue (US$ Mn) Comparison by Animal Type (2016-2032)
- Table 115: Latin America Pet Food Ingredients Market Revenue (US$ Mn) Comparison by Ingredient (2016-2032)
- Table 116: Latin America Pet Food Ingredients Market Y-o-Y Growth Rate Comparison by Country (2016-2032)
- Table 117: Latin America Pet Food Ingredients Market Y-o-Y Growth Rate Comparison by Source (2016-2032)
- Table 118: Latin America Pet Food Ingredients Market Y-o-Y Growth Rate Comparison by Form (2016-2032)
- Table 119: Latin America Pet Food Ingredients Market Y-o-Y Growth Rate Comparison by Animal Type (2016-2032)
- Table 120: Latin America Pet Food Ingredients Market Y-o-Y Growth Rate Comparison by Ingredient (2016-2032)
- Table 121: Latin America Pet Food Ingredients Market Share Comparison by Country (2016-2032)
- Table 122: Latin America Pet Food Ingredients Market Share Comparison by Source (2016-2032)
- Table 123: Latin America Pet Food Ingredients Market Share Comparison by Form (2016-2032)
- Table 124: Latin America Pet Food Ingredients Market Share Comparison by Animal Type (2016-2032)
- Table 125: Latin America Pet Food Ingredients Market Share Comparison by Ingredient (2016-2032)
- Table 126: Middle East & Africa Pet Food Ingredients Market Comparison by Source (2016-2032)
- Table 127: Middle East & Africa Pet Food Ingredients Market Comparison by Form (2016-2032)
- Table 128: Middle East & Africa Pet Food Ingredients Market Comparison by Animal Type (2016-2032)
- Table 129: Middle East & Africa Pet Food Ingredients Market Comparison by Ingredient (2016-2032)
- Table 130: Middle East & Africa Pet Food Ingredients Market Revenue (US$ Mn) Comparison by Country (2016-2032)
- Table 131: Middle East & Africa Pet Food Ingredients Market Revenue (US$ Mn) (2016-2032)
- Table 132: Middle East & Africa Pet Food Ingredients Market Revenue (US$ Mn) Comparison by Country (2016-2032)
- Table 133: Middle East & Africa Pet Food Ingredients Market Revenue (US$ Mn) Comparison by Source (2016-2032)
- Table 134: Middle East & Africa Pet Food Ingredients Market Revenue (US$ Mn) Comparison by Form (2016-2032)
- Table 135: Middle East & Africa Pet Food Ingredients Market Revenue (US$ Mn) Comparison by Animal Type (2016-2032)
- Table 136: Middle East & Africa Pet Food Ingredients Market Revenue (US$ Mn) Comparison by Ingredient (2016-2032)
- Table 137: Middle East & Africa Pet Food Ingredients Market Y-o-Y Growth Rate Comparison by Country (2016-2032)
- Table 138: Middle East & Africa Pet Food Ingredients Market Y-o-Y Growth Rate Comparison by Source (2016-2032)
- Table 139: Middle East & Africa Pet Food Ingredients Market Y-o-Y Growth Rate Comparison by Form (2016-2032)
- Table 140: Middle East & Africa Pet Food Ingredients Market Y-o-Y Growth Rate Comparison by Animal Type (2016-2032)
- Table 141: Middle East & Africa Pet Food Ingredients Market Y-o-Y Growth Rate Comparison by Ingredient (2016-2032)
- Table 142: Middle East & Africa Pet Food Ingredients Market Share Comparison by Country (2016-2032)
- Table 143: Middle East & Africa Pet Food Ingredients Market Share Comparison by Source (2016-2032)
- Table 144: Middle East & Africa Pet Food Ingredients Market Share Comparison by Form (2016-2032)
- Table 145: Middle East & Africa Pet Food Ingredients Market Share Comparison by Animal Type (2016-2032)
- Table 146: Middle East & Africa Pet Food Ingredients Market Share Comparison by Ingredient (2016-2032)
- 1. Executive Summary
-
- BASF SE
- Koninklijke DSM N.V.
- Colgate-Palmolive Company
- Archer Daniels Midland Company
- Agrolimen SA
- Nutriara Alimentos Ltd.
- The Nutro Company
- Darling Ingredients Inc.
- Marshall Ingredient
- The Scoular Company.
- FoodSafe Technologies
- Alltech
- Symrise
- Elanco
- DuPont Nutrition and Health
- Kemin Industries, Inc.
- Omega Protein Corporation
- Lallemand Inc.
- Balchem Inc.
- Cargill Inc.
Our Clients


View Our Licence Options
