
Peptide Therapeutics Market Report By Product Type (Innovative, Generic), By Application (Neurological, Gastrointestinal, Cardiovascular, Metabolic, Oncology, Other Applications), By Route of Administration (Parenteral Route, Pulmonary, Oral Route, Mucosal, Others), By Manufacturing Type, By Region and Companies - Industry Segment Outlook, Market Assessment, Competition Scenario, Trends and Forecast 2024-2033
-
46856
-
Feb 2025
-
321
-


-
This report was compiled by Trishita Deb Trishita Deb is an experienced market research and consulting professional with over 7 years of expertise across healthcare, consumer goods, and materials, contributing to over 400 healthcare-related reports. Correspondence Team Lead- Healthcare Linkedin | Detailed Market research Methodology Our methodology involves a mix of primary research, including interviews with leading mental health experts, and secondary research from reputable medical journals and databases. View Detailed Methodology Page
-
Quick Navigation
- Report Overview
- Key Takeaways
- Driving Factors
- Restraining Factors
- Product Type Analysis
- Application Analysis
- Route of Administration Analysis
- Manufacturing Type Analysis
- Synthesis Technology Analysis
- Key Market Segments
- Growth Opportunities
- Trending Factors
- Regional Analysis
- Key Players Analysis
- Recent Developments
- Report Scope
Report Overview
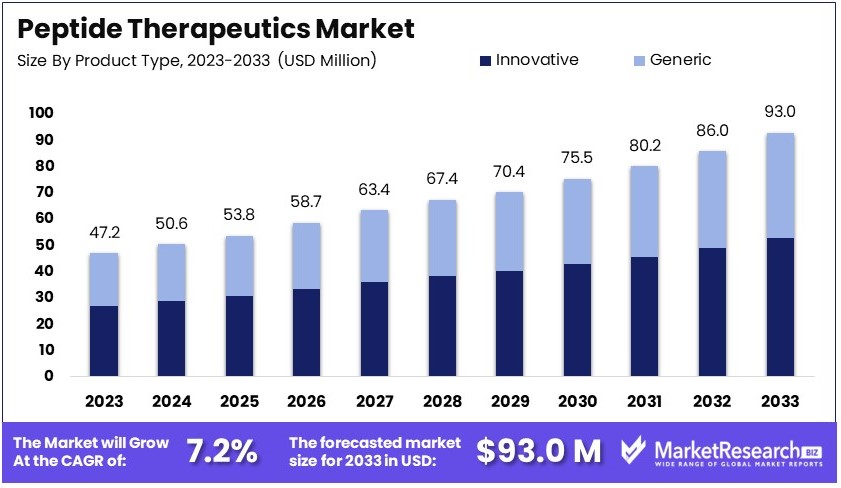
The Global Peptide Therapeutics Market size is expected to be worth around USD 93.0 Million by 2033, from USD 47.2 Million in 2023, growing at a CAGR of 7.2% during the forecast period from 2024 to 2033.
The global peptide therapeutics market is experiencing significant growth, driven by increasing demand for effective and targeted treatments in chronic diseases such as cancer, diabetes, and cardiovascular disorders. Advances in peptide synthesis technologies and the rising prevalence of metabolic disorders further fuel this expansion.
The market is characterized by a robust pipeline of peptide drugs under clinical development and strategic collaborations among biotech and pharmaceutical companies to enhance drug delivery technologies. North America holds a prominent market share, attributed to advanced healthcare infrastructure and extensive R&D activities. The market's growth is also supported by favorable regulatory environments and emerging applications in personalized medicine.
The peptide therapeutics market is poised for significant growth, driven by an aging population and the increasing prevalence of chronic diseases. According to a study published in 2023, the number of adults aged 50 years and older with at least one chronic disease is projected to rise by 99.5% by 2035. Additionally, those with multimorbidity are expected to increase by 91.16%. The Centers for Disease Control and Prevention (CDC) reports that six in ten adults in the US have a chronic disease, and four in ten have two or more. This escalating burden of chronic diseases, including diabetes, cancer, and cardiovascular diseases, is fueling the demand for peptide-based drugs.
Recent advancements in oral peptide drug development are also shaping the market dynamics. Scientists have developed stable, orally available cyclic peptides with significantly higher bioavailability than current options. These new peptides have demonstrated an oral bioavailability of 18%, a notable improvement for peptide-based biologic drugs, which traditionally exhibit much lower bioavailability when administered orally. This breakthrough is expected to revolutionize peptide drug development, offering more effective treatment options and improving patient compliance.
The market for peptide therapeutics is further bolstered by ongoing research and innovation. Pharmaceutical companies are investing heavily in R&D to develop novel peptide-based treatments and enhance drug delivery mechanisms. These efforts are anticipated to result in a robust pipeline of new products, addressing various therapeutic areas and unmet medical needs.
In summary, the peptide therapeutics market is set to expand significantly, driven by the rising prevalence of chronic diseases and groundbreaking advancements in oral peptide drug development. Continued investment in research and innovation will likely sustain this growth trajectory, offering promising opportunities for stakeholders in the pharmaceutical industry.
Key Takeaways
- Market Value: The Global Peptide Therapeutics Market is forecasted to grow at a CAGR of 7.2%, reaching USD 93.0 Million by 2033 from USD 47.2 Million in 2023.
- Product Type Analysis: Innovative products dominate with 57.3% driven by advancements in biotechnology and pharmaceutical research
- Application Analysis: Metabolic applications dominate with 32% fueled by the increasing prevalence of diabetes and obesity
- Route of Administration Analysis: Parenteral route dominates with 31% attributed to its higher bioavailability and rapid action.
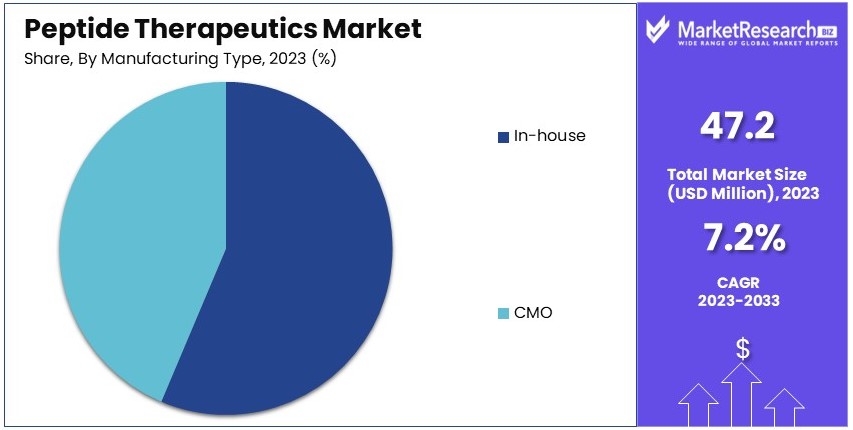
- Manufacturing Type Analysis: In-house manufacturing dominates with 62% owing to superior quality control and proprietary technologies.
- Synthesis Technology Analysis: LPPS dominates with 47% due to its high purity and yield.
- Dominant Region: North America emerges as the dominant region, accounting for 42% of the market, supported by its advanced healthcare infrastructure and substantial R&D investments.
- High Growth Region: Asia-Pacific region shows significant growth potential, driven by increasing healthcare expenditure and burgeoning emerging markets.
- Analyst Viewpoint: Market growth driven by innovative therapies; competitive but expanding with new applications.
- Growth Opportunities: Advances in biotechnology and personalized medicine; expanding applications in metabolic and oncology sectors.
Driving Factors
Increasing Prevalence of Chronic Diseases Drives Market Growth
The growing prevalence of chronic diseases, such as diabetes, cancer, and cardiovascular disorders, is a significant driver of the peptide therapeutics market. These conditions often require long-term chronic disease management, making peptide drugs a preferred choice due to their high efficacy and reduced side effects compared to traditional small-molecule drugs.
For instance, glucagon-like peptide-1 (GLP-1) agonists, such as Ozempic (semaglutide) and Trulicity (dulaglutide), are widely used in the treatment of type 2 diabetes, showcasing the effectiveness of peptide therapeutics. According to the International Diabetes Federation, approximately 537 million adults were living with diabetes in 2021, a number expected to rise to 643 million by 2030. This increase underscores the escalating demand for advanced treatments like peptide therapeutics.
Peptide drugs also show promise in cancer treatment, targeting specific proteins and pathways involved in tumor growth and progression. With cardiovascular diseases being the leading cause of death globally, peptide-based therapies are being developed to manage conditions like hypertension and heart failure effectively. The increasing burden of chronic diseases thus fuels the demand for innovative and efficient treatment options, positioning peptide therapeutics as a vital component in the healthcare landscape.
Advancements in Peptide Synthesis and Delivery Technologies Drive Market Growth
Technological advancements in peptide synthesis, purification, and delivery methods have significantly boosted the peptide therapeutics market. These innovations enhance the efficacy, stability, and bioavailability of peptide drugs, making them more effective and patient-friendly. Modern drug delivery systems, such as transdermal patches and inhalation devices, have improved patient compliance and convenience. For example, Byetta (exenatide), a peptide drug for type 2 diabetes, is available in pen injectors, allowing for easy self-administration. These advancements not only enhance the therapeutic potential of peptide drugs but also widen their applicability across various medical conditions.
The development of advanced synthesis techniques, such as solid-phase peptide synthesis (SPPS) and liquid-phase peptide synthesis (LPPS), has enabled the production of complex peptides with high purity and yield. These techniques facilitate the large-scale manufacturing of peptide therapeutics, meeting the growing market demand. Additionally, innovations in delivery technologies, including liposomal encapsulation and nanoparticle-based systems, have improved the targeted delivery and controlled release of peptide drugs, further enhancing their clinical efficacy.
Increasing Investments in Peptide Research and Development Drive Market Growth
The surge in investments in peptide research and development by pharmaceutical companies and research institutions is a critical driver of the peptide therapeutics market. Recognizing the vast potential of peptide therapeutics in addressing unmet medical needs, significant funds are being allocated to explore new therapeutic applications and develop innovative peptide drugs. For example, Amgen's Evenity (romosozumab) is a monoclonal antibody that targets the protein sclerostin, regulating bone formation and treating osteoporosis in postmenopausal women. This drug's development highlights the role of substantial R&D investments in bringing novel peptide-based therapies to market.
These investments are fueling advancements in peptide science, leading to the discovery of new peptides with unique therapeutic properties. The focus on R&D also encourages collaboration between academic institutions and industry players, accelerating the translation of research findings into clinical applications. Furthermore, the increasing interest in personalized medicine is driving the development of tailored peptide therapies, designed to meet individual patient needs. As a result, the peptide therapeutics market is witnessing robust growth, driven by continuous innovation and the introduction of new and effective treatments.
Restraining Factors
High Manufacturing Costs Restrain Market Growth
The production of peptide drugs involves complex and costly processes, making manufacturing expensive. These intricate synthesis and purification steps require specialized facilities and equipment. This high cost limits the accessibility and affordability of peptide therapeutics, especially in developing countries.
For instance, insulin, a vital peptide hormone used to treat diabetes, requires complex fermentation and purification, driving up its production costs. High manufacturing expenses can restrict market growth as they make peptide drugs less affordable for patients and healthcare systems, reducing their widespread adoption. Additionally, these costs can hinder the ability of pharmaceutical companies to scale production and lower prices, ultimately limiting market expansion.
Stability and Delivery Challenges Restrain Market Growth
Peptide drugs face significant stability and delivery challenges that hinder their market growth. These drugs are prone to enzymatic degradation and have poor bioavailability when taken orally. This necessitates the development of specialized delivery systems, such as injectables, to ensure their effectiveness.
For example, Victoza (liraglutide), a peptide drug for type 2 diabetes, must be administered via subcutaneous injection due to its poor oral bioavailability. Developing these delivery systems can be complex and costly, increasing the overall expense of peptide therapies. These challenges limit the widespread use of peptide drugs and restrict market growth as they demand continuous innovation and higher production costs.
Product Type Analysis
Innovative products dominate with 57.3% due to cutting-edge advancements and higher efficacy.
The Peptide Therapeutics Market is divided into two primary product types: innovative and generic. Innovative peptide therapeutics dominate the market, accounting for 57.3% of the total share. This dominance is attributed to the continuous advancements in biotechnology and pharmaceutical research, leading to the development of novel peptide drugs with superior efficacy and safety profiles. Innovative peptides, such as glucagon-like peptide-1 (GLP-1) agonists and other advanced formulations, are designed to target specific disease pathways more effectively than traditional treatments.
These innovative products are crucial in treating complex and chronic conditions, such as diabetes, cancer, and cardiovascular diseases. For instance, the GLP-1 agonists, including Ozempic (semaglutide) and Trulicity (dulaglutide), have significantly improved the management of type 2 diabetes by enhancing glycemic control and reducing cardiovascular risks. The higher efficacy and targeted action of innovative peptide drugs make them a preferred choice among healthcare providers and patients, further driving their market share.
The remaining segment, generic peptide therapeutics, plays a vital role in the market by providing cost-effective alternatives to innovative drugs. Although generic peptides have a smaller market share, they are essential in making peptide therapeutics more accessible to a broader population, particularly in developing regions where healthcare budgets are constrained. Generic peptides help in reducing overall healthcare costs while maintaining the therapeutic benefits, thus supporting the growth of the peptide therapeutics market.
Application Analysis
Metabolic applications dominate with 32% due to rising diabetes and obesity prevalence.
The application segment of the Peptide Therapeutics Market is diverse, encompassing neurological, gastrointestinal, cardiovascular, metabolic, oncology, and other applications. Metabolic applications hold the largest market share, accounting for 32%. This dominance is driven by the increasing prevalence of metabolic disorders, such as diabetes and obesity, which require effective long-term management strategies. Peptide drugs like GLP-1 agonists and insulin analogs have revolutionized the treatment of metabolic conditions by offering enhanced efficacy and reduced side effects compared to traditional therapies.
The growing burden of diabetes globally, with millions of new cases diagnosed annually, underscores the critical need for advanced peptide therapeutics. According to the International Diabetes Federation, the global diabetic population is projected to rise significantly, driving the demand for peptide-based treatments. Additionally, the rising incidence of obesity, a major risk factor for various metabolic disorders, further fuels the demand for effective peptide therapeutics.
Other application segments, including neurological, gastrointestinal, cardiovascular, oncology, and others, also contribute to the market growth. These segments are supported by the development of specialized peptide drugs targeting specific pathways involved in these diseases. For instance, peptide therapeutics in oncology are designed to inhibit cancer cell proliferation and induce apoptosis, providing new avenues for cancer treatment. Similarly, cardiovascular peptide drugs help in managing hypertension and heart failure by targeting specific cardiovascular pathways.
Route of Administration Analysis
Parenteral route dominates with 31% due to higher bioavailability and rapid onset of action.
The route of administration is a critical factor in the efficacy and patient compliance of peptide therapeutics. The parenteral route, including injections and infusions, dominates the market with a 31% share. This dominance is due to the higher bioavailability and rapid onset of action provided by parenteral administration. Peptide drugs administered via the parenteral route bypass the digestive system, avoiding enzymatic degradation and ensuring that a higher concentration of the drug reaches the target site.
Peptide therapeutics like insulin and GLP-1 agonists are commonly administered parenterally to ensure maximum therapeutic effect. The development of advanced delivery systems, such as pen injectors and autoinjectors, has improved patient convenience and compliance, further supporting the dominance of the parenteral route. These systems allow patients to self-administer their medications with ease, enhancing treatment adherence and outcomes.
Other routes of administration, including pulmonary, oral, mucosal, and others, play a supportive role in the market. Pulmonary and mucosal routes are explored for their potential to offer non-invasive and patient-friendly alternatives. For instance, inhalable peptide drugs for conditions like asthma and chronic obstructive pulmonary disease (COPD) are under development. Oral peptide therapeutics face challenges due to poor bioavailability but hold promise with ongoing advancements in formulation technologies that enhance stability and absorption.
Manufacturing Type Analysis
In-house manufacturing dominates with 62% due to better quality control and proprietary technologies.
The manufacturing type segment of the Peptide Therapeutics Market is categorized into in-house and contract manufacturing organization (CMO) production. In-house manufacturing holds a dominant 62% share of the market. This dominance is driven by the advantages of better quality control, proprietary technologies, and the ability to closely monitor the production process. Pharmaceutical companies with in-house manufacturing capabilities can ensure the consistent quality and supply of peptide drugs, which is crucial for maintaining therapeutic efficacy and patient safety.
In-house manufacturing allows companies to protect their proprietary technologies and innovations, giving them a competitive edge in the market. This control over the manufacturing process also enables rapid response to market demands and regulatory changes, ensuring timely delivery of products. Additionally, in-house manufacturing supports the development of novel peptide drugs by facilitating close collaboration between research and production teams.
The CMO segment, while smaller in market share, is essential for companies without extensive manufacturing infrastructure. CMOs provide specialized services, including large-scale production and advanced synthesis capabilities, enabling smaller companies to bring their peptide therapeutics to market. The CMO segment also supports the scalability of production, allowing for the efficient handling of peak demands and large orders.
Synthesis Technology Analysis
Liquid Phase Peptide Synthesis (LPPS) dominates with 47% due to high purity and yield.
The synthesis technology segment of the Peptide Therapeutics Market includes solid-phase peptide synthesis (SPPS), liquid-phase peptide synthesis (LPPS), and hybrid technologies. LPPS holds the largest market share at 47%, owing to its ability to produce peptides with high purity and yield. LPPS is preferred for its scalability and efficiency in synthesizing large and complex peptides, making it ideal for commercial production.
LPPS involves the synthesis of peptides in a liquid medium, allowing for better control over reaction conditions and purification processes. This technology is particularly advantageous for producing long peptides and those with complex structures, which are often required in therapeutic applications. The high yield and purity of peptides produced by LPPS reduce the need for extensive purification, lowering overall production costs and enhancing market availability.
SPPS and hybrid technologies also play significant roles in the market. SPPS is widely used for synthesizing shorter peptides and those with simpler structures. It offers the advantage of rapid synthesis and ease of automation, making it suitable for research and early-stage drug development. Hybrid technologies combine the strengths of both LPPS and SPPS, providing flexibility and efficiency in peptide synthesis. These technologies are essential for advancing the development of new peptide drugs and meeting the diverse needs of the market.
Key Market Segments
By Product Type
- Innovative
- Generic
By Application
- Neurological
- Gastrointestinal
- Cardiovascular
- Metabolic
- Oncology
- Other Applications
By Route of Administration
- Parenteral Route
- Pulmonary
- Oral Route
- Mucosal
- Others
By Manufacturing Type
- In-house
- CMO
By Synthesis Technology
- Solid Phase Peptide Synthesis (SPPS)
- Liquid Phase Peptide Synthesis (LPPS)
- Hybrid Technology
Growth Opportunities
Targeted Therapies and Personalized Medicine Offer Growth Opportunity
Peptide therapeutics are ideal for targeted and personalized treatments, matching the personalized medicine trend. These drugs can be designed to target specific receptors or pathways, increasing efficacy and reducing side effects.
For example, Somavert (pegvisomant) targets growth hormone receptors to treat acromegaly. This specificity improves patient outcomes and minimizes adverse effects, making peptides suitable for personalized medicine. The growing focus on individualized treatments is driving research and development in this area, offering significant growth potential. As more personalized therapies emerge, the demand for peptide therapeutics is expected to rise, fostering market expansion.
Emerging Therapeutic Areas Offer Growth Opportunity
Peptide therapeutics are being explored in new therapeutic areas like regenerative medicine, immunotherapy, and neurodegenerative diseases. This expanding application scope provides significant growth opportunities for the market.
Researchers are investigating peptide-based therapies for conditions like Alzheimer's disease, showcasing the potential of peptides in treating complex disorders. The increasing investment in these emerging areas highlights the potential of peptide therapeutics to address unmet medical needs. As these therapies advance, the peptide therapeutics market is poised for substantial growth, driven by the development of innovative treatments for various diseases.
Trending Factors
Innovative Drug Delivery Systems Are Trending Factors
The development of innovative drug delivery systems, such as nanoparticles, liposomes, and transdermal patches, is a key trend in the peptide therapeutics market. These systems enhance peptide drug stability, bioavailability, and patient compliance. For instance, nanoparticle-based delivery systems are being explored for cancer-targeting peptide drugs.
These advancements improve the therapeutic efficacy and convenience of peptide treatments. As research progresses, these innovative delivery methods are expected to drive market growth, making peptide therapies more effective and accessible. This trend reflects the industry's focus on improving drug delivery technologies to enhance patient outcomes.
Biosimilars and Generics Are Trending Factors
The expiration of patents for several peptide drugs is leading to the development of biosimilars and generics, which is a significant market trend. These alternatives can drive market growth by improving drug affordability and accessibility.
However, regulatory challenges and approval processes for biosimilars need to be addressed. The development of biosimilars and generics is expected to increase, providing more treatment options for patients. This trend highlights the potential for cost-effective peptide therapeutics to expand the market, making advanced treatments available to a broader population.
Regional Analysis
North America Dominates with 42% Market Share
North America's dominance in the peptide therapeutics market is driven by advanced healthcare infrastructure, significant R&D investments, and a high prevalence of chronic diseases. The presence of leading pharmaceutical companies and robust funding for biotech research further boosts market growth. For instance, the U.S. alone contributes significantly to R&D, with numerous clinical trials and drug approvals enhancing market potential.
The region benefits from strong regulatory frameworks and favorable government policies that support drug development and commercialization. High healthcare expenditure and widespread adoption of advanced medical technologies contribute to the market's growth. Additionally, the growing awareness and acceptance of peptide therapeutics among healthcare professionals and patients enhance market dynamics.
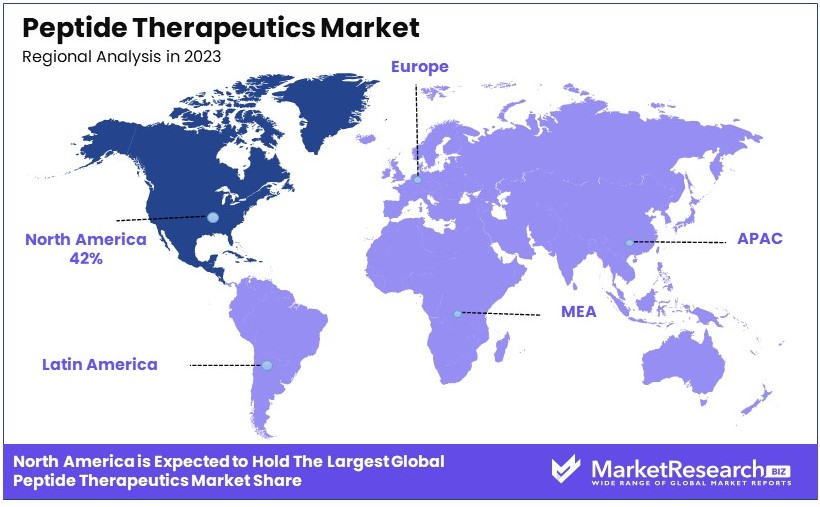
Europe: 27% Market Share
Europe holds a 27% share in the peptide therapeutics market, driven by strong healthcare systems and significant R&D investments. The region benefits from collaborations between academic institutions and pharmaceutical companies, fostering innovation. Countries like Germany, France, and the UK are key contributors. Europe’s market is characterized by high regulatory standards and a focus on personalized medicine, supporting market growth.
Asia Pacific: 20% Market Share
Asia Pacific accounts for 20% of the peptide therapeutics market, with rapid growth attributed to increasing healthcare expenditure and improving healthcare infrastructure. Countries like China, Japan, and India are major contributors, with rising investments in biotech research. The growing prevalence of chronic diseases and increasing adoption of advanced therapies drive market expansion in this region.
Middle East & Africa: 6% Market Share
The Middle East & Africa hold a 6% share of the peptide therapeutics market. Growth in this region is driven by improving healthcare infrastructure and increasing government investments in healthcare. Countries like Saudi Arabia and South Africa are focusing on enhancing their healthcare systems, which supports market growth. However, limited access to advanced treatments remains a challenge.
Latin America: 5% Market Share
Latin America accounts for 5% of the peptide therapeutics market. The region's growth is supported by increasing healthcare awareness and rising investments in healthcare infrastructure. Brazil and Mexico are key markets, with growing adoption of advanced medical treatments. Economic instability and limited healthcare access in some areas pose challenges to market growth.
Key Regions and Countries
- North America
- The US
- Canada
- Mexico
- Western Europe
- Germany
- France
- The UK
- Spain
- Italy
- Portugal
- Ireland
- Austria
- Switzerland
- Benelux
- Nordic
- Rest of Western Europe
- Eastern Europe
- Russia
- Poland
- The Czech Republic
- Greece
- Rest of Eastern Europe
- APAC
- China
- Japan
- South Korea
- India
- Australia & New Zealand
- Indonesia
- Malaysia
- Philippines
- Singapore
- Thailand
- Vietnam
- Rest of APAC
- Latin America
- Brazil
- Colombia
- Chile
- Argentina
- Costa Rica
- Rest of Latin America
- Middle East & Africa
- Algeria
- Egypt
- Israel
- Kuwait
- Nigeria
- Saudi Arabia
- South Africa
- Turkey
- United Arab Emirates
- Rest of MEA
Key Players Analysis
The Peptide Therapeutics Market features prominent companies with significant impact, strategic positioning, and market influence. Key players like Eli Lilly and Company, Amgen Inc., and Pfizer Inc. leverage their extensive R&D capabilities and robust product portfolios to drive market growth. These companies invest heavily in innovative peptide drug development and advanced delivery systems, ensuring a competitive edge.
Takeda Pharmaceutical Company Limited and Teva Pharmaceutical Industries Ltd. focus on expanding their peptide therapeutics pipeline through strategic collaborations and acquisitions, enhancing their market presence. AstraZeneca and Sanofi utilize their global reach and strong distribution networks to maintain significant market influence.
Novartis AG, F. Hoffmann-La Roche Ltd, and GlaxoSmithKline plc. emphasize personalized medicine and targeted therapies, aligning with the precision medicine trend to capture market share. Novo Nordisk A/S leads in diabetes treatment with its advanced peptide drugs, reinforcing its dominant position.
Radius Health, Inc. and Ironwood Pharmaceuticals, Inc. focus on niche therapeutic areas, driving innovation and market differentiation. Other key players continue to contribute to market dynamics through strategic initiatives and competitive strategies, collectively enhancing the growth and development of the peptide therapeutics market.
Market Key Players
- Eli Lilly and Company
- Amgen Inc.
- Pfizer Inc.
- Takeda Pharmaceutical Company Limited
- Teva Pharmaceutical Industries Ltd.
- AstraZeneca
- Sanofi
- Novartis AG
- F. Hoffmann-La Roche Ltd
- GlaxoSmithKline plc.
- Novo Nordisk A/S
- Radius Health, Inc.
- Ironwood Pharmaceuticals, Inc.
- Other Key Players
Recent Developments
- May 2024: Secarna Pharmaceuticals and Orbit Discovery entered a collaboration to discover and develop peptide-conjugated targeted antisense oligonucleotide (ASO) therapeutics. Under the partnership, Orbit's expertise in peptide discovery will be utilized to identify, screen, and select cyclic peptides targeting a broad spectrum of disease indications.
- May 2024: Orbis Medicines, a startup backed by €26 million in seed financing, aimed to develop next-generation peptide drugs. The company's technology can generate up to 100,000 compounds against a given target, leveraging machine learning techniques to predict the next set of compounds to make.
- April 2024: ARTHEx Biotech announced an oral presentation on ATX-01 at the Oligonucleotide & Peptide Therapeutics (TIDES) Conference 2024. The presentation highlighted the use of a lipophilic-conjugation to deliver antimiR-23b into skeletal muscle and the nervous system as a dual therapeutic approach in DM1.
Report Scope
Report Features Description Market Value (2023) USD 47.2 Million Forecast Revenue (2033) USD 93.0 Million CAGR (2024-2033) 7.2% Base Year for Estimation 2023 Historic Period 2018-2023 Forecast Period 2024-2033 Report Coverage Revenue Forecast, Market Dynamics, Competitive Landscape, Recent Developments Segments Covered By Product Type (Innovative, Generic), By Application (Neurological, Gastrointestinal, Cardiovascular, Metabolic, Oncology, Other Applications), By Route of Administration (Parenteral Route, Pulmonary, Oral Route, Mucosal, Others), By Manufacturing Type (In-house, CMO), By Synthesis Technology (Solid Phase Peptide Synthesis (SPPS), Liquid Phase Peptide Synthesis (LPPS), Hybrid Technology) Regional Analysis North America - The US, Canada, & Mexico; Western Europe - Germany, France, The UK, Spain, Italy, Portugal, Ireland, Austria, Switzerland, Benelux, Nordic, & Rest of Western Europe; Eastern Europe - Russia, Poland, The Czech Republic, Greece, & Rest of Eastern Europe; APAC - China, Japan, South Korea, India, Australia & New Zealand, Indonesia, Malaysia, Philippines, Singapore, Thailand, Vietnam, & Rest of APAC; Latin America - Brazil, Colombia, Chile, Argentina, Costa Rica, & Rest of Latin America; Middle East & Africa - Algeria, Egypt, Israel, Kuwait, Nigeria, Saudi Arabia, South Africa, Turkey, United Arab Emirates, & Rest of MEA Competitive Landscape Eli Lilly and Company, Amgen Inc., Pfizer Inc., Takeda Pharmaceutical Company Limited, Teva Pharmaceutical Industries Ltd., AstraZeneca, Sanofi, Novartis AG, F. Hoffmann-La Roche Ltd, GlaxoSmithKline plc., Novo Nordisk A/S, Radius Health, Inc., Ironwood Pharmaceuticals, Inc., Other Key Players Customization Scope Customization for segments, region/country-level will be provided. Moreover, additional customization can be done based on the requirements. Purchase Options We have three licenses to opt for: Single User License, Multi-User License (Up to 5 Users), Corporate Use License (Unlimited User and Printable PDF) -
- 1. Executive Summary
- 1.1. Definition
- 1.2. Taxonomy
- 1.3. Research Scope
- 1.4. Key Analysis
- 1.5. Key Findings by Major Segments
- 1.6. Top strategies by Major Players
- 2. Global Peptide Therapeutics Market Overview
- 2.1. Peptide Therapeutics Market Dynamics
- 2.1.1. Drivers
- 2.1.2. Opportunities
- 2.1.3. Restraints
- 2.1.4. Challenges
- 2.2. Macro-economic Factors
- 2.3. Regulatory Framework
- 2.4. Market Investment Feasibility Index
- 2.5. PEST Analysis
- 2.6. PORTER’S Five Force Analysis
- 2.7. Drivers & Restraints Impact Analysis
- 2.8. Industry Chain Analysis
- 2.9. Cost Structure Analysis
- 2.10. Marketing Strategy
- 2.11. Russia-Ukraine War Impact Analysis
- 2.12. Opportunity Map Analysis
- 2.13. Market Competition Scenario Analysis
- 2.14. Product Life Cycle Analysis
- 2.15. Opportunity Orbits
- 2.16. Manufacturer Intensity Map
- 2.17. Major Companies sales by Value & Volume
- 2.1. Peptide Therapeutics Market Dynamics
- 3. Global Peptide Therapeutics Market Analysis, Opportunity and Forecast, 2016-2032
- 3.1. Global Peptide Therapeutics Market Analysis, 2016-2021
- 3.2. Global Peptide Therapeutics Market Opportunity and Forecast, 2023-2032
- 3.3. Global Peptide Therapeutics Market Analysis, Opportunity and Forecast, By Product Type, 2016-2032
- 3.3.1. Global Peptide Therapeutics Market Analysis by Product Type: Introduction
- 3.3.2. Market Size Absolute $ Opportunity Analysis and Forecast, By Product Type, 2016-2032
- 3.3.3. Innovative
- 3.3.4. Generic
- 3.4. Global Peptide Therapeutics Market Analysis, Opportunity and Forecast, By Application, 2016-2032
- 3.4.1. Global Peptide Therapeutics Market Analysis by Application: Introduction
- 3.4.2. Market Size Absolute $ Opportunity Analysis and Forecast, By Application, 2016-2032
- 3.4.3. Neurological
- 3.4.4. Gastrointestinal
- 3.4.5. Cardiovascular
- 3.4.6. Metabolic
- 3.4.7. Oncology
- 3.4.8. Other Applications
- 3.5. Global Peptide Therapeutics Market Analysis, Opportunity and Forecast, By Route of Administration, 2016-2032
- 3.5.1. Global Peptide Therapeutics Market Analysis by Route of Administration: Introduction
- 3.5.2. Market Size Absolute $ Opportunity Analysis and Forecast, By Route of Administration, 2016-2032
- 3.5.3. Parenteral Route
- 3.5.4. Pulmonary
- 3.5.5. Oral Route
- 3.5.6. Mucosal
- 3.5.7. Others
- 3.6. Global Peptide Therapeutics Market Analysis, Opportunity and Forecast, By Manufacturing Type, 2016-2032
- 3.6.1. Global Peptide Therapeutics Market Analysis by Manufacturing Type: Introduction
- 3.6.2. Market Size Absolute $ Opportunity Analysis and Forecast, By Manufacturing Type, 2016-2032
- 3.6.3. In-house
- 3.6.4. CMO
- 3.7. Global Peptide Therapeutics Market Analysis, Opportunity and Forecast, By Synthesis Technology, 2016-2032
- 3.7.1. Global Peptide Therapeutics Market Analysis by Synthesis Technology: Introduction
- 3.7.2. Market Size Absolute $ Opportunity Analysis and Forecast, By Synthesis Technology, 2016-2032
- 3.7.3. Solid Phase Peptide Synthesis (SPPS)
- 3.7.4. Liquid Phase Peptide Synthesis (LPPS)
- 3.7.5. Hybrid Technology
- 4. North America Peptide Therapeutics Market Analysis, Opportunity and Forecast, 2016-2032
- 4.1. North America Peptide Therapeutics Market Analysis, 2016-2021
- 4.2. North America Peptide Therapeutics Market Opportunity and Forecast, 2023-2032
- 4.3. North America Peptide Therapeutics Market Analysis, Opportunity and Forecast, By Product Type, 2016-2032
- 4.3.1. North America Peptide Therapeutics Market Analysis by Product Type: Introduction
- 4.3.2. Market Size Absolute $ Opportunity Analysis and Forecast, By Product Type, 2016-2032
- 4.3.3. Innovative
- 4.3.4. Generic
- 4.4. North America Peptide Therapeutics Market Analysis, Opportunity and Forecast, By Application, 2016-2032
- 4.4.1. North America Peptide Therapeutics Market Analysis by Application: Introduction
- 4.4.2. Market Size Absolute $ Opportunity Analysis and Forecast, By Application, 2016-2032
- 4.4.3. Neurological
- 4.4.4. Gastrointestinal
- 4.4.5. Cardiovascular
- 4.4.6. Metabolic
- 4.4.7. Oncology
- 4.4.8. Other Applications
- 4.5. North America Peptide Therapeutics Market Analysis, Opportunity and Forecast, By Route of Administration, 2016-2032
- 4.5.1. North America Peptide Therapeutics Market Analysis by Route of Administration: Introduction
- 4.5.2. Market Size Absolute $ Opportunity Analysis and Forecast, By Route of Administration, 2016-2032
- 4.5.3. Parenteral Route
- 4.5.4. Pulmonary
- 4.5.5. Oral Route
- 4.5.6. Mucosal
- 4.5.7. Others
- 4.6. North America Peptide Therapeutics Market Analysis, Opportunity and Forecast, By Manufacturing Type, 2016-2032
- 4.6.1. North America Peptide Therapeutics Market Analysis by Manufacturing Type: Introduction
- 4.6.2. Market Size Absolute $ Opportunity Analysis and Forecast, By Manufacturing Type, 2016-2032
- 4.6.3. In-house
- 4.6.4. CMO
- 4.7. North America Peptide Therapeutics Market Analysis, Opportunity and Forecast, By Synthesis Technology, 2016-2032
- 4.7.1. North America Peptide Therapeutics Market Analysis by Synthesis Technology: Introduction
- 4.7.2. Market Size Absolute $ Opportunity Analysis and Forecast, By Synthesis Technology, 2016-2032
- 4.7.3. Solid Phase Peptide Synthesis (SPPS)
- 4.7.4. Liquid Phase Peptide Synthesis (LPPS)
- 4.7.5. Hybrid Technology
- 4.8. North America Peptide Therapeutics Market Analysis, Opportunity and Forecast, By Country , 2016-2032
- 4.8.1. North America Peptide Therapeutics Market Analysis by Country : Introduction
- 4.8.2. Market Size Absolute $ Opportunity Analysis and Forecast, Country , 2016-2032
- 4.8.2.1. The US
- 4.8.2.2. Canada
- 4.8.2.3. Mexico
- 5. Western Europe Peptide Therapeutics Market Analysis, Opportunity and Forecast, 2016-2032
- 5.1. Western Europe Peptide Therapeutics Market Analysis, 2016-2021
- 5.2. Western Europe Peptide Therapeutics Market Opportunity and Forecast, 2023-2032
- 5.3. Western Europe Peptide Therapeutics Market Analysis, Opportunity and Forecast, By Product Type, 2016-2032
- 5.3.1. Western Europe Peptide Therapeutics Market Analysis by Product Type: Introduction
- 5.3.2. Market Size Absolute $ Opportunity Analysis and Forecast, By Product Type, 2016-2032
- 5.3.3. Innovative
- 5.3.4. Generic
- 5.4. Western Europe Peptide Therapeutics Market Analysis, Opportunity and Forecast, By Application, 2016-2032
- 5.4.1. Western Europe Peptide Therapeutics Market Analysis by Application: Introduction
- 5.4.2. Market Size Absolute $ Opportunity Analysis and Forecast, By Application, 2016-2032
- 5.4.3. Neurological
- 5.4.4. Gastrointestinal
- 5.4.5. Cardiovascular
- 5.4.6. Metabolic
- 5.4.7. Oncology
- 5.4.8. Other Applications
- 5.5. Western Europe Peptide Therapeutics Market Analysis, Opportunity and Forecast, By Route of Administration, 2016-2032
- 5.5.1. Western Europe Peptide Therapeutics Market Analysis by Route of Administration: Introduction
- 5.5.2. Market Size Absolute $ Opportunity Analysis and Forecast, By Route of Administration, 2016-2032
- 5.5.3. Parenteral Route
- 5.5.4. Pulmonary
- 5.5.5. Oral Route
- 5.5.6. Mucosal
- 5.5.7. Others
- 5.6. Western Europe Peptide Therapeutics Market Analysis, Opportunity and Forecast, By Manufacturing Type, 2016-2032
- 5.6.1. Western Europe Peptide Therapeutics Market Analysis by Manufacturing Type: Introduction
- 5.6.2. Market Size Absolute $ Opportunity Analysis and Forecast, By Manufacturing Type, 2016-2032
- 5.6.3. In-house
- 5.6.4. CMO
- 5.7. Western Europe Peptide Therapeutics Market Analysis, Opportunity and Forecast, By Synthesis Technology, 2016-2032
- 5.7.1. Western Europe Peptide Therapeutics Market Analysis by Synthesis Technology: Introduction
- 5.7.2. Market Size Absolute $ Opportunity Analysis and Forecast, By Synthesis Technology, 2016-2032
- 5.7.3. Solid Phase Peptide Synthesis (SPPS)
- 5.7.4. Liquid Phase Peptide Synthesis (LPPS)
- 5.7.5. Hybrid Technology
- 5.8. Western Europe Peptide Therapeutics Market Analysis, Opportunity and Forecast, By Country , 2016-2032
- 5.8.1. Western Europe Peptide Therapeutics Market Analysis by Country : Introduction
- 5.8.2. Market Size Absolute $ Opportunity Analysis and Forecast, Country , 2016-2032
- 5.8.2.1. Germany
- 5.8.2.2. France
- 5.8.2.3. The UK
- 5.8.2.4. Spain
- 5.8.2.5. Italy
- 5.8.2.6. Portugal
- 5.8.2.7. Ireland
- 5.8.2.8. Austria
- 5.8.2.9. Switzerland
- 5.8.2.10. Benelux
- 5.8.2.11. Nordic
- 5.8.2.12. Rest of Western Europe
- 6. Eastern Europe Peptide Therapeutics Market Analysis, Opportunity and Forecast, 2016-2032
- 6.1. Eastern Europe Peptide Therapeutics Market Analysis, 2016-2021
- 6.2. Eastern Europe Peptide Therapeutics Market Opportunity and Forecast, 2023-2032
- 6.3. Eastern Europe Peptide Therapeutics Market Analysis, Opportunity and Forecast, By Product Type, 2016-2032
- 6.3.1. Eastern Europe Peptide Therapeutics Market Analysis by Product Type: Introduction
- 6.3.2. Market Size Absolute $ Opportunity Analysis and Forecast, By Product Type, 2016-2032
- 6.3.3. Innovative
- 6.3.4. Generic
- 6.4. Eastern Europe Peptide Therapeutics Market Analysis, Opportunity and Forecast, By Application, 2016-2032
- 6.4.1. Eastern Europe Peptide Therapeutics Market Analysis by Application: Introduction
- 6.4.2. Market Size Absolute $ Opportunity Analysis and Forecast, By Application, 2016-2032
- 6.4.3. Neurological
- 6.4.4. Gastrointestinal
- 6.4.5. Cardiovascular
- 6.4.6. Metabolic
- 6.4.7. Oncology
- 6.4.8. Other Applications
- 6.5. Eastern Europe Peptide Therapeutics Market Analysis, Opportunity and Forecast, By Route of Administration, 2016-2032
- 6.5.1. Eastern Europe Peptide Therapeutics Market Analysis by Route of Administration: Introduction
- 6.5.2. Market Size Absolute $ Opportunity Analysis and Forecast, By Route of Administration, 2016-2032
- 6.5.3. Parenteral Route
- 6.5.4. Pulmonary
- 6.5.5. Oral Route
- 6.5.6. Mucosal
- 6.5.7. Others
- 6.6. Eastern Europe Peptide Therapeutics Market Analysis, Opportunity and Forecast, By Manufacturing Type, 2016-2032
- 6.6.1. Eastern Europe Peptide Therapeutics Market Analysis by Manufacturing Type: Introduction
- 6.6.2. Market Size Absolute $ Opportunity Analysis and Forecast, By Manufacturing Type, 2016-2032
- 6.6.3. In-house
- 6.6.4. CMO
- 6.7. Eastern Europe Peptide Therapeutics Market Analysis, Opportunity and Forecast, By Synthesis Technology, 2016-2032
- 6.7.1. Eastern Europe Peptide Therapeutics Market Analysis by Synthesis Technology: Introduction
- 6.7.2. Market Size Absolute $ Opportunity Analysis and Forecast, By Synthesis Technology, 2016-2032
- 6.7.3. Solid Phase Peptide Synthesis (SPPS)
- 6.7.4. Liquid Phase Peptide Synthesis (LPPS)
- 6.7.5. Hybrid Technology
- 6.8. Eastern Europe Peptide Therapeutics Market Analysis, Opportunity and Forecast, By Country , 2016-2032
- 6.8.1. Eastern Europe Peptide Therapeutics Market Analysis by Country : Introduction
- 6.8.2. Market Size Absolute $ Opportunity Analysis and Forecast, Country , 2016-2032
- 6.8.2.1. Russia
- 6.8.2.2. Poland
- 6.8.2.3. The Czech Republic
- 6.8.2.4. Greece
- 6.8.2.5. Rest of Eastern Europe
- 7. APAC Peptide Therapeutics Market Analysis, Opportunity and Forecast, 2016-2032
- 7.1. APAC Peptide Therapeutics Market Analysis, 2016-2021
- 7.2. APAC Peptide Therapeutics Market Opportunity and Forecast, 2023-2032
- 7.3. APAC Peptide Therapeutics Market Analysis, Opportunity and Forecast, By Product Type, 2016-2032
- 7.3.1. APAC Peptide Therapeutics Market Analysis by Product Type: Introduction
- 7.3.2. Market Size Absolute $ Opportunity Analysis and Forecast, By Product Type, 2016-2032
- 7.3.3. Innovative
- 7.3.4. Generic
- 7.4. APAC Peptide Therapeutics Market Analysis, Opportunity and Forecast, By Application, 2016-2032
- 7.4.1. APAC Peptide Therapeutics Market Analysis by Application: Introduction
- 7.4.2. Market Size Absolute $ Opportunity Analysis and Forecast, By Application, 2016-2032
- 7.4.3. Neurological
- 7.4.4. Gastrointestinal
- 7.4.5. Cardiovascular
- 7.4.6. Metabolic
- 7.4.7. Oncology
- 7.4.8. Other Applications
- 7.5. APAC Peptide Therapeutics Market Analysis, Opportunity and Forecast, By Route of Administration, 2016-2032
- 7.5.1. APAC Peptide Therapeutics Market Analysis by Route of Administration: Introduction
- 7.5.2. Market Size Absolute $ Opportunity Analysis and Forecast, By Route of Administration, 2016-2032
- 7.5.3. Parenteral Route
- 7.5.4. Pulmonary
- 7.5.5. Oral Route
- 7.5.6. Mucosal
- 7.5.7. Others
- 7.6. APAC Peptide Therapeutics Market Analysis, Opportunity and Forecast, By Manufacturing Type, 2016-2032
- 7.6.1. APAC Peptide Therapeutics Market Analysis by Manufacturing Type: Introduction
- 7.6.2. Market Size Absolute $ Opportunity Analysis and Forecast, By Manufacturing Type, 2016-2032
- 7.6.3. In-house
- 7.6.4. CMO
- 7.7. APAC Peptide Therapeutics Market Analysis, Opportunity and Forecast, By Synthesis Technology, 2016-2032
- 7.7.1. APAC Peptide Therapeutics Market Analysis by Synthesis Technology: Introduction
- 7.7.2. Market Size Absolute $ Opportunity Analysis and Forecast, By Synthesis Technology, 2016-2032
- 7.7.3. Solid Phase Peptide Synthesis (SPPS)
- 7.7.4. Liquid Phase Peptide Synthesis (LPPS)
- 7.7.5. Hybrid Technology
- 7.8. APAC Peptide Therapeutics Market Analysis, Opportunity and Forecast, By Country , 2016-2032
- 7.8.1. APAC Peptide Therapeutics Market Analysis by Country : Introduction
- 7.8.2. Market Size Absolute $ Opportunity Analysis and Forecast, Country , 2016-2032
- 7.8.2.1. China
- 7.8.2.2. Japan
- 7.8.2.3. South Korea
- 7.8.2.4. India
- 7.8.2.5. Australia & New Zeland
- 7.8.2.6. Indonesia
- 7.8.2.7. Malaysia
- 7.8.2.8. Philippines
- 7.8.2.9. Singapore
- 7.8.2.10. Thailand
- 7.8.2.11. Vietnam
- 7.8.2.12. Rest of APAC
- 8. Latin America Peptide Therapeutics Market Analysis, Opportunity and Forecast, 2016-2032
- 8.1. Latin America Peptide Therapeutics Market Analysis, 2016-2021
- 8.2. Latin America Peptide Therapeutics Market Opportunity and Forecast, 2023-2032
- 8.3. Latin America Peptide Therapeutics Market Analysis, Opportunity and Forecast, By Product Type, 2016-2032
- 8.3.1. Latin America Peptide Therapeutics Market Analysis by Product Type: Introduction
- 8.3.2. Market Size Absolute $ Opportunity Analysis and Forecast, By Product Type, 2016-2032
- 8.3.3. Innovative
- 8.3.4. Generic
- 8.4. Latin America Peptide Therapeutics Market Analysis, Opportunity and Forecast, By Application, 2016-2032
- 8.4.1. Latin America Peptide Therapeutics Market Analysis by Application: Introduction
- 8.4.2. Market Size Absolute $ Opportunity Analysis and Forecast, By Application, 2016-2032
- 8.4.3. Neurological
- 8.4.4. Gastrointestinal
- 8.4.5. Cardiovascular
- 8.4.6. Metabolic
- 8.4.7. Oncology
- 8.4.8. Other Applications
- 8.5. Latin America Peptide Therapeutics Market Analysis, Opportunity and Forecast, By Route of Administration, 2016-2032
- 8.5.1. Latin America Peptide Therapeutics Market Analysis by Route of Administration: Introduction
- 8.5.2. Market Size Absolute $ Opportunity Analysis and Forecast, By Route of Administration, 2016-2032
- 8.5.3. Parenteral Route
- 8.5.4. Pulmonary
- 8.5.5. Oral Route
- 8.5.6. Mucosal
- 8.5.7. Others
- 8.6. Latin America Peptide Therapeutics Market Analysis, Opportunity and Forecast, By Manufacturing Type, 2016-2032
- 8.6.1. Latin America Peptide Therapeutics Market Analysis by Manufacturing Type: Introduction
- 8.6.2. Market Size Absolute $ Opportunity Analysis and Forecast, By Manufacturing Type, 2016-2032
- 8.6.3. In-house
- 8.6.4. CMO
- 8.7. Latin America Peptide Therapeutics Market Analysis, Opportunity and Forecast, By Synthesis Technology, 2016-2032
- 8.7.1. Latin America Peptide Therapeutics Market Analysis by Synthesis Technology: Introduction
- 8.7.2. Market Size Absolute $ Opportunity Analysis and Forecast, By Synthesis Technology, 2016-2032
- 8.7.3. Solid Phase Peptide Synthesis (SPPS)
- 8.7.4. Liquid Phase Peptide Synthesis (LPPS)
- 8.7.5. Hybrid Technology
- 8.8. Latin America Peptide Therapeutics Market Analysis, Opportunity and Forecast, By Country , 2016-2032
- 8.8.1. Latin America Peptide Therapeutics Market Analysis by Country : Introduction
- 8.8.2. Market Size Absolute $ Opportunity Analysis and Forecast, Country , 2016-2032
- 8.8.2.1. Brazil
- 8.8.2.2. Colombia
- 8.8.2.3. Chile
- 8.8.2.4. Argentina
- 8.8.2.5. Costa Rica
- 8.8.2.6. Rest of Latin America
- 9. Middle East & Africa Peptide Therapeutics Market Analysis, Opportunity and Forecast, 2016-2032
- 9.1. Middle East & Africa Peptide Therapeutics Market Analysis, 2016-2021
- 9.2. Middle East & Africa Peptide Therapeutics Market Opportunity and Forecast, 2023-2032
- 9.3. Middle East & Africa Peptide Therapeutics Market Analysis, Opportunity and Forecast, By Product Type, 2016-2032
- 9.3.1. Middle East & Africa Peptide Therapeutics Market Analysis by Product Type: Introduction
- 9.3.2. Market Size Absolute $ Opportunity Analysis and Forecast, By Product Type, 2016-2032
- 9.3.3. Innovative
- 9.3.4. Generic
- 9.4. Middle East & Africa Peptide Therapeutics Market Analysis, Opportunity and Forecast, By Application, 2016-2032
- 9.4.1. Middle East & Africa Peptide Therapeutics Market Analysis by Application: Introduction
- 9.4.2. Market Size Absolute $ Opportunity Analysis and Forecast, By Application, 2016-2032
- 9.4.3. Neurological
- 9.4.4. Gastrointestinal
- 9.4.5. Cardiovascular
- 9.4.6. Metabolic
- 9.4.7. Oncology
- 9.4.8. Other Applications
- 9.5. Middle East & Africa Peptide Therapeutics Market Analysis, Opportunity and Forecast, By Route of Administration, 2016-2032
- 9.5.1. Middle East & Africa Peptide Therapeutics Market Analysis by Route of Administration: Introduction
- 9.5.2. Market Size Absolute $ Opportunity Analysis and Forecast, By Route of Administration, 2016-2032
- 9.5.3. Parenteral Route
- 9.5.4. Pulmonary
- 9.5.5. Oral Route
- 9.5.6. Mucosal
- 9.5.7. Others
- 9.6. Middle East & Africa Peptide Therapeutics Market Analysis, Opportunity and Forecast, By Manufacturing Type, 2016-2032
- 9.6.1. Middle East & Africa Peptide Therapeutics Market Analysis by Manufacturing Type: Introduction
- 9.6.2. Market Size Absolute $ Opportunity Analysis and Forecast, By Manufacturing Type, 2016-2032
- 9.6.3. In-house
- 9.6.4. CMO
- 9.7. Middle East & Africa Peptide Therapeutics Market Analysis, Opportunity and Forecast, By Synthesis Technology, 2016-2032
- 9.7.1. Middle East & Africa Peptide Therapeutics Market Analysis by Synthesis Technology: Introduction
- 9.7.2. Market Size Absolute $ Opportunity Analysis and Forecast, By Synthesis Technology, 2016-2032
- 9.7.3. Solid Phase Peptide Synthesis (SPPS)
- 9.7.4. Liquid Phase Peptide Synthesis (LPPS)
- 9.7.5. Hybrid Technology
- 9.8. Middle East & Africa Peptide Therapeutics Market Analysis, Opportunity and Forecast, By Country , 2016-2032
- 9.8.1. Middle East & Africa Peptide Therapeutics Market Analysis by Country : Introduction
- 9.8.2. Market Size Absolute $ Opportunity Analysis and Forecast, Country , 2016-2032
- 9.8.2.1. Algeria
- 9.8.2.2. Egypt
- 9.8.2.3. Israel
- 9.8.2.4. Kuwait
- 9.8.2.5. Nigeria
- 9.8.2.6. Saudi Arabia
- 9.8.2.7. South Africa
- 9.8.2.8. Turkey
- 9.8.2.9. The UAE
- 9.8.2.10. Rest of MEA
- 10. Global Peptide Therapeutics Market Analysis, Opportunity and Forecast, By Region , 2016-2032
- 10.1. Global Peptide Therapeutics Market Analysis by Region : Introduction
- 10.2. Market Size Absolute $ Opportunity Analysis and Forecast, By Region , 2016-2032
- 10.2.1. North America
- 10.2.2. Western Europe
- 10.2.3. Eastern Europe
- 10.2.4. APAC
- 10.2.5. Latin America
- 10.2.6. Middle East & Africa
- 11. Global Peptide Therapeutics Market Competitive Landscape, Market Share Analysis, and Company Profiles
- 11.1. Market Share Analysis
- 11.2. Company Profiles
- 11.3. Eli Lilly and Company
- 11.3.1. Company Overview
- 11.3.2. Financial Highlights
- 11.3.3. Product Portfolio
- 11.3.4. SWOT Analysis
- 11.3.5. Key Strategies and Developments
- 11.4. Amgen Inc.
- 11.4.1. Company Overview
- 11.4.2. Financial Highlights
- 11.4.3. Product Portfolio
- 11.4.4. SWOT Analysis
- 11.4.5. Key Strategies and Developments
- 11.5. Pfizer Inc.
- 11.5.1. Company Overview
- 11.5.2. Financial Highlights
- 11.5.3. Product Portfolio
- 11.5.4. SWOT Analysis
- 11.5.5. Key Strategies and Developments
- 11.6. Takeda Pharmaceutical Company Limited
- 11.6.1. Company Overview
- 11.6.2. Financial Highlights
- 11.6.3. Product Portfolio
- 11.6.4. SWOT Analysis
- 11.6.5. Key Strategies and Developments
- 11.7. Teva Pharmaceutical Industries Ltd.
- 11.7.1. Company Overview
- 11.7.2. Financial Highlights
- 11.7.3. Product Portfolio
- 11.7.4. SWOT Analysis
- 11.7.5. Key Strategies and Developments
- 11.8. AstraZeneca
- 11.8.1. Company Overview
- 11.8.2. Financial Highlights
- 11.8.3. Product Portfolio
- 11.8.4. SWOT Analysis
- 11.8.5. Key Strategies and Developments
- 11.9. Sanofi
- 11.9.1. Company Overview
- 11.9.2. Financial Highlights
- 11.9.3. Product Portfolio
- 11.9.4. SWOT Analysis
- 11.9.5. Key Strategies and Developments
- 11.10. Novartis AG
- 11.10.1. Company Overview
- 11.10.2. Financial Highlights
- 11.10.3. Product Portfolio
- 11.10.4. SWOT Analysis
- 11.10.5. Key Strategies and Developments
- 11.11. F. Hoffmann-La Roche Ltd
- 11.11.1. Company Overview
- 11.11.2. Financial Highlights
- 11.11.3. Product Portfolio
- 11.11.4. SWOT Analysis
- 11.11.5. Key Strategies and Developments
- 11.12. GlaxoSmithKline plc.
- 11.12.1. Company Overview
- 11.12.2. Financial Highlights
- 11.12.3. Product Portfolio
- 11.12.4. SWOT Analysis
- 11.12.5. Key Strategies and Developments
- 11.13.1. Company Overview
- 11.13.2. Financial Highlights
- 11.13.3. Product Portfolio
- 11.13.4. SWOT Analysis
- 11.13.5. Key Strategies and Developments
- 11.14. Novo Nordisk A/S
- 11.14.1. Company Overview
- 11.14.2. Financial Highlights
- 11.14.3. Product Portfolio
- 11.14.4. SWOT Analysis
- 11.14.5. Key Strategies and Developments
- 11.15. Ironwood Pharmaceuticals, Inc.
- 11.15.1. Company Overview
- 11.15.2. Financial Highlights
- 11.15.3. Product Portfolio
- 11.15.4. SWOT Analysis
- 11.15.5. Key Strategies and Developments
- 11.16. Other Key Players
- 11.16.1. Company Overview
- 11.16.2. Financial Highlights
- 11.16.3. Product Portfolio
- 11.16.4. SWOT Analysis
- 11.16.5. Key Strategies and Developments
- 12. Assumptions and Acronyms
- 13. Research Methodology
- 14. Contact
- List of Figures
- Figure 1: Global Peptide Therapeutics Market Revenue (US$ Mn) Market Share by Product Type in 2022
- Figure 2: Global Peptide Therapeutics Market Attractiveness Analysis by Product Type, 2016-2032
- Figure 3: Global Peptide Therapeutics Market Revenue (US$ Mn) Market Share by Applicationin 2022
- Figure 4: Global Peptide Therapeutics Market Attractiveness Analysis by Application, 2016-2032
- Figure 5: Global Peptide Therapeutics Market Revenue (US$ Mn) Market Share by Route of Administrationin 2022
- Figure 6: Global Peptide Therapeutics Market Attractiveness Analysis by Route of Administration, 2016-2032
- Figure 7: Global Peptide Therapeutics Market Revenue (US$ Mn) Market Share by Manufacturing Typein 2022
- Figure 8: Global Peptide Therapeutics Market Attractiveness Analysis by Manufacturing Type, 2016-2032
- Figure 9: Global Peptide Therapeutics Market Revenue (US$ Mn) Market Share by Synthesis Technologyin 2022
- Figure 10: Global Peptide Therapeutics Market Attractiveness Analysis by Synthesis Technology, 2016-2032
- Figure 11: Global Peptide Therapeutics Market Revenue (US$ Mn) Market Share by Region in 2022
- Figure 12: Global Peptide Therapeutics Market Attractiveness Analysis by Region, 2016-2032
- Figure 13: Global Peptide Therapeutics Market Revenue (US$ Mn) (2016-2032)
- Figure 14: Global Peptide Therapeutics Market Revenue (US$ Mn) Comparison by Region (2016-2032)
- Figure 15: Global Peptide Therapeutics Market Revenue (US$ Mn) Comparison by Product Type (2016-2032)
- Figure 16: Global Peptide Therapeutics Market Revenue (US$ Mn) Comparison by Application (2016-2032)
- Figure 17: Global Peptide Therapeutics Market Revenue (US$ Mn) Comparison by Route of Administration (2016-2032)
- Figure 18: Global Peptide Therapeutics Market Revenue (US$ Mn) Comparison by Manufacturing Type (2016-2032)
- Figure 19: Global Peptide Therapeutics Market Revenue (US$ Mn) Comparison by Synthesis Technology (2016-2032)
- Figure 20: Global Peptide Therapeutics Market Y-o-Y Growth Rate Comparison by Region (2016-2032)
- Figure 21: Global Peptide Therapeutics Market Y-o-Y Growth Rate Comparison by Product Type (2016-2032)
- Figure 22: Global Peptide Therapeutics Market Y-o-Y Growth Rate Comparison by Application (2016-2032)
- Figure 23: Global Peptide Therapeutics Market Y-o-Y Growth Rate Comparison by Route of Administration (2016-2032)
- Figure 24: Global Peptide Therapeutics Market Y-o-Y Growth Rate Comparison by Manufacturing Type (2016-2032)
- Figure 25: Global Peptide Therapeutics Market Y-o-Y Growth Rate Comparison by Synthesis Technology (2016-2032)
- Figure 26: Global Peptide Therapeutics Market Share Comparison by Region (2016-2032)
- Figure 27: Global Peptide Therapeutics Market Share Comparison by Product Type (2016-2032)
- Figure 28: Global Peptide Therapeutics Market Share Comparison by Application (2016-2032)
- Figure 29: Global Peptide Therapeutics Market Share Comparison by Route of Administration (2016-2032)
- Figure 30: Global Peptide Therapeutics Market Share Comparison by Manufacturing Type (2016-2032)
- Figure 31: Global Peptide Therapeutics Market Share Comparison by Synthesis Technology (2016-2032)
- Figure 32: North America Peptide Therapeutics Market Revenue (US$ Mn) Market Share by Product Typein 2022
- Figure 33: North America Peptide Therapeutics Market Attractiveness Analysis by Product Type, 2016-2032
- Figure 34: North America Peptide Therapeutics Market Revenue (US$ Mn) Market Share by Applicationin 2022
- Figure 35: North America Peptide Therapeutics Market Attractiveness Analysis by Application, 2016-2032
- Figure 36: North America Peptide Therapeutics Market Revenue (US$ Mn) Market Share by Route of Administrationin 2022
- Figure 37: North America Peptide Therapeutics Market Attractiveness Analysis by Route of Administration, 2016-2032
- Figure 38: North America Peptide Therapeutics Market Revenue (US$ Mn) Market Share by Manufacturing Typein 2022
- Figure 39: North America Peptide Therapeutics Market Attractiveness Analysis by Manufacturing Type, 2016-2032
- Figure 40: North America Peptide Therapeutics Market Revenue (US$ Mn) Market Share by Synthesis Technologyin 2022
- Figure 41: North America Peptide Therapeutics Market Attractiveness Analysis by Synthesis Technology, 2016-2032
- Figure 42: North America Peptide Therapeutics Market Revenue (US$ Mn) Market Share by Country in 2022
- Figure 43: North America Peptide Therapeutics Market Attractiveness Analysis by Country, 2016-2032
- Figure 44: North America Peptide Therapeutics Market Revenue (US$ Mn) (2016-2032)
- Figure 45: North America Peptide Therapeutics Market Revenue (US$ Mn) Comparison by Country (2016-2032)
- Figure 46: North America Peptide Therapeutics Market Revenue (US$ Mn) Comparison by Product Type (2016-2032)
- Figure 47: North America Peptide Therapeutics Market Revenue (US$ Mn) Comparison by Application (2016-2032)
- Figure 48: North America Peptide Therapeutics Market Revenue (US$ Mn) Comparison by Route of Administration (2016-2032)
- Figure 49: North America Peptide Therapeutics Market Revenue (US$ Mn) Comparison by Manufacturing Type (2016-2032)
- Figure 50: North America Peptide Therapeutics Market Revenue (US$ Mn) Comparison by Synthesis Technology (2016-2032)
- Figure 51: North America Peptide Therapeutics Market Y-o-Y Growth Rate Comparison by Country (2016-2032)
- Figure 52: North America Peptide Therapeutics Market Y-o-Y Growth Rate Comparison by Product Type (2016-2032)
- Figure 53: North America Peptide Therapeutics Market Y-o-Y Growth Rate Comparison by Application (2016-2032)
- Figure 54: North America Peptide Therapeutics Market Y-o-Y Growth Rate Comparison by Route of Administration (2016-2032)
- Figure 55: North America Peptide Therapeutics Market Y-o-Y Growth Rate Comparison by Manufacturing Type (2016-2032)
- Figure 56: North America Peptide Therapeutics Market Y-o-Y Growth Rate Comparison by Synthesis Technology (2016-2032)
- Figure 57: North America Peptide Therapeutics Market Share Comparison by Country (2016-2032)
- Figure 58: North America Peptide Therapeutics Market Share Comparison by Product Type (2016-2032)
- Figure 59: North America Peptide Therapeutics Market Share Comparison by Application (2016-2032)
- Figure 60: North America Peptide Therapeutics Market Share Comparison by Route of Administration (2016-2032)
- Figure 61: North America Peptide Therapeutics Market Share Comparison by Manufacturing Type (2016-2032)
- Figure 62: North America Peptide Therapeutics Market Share Comparison by Synthesis Technology (2016-2032)
- Figure 63: Western Europe Peptide Therapeutics Market Revenue (US$ Mn) Market Share by Product Typein 2022
- Figure 64: Western Europe Peptide Therapeutics Market Attractiveness Analysis by Product Type, 2016-2032
- Figure 65: Western Europe Peptide Therapeutics Market Revenue (US$ Mn) Market Share by Applicationin 2022
- Figure 66: Western Europe Peptide Therapeutics Market Attractiveness Analysis by Application, 2016-2032
- Figure 67: Western Europe Peptide Therapeutics Market Revenue (US$ Mn) Market Share by Route of Administrationin 2022
- Figure 68: Western Europe Peptide Therapeutics Market Attractiveness Analysis by Route of Administration, 2016-2032
- Figure 69: Western Europe Peptide Therapeutics Market Revenue (US$ Mn) Market Share by Manufacturing Typein 2022
- Figure 70: Western Europe Peptide Therapeutics Market Attractiveness Analysis by Manufacturing Type, 2016-2032
- Figure 71: Western Europe Peptide Therapeutics Market Revenue (US$ Mn) Market Share by Synthesis Technologyin 2022
- Figure 72: Western Europe Peptide Therapeutics Market Attractiveness Analysis by Synthesis Technology, 2016-2032
- Figure 73: Western Europe Peptide Therapeutics Market Revenue (US$ Mn) Market Share by Country in 2022
- Figure 74: Western Europe Peptide Therapeutics Market Attractiveness Analysis by Country, 2016-2032
- Figure 75: Western Europe Peptide Therapeutics Market Revenue (US$ Mn) (2016-2032)
- Figure 76: Western Europe Peptide Therapeutics Market Revenue (US$ Mn) Comparison by Country (2016-2032)
- Figure 77: Western Europe Peptide Therapeutics Market Revenue (US$ Mn) Comparison by Product Type (2016-2032)
- Figure 78: Western Europe Peptide Therapeutics Market Revenue (US$ Mn) Comparison by Application (2016-2032)
- Figure 79: Western Europe Peptide Therapeutics Market Revenue (US$ Mn) Comparison by Route of Administration (2016-2032)
- Figure 80: Western Europe Peptide Therapeutics Market Revenue (US$ Mn) Comparison by Manufacturing Type (2016-2032)
- Figure 81: Western Europe Peptide Therapeutics Market Revenue (US$ Mn) Comparison by Synthesis Technology (2016-2032)
- Figure 82: Western Europe Peptide Therapeutics Market Y-o-Y Growth Rate Comparison by Country (2016-2032)
- Figure 83: Western Europe Peptide Therapeutics Market Y-o-Y Growth Rate Comparison by Product Type (2016-2032)
- Figure 84: Western Europe Peptide Therapeutics Market Y-o-Y Growth Rate Comparison by Application (2016-2032)
- Figure 85: Western Europe Peptide Therapeutics Market Y-o-Y Growth Rate Comparison by Route of Administration (2016-2032)
- Figure 86: Western Europe Peptide Therapeutics Market Y-o-Y Growth Rate Comparison by Manufacturing Type (2016-2032)
- Figure 87: Western Europe Peptide Therapeutics Market Y-o-Y Growth Rate Comparison by Synthesis Technology (2016-2032)
- Figure 88: Western Europe Peptide Therapeutics Market Share Comparison by Country (2016-2032)
- Figure 89: Western Europe Peptide Therapeutics Market Share Comparison by Product Type (2016-2032)
- Figure 90: Western Europe Peptide Therapeutics Market Share Comparison by Application (2016-2032)
- Figure 91: Western Europe Peptide Therapeutics Market Share Comparison by Route of Administration (2016-2032)
- Figure 92: Western Europe Peptide Therapeutics Market Share Comparison by Manufacturing Type (2016-2032)
- Figure 93: Western Europe Peptide Therapeutics Market Share Comparison by Synthesis Technology (2016-2032)
- Figure 94: Eastern Europe Peptide Therapeutics Market Revenue (US$ Mn) Market Share by Product Typein 2022
- Figure 95: Eastern Europe Peptide Therapeutics Market Attractiveness Analysis by Product Type, 2016-2032
- Figure 96: Eastern Europe Peptide Therapeutics Market Revenue (US$ Mn) Market Share by Applicationin 2022
- Figure 97: Eastern Europe Peptide Therapeutics Market Attractiveness Analysis by Application, 2016-2032
- Figure 98: Eastern Europe Peptide Therapeutics Market Revenue (US$ Mn) Market Share by Route of Administrationin 2022
- Figure 99: Eastern Europe Peptide Therapeutics Market Attractiveness Analysis by Route of Administration, 2016-2032
- Figure 100: Eastern Europe Peptide Therapeutics Market Revenue (US$ Mn) Market Share by Manufacturing Typein 2022
- Figure 101: Eastern Europe Peptide Therapeutics Market Attractiveness Analysis by Manufacturing Type, 2016-2032
- Figure 102: Eastern Europe Peptide Therapeutics Market Revenue (US$ Mn) Market Share by Synthesis Technologyin 2022
- Figure 103: Eastern Europe Peptide Therapeutics Market Attractiveness Analysis by Synthesis Technology, 2016-2032
- Figure 104: Eastern Europe Peptide Therapeutics Market Revenue (US$ Mn) Market Share by Country in 2022
- Figure 105: Eastern Europe Peptide Therapeutics Market Attractiveness Analysis by Country, 2016-2032
- Figure 106: Eastern Europe Peptide Therapeutics Market Revenue (US$ Mn) (2016-2032)
- Figure 107: Eastern Europe Peptide Therapeutics Market Revenue (US$ Mn) Comparison by Country (2016-2032)
- Figure 108: Eastern Europe Peptide Therapeutics Market Revenue (US$ Mn) Comparison by Product Type (2016-2032)
- Figure 109: Eastern Europe Peptide Therapeutics Market Revenue (US$ Mn) Comparison by Application (2016-2032)
- Figure 110: Eastern Europe Peptide Therapeutics Market Revenue (US$ Mn) Comparison by Route of Administration (2016-2032)
- Figure 111: Eastern Europe Peptide Therapeutics Market Revenue (US$ Mn) Comparison by Manufacturing Type (2016-2032)
- Figure 112: Eastern Europe Peptide Therapeutics Market Revenue (US$ Mn) Comparison by Synthesis Technology (2016-2032)
- Figure 113: Eastern Europe Peptide Therapeutics Market Y-o-Y Growth Rate Comparison by Country (2016-2032)
- Figure 114: Eastern Europe Peptide Therapeutics Market Y-o-Y Growth Rate Comparison by Product Type (2016-2032)
- Figure 115: Eastern Europe Peptide Therapeutics Market Y-o-Y Growth Rate Comparison by Application (2016-2032)
- Figure 116: Eastern Europe Peptide Therapeutics Market Y-o-Y Growth Rate Comparison by Route of Administration (2016-2032)
- Figure 117: Eastern Europe Peptide Therapeutics Market Y-o-Y Growth Rate Comparison by Manufacturing Type (2016-2032)
- Figure 118: Eastern Europe Peptide Therapeutics Market Y-o-Y Growth Rate Comparison by Synthesis Technology (2016-2032)
- Figure 119: Eastern Europe Peptide Therapeutics Market Share Comparison by Country (2016-2032)
- Figure 120: Eastern Europe Peptide Therapeutics Market Share Comparison by Product Type (2016-2032)
- Figure 121: Eastern Europe Peptide Therapeutics Market Share Comparison by Application (2016-2032)
- Figure 122: Eastern Europe Peptide Therapeutics Market Share Comparison by Route of Administration (2016-2032)
- Figure 123: Eastern Europe Peptide Therapeutics Market Share Comparison by Manufacturing Type (2016-2032)
- Figure 124: Eastern Europe Peptide Therapeutics Market Share Comparison by Synthesis Technology (2016-2032)
- Figure 125: APAC Peptide Therapeutics Market Revenue (US$ Mn) Market Share by Product Typein 2022
- Figure 126: APAC Peptide Therapeutics Market Attractiveness Analysis by Product Type, 2016-2032
- Figure 127: APAC Peptide Therapeutics Market Revenue (US$ Mn) Market Share by Applicationin 2022
- Figure 128: APAC Peptide Therapeutics Market Attractiveness Analysis by Application, 2016-2032
- Figure 129: APAC Peptide Therapeutics Market Revenue (US$ Mn) Market Share by Route of Administrationin 2022
- Figure 130: APAC Peptide Therapeutics Market Attractiveness Analysis by Route of Administration, 2016-2032
- Figure 131: APAC Peptide Therapeutics Market Revenue (US$ Mn) Market Share by Manufacturing Typein 2022
- Figure 132: APAC Peptide Therapeutics Market Attractiveness Analysis by Manufacturing Type, 2016-2032
- Figure 133: APAC Peptide Therapeutics Market Revenue (US$ Mn) Market Share by Synthesis Technologyin 2022
- Figure 134: APAC Peptide Therapeutics Market Attractiveness Analysis by Synthesis Technology, 2016-2032
- Figure 135: APAC Peptide Therapeutics Market Revenue (US$ Mn) Market Share by Country in 2022
- Figure 136: APAC Peptide Therapeutics Market Attractiveness Analysis by Country, 2016-2032
- Figure 137: APAC Peptide Therapeutics Market Revenue (US$ Mn) (2016-2032)
- Figure 138: APAC Peptide Therapeutics Market Revenue (US$ Mn) Comparison by Country (2016-2032)
- Figure 139: APAC Peptide Therapeutics Market Revenue (US$ Mn) Comparison by Product Type (2016-2032)
- Figure 140: APAC Peptide Therapeutics Market Revenue (US$ Mn) Comparison by Application (2016-2032)
- Figure 141: APAC Peptide Therapeutics Market Revenue (US$ Mn) Comparison by Route of Administration (2016-2032)
- Figure 142: APAC Peptide Therapeutics Market Revenue (US$ Mn) Comparison by Manufacturing Type (2016-2032)
- Figure 143: APAC Peptide Therapeutics Market Revenue (US$ Mn) Comparison by Synthesis Technology (2016-2032)
- Figure 144: APAC Peptide Therapeutics Market Y-o-Y Growth Rate Comparison by Country (2016-2032)
- Figure 145: APAC Peptide Therapeutics Market Y-o-Y Growth Rate Comparison by Product Type (2016-2032)
- Figure 146: APAC Peptide Therapeutics Market Y-o-Y Growth Rate Comparison by Application (2016-2032)
- Figure 147: APAC Peptide Therapeutics Market Y-o-Y Growth Rate Comparison by Route of Administration (2016-2032)
- Figure 148: APAC Peptide Therapeutics Market Y-o-Y Growth Rate Comparison by Manufacturing Type (2016-2032)
- Figure 149: APAC Peptide Therapeutics Market Y-o-Y Growth Rate Comparison by Synthesis Technology (2016-2032)
- Figure 150: APAC Peptide Therapeutics Market Share Comparison by Country (2016-2032)
- Figure 151: APAC Peptide Therapeutics Market Share Comparison by Product Type (2016-2032)
- Figure 152: APAC Peptide Therapeutics Market Share Comparison by Application (2016-2032)
- Figure 153: APAC Peptide Therapeutics Market Share Comparison by Route of Administration (2016-2032)
- Figure 154: APAC Peptide Therapeutics Market Share Comparison by Manufacturing Type (2016-2032)
- Figure 155: APAC Peptide Therapeutics Market Share Comparison by Synthesis Technology (2016-2032)
- Figure 156: Latin America Peptide Therapeutics Market Revenue (US$ Mn) Market Share by Product Typein 2022
- Figure 157: Latin America Peptide Therapeutics Market Attractiveness Analysis by Product Type, 2016-2032
- Figure 158: Latin America Peptide Therapeutics Market Revenue (US$ Mn) Market Share by Applicationin 2022
- Figure 159: Latin America Peptide Therapeutics Market Attractiveness Analysis by Application, 2016-2032
- Figure 160: Latin America Peptide Therapeutics Market Revenue (US$ Mn) Market Share by Route of Administrationin 2022
- Figure 161: Latin America Peptide Therapeutics Market Attractiveness Analysis by Route of Administration, 2016-2032
- Figure 162: Latin America Peptide Therapeutics Market Revenue (US$ Mn) Market Share by Manufacturing Typein 2022
- Figure 163: Latin America Peptide Therapeutics Market Attractiveness Analysis by Manufacturing Type, 2016-2032
- Figure 164: Latin America Peptide Therapeutics Market Revenue (US$ Mn) Market Share by Synthesis Technologyin 2022
- Figure 165: Latin America Peptide Therapeutics Market Attractiveness Analysis by Synthesis Technology, 2016-2032
- Figure 166: Latin America Peptide Therapeutics Market Revenue (US$ Mn) Market Share by Country in 2022
- Figure 167: Latin America Peptide Therapeutics Market Attractiveness Analysis by Country, 2016-2032
- Figure 168: Latin America Peptide Therapeutics Market Revenue (US$ Mn) (2016-2032)
- Figure 169: Latin America Peptide Therapeutics Market Revenue (US$ Mn) Comparison by Country (2016-2032)
- Figure 170: Latin America Peptide Therapeutics Market Revenue (US$ Mn) Comparison by Product Type (2016-2032)
- Figure 171: Latin America Peptide Therapeutics Market Revenue (US$ Mn) Comparison by Application (2016-2032)
- Figure 172: Latin America Peptide Therapeutics Market Revenue (US$ Mn) Comparison by Route of Administration (2016-2032)
- Figure 173: Latin America Peptide Therapeutics Market Revenue (US$ Mn) Comparison by Manufacturing Type (2016-2032)
- Figure 174: Latin America Peptide Therapeutics Market Revenue (US$ Mn) Comparison by Synthesis Technology (2016-2032)
- Figure 175: Latin America Peptide Therapeutics Market Y-o-Y Growth Rate Comparison by Country (2016-2032)
- Figure 176: Latin America Peptide Therapeutics Market Y-o-Y Growth Rate Comparison by Product Type (2016-2032)
- Figure 177: Latin America Peptide Therapeutics Market Y-o-Y Growth Rate Comparison by Application (2016-2032)
- Figure 178: Latin America Peptide Therapeutics Market Y-o-Y Growth Rate Comparison by Route of Administration (2016-2032)
- Figure 179: Latin America Peptide Therapeutics Market Y-o-Y Growth Rate Comparison by Manufacturing Type (2016-2032)
- Figure 180: Latin America Peptide Therapeutics Market Y-o-Y Growth Rate Comparison by Synthesis Technology (2016-2032)
- Figure 181: Latin America Peptide Therapeutics Market Share Comparison by Country (2016-2032)
- Figure 182: Latin America Peptide Therapeutics Market Share Comparison by Product Type (2016-2032)
- Figure 183: Latin America Peptide Therapeutics Market Share Comparison by Application (2016-2032)
- Figure 184: Latin America Peptide Therapeutics Market Share Comparison by Route of Administration (2016-2032)
- Figure 185: Latin America Peptide Therapeutics Market Share Comparison by Manufacturing Type (2016-2032)
- Figure 186: Latin America Peptide Therapeutics Market Share Comparison by Synthesis Technology (2016-2032)
- Figure 187: Middle East & Africa Peptide Therapeutics Market Revenue (US$ Mn) Market Share by Product Typein 2022
- Figure 188: Middle East & Africa Peptide Therapeutics Market Attractiveness Analysis by Product Type, 2016-2032
- Figure 189: Middle East & Africa Peptide Therapeutics Market Revenue (US$ Mn) Market Share by Applicationin 2022
- Figure 190: Middle East & Africa Peptide Therapeutics Market Attractiveness Analysis by Application, 2016-2032
- Figure 191: Middle East & Africa Peptide Therapeutics Market Revenue (US$ Mn) Market Share by Route of Administrationin 2022
- Figure 192: Middle East & Africa Peptide Therapeutics Market Attractiveness Analysis by Route of Administration, 2016-2032
- Figure 193: Middle East & Africa Peptide Therapeutics Market Revenue (US$ Mn) Market Share by Manufacturing Typein 2022
- Figure 194: Middle East & Africa Peptide Therapeutics Market Attractiveness Analysis by Manufacturing Type, 2016-2032
- Figure 195: Middle East & Africa Peptide Therapeutics Market Revenue (US$ Mn) Market Share by Synthesis Technologyin 2022
- Figure 196: Middle East & Africa Peptide Therapeutics Market Attractiveness Analysis by Synthesis Technology, 2016-2032
- Figure 197: Middle East & Africa Peptide Therapeutics Market Revenue (US$ Mn) Market Share by Country in 2022
- Figure 198: Middle East & Africa Peptide Therapeutics Market Attractiveness Analysis by Country, 2016-2032
- Figure 199: Middle East & Africa Peptide Therapeutics Market Revenue (US$ Mn) (2016-2032)
- Figure 200: Middle East & Africa Peptide Therapeutics Market Revenue (US$ Mn) Comparison by Country (2016-2032)
- Figure 201: Middle East & Africa Peptide Therapeutics Market Revenue (US$ Mn) Comparison by Product Type (2016-2032)
- Figure 202: Middle East & Africa Peptide Therapeutics Market Revenue (US$ Mn) Comparison by Application (2016-2032)
- Figure 203: Middle East & Africa Peptide Therapeutics Market Revenue (US$ Mn) Comparison by Route of Administration (2016-2032)
- Figure 204: Middle East & Africa Peptide Therapeutics Market Revenue (US$ Mn) Comparison by Manufacturing Type (2016-2032)
- Figure 205: Middle East & Africa Peptide Therapeutics Market Revenue (US$ Mn) Comparison by Synthesis Technology (2016-2032)
- Figure 206: Middle East & Africa Peptide Therapeutics Market Y-o-Y Growth Rate Comparison by Country (2016-2032)
- Figure 207: Middle East & Africa Peptide Therapeutics Market Y-o-Y Growth Rate Comparison by Product Type (2016-2032)
- Figure 208: Middle East & Africa Peptide Therapeutics Market Y-o-Y Growth Rate Comparison by Application (2016-2032)
- Figure 209: Middle East & Africa Peptide Therapeutics Market Y-o-Y Growth Rate Comparison by Route of Administration (2016-2032)
- Figure 210: Middle East & Africa Peptide Therapeutics Market Y-o-Y Growth Rate Comparison by Manufacturing Type (2016-2032)
- Figure 211: Middle East & Africa Peptide Therapeutics Market Y-o-Y Growth Rate Comparison by Synthesis Technology (2016-2032)
- Figure 212: Middle East & Africa Peptide Therapeutics Market Share Comparison by Country (2016-2032)
- Figure 213: Middle East & Africa Peptide Therapeutics Market Share Comparison by Product Type (2016-2032)
- Figure 214: Middle East & Africa Peptide Therapeutics Market Share Comparison by Application (2016-2032)
- Figure 215: Middle East & Africa Peptide Therapeutics Market Share Comparison by Route of Administration (2016-2032)
- Figure 216: Middle East & Africa Peptide Therapeutics Market Share Comparison by Manufacturing Type (2016-2032)
- Figure 217: Middle East & Africa Peptide Therapeutics Market Share Comparison by Synthesis Technology (2016-2032)
- List of Tables
- Table 1: Global Peptide Therapeutics Market Comparison by Product Type (2016-2032)
- Table 2: Global Peptide Therapeutics Market Comparison by Application (2016-2032)
- Table 3: Global Peptide Therapeutics Market Comparison by Route of Administration (2016-2032)
- Table 4: Global Peptide Therapeutics Market Comparison by Manufacturing Type (2016-2032)
- Table 5: Global Peptide Therapeutics Market Comparison by Synthesis Technology (2016-2032)
- Table 6: Global Peptide Therapeutics Market Revenue (US$ Mn) Comparison by Region (2016-2032)
- Table 7: Global Peptide Therapeutics Market Revenue (US$ Mn) (2016-2032)
- Table 8: Global Peptide Therapeutics Market Revenue (US$ Mn) Comparison by Region (2016-2032)
- Table 9: Global Peptide Therapeutics Market Revenue (US$ Mn) Comparison by Product Type (2016-2032)
- Table 10: Global Peptide Therapeutics Market Revenue (US$ Mn) Comparison by Application (2016-2032)
- Table 11: Global Peptide Therapeutics Market Revenue (US$ Mn) Comparison by Route of Administration (2016-2032)
- Table 12: Global Peptide Therapeutics Market Revenue (US$ Mn) Comparison by Manufacturing Type (2016-2032)
- Table 13: Global Peptide Therapeutics Market Revenue (US$ Mn) Comparison by Synthesis Technology (2016-2032)
- Table 14: Global Peptide Therapeutics Market Y-o-Y Growth Rate Comparison by Region (2016-2032)
- Table 15: Global Peptide Therapeutics Market Y-o-Y Growth Rate Comparison by Product Type (2016-2032)
- Table 16: Global Peptide Therapeutics Market Y-o-Y Growth Rate Comparison by Application (2016-2032)
- Table 17: Global Peptide Therapeutics Market Y-o-Y Growth Rate Comparison by Route of Administration (2016-2032)
- Table 18: Global Peptide Therapeutics Market Y-o-Y Growth Rate Comparison by Manufacturing Type (2016-2032)
- Table 19: Global Peptide Therapeutics Market Y-o-Y Growth Rate Comparison by Synthesis Technology (2016-2032)
- Table 20: Global Peptide Therapeutics Market Share Comparison by Region (2016-2032)
- Table 21: Global Peptide Therapeutics Market Share Comparison by Product Type (2016-2032)
- Table 22: Global Peptide Therapeutics Market Share Comparison by Application (2016-2032)
- Table 23: Global Peptide Therapeutics Market Share Comparison by Route of Administration (2016-2032)
- Table 24: Global Peptide Therapeutics Market Share Comparison by Manufacturing Type (2016-2032)
- Table 25: Global Peptide Therapeutics Market Share Comparison by Synthesis Technology (2016-2032)
- Table 26: North America Peptide Therapeutics Market Comparison by Application (2016-2032)
- Table 27: North America Peptide Therapeutics Market Comparison by Route of Administration (2016-2032)
- Table 28: North America Peptide Therapeutics Market Comparison by Manufacturing Type (2016-2032)
- Table 29: North America Peptide Therapeutics Market Comparison by Synthesis Technology (2016-2032)
- Table 30: North America Peptide Therapeutics Market Revenue (US$ Mn) Comparison by Country (2016-2032)
- Table 31: North America Peptide Therapeutics Market Revenue (US$ Mn) (2016-2032)
- Table 32: North America Peptide Therapeutics Market Revenue (US$ Mn) Comparison by Country (2016-2032)
- Table 33: North America Peptide Therapeutics Market Revenue (US$ Mn) Comparison by Product Type (2016-2032)
- Table 34: North America Peptide Therapeutics Market Revenue (US$ Mn) Comparison by Application (2016-2032)
- Table 35: North America Peptide Therapeutics Market Revenue (US$ Mn) Comparison by Route of Administration (2016-2032)
- Table 36: North America Peptide Therapeutics Market Revenue (US$ Mn) Comparison by Manufacturing Type (2016-2032)
- Table 37: North America Peptide Therapeutics Market Revenue (US$ Mn) Comparison by Synthesis Technology (2016-2032)
- Table 38: North America Peptide Therapeutics Market Y-o-Y Growth Rate Comparison by Country (2016-2032)
- Table 39: North America Peptide Therapeutics Market Y-o-Y Growth Rate Comparison by Product Type (2016-2032)
- Table 40: North America Peptide Therapeutics Market Y-o-Y Growth Rate Comparison by Application (2016-2032)
- Table 41: North America Peptide Therapeutics Market Y-o-Y Growth Rate Comparison by Route of Administration (2016-2032)
- Table 42: North America Peptide Therapeutics Market Y-o-Y Growth Rate Comparison by Manufacturing Type (2016-2032)
- Table 43: North America Peptide Therapeutics Market Y-o-Y Growth Rate Comparison by Synthesis Technology (2016-2032)
- Table 44: North America Peptide Therapeutics Market Share Comparison by Country (2016-2032)
- Table 45: North America Peptide Therapeutics Market Share Comparison by Product Type (2016-2032)
- Table 46: North America Peptide Therapeutics Market Share Comparison by Application (2016-2032)
- Table 47: North America Peptide Therapeutics Market Share Comparison by Route of Administration (2016-2032)
- Table 48: North America Peptide Therapeutics Market Share Comparison by Manufacturing Type (2016-2032)
- Table 49: North America Peptide Therapeutics Market Share Comparison by Synthesis Technology (2016-2032)
- Table 50: Western Europe Peptide Therapeutics Market Comparison by Product Type (2016-2032)
- Table 51: Western Europe Peptide Therapeutics Market Comparison by Application (2016-2032)
- Table 52: Western Europe Peptide Therapeutics Market Comparison by Route of Administration (2016-2032)
- Table 53: Western Europe Peptide Therapeutics Market Comparison by Manufacturing Type (2016-2032)
- Table 54: Western Europe Peptide Therapeutics Market Comparison by Synthesis Technology (2016-2032)
- Table 55: Western Europe Peptide Therapeutics Market Revenue (US$ Mn) Comparison by Country (2016-2032)
- Table 56: Western Europe Peptide Therapeutics Market Revenue (US$ Mn) (2016-2032)
- Table 57: Western Europe Peptide Therapeutics Market Revenue (US$ Mn) Comparison by Country (2016-2032)
- Table 58: Western Europe Peptide Therapeutics Market Revenue (US$ Mn) Comparison by Product Type (2016-2032)
- Table 59: Western Europe Peptide Therapeutics Market Revenue (US$ Mn) Comparison by Application (2016-2032)
- Table 60: Western Europe Peptide Therapeutics Market Revenue (US$ Mn) Comparison by Route of Administration (2016-2032)
- Table 61: Western Europe Peptide Therapeutics Market Revenue (US$ Mn) Comparison by Manufacturing Type (2016-2032)
- Table 62: Western Europe Peptide Therapeutics Market Revenue (US$ Mn) Comparison by Synthesis Technology (2016-2032)
- Table 63: Western Europe Peptide Therapeutics Market Y-o-Y Growth Rate Comparison by Country (2016-2032)
- Table 64: Western Europe Peptide Therapeutics Market Y-o-Y Growth Rate Comparison by Product Type (2016-2032)
- Table 65: Western Europe Peptide Therapeutics Market Y-o-Y Growth Rate Comparison by Application (2016-2032)
- Table 66: Western Europe Peptide Therapeutics Market Y-o-Y Growth Rate Comparison by Route of Administration (2016-2032)
- Table 67: Western Europe Peptide Therapeutics Market Y-o-Y Growth Rate Comparison by Manufacturing Type (2016-2032)
- Table 68: Western Europe Peptide Therapeutics Market Y-o-Y Growth Rate Comparison by Synthesis Technology (2016-2032)
- Table 69: Western Europe Peptide Therapeutics Market Share Comparison by Country (2016-2032)
- Table 70: Western Europe Peptide Therapeutics Market Share Comparison by Product Type (2016-2032)
- Table 71: Western Europe Peptide Therapeutics Market Share Comparison by Application (2016-2032)
- Table 72: Western Europe Peptide Therapeutics Market Share Comparison by Route of Administration (2016-2032)
- Table 73: Western Europe Peptide Therapeutics Market Share Comparison by Manufacturing Type (2016-2032)
- Table 74: Western Europe Peptide Therapeutics Market Share Comparison by Synthesis Technology (2016-2032)
- Table 75: Eastern Europe Peptide Therapeutics Market Comparison by Product Type (2016-2032)
- Table 76: Eastern Europe Peptide Therapeutics Market Comparison by Application (2016-2032)
- Table 77: Eastern Europe Peptide Therapeutics Market Comparison by Route of Administration (2016-2032)
- Table 78: Eastern Europe Peptide Therapeutics Market Comparison by Manufacturing Type (2016-2032)
- Table 79: Eastern Europe Peptide Therapeutics Market Comparison by Synthesis Technology (2016-2032)
- Table 80: Eastern Europe Peptide Therapeutics Market Revenue (US$ Mn) Comparison by Country (2016-2032)
- Table 81: Eastern Europe Peptide Therapeutics Market Revenue (US$ Mn) (2016-2032)
- Table 82: Eastern Europe Peptide Therapeutics Market Revenue (US$ Mn) Comparison by Country (2016-2032)
- Table 83: Eastern Europe Peptide Therapeutics Market Revenue (US$ Mn) Comparison by Product Type (2016-2032)
- Table 84: Eastern Europe Peptide Therapeutics Market Revenue (US$ Mn) Comparison by Application (2016-2032)
- Table 85: Eastern Europe Peptide Therapeutics Market Revenue (US$ Mn) Comparison by Route of Administration (2016-2032)
- Table 86: Eastern Europe Peptide Therapeutics Market Revenue (US$ Mn) Comparison by Manufacturing Type (2016-2032)
- Table 87: Eastern Europe Peptide Therapeutics Market Revenue (US$ Mn) Comparison by Synthesis Technology (2016-2032)
- Table 88: Eastern Europe Peptide Therapeutics Market Y-o-Y Growth Rate Comparison by Country (2016-2032)
- Table 89: Eastern Europe Peptide Therapeutics Market Y-o-Y Growth Rate Comparison by Product Type (2016-2032)
- Table 90: Eastern Europe Peptide Therapeutics Market Y-o-Y Growth Rate Comparison by Application (2016-2032)
- Table 91: Eastern Europe Peptide Therapeutics Market Y-o-Y Growth Rate Comparison by Route of Administration (2016-2032)
- Table 92: Eastern Europe Peptide Therapeutics Market Y-o-Y Growth Rate Comparison by Manufacturing Type (2016-2032)
- Table 93: Eastern Europe Peptide Therapeutics Market Y-o-Y Growth Rate Comparison by Synthesis Technology (2016-2032)
- Table 94: Eastern Europe Peptide Therapeutics Market Share Comparison by Country (2016-2032)
- Table 95: Eastern Europe Peptide Therapeutics Market Share Comparison by Product Type (2016-2032)
- Table 96: Eastern Europe Peptide Therapeutics Market Share Comparison by Application (2016-2032)
- Table 97: Eastern Europe Peptide Therapeutics Market Share Comparison by Route of Administration (2016-2032)
- Table 98: Eastern Europe Peptide Therapeutics Market Share Comparison by Manufacturing Type (2016-2032)
- Table 99: Eastern Europe Peptide Therapeutics Market Share Comparison by Synthesis Technology (2016-2032)
- Table 100: APAC Peptide Therapeutics Market Comparison by Product Type (2016-2032)
- Table 101: APAC Peptide Therapeutics Market Comparison by Application (2016-2032)
- Table 102: APAC Peptide Therapeutics Market Comparison by Route of Administration (2016-2032)
- Table 103: APAC Peptide Therapeutics Market Comparison by Manufacturing Type (2016-2032)
- Table 104: APAC Peptide Therapeutics Market Comparison by Synthesis Technology (2016-2032)
- Table 105: APAC Peptide Therapeutics Market Revenue (US$ Mn) Comparison by Country (2016-2032)
- Table 106: APAC Peptide Therapeutics Market Revenue (US$ Mn) (2016-2032)
- Table 107: APAC Peptide Therapeutics Market Revenue (US$ Mn) Comparison by Country (2016-2032)
- Table 108: APAC Peptide Therapeutics Market Revenue (US$ Mn) Comparison by Product Type (2016-2032)
- Table 109: APAC Peptide Therapeutics Market Revenue (US$ Mn) Comparison by Application (2016-2032)
- Table 110: APAC Peptide Therapeutics Market Revenue (US$ Mn) Comparison by Route of Administration (2016-2032)
- Table 111: APAC Peptide Therapeutics Market Revenue (US$ Mn) Comparison by Manufacturing Type (2016-2032)
- Table 112: APAC Peptide Therapeutics Market Revenue (US$ Mn) Comparison by Synthesis Technology (2016-2032)
- Table 113: APAC Peptide Therapeutics Market Y-o-Y Growth Rate Comparison by Country (2016-2032)
- Table 114: APAC Peptide Therapeutics Market Y-o-Y Growth Rate Comparison by Product Type (2016-2032)
- Table 115: APAC Peptide Therapeutics Market Y-o-Y Growth Rate Comparison by Application (2016-2032)
- Table 116: APAC Peptide Therapeutics Market Y-o-Y Growth Rate Comparison by Route of Administration (2016-2032)
- Table 117: APAC Peptide Therapeutics Market Y-o-Y Growth Rate Comparison by Manufacturing Type (2016-2032)
- Table 118: APAC Peptide Therapeutics Market Y-o-Y Growth Rate Comparison by Synthesis Technology (2016-2032)
- Table 119: APAC Peptide Therapeutics Market Share Comparison by Country (2016-2032)
- Table 120: APAC Peptide Therapeutics Market Share Comparison by Product Type (2016-2032)
- Table 121: APAC Peptide Therapeutics Market Share Comparison by Application (2016-2032)
- Table 122: APAC Peptide Therapeutics Market Share Comparison by Route of Administration (2016-2032)
- Table 123: APAC Peptide Therapeutics Market Share Comparison by Manufacturing Type (2016-2032)
- Table 124: APAC Peptide Therapeutics Market Share Comparison by Synthesis Technology (2016-2032)
- Table 125: Latin America Peptide Therapeutics Market Comparison by Product Type (2016-2032)
- Table 126: Latin America Peptide Therapeutics Market Comparison by Application (2016-2032)
- Table 127: Latin America Peptide Therapeutics Market Comparison by Route of Administration (2016-2032)
- Table 128: Latin America Peptide Therapeutics Market Comparison by Manufacturing Type (2016-2032)
- Table 129: Latin America Peptide Therapeutics Market Comparison by Synthesis Technology (2016-2032)
- Table 130: Latin America Peptide Therapeutics Market Revenue (US$ Mn) Comparison by Country (2016-2032)
- Table 131: Latin America Peptide Therapeutics Market Revenue (US$ Mn) (2016-2032)
- Table 132: Latin America Peptide Therapeutics Market Revenue (US$ Mn) Comparison by Country (2016-2032)
- Table 133: Latin America Peptide Therapeutics Market Revenue (US$ Mn) Comparison by Product Type (2016-2032)
- Table 134: Latin America Peptide Therapeutics Market Revenue (US$ Mn) Comparison by Application (2016-2032)
- Table 135: Latin America Peptide Therapeutics Market Revenue (US$ Mn) Comparison by Route of Administration (2016-2032)
- Table 136: Latin America Peptide Therapeutics Market Revenue (US$ Mn) Comparison by Manufacturing Type (2016-2032)
- Table 137: Latin America Peptide Therapeutics Market Revenue (US$ Mn) Comparison by Synthesis Technology (2016-2032)
- Table 138: Latin America Peptide Therapeutics Market Y-o-Y Growth Rate Comparison by Country (2016-2032)
- Table 139: Latin America Peptide Therapeutics Market Y-o-Y Growth Rate Comparison by Product Type (2016-2032)
- Table 140: Latin America Peptide Therapeutics Market Y-o-Y Growth Rate Comparison by Application (2016-2032)
- Table 141: Latin America Peptide Therapeutics Market Y-o-Y Growth Rate Comparison by Route of Administration (2016-2032)
- Table 142: Latin America Peptide Therapeutics Market Y-o-Y Growth Rate Comparison by Manufacturing Type (2016-2032)
- Table 143: Latin America Peptide Therapeutics Market Y-o-Y Growth Rate Comparison by Synthesis Technology (2016-2032)
- Table 144: Latin America Peptide Therapeutics Market Share Comparison by Country (2016-2032)
- Table 145: Latin America Peptide Therapeutics Market Share Comparison by Product Type (2016-2032)
- Table 146: Latin America Peptide Therapeutics Market Share Comparison by Application (2016-2032)
- Table 147: Latin America Peptide Therapeutics Market Share Comparison by Route of Administration (2016-2032)
- Table 148: Latin America Peptide Therapeutics Market Share Comparison by Manufacturing Type (2016-2032)
- Table 149: Latin America Peptide Therapeutics Market Share Comparison by Synthesis Technology (2016-2032)
- Table 150: Middle East & Africa Peptide Therapeutics Market Comparison by Product Type (2016-2032)
- Table 151: Middle East & Africa Peptide Therapeutics Market Comparison by Application (2016-2032)
- Table 152: Middle East & Africa Peptide Therapeutics Market Comparison by Route of Administration (2016-2032)
- Table 153: Middle East & Africa Peptide Therapeutics Market Comparison by Manufacturing Type (2016-2032)
- Table 154: Middle East & Africa Peptide Therapeutics Market Comparison by Synthesis Technology (2016-2032)
- Table 155: Middle East & Africa Peptide Therapeutics Market Revenue (US$ Mn) Comparison by Country (2016-2032)
- Table 156: Middle East & Africa Peptide Therapeutics Market Revenue (US$ Mn) (2016-2032)
- Table 157: Middle East & Africa Peptide Therapeutics Market Revenue (US$ Mn) Comparison by Country (2016-2032)
- Table 158: Middle East & Africa Peptide Therapeutics Market Revenue (US$ Mn) Comparison by Product Type (2016-2032)
- Table 159: Middle East & Africa Peptide Therapeutics Market Revenue (US$ Mn) Comparison by Application (2016-2032)
- Table 160: Middle East & Africa Peptide Therapeutics Market Revenue (US$ Mn) Comparison by Route of Administration (2016-2032)
- Table 161: Middle East & Africa Peptide Therapeutics Market Revenue (US$ Mn) Comparison by Manufacturing Type (2016-2032)
- Table 162: Middle East & Africa Peptide Therapeutics Market Revenue (US$ Mn) Comparison by Synthesis Technology (2016-2032)
- Table 163: Middle East & Africa Peptide Therapeutics Market Y-o-Y Growth Rate Comparison by Country (2016-2032)
- Table 164: Middle East & Africa Peptide Therapeutics Market Y-o-Y Growth Rate Comparison by Product Type (2016-2032)
- Table 165: Middle East & Africa Peptide Therapeutics Market Y-o-Y Growth Rate Comparison by Application (2016-2032)
- Table 166: Middle East & Africa Peptide Therapeutics Market Y-o-Y Growth Rate Comparison by Route of Administration (2016-2032)
- Table 167: Middle East & Africa Peptide Therapeutics Market Y-o-Y Growth Rate Comparison by Manufacturing Type (2016-2032)
- Table 168: Middle East & Africa Peptide Therapeutics Market Y-o-Y Growth Rate Comparison by Synthesis Technology (2016-2032)
- Table 169: Middle East & Africa Peptide Therapeutics Market Share Comparison by Country (2016-2032)
- Table 170: Middle East & Africa Peptide Therapeutics Market Share Comparison by Product Type (2016-2032)
- Table 171: Middle East & Africa Peptide Therapeutics Market Share Comparison by Application (2016-2032)
- Table 172: Middle East & Africa Peptide Therapeutics Market Share Comparison by Route of Administration (2016-2032)
- Table 173: Middle East & Africa Peptide Therapeutics Market Share Comparison by Manufacturing Type (2016-2032)
- Table 174: Middle East & Africa Peptide Therapeutics Market Share Comparison by Synthesis Technology (2016-2032)
- 1. Executive Summary
-
- Eli Lilly and Company
- Amgen Inc.
- Pfizer Inc.
- Takeda Pharmaceutical Company Limited
- Teva Pharmaceutical Industries Ltd.
- AstraZeneca
- Sanofi
- Novartis AG
- F. Hoffmann-La Roche Ltd
- GlaxoSmithKline plc.
- Novo Nordisk A/S
- Radius Health, Inc.
- Ironwood Pharmaceuticals, Inc.
- Other Key Players
Our Clients


View Our Licence Options
