
Packaging Foams Market By Material Type (Polystyrene, Polyethylene, Polyurethane, polypropylene, Poly Vinyl Chloride), By Product Type (Flexible Foam and Rigid Foam), By Application(Inserts, Corner and edge protectors, Anti-Static ESD Foam, Liners)By End User (Medical and Pharmaceutical, Food and Beverages, Aerospace and Defence, Automotive, Electrical and Electronics, Personal Care, Consumer Packaging, Others), By Region And Companies - Industry Segment Outlook, Market Assessment, Competition Scenario, Trends, And Forecast 2024-2033
-
48261
-
June 2024
-
300
-


-
This report was compiled by Kalyani Khudsange Kalyani Khudsange is a Research Analyst at Prudour Pvt. Ltd. with 2.5 years of experience in market research and a strong technical background in Chemical Engineering and manufacturing. Correspondence Sr. Research Analyst Linkedin | Detailed Market research Methodology Our methodology involves a mix of primary research, including interviews with leading mental health experts, and secondary research from reputable medical journals and databases. View Detailed Methodology Page
-
Quick Navigation
Report Overview
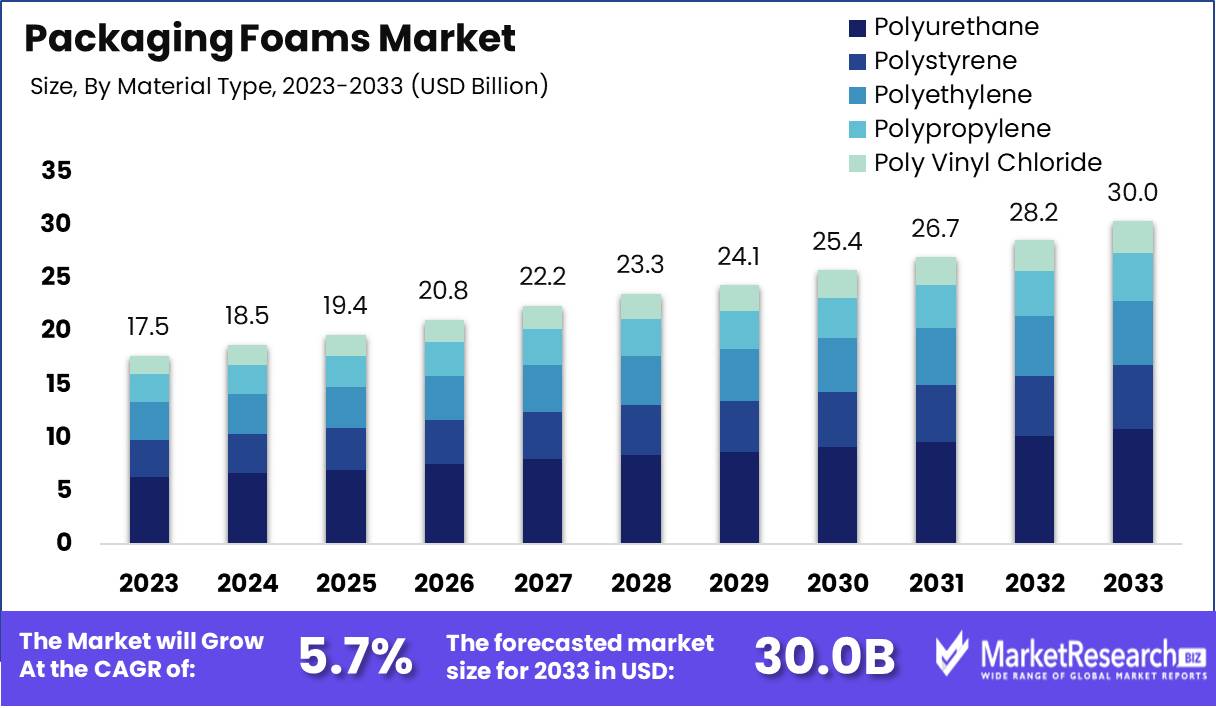
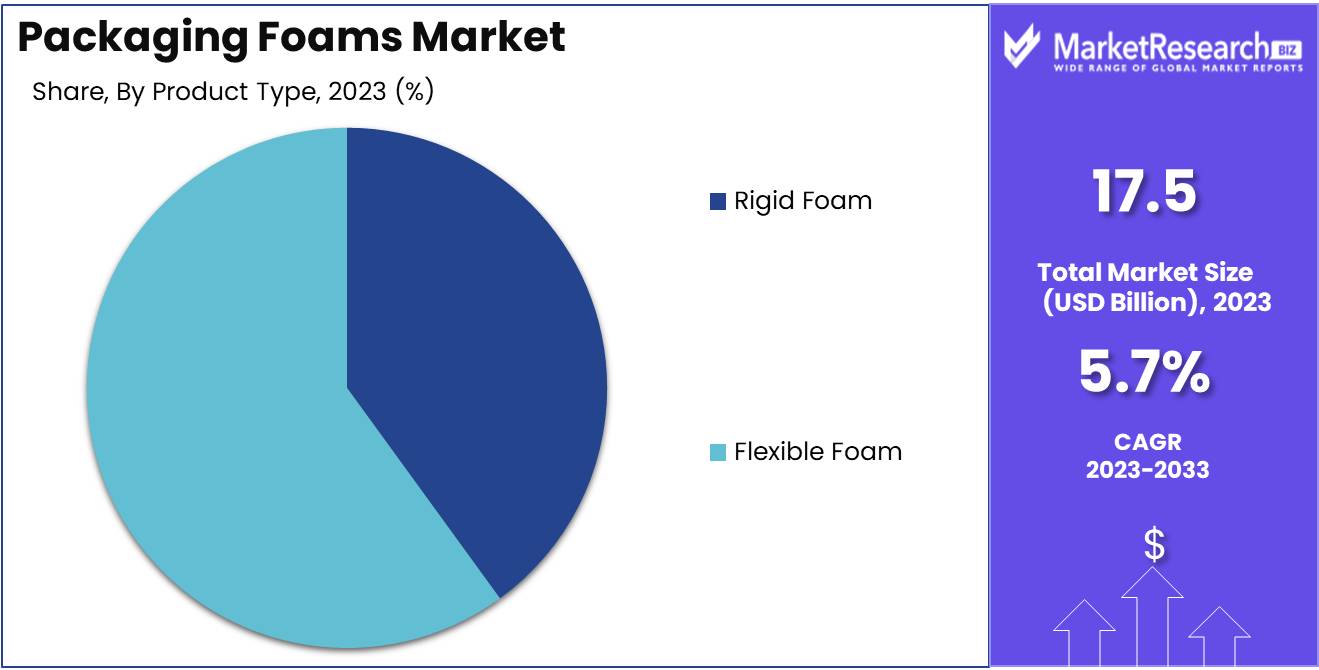
The Packaging Foams Market was valued at USD 17.5 billion in 2023. It is expected to reach USD 30.0 billion by 2033, with a CAGR of 5.7% during the forecast period from 2024 to 2033.
The Packaging Foams Market encompasses the production, distribution, and utilization of foam materials designed for protective packaging applications. These foams, including polyurethane, polystyrene, and polyethylene variants, offer cushioning, shock absorption, and thermal insulation for various goods across industries such as electronics, automotive, pharmaceuticals, and consumer goods. The market is driven by increasing e-commerce activity, demand for sustainable and recyclable materials, and advancements in foam technologies enhancing performance and cost-efficiency.
The Packaging Foams Market is undergoing significant transformation, driven by an increasing emphasis on sustainability. As environmental concerns intensify, the demand for recyclable and biodegradable packaging foams is propelling manufacturers to innovate and adopt sustainable practices. Traditional foam packaging, while effective, poses considerable disposal and recyclability challenges, contributing to environmental degradation. This shift towards eco-friendly solutions is not merely a regulatory compliance measure but a strategic imperative.
Companies are recognizing the long-term benefits of sustainable packaging, including enhanced brand reputation, customer loyalty, and potential cost savings from reduced material use and waste management expenses. Consequently, the market is witnessing a surge in R&D investments aimed at developing biodegradable and recyclable foam solutions, which is anticipated to spur significant innovation and growth.
Moreover, the trend towards sustainable packaging is reshaping competitive dynamics within the industry. Leading firms are prioritizing the integration of sustainable materials into their product portfolios, leveraging advanced technologies to enhance the performance and eco-friendliness of their packaging solutions. This shift is expected to catalyze a wave of market innovation, as companies strive to differentiate themselves through superior sustainability credentials. The transition to sustainable foam packaging is not without its challenges; however, the strategic benefits far outweigh the initial investment and operational adjustments required. As regulatory pressures mount and consumer preferences increasingly favor eco-conscious brands, the adoption of recyclable and biodegradable packaging foams is set to become a critical driver of competitive advantage and long-term market success.
Key Takeaways
- Market Growth: The Packaging Foams Market was valued at USD 17.5 billion in 2023. It is expected to reach USD 30.0 billion by 2033, with a CAGR of 5.7% during the forecast period from 2024 to 2033.
- By Material Type: Polyurethane dominated the packaging foams market due to its versatility.
- By Product Type: Flexible Foam-dominated packaging foams with versatile applications.
- By Application: Anti-Static ESD Foam's dominance underscores critical ESD protection in packaging solutions.
- By End User: Medical and Pharmaceutical dominated the Packaging Foams Market.
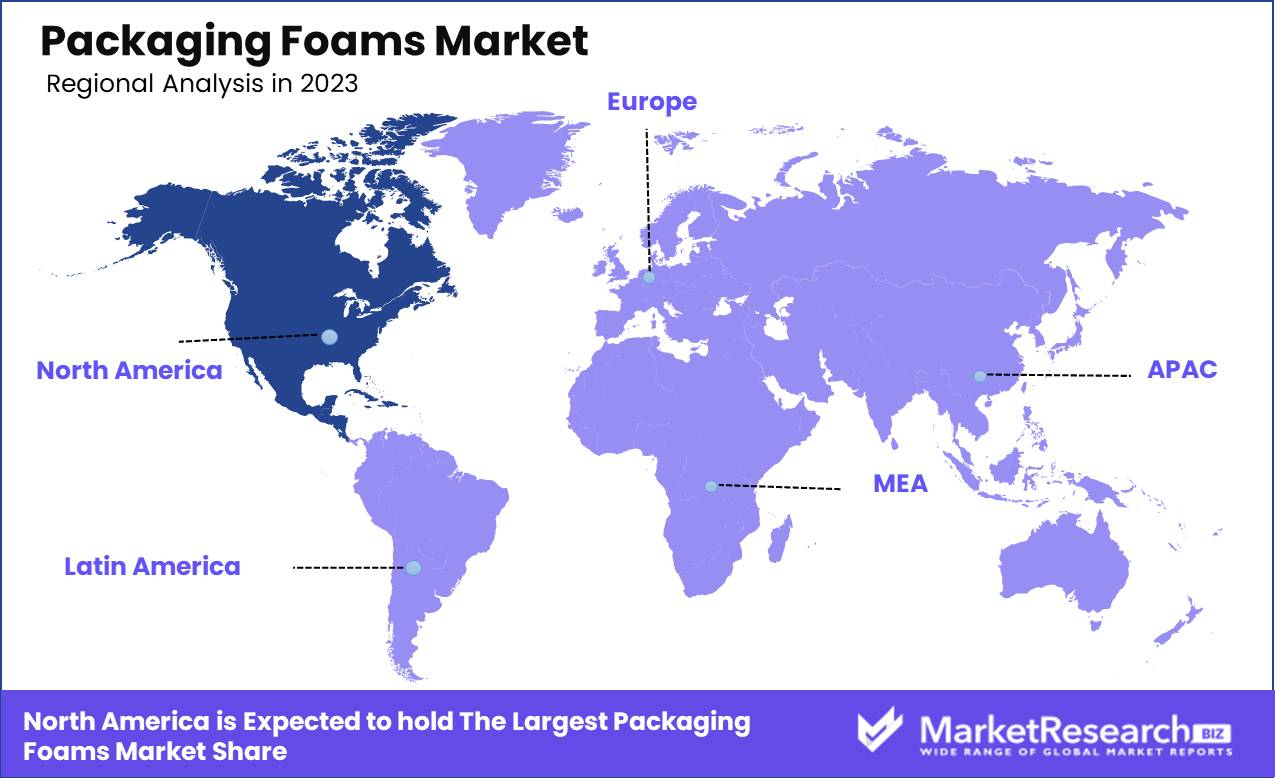
- Regional Dominance: North America leads the global packaging foams market, holding a 35% share.
- Growth Opportunity: The global packaging foams market will grow due to rising demand for sustainable solutions and expanding food and beverage industry needs.
Driving factors
Expanding E-Commerce Industry: A Catalyst for Packaging Foams Market Expansion
The burgeoning e-commerce industry is a significant driver of growth in the packaging foams market. With global e-commerce sales projected to reach $6.39 trillion by 2024, the demand for protective packaging solutions has skyrocketed. Packaging foams offer superior cushioning and protection, making them ideal for safeguarding products during transit. The increase in online shopping has led to a higher frequency of parcel shipments, directly increasing the need for effective packaging materials that can prevent damage and ensure customer satisfaction. This surge in e-commerce activity has resulted in a robust demand for packaging foams, as businesses strive to enhance the unboxing experience and reduce return rates due to damaged goods. Consequently, the packaging foams market is experiencing substantial growth, driven by the need to support the logistical requirements of the e-commerce boom.
Rising Demand for Sustainable Packaging Solutions: Shaping the Future of Foam Packaging
The growing environmental consciousness among consumers and regulatory pressures are propelling the demand for sustainable packaging solutions within the packaging foams market. Consumers are increasingly prioritizing eco-friendly products, prompting manufacturers to develop foams that are recyclable, biodegradable, or made from renewable resources. This shift is supported by statistics indicating that 74% of consumers are willing to pay more for sustainable packaging. The industry is responding by innovating with bio-based foams and enhancing the recyclability of traditional foam materials. For instance, companies are investing in research to create foams from plant-based polymers and improve recycling processes to meet sustainability goals. These advancements not only cater to consumer preferences but also help companies comply with stringent environmental regulations, thereby fostering market growth. The focus on sustainability is reshaping the packaging foams market, driving innovation, and adopting green technologies that promise a more sustainable future.
Advancements in Foam Manufacturing Technologies: Enhancing Efficiency and Quality
Technological advancements in foam manufacturing are playing a crucial role in propelling the packaging foam market forward. Innovations such as improved foam extrusion techniques, enhanced polymer blending processes, and advanced additive manufacturing are leading to the production of high-quality foams with better performance characteristics. These advancements have resulted in foams that offer superior strength, lightweight properties, and enhanced thermal insulation, making them highly suitable for a wide range of packaging applications.
Additionally, automation and digitalization in manufacturing processes have increased production efficiency and reduced costs, enabling manufacturers to meet the growing demand more effectively. The integration of smart manufacturing technologies, such as IoT and AI, is further optimizing production lines, ensuring consistent quality, and enabling customization to meet specific client needs. These technological breakthroughs are not only enhancing the capabilities of packaging foams but also driving their adoption across various industries, thereby contributing significantly to market growth.
Restraining Factors
Environmental Concerns and Regulations: A Significant Constraint on Market Expansion
The packaging foams market is significantly impacted by growing environmental concerns and stringent regulations. Governments and environmental organizations worldwide are increasingly advocating for sustainable packaging solutions to reduce plastic waste and carbon footprints. Packaging foams, predominantly made from non-biodegradable materials like polystyrene, are under scrutiny due to their environmental impact.
For instance, the European Union’s Single-Use Plastics Directive aims to reduce the consumption of single-use plastic products, including packaging foams. This regulatory push compels manufacturers to invest in research and development of eco-friendly alternatives, diverting resources from traditional foam production. Additionally, compliance with regulations increases operational costs, which can hinder market growth. In the United States, states like California have implemented bans on expanded polystyrene foam packaging, further constraining market expansion.
The global shift towards a circular economy also poses a challenge, as companies are pressured to adopt recyclable and reusable packaging solutions. According to a report by the Ellen MacArthur Foundation, transitioning to a circular economy could cut global plastic packaging demand by 30% by 2040, indicating a substantial reduction in the need for traditional packaging foams.
Competition from Alternative Packaging Materials: Eroding Market Share
The rise of alternative packaging materials presents a formidable challenge to the packaging foams market. Materials such as biodegradable plastics, paper, and molded pulp are gaining traction due to their sustainability and consumer preference for eco-friendly options.
Biodegradable plastics, for instance, are expected to grow at a compound annual growth rate (CAGR) of 14.5% from 2020 to 2027, reflecting a significant shift in market dynamics. These materials offer similar protective qualities as packaging foams but with the added benefit of reduced environmental impact. The paper packaging market, projected to reach USD 413.2 billion by 2025, is also expanding rapidly as companies and consumers prioritize recyclable and renewable materials.
Moreover, technological advancements in alternative packaging solutions enhance their performance and cost-competitiveness, further eroding the market share of traditional packaging foams. For example, advancements in molded pulp technology have made it a viable option for cushioning and protecting goods, which was traditionally the domain of foam packaging.
By Material Type Analysis
In 2023, Polyurethane dominated the packaging foams market due to its versatility.
In 2023, Polyurethane held a dominant market position in the "By Material Type" segment of the Packaging Foams Market. This supremacy can be attributed to polyurethane's versatile properties, such as high resilience, durability, and excellent cushioning characteristics, which are crucial for protective packaging applications. The material's adaptability in various forms, including rigid and flexible foams, enhances its utility across diverse packaging needs.
Polystyrene, while being lightweight and cost-effective, follows closely due to its extensive use in food and beverage packaging. Its excellent insulation properties make it a preferred choice for perishable goods. However, environmental concerns over its recyclability are restraining its growth. Polyethylene ranks third, appreciated for its flexibility and impact resistance. It is widely used in cushioning and protecting fragile items during transit. Its ease of processing and cost efficiency further augment its appeal in the packaging sector.
Polypropylene, known for its superior strength and chemical resistance, finds applications in packaging heavy-duty items. Its relatively higher cost, however, limits its market share compared to other materials. Polyvinyl chloride (PVC), although offering good chemical stability and transparency, is less favored due to environmental and health concerns associated with its production and disposal. Despite these challenges, its use persists in specific niche applications where its unique properties are indispensable.
By Product Type Analysis
In 2023, Flexible Foam dominated packaging foams with versatile applications.
In 2023, Flexible Foam held a dominant market position in the By Product Type segment of the Packaging Foams Market. This supremacy can be attributed to its versatile applications, ranging from cushioning and protective packaging to insulation and shock absorption. Flexible foam's lightweight nature, combined with its excellent durability and adaptability, makes it a preferred choice for various industries, including consumer goods, electronics, and e-commerce.
Conversely, Rigid Foam also plays a crucial role, especially in scenarios requiring superior structural support and thermal insulation. Widely used in the packaging of heavy machinery, automotive parts, and temperature-sensitive products, rigid foam offers robustness and enhanced protective qualities. Its high compressive strength and resistance to deformation under load ensure the safety and integrity of packaged goods during transit and storage.
Both types of foam cater to distinct needs within the packaging industry, with flexible foam providing adaptability and lightweight solutions, while rigid foam delivers enhanced protection and stability. This dual-market approach ensures comprehensive coverage of packaging requirements, driving sustained growth in the packaging foams market.
By Application Analysis
Anti-Static ESD Foam's dominance underscores critical ESD protection in packaging solutions.
In 2023, Anti-Static ESD Foam held a dominant market position in the By Application segment of the Packaging Foams Market. This segment is crucial due to its critical role in protecting sensitive electronic components from electrostatic discharge (ESD), which can cause significant damage. Inserts, which account for a substantial share, are designed to cushion and secure products within the packaging, ensuring stability and minimizing movement during transit. These are particularly vital in the electronics and medical devices industries, where precision and protection are paramount.
Corner and edge protectors are another essential application, safeguarding products from impact and abrasion during handling and transportation. They are widely used across various sectors, including automotive and furniture, highlighting their versatility and demand.
Anti-static ESD Foam, specifically, addresses the unique requirements of the electronics industry. By dissipating static electricity, it prevents damage to sensitive components, thus maintaining product integrity and performance. This specialization has led to its significant market share, driven by the increasing prevalence of electronics in everyday life and industrial applications.
Liners, while less prominent, play a supportive role by providing an additional layer of protection within boxes and containers. They are often used in conjunction with other packaging solutions to enhance overall product safety.
By End User Analysis
In 2023, Medical and Pharmaceutical dominated the Packaging Foams Market.
In 2023, The Medical and Pharmaceutical sector held a dominant market position in the end-user segment of the Packaging Foams Market. This dominance is attributed to the sector's stringent requirements for protective and reliable packaging solutions, essential for safeguarding sensitive medical equipment and pharmaceutical products. The need for sterility, durability, and resistance to contamination drives the demand for high-quality packaging foams, ensuring product integrity from manufacturer to end-user.
Concurrently, the Food and Beverages industry leveraged packaging foams for their excellent insulation properties, crucial for maintaining product freshness and safety. The Aerospace and Defence sectors utilized these materials for their lightweight and impact-resistant qualities, enhancing the safety and performance of critical components. In the Automotive industry, packaging foams provide essential cushioning and protection during the transport of delicate automotive parts, contributing to reduced damage and improved logistics efficiency.
Electrical and Electronics benefited from the anti-static properties of certain foam types, safeguarding sensitive electronic components against electrostatic discharge. Personal Care products rely on packaging foams to prevent breakage and maintain the aesthetic appeal of premium goods. Consumer Packaging saw diverse applications, from everyday household items to luxury products, driven by the need for both functionality and consumer appeal. Lastly, various other industries, encompassing niche applications, utilized packaging foams for their adaptability and customizability, underscoring the material's versatility across sectors.
Key Market Segments
By Material Type
- Polystyrene
- Polyethylene
- Polyurethane
- Polypropylene
- Poly Vinyl Chloride
By Product Type
- Flexible Foam
- Rigid Foam
By Application
- Inserts
- Corner and edge protectors
- Anti-Static ESD Foam
- Liners
By End User
- Medical and Pharmaceutical
- Food and Beverages
- Aerospace and Defence
- Automotive
- Electrical and Electronics
- Personal Care
- Consumer Packaging
- Others
Growth Opportunity
Increasing Demand for Sustainable and Eco-Friendly Packaging Solutions
In the global packaging foams market is poised to benefit significantly from the rising demand for sustainable and eco-friendly packaging solutions. This shift is largely driven by consumer awareness and stringent regulatory requirements aimed at reducing environmental impact. Companies are increasingly investing in the development of biodegradable and recyclable foam materials, presenting a substantial growth opportunity. For instance, advancements in polylactic acid (PLA) and other biopolymer technologies are expected to create new avenues for market expansion. Adopting these sustainable alternatives not only aligns with global sustainability goals but also provides a competitive edge by catering to the environmentally conscious consumer base.
Growth of the Food and Beverage Industry
The robust growth of the food and beverage industry further amplifies the potential for the packaging foams market. With an expanding global population and rising disposable incomes, the demand for packaged food and beverages is escalating. Packaging foams, known for their superior insulation and protective properties, are essential in maintaining the quality and safety of food products during transportation and storage. As the food and beverage sector continues to flourish, particularly in emerging economies, the demand for innovative packaging solutions, including foams, is expected to surge. This trend is supported by the increasing adoption of online grocery shopping and food delivery services, which require reliable and efficient packaging to ensure product integrity.
Latest Trends
Growth of the Food and Electronics Industries
In the packaging foams market is poised for significant growth, driven largely by the expansion of the food and electronics sectors. The food industry’s increasing demand for protective packaging solutions stems from the rising consumer preference for online grocery shopping and meal delivery services. As fresh produce and perishable items require secure packaging to maintain their quality and extend shelf life, the use of packaging foams becomes indispensable.
Simultaneously, the electronics industry continues to burgeon, with a growing need for high-performance packaging materials that ensure the safe transport and storage of delicate electronic devices. The surge in consumer electronics, coupled with the proliferation of advanced technologies such as IoT and AI-driven devices, underscores the importance of robust packaging solutions. Packaging foams, with their superior shock-absorbing properties, offer an ideal solution for safeguarding fragile electronic components against damage during transit.
Emphasis on Product Safety and Protection
Another critical trend influencing the packaging foams market is the heightened emphasis on product safety and protection. Manufacturers across various industries are increasingly prioritizing the integrity and security of their products during distribution. This focus is driven by both regulatory standards and consumer expectations, compelling businesses to adopt packaging solutions that minimize risk and prevent damage.
Packaging foams are at the forefront of this shift, offering unparalleled cushioning and protection. Innovations in foam materials are leading to the development of eco-friendly and recyclable options, addressing environmental concerns while maintaining high safety standards. Furthermore, advancements in customization enable packaging foams to be tailored specifically to product requirements, enhancing their protective capabilities.
Regional Analysis
North America leads the global packaging foams market, holding a 35% share.
The global packaging foams market exhibits significant regional variation, with distinct drivers and trends characterizing each geography. North America dominates the market, accounting for approximately 35% of the global revenue. This leadership is driven by robust demand from the e-commerce sector, stringent packaging regulations, and a strong emphasis on sustainable packaging solutions. The U.S., with its advanced manufacturing base and innovative packaging technologies, plays a pivotal role in the region's supremacy.
In Europe, which holds a substantial market share of around 25%, the focus is on reducing environmental impact, leading to increased adoption of biodegradable and recyclable foams. Countries like Germany and France are at the forefront, propelled by stringent EU regulations and consumer demand for eco-friendly products.
The Asia Pacific region, with a market share close to 30%, is experiencing rapid growth due to the burgeoning e-commerce industry, expanding consumer goods sector, and rising disposable incomes in countries such as China and India. The region's manufacturing prowess and cost-effective production capabilities further augment its market position.
The Middle East & Africa and Latin America, though smaller in market share, show promising growth prospects. The Middle East & Africa region benefits from an expanding industrial base and increased packaging requirements in the food and beverage sector. Latin America, particularly Brazil, is seeing growth driven by improved economic conditions and rising consumer demand for packaged goods.
Key Regions and Countries
North America
- The US
- Canada
- Rest of North America
Europe
- Germany
- France
- The UK
- Spain
- Netherlands
- Russia
- Italy
- Rest of Europe
Asia-Pacific
- China
- Japan
- Singapore
- Thailand
- South Korea
- Vietnam
- India
- New Zealand
- Rest of Asia Pacific
Latin America
- Mexico
- Brazil
- Rest of Latin America
Middle East & Africa
- Saudi Arabia
- South Africa
- UAE
- Rest of the Middle East & Africa
Key Players Analysis
In 2024, the global packaging foams market is poised for significant growth, driven by the increasing demand for lightweight, durable, and protective packaging solutions across various industries. Key players in this market, such as Sealed Air Corporation, BASF SE, and Synthos SA, are at the forefront of innovation, leveraging advanced materials and technologies to enhance product performance and sustainability.
Sealed Air Corporation continues to dominate with its diverse product portfolio and commitment to sustainability, incorporating recyclable and biodegradable foam solutions. BASF SE, a leader in chemical production, focuses on high-performance polyurethane foams that offer superior insulation and protection. Synthos SA stands out with its competitive edge in styrene-based foams, emphasizing energy efficiency and environmental compliance.
FoamPartner Group and Rogers Corporation are notable for their specialty foam solutions, catering to niche applications in the automotive, aerospace, and electronics sectors. JSP Corporation and UFP Technologies Inc. emphasize lightweight and resilient foam products, driven by rising demand in the e-commerce and consumer goods markets.
Emerging players like Synbra Holding bv and Zotefoams Plc are gaining traction through strategic acquisitions and expansion of their sustainable product lines. Companies such as Hanwha Corporation and Kaneka Corporation are also making significant strides in innovative foam technologies, focusing on high-performance applications.
Overall, the competitive landscape in 2024 is marked by a strong emphasis on sustainability, technological innovation, and strategic partnerships, positioning these companies to capitalize on the evolving demands of the global packaging foams market.
Market Key Players
- Sealed Air Corporation
- BASF SE
- Synthos SA
- FoamPartner Group
- Rogers Corporation
- JSP Corporation
- UFP Technologies Inc.
- Synbra Holding bv
- UFP Technologies
- Armacell LLC
- Tosoh Corporation
- ACH Foam Technologies
- FoamCraft Packaging Inc
- Hanwha Corporation
- Plastifoam Company
- Marko Foam Products Inc.
- TotalEnergies
- NCFI Polyurethanes
- Huebach Corporation
- Wasatch Container
- Dongshing Industry Inc.
- Zotefoams Plc.
- Borealis
- Kaneka Corporation
Recent Development
- In February 2023, Sealed Air Corporation acquired FoamPartner Group, a leading provider of sustainable packaging foams. This strategic acquisition aims to expand Sealed Air’s product portfolio and enhance its market reach, particularly in sustainable packaging solutions.
- In January 2023, Sonoco Products Company announced the opening of a new packaging foam manufacturing facility in China. This facility is intended to meet the increasing demand for packaging foams in the Chinese market, driven by the growth of e-commerce and the need for efficient packaging solutions.
Report Scope
Report Features Description Market Value (2023) USD 17.5 Billion Forecast Revenue (2033) USD 30.0 Billion CAGR (2024-2032) 5.7% Base Year for Estimation 2023 Historic Period 2016-2023 Forecast Period 2024-2033 Report Coverage Revenue Forecast, Market Dynamics, COVID-19 Impact, Competitive Landscape, Recent Developments Segments Covered By Material Type (Polystyrene, Polyethylene, Polyurethane, polypropylene, Poly Vinyl Chloride), By Product Type (Flexible Foam and Rigid Foam), By Application(Inserts, Corner and edge protectors, Anti-Static ESD Foam, Liners)By End User (Medical and Pharmaceutical, Food and Beverages, Aerospace and Defence, Automotive, Electrical and Electronics, Personal Care, Consumer Packaging, Others) Regional Analysis North America - The US, Canada, Rest of North America, Europe - Germany, France, The UK, Spain, Italy, Russia, Netherlands, Rest of Europe, Asia-Pacific - China, Japan, South Korea, India, New Zealand, Singapore, Thailand, Vietnam, Rest of Asia Pacific, Latin America - Brazil, Mexico, Rest of Latin America, Middle East & Africa - South Africa, Saudi Arabia, UAE, Rest of Middle East & Africa Competitive Landscape Sealed Air Corporation, BASF SE, Synthos SA, FoamPartner Group, Rogers Corporation, JSP Corporation, UFP Technologies Inc., Synbra Holding bv, UFP Technologies, Armacell LLC, Tosoh Corporation, ACH Foam Technologies, FoamCraft Packaging Inc, Hanwha Corporation, Plastifoam Company, Marko Foam Products Inc., TotalEnergies, NCFI Polyurethanes, Huebach Corporation, Wasatch Container, Dongshing Industry Inc., Zotefoams Plc., Borealis, Kaneka Corporation Customization Scope Customization for segments, region/country-level will be provided. Moreover, additional customization can be done based on the requirements. Purchase Options We have three licenses to opt for Single User License, Multi-User License (Up to 5 Users), Corporate Use License (Unlimited User and Printable PDF) -
- 1. Executive Summary
- 1.1. Definition
- 1.2. Taxonomy
- 1.3. Research Scope
- 1.4. Key Analysis
- 1.5. Key Findings by Major Segments
- 1.6. Top strategies by Major Players
- 2. Global Packaging Foams Market Overview
- 2.1. Packaging Foams Market Dynamics
- 2.1.1. Drivers
- 2.1.2. Opportunities
- 2.1.3. Restraints
- 2.1.4. Challenges
- 2.2. Macro-economic Factors
- 2.3. Regulatory Framework
- 2.4. Market Investment Feasibility Index
- 2.5. PEST Analysis
- 2.6. PORTER’S Five Force Analysis
- 2.7. Drivers & Restraints Impact Analysis
- 2.8. Industry Chain Analysis
- 2.9. Cost Structure Analysis
- 2.10. Marketing Strategy
- 2.11. Russia-Ukraine War Impact Analysis
- 2.12. Opportunity Map Analysis
- 2.13. Market Competition Scenario Analysis
- 2.14. Product Life Cycle Analysis
- 2.15. Opportunity Orbits
- 2.16. Manufacturer Intensity Map
- 2.17. Major Companies sales by Value & Volume
- 2.1. Packaging Foams Market Dynamics
- 3. Global Packaging Foams Market Analysis, Opportunity and Forecast, 2016-2032
- 3.1. Global Packaging Foams Market Analysis, 2016-2021
- 3.2. Global Packaging Foams Market Opportunity and Forecast, 2023-2032
- 3.3. Global Packaging Foams Market Analysis, Opportunity and Forecast, By Material Type, 2016-2032
- 3.3.1. Global Packaging Foams Market Analysis by Material Type: Introduction
- 3.3.2. Market Size Absolute $ Opportunity Analysis and Forecast, By Material Type, 2016-2032
- 3.3.3. Polystyrene
- 3.3.4. Polyethylene
- 3.3.5. Polyurethane
- 3.3.6. polypropylene
- 3.3.7. Poly Vinyl Chloride
- 3.4. Global Packaging Foams Market Analysis, Opportunity and Forecast, By Product Type, 2016-2032
- 3.4.1. Global Packaging Foams Market Analysis by Product Type: Introduction
- 3.4.2. Market Size Absolute $ Opportunity Analysis and Forecast, By Product Type, 2016-2032
- 3.4.3. Flexible Foam
- 3.4.4. Rigid Foam
- 3.5. Global Packaging Foams Market Analysis, Opportunity and Forecast, By Application, 2016-2032
- 3.5.1. Global Packaging Foams Market Analysis by Application: Introduction
- 3.5.2. Market Size Absolute $ Opportunity Analysis and Forecast, By Application, 2016-2032
- 3.5.3. Inserts
- 3.5.4. Corner and edge protectors
- 3.5.5. Anti-Static ESD Foam
- 3.5.6. Liners
- 3.6. Global Packaging Foams Market Analysis, Opportunity and Forecast, By End User, 2016-2032
- 3.6.1. Global Packaging Foams Market Analysis by End User: Introduction
- 3.6.2. Market Size Absolute $ Opportunity Analysis and Forecast, By End User, 2016-2032
- 3.6.3. Medical and Pharmaceutical
- 3.6.4. Food and Beverages
- 3.6.5. Aerospace and Defence
- 3.6.6. Automotive
- 3.6.7. Electrical and Electronics
- 3.6.8. Personal Care
- 3.6.9. Consumer Packaging
- 3.6.10. Others
- 4. North America Packaging Foams Market Analysis, Opportunity and Forecast, 2016-2032
- 4.1. North America Packaging Foams Market Analysis, 2016-2021
- 4.2. North America Packaging Foams Market Opportunity and Forecast, 2023-2032
- 4.3. North America Packaging Foams Market Analysis, Opportunity and Forecast, By Material Type, 2016-2032
- 4.3.1. North America Packaging Foams Market Analysis by Material Type: Introduction
- 4.3.2. Market Size Absolute $ Opportunity Analysis and Forecast, By Material Type, 2016-2032
- 4.3.3. Polystyrene
- 4.3.4. Polyethylene
- 4.3.5. Polyurethane
- 4.3.6. polypropylene
- 4.3.7. Poly Vinyl Chloride
- 4.4. North America Packaging Foams Market Analysis, Opportunity and Forecast, By Product Type, 2016-2032
- 4.4.1. North America Packaging Foams Market Analysis by Product Type: Introduction
- 4.4.2. Market Size Absolute $ Opportunity Analysis and Forecast, By Product Type, 2016-2032
- 4.4.3. Flexible Foam
- 4.4.4. Rigid Foam
- 4.5. North America Packaging Foams Market Analysis, Opportunity and Forecast, By Application, 2016-2032
- 4.5.1. North America Packaging Foams Market Analysis by Application: Introduction
- 4.5.2. Market Size Absolute $ Opportunity Analysis and Forecast, By Application, 2016-2032
- 4.5.3. Inserts
- 4.5.4. Corner and edge protectors
- 4.5.5. Anti-Static ESD Foam
- 4.5.6. Liners
- 4.6. North America Packaging Foams Market Analysis, Opportunity and Forecast, By End User, 2016-2032
- 4.6.1. North America Packaging Foams Market Analysis by End User: Introduction
- 4.6.2. Market Size Absolute $ Opportunity Analysis and Forecast, By End User, 2016-2032
- 4.6.3. Medical and Pharmaceutical
- 4.6.4. Food and Beverages
- 4.6.5. Aerospace and Defence
- 4.6.6. Automotive
- 4.6.7. Electrical and Electronics
- 4.6.8. Personal Care
- 4.6.9. Consumer Packaging
- 4.6.10. Others
- 4.7. North America Packaging Foams Market Analysis, Opportunity and Forecast, By Country , 2016-2032
- 4.7.1. North America Packaging Foams Market Analysis by Country : Introduction
- 4.7.2. Market Size Absolute $ Opportunity Analysis and Forecast, Country , 2016-2032
- 4.7.2.1. The US
- 4.7.2.2. Canada
- 4.7.2.3. Mexico
- 5. Western Europe Packaging Foams Market Analysis, Opportunity and Forecast, 2016-2032
- 5.1. Western Europe Packaging Foams Market Analysis, 2016-2021
- 5.2. Western Europe Packaging Foams Market Opportunity and Forecast, 2023-2032
- 5.3. Western Europe Packaging Foams Market Analysis, Opportunity and Forecast, By Material Type, 2016-2032
- 5.3.1. Western Europe Packaging Foams Market Analysis by Material Type: Introduction
- 5.3.2. Market Size Absolute $ Opportunity Analysis and Forecast, By Material Type, 2016-2032
- 5.3.3. Polystyrene
- 5.3.4. Polyethylene
- 5.3.5. Polyurethane
- 5.3.6. polypropylene
- 5.3.7. Poly Vinyl Chloride
- 5.4. Western Europe Packaging Foams Market Analysis, Opportunity and Forecast, By Product Type, 2016-2032
- 5.4.1. Western Europe Packaging Foams Market Analysis by Product Type: Introduction
- 5.4.2. Market Size Absolute $ Opportunity Analysis and Forecast, By Product Type, 2016-2032
- 5.4.3. Flexible Foam
- 5.4.4. Rigid Foam
- 5.5. Western Europe Packaging Foams Market Analysis, Opportunity and Forecast, By Application, 2016-2032
- 5.5.1. Western Europe Packaging Foams Market Analysis by Application: Introduction
- 5.5.2. Market Size Absolute $ Opportunity Analysis and Forecast, By Application, 2016-2032
- 5.5.3. Inserts
- 5.5.4. Corner and edge protectors
- 5.5.5. Anti-Static ESD Foam
- 5.5.6. Liners
- 5.6. Western Europe Packaging Foams Market Analysis, Opportunity and Forecast, By End User, 2016-2032
- 5.6.1. Western Europe Packaging Foams Market Analysis by End User: Introduction
- 5.6.2. Market Size Absolute $ Opportunity Analysis and Forecast, By End User, 2016-2032
- 5.6.3. Medical and Pharmaceutical
- 5.6.4. Food and Beverages
- 5.6.5. Aerospace and Defence
- 5.6.6. Automotive
- 5.6.7. Electrical and Electronics
- 5.6.8. Personal Care
- 5.6.9. Consumer Packaging
- 5.6.10. Others
- 5.7. Western Europe Packaging Foams Market Analysis, Opportunity and Forecast, By Country , 2016-2032
- 5.7.1. Western Europe Packaging Foams Market Analysis by Country : Introduction
- 5.7.2. Market Size Absolute $ Opportunity Analysis and Forecast, Country , 2016-2032
- 5.7.2.1. Germany
- 5.7.2.2. France
- 5.7.2.3. The UK
- 5.7.2.4. Spain
- 5.7.2.5. Italy
- 5.7.2.6. Portugal
- 5.7.2.7. Ireland
- 5.7.2.8. Austria
- 5.7.2.9. Switzerland
- 5.7.2.10. Benelux
- 5.7.2.11. Nordic
- 5.7.2.12. Rest of Western Europe
- 6. Eastern Europe Packaging Foams Market Analysis, Opportunity and Forecast, 2016-2032
- 6.1. Eastern Europe Packaging Foams Market Analysis, 2016-2021
- 6.2. Eastern Europe Packaging Foams Market Opportunity and Forecast, 2023-2032
- 6.3. Eastern Europe Packaging Foams Market Analysis, Opportunity and Forecast, By Material Type, 2016-2032
- 6.3.1. Eastern Europe Packaging Foams Market Analysis by Material Type: Introduction
- 6.3.2. Market Size Absolute $ Opportunity Analysis and Forecast, By Material Type, 2016-2032
- 6.3.3. Polystyrene
- 6.3.4. Polyethylene
- 6.3.5. Polyurethane
- 6.3.6. polypropylene
- 6.3.7. Poly Vinyl Chloride
- 6.4. Eastern Europe Packaging Foams Market Analysis, Opportunity and Forecast, By Product Type, 2016-2032
- 6.4.1. Eastern Europe Packaging Foams Market Analysis by Product Type: Introduction
- 6.4.2. Market Size Absolute $ Opportunity Analysis and Forecast, By Product Type, 2016-2032
- 6.4.3. Flexible Foam
- 6.4.4. Rigid Foam
- 6.5. Eastern Europe Packaging Foams Market Analysis, Opportunity and Forecast, By Application, 2016-2032
- 6.5.1. Eastern Europe Packaging Foams Market Analysis by Application: Introduction
- 6.5.2. Market Size Absolute $ Opportunity Analysis and Forecast, By Application, 2016-2032
- 6.5.3. Inserts
- 6.5.4. Corner and edge protectors
- 6.5.5. Anti-Static ESD Foam
- 6.5.6. Liners
- 6.6. Eastern Europe Packaging Foams Market Analysis, Opportunity and Forecast, By End User, 2016-2032
- 6.6.1. Eastern Europe Packaging Foams Market Analysis by End User: Introduction
- 6.6.2. Market Size Absolute $ Opportunity Analysis and Forecast, By End User, 2016-2032
- 6.6.3. Medical and Pharmaceutical
- 6.6.4. Food and Beverages
- 6.6.5. Aerospace and Defence
- 6.6.6. Automotive
- 6.6.7. Electrical and Electronics
- 6.6.8. Personal Care
- 6.6.9. Consumer Packaging
- 6.6.10. Others
- 6.7. Eastern Europe Packaging Foams Market Analysis, Opportunity and Forecast, By Country , 2016-2032
- 6.7.1. Eastern Europe Packaging Foams Market Analysis by Country : Introduction
- 6.7.2. Market Size Absolute $ Opportunity Analysis and Forecast, Country , 2016-2032
- 6.7.2.1. Russia
- 6.7.2.2. Poland
- 6.7.2.3. The Czech Republic
- 6.7.2.4. Greece
- 6.7.2.5. Rest of Eastern Europe
- 7. APAC Packaging Foams Market Analysis, Opportunity and Forecast, 2016-2032
- 7.1. APAC Packaging Foams Market Analysis, 2016-2021
- 7.2. APAC Packaging Foams Market Opportunity and Forecast, 2023-2032
- 7.3. APAC Packaging Foams Market Analysis, Opportunity and Forecast, By Material Type, 2016-2032
- 7.3.1. APAC Packaging Foams Market Analysis by Material Type: Introduction
- 7.3.2. Market Size Absolute $ Opportunity Analysis and Forecast, By Material Type, 2016-2032
- 7.3.3. Polystyrene
- 7.3.4. Polyethylene
- 7.3.5. Polyurethane
- 7.3.6. polypropylene
- 7.3.7. Poly Vinyl Chloride
- 7.4. APAC Packaging Foams Market Analysis, Opportunity and Forecast, By Product Type, 2016-2032
- 7.4.1. APAC Packaging Foams Market Analysis by Product Type: Introduction
- 7.4.2. Market Size Absolute $ Opportunity Analysis and Forecast, By Product Type, 2016-2032
- 7.4.3. Flexible Foam
- 7.4.4. Rigid Foam
- 7.5. APAC Packaging Foams Market Analysis, Opportunity and Forecast, By Application, 2016-2032
- 7.5.1. APAC Packaging Foams Market Analysis by Application: Introduction
- 7.5.2. Market Size Absolute $ Opportunity Analysis and Forecast, By Application, 2016-2032
- 7.5.3. Inserts
- 7.5.4. Corner and edge protectors
- 7.5.5. Anti-Static ESD Foam
- 7.5.6. Liners
- 7.6. APAC Packaging Foams Market Analysis, Opportunity and Forecast, By End User, 2016-2032
- 7.6.1. APAC Packaging Foams Market Analysis by End User: Introduction
- 7.6.2. Market Size Absolute $ Opportunity Analysis and Forecast, By End User, 2016-2032
- 7.6.3. Medical and Pharmaceutical
- 7.6.4. Food and Beverages
- 7.6.5. Aerospace and Defence
- 7.6.6. Automotive
- 7.6.7. Electrical and Electronics
- 7.6.8. Personal Care
- 7.6.9. Consumer Packaging
- 7.6.10. Others
- 7.7. APAC Packaging Foams Market Analysis, Opportunity and Forecast, By Country , 2016-2032
- 7.7.1. APAC Packaging Foams Market Analysis by Country : Introduction
- 7.7.2. Market Size Absolute $ Opportunity Analysis and Forecast, Country , 2016-2032
- 7.7.2.1. China
- 7.7.2.2. Japan
- 7.7.2.3. South Korea
- 7.7.2.4. India
- 7.7.2.5. Australia & New Zeland
- 7.7.2.6. Indonesia
- 7.7.2.7. Malaysia
- 7.7.2.8. Philippines
- 7.7.2.9. Singapore
- 7.7.2.10. Thailand
- 7.7.2.11. Vietnam
- 7.7.2.12. Rest of APAC
- 8. Latin America Packaging Foams Market Analysis, Opportunity and Forecast, 2016-2032
- 8.1. Latin America Packaging Foams Market Analysis, 2016-2021
- 8.2. Latin America Packaging Foams Market Opportunity and Forecast, 2023-2032
- 8.3. Latin America Packaging Foams Market Analysis, Opportunity and Forecast, By Material Type, 2016-2032
- 8.3.1. Latin America Packaging Foams Market Analysis by Material Type: Introduction
- 8.3.2. Market Size Absolute $ Opportunity Analysis and Forecast, By Material Type, 2016-2032
- 8.3.3. Polystyrene
- 8.3.4. Polyethylene
- 8.3.5. Polyurethane
- 8.3.6. polypropylene
- 8.3.7. Poly Vinyl Chloride
- 8.4. Latin America Packaging Foams Market Analysis, Opportunity and Forecast, By Product Type, 2016-2032
- 8.4.1. Latin America Packaging Foams Market Analysis by Product Type: Introduction
- 8.4.2. Market Size Absolute $ Opportunity Analysis and Forecast, By Product Type, 2016-2032
- 8.4.3. Flexible Foam
- 8.4.4. Rigid Foam
- 8.5. Latin America Packaging Foams Market Analysis, Opportunity and Forecast, By Application, 2016-2032
- 8.5.1. Latin America Packaging Foams Market Analysis by Application: Introduction
- 8.5.2. Market Size Absolute $ Opportunity Analysis and Forecast, By Application, 2016-2032
- 8.5.3. Inserts
- 8.5.4. Corner and edge protectors
- 8.5.5. Anti-Static ESD Foam
- 8.5.6. Liners
- 8.6. Latin America Packaging Foams Market Analysis, Opportunity and Forecast, By End User, 2016-2032
- 8.6.1. Latin America Packaging Foams Market Analysis by End User: Introduction
- 8.6.2. Market Size Absolute $ Opportunity Analysis and Forecast, By End User, 2016-2032
- 8.6.3. Medical and Pharmaceutical
- 8.6.4. Food and Beverages
- 8.6.5. Aerospace and Defence
- 8.6.6. Automotive
- 8.6.7. Electrical and Electronics
- 8.6.8. Personal Care
- 8.6.9. Consumer Packaging
- 8.6.10. Others
- 8.7. Latin America Packaging Foams Market Analysis, Opportunity and Forecast, By Country , 2016-2032
- 8.7.1. Latin America Packaging Foams Market Analysis by Country : Introduction
- 8.7.2. Market Size Absolute $ Opportunity Analysis and Forecast, Country , 2016-2032
- 8.7.2.1. Brazil
- 8.7.2.2. Colombia
- 8.7.2.3. Chile
- 8.7.2.4. Argentina
- 8.7.2.5. Costa Rica
- 8.7.2.6. Rest of Latin America
- 9. Middle East & Africa Packaging Foams Market Analysis, Opportunity and Forecast, 2016-2032
- 9.1. Middle East & Africa Packaging Foams Market Analysis, 2016-2021
- 9.2. Middle East & Africa Packaging Foams Market Opportunity and Forecast, 2023-2032
- 9.3. Middle East & Africa Packaging Foams Market Analysis, Opportunity and Forecast, By Material Type, 2016-2032
- 9.3.1. Middle East & Africa Packaging Foams Market Analysis by Material Type: Introduction
- 9.3.2. Market Size Absolute $ Opportunity Analysis and Forecast, By Material Type, 2016-2032
- 9.3.3. Polystyrene
- 9.3.4. Polyethylene
- 9.3.5. Polyurethane
- 9.3.6. polypropylene
- 9.3.7. Poly Vinyl Chloride
- 9.4. Middle East & Africa Packaging Foams Market Analysis, Opportunity and Forecast, By Product Type, 2016-2032
- 9.4.1. Middle East & Africa Packaging Foams Market Analysis by Product Type: Introduction
- 9.4.2. Market Size Absolute $ Opportunity Analysis and Forecast, By Product Type, 2016-2032
- 9.4.3. Flexible Foam
- 9.4.4. Rigid Foam
- 9.5. Middle East & Africa Packaging Foams Market Analysis, Opportunity and Forecast, By Application, 2016-2032
- 9.5.1. Middle East & Africa Packaging Foams Market Analysis by Application: Introduction
- 9.5.2. Market Size Absolute $ Opportunity Analysis and Forecast, By Application, 2016-2032
- 9.5.3. Inserts
- 9.5.4. Corner and edge protectors
- 9.5.5. Anti-Static ESD Foam
- 9.5.6. Liners
- 9.6. Middle East & Africa Packaging Foams Market Analysis, Opportunity and Forecast, By End User, 2016-2032
- 9.6.1. Middle East & Africa Packaging Foams Market Analysis by End User: Introduction
- 9.6.2. Market Size Absolute $ Opportunity Analysis and Forecast, By End User, 2016-2032
- 9.6.3. Medical and Pharmaceutical
- 9.6.4. Food and Beverages
- 9.6.5. Aerospace and Defence
- 9.6.6. Automotive
- 9.6.7. Electrical and Electronics
- 9.6.8. Personal Care
- 9.6.9. Consumer Packaging
- 9.6.10. Others
- 9.7. Middle East & Africa Packaging Foams Market Analysis, Opportunity and Forecast, By Country , 2016-2032
- 9.7.1. Middle East & Africa Packaging Foams Market Analysis by Country : Introduction
- 9.7.2. Market Size Absolute $ Opportunity Analysis and Forecast, Country , 2016-2032
- 9.7.2.1. Algeria
- 9.7.2.2. Egypt
- 9.7.2.3. Israel
- 9.7.2.4. Kuwait
- 9.7.2.5. Nigeria
- 9.7.2.6. Saudi Arabia
- 9.7.2.7. South Africa
- 9.7.2.8. Turkey
- 9.7.2.9. The UAE
- 9.7.2.10. Rest of MEA
- 10. Global Packaging Foams Market Analysis, Opportunity and Forecast, By Region , 2016-2032
- 10.1. Global Packaging Foams Market Analysis by Region : Introduction
- 10.2. Market Size Absolute $ Opportunity Analysis and Forecast, By Region , 2016-2032
- 10.2.1. North America
- 10.2.2. Western Europe
- 10.2.3. Eastern Europe
- 10.2.4. APAC
- 10.2.5. Latin America
- 10.2.6. Middle East & Africa
- 11. Global Packaging Foams Market Competitive Landscape, Market Share Analysis, and Company Profiles
- 11.1. Market Share Analysis
- 11.2. Company Profiles
- 11.3. Sealed Air Corporation
- 11.3.1. Company Overview
- 11.3.2. Financial Highlights
- 11.3.3. Product Portfolio
- 11.3.4. SWOT Analysis
- 11.3.5. Key Strategies and Developments
- 11.4. BASF SE
- 11.4.1. Company Overview
- 11.4.2. Financial Highlights
- 11.4.3. Product Portfolio
- 11.4.4. SWOT Analysis
- 11.4.5. Key Strategies and Developments
- 11.5. Synthos SA
- 11.5.1. Company Overview
- 11.5.2. Financial Highlights
- 11.5.3. Product Portfolio
- 11.5.4. SWOT Analysis
- 11.5.5. Key Strategies and Developments
- 11.6. FoamPartner Group
- 11.6.1. Company Overview
- 11.6.2. Financial Highlights
- 11.6.3. Product Portfolio
- 11.6.4. SWOT Analysis
- 11.6.5. Key Strategies and Developments
- 11.7. Rogers Corporation
- 11.7.1. Company Overview
- 11.7.2. Financial Highlights
- 11.7.3. Product Portfolio
- 11.7.4. SWOT Analysis
- 11.7.5. Key Strategies and Developments
- 11.8. JSP Corporation
- 11.8.1. Company Overview
- 11.8.2. Financial Highlights
- 11.8.3. Product Portfolio
- 11.8.4. SWOT Analysis
- 11.8.5. Key Strategies and Developments
- 11.9. UFP Technologies Inc.
- 11.9.1. Company Overview
- 11.9.2. Financial Highlights
- 11.9.3. Product Portfolio
- 11.9.4. SWOT Analysis
- 11.9.5. Key Strategies and Developments
- 11.10. Synbra Holding bv
- 11.10.1. Company Overview
- 11.10.2. Financial Highlights
- 11.10.3. Product Portfolio
- 11.10.4. SWOT Analysis
- 11.10.5. Key Strategies and Developments
- 11.11. UFP Technologies
- 11.11.1. Company Overview
- 11.11.2. Financial Highlights
- 11.11.3. Product Portfolio
- 11.11.4. SWOT Analysis
- 11.11.5. Key Strategies and Developments
- 11.12. Armacell LLC
- 11.12.1. Company Overview
- 11.12.2. Financial Highlights
- 11.12.3. Product Portfolio
- 11.12.4. SWOT Analysis
- 11.12.5. Key Strategies and Developments
- 11.13.1. Company Overview
- 11.13.2. Financial Highlights
- 11.13.3. Product Portfolio
- 11.13.4. SWOT Analysis
- 11.13.5. Key Strategies and Developments
- 11.14. Tosoh Corporation
- 11.14.1. Company Overview
- 11.14.2. Financial Highlights
- 11.14.3. Product Portfolio
- 11.14.4. SWOT Analysis
- 11.14.5. Key Strategies and Developments
- 11.15. FoamCraft Packaging Inc
- 11.15.1. Company Overview
- 11.15.2. Financial Highlights
- 11.15.3. Product Portfolio
- 11.15.4. SWOT Analysis
- 11.15.5. Key Strategies and Developments
- 11.16. Hanwha Corporation
- 11.16.1. Company Overview
- 11.16.2. Financial Highlights
- 11.16.3. Product Portfolio
- 11.16.4. SWOT Analysis
- 11.16.5. Key Strategies and Developments
- 11.17. Plastifoam Company
- 11.17.1. Company Overview
- 11.17.2. Financial Highlights
- 11.17.3. Product Portfolio
- 11.17.4. SWOT Analysis
- 11.17.5. Key Strategies and Developments
- 11.18. Marko Foam Products Inc.
- 11.18.1. Company Overview
- 11.18.2. Financial Highlights
- 11.18.3. Product Portfolio
- 11.18.4. SWOT Analysis
- 11.18.5. Key Strategies and Developments
- 11.19. TotalEnergies
- 11.19.1. Company Overview
- 11.19.2. Financial Highlights
- 11.19.3. Product Portfolio
- 11.19.4. SWOT Analysis
- 11.19.5. Key Strategies and Developments
- 11.20. NCFI Polyurethanes
- 11.20.1. Company Overview
- 11.20.2. Financial Highlights
- 11.20.3. Product Portfolio
- 11.20.4. SWOT Analysis
- 11.20.5. Key Strategies and Developments
- 11.21. Huebach Corporation
- 11.21.1. Company Overview
- 11.21.2. Financial Highlights
- 11.21.3. Product Portfolio
- 11.21.4. SWOT Analysis
- 11.21.5. Key Strategies and Developments
- 11.22. Wasatch Container
- 11.22.1. Company Overview
- 11.22.2. Financial Highlights
- 11.22.3. Product Portfolio
- 11.22.4. SWOT Analysis
- 11.22.5. Key Strategies and Developments
- 12. Assumptions and Acronyms
- 13. Research Methodology
- 14. Contact
"
- List of Figures
- "
- Figure 1: Global Packaging Foams Market Revenue (US$ Mn) Market Share by Material Type in 2022
- Figure 2: Global Packaging Foams Market Market Attractiveness Analysis by Material Type, 2016-2032
- Figure 3: Global Packaging Foams Market Revenue (US$ Mn) Market Share by Product Typein 2022
- Figure 4: Global Packaging Foams Market Market Attractiveness Analysis by Product Type, 2016-2032
- Figure 5: Global Packaging Foams Market Revenue (US$ Mn) Market Share by Applicationin 2022
- Figure 6: Global Packaging Foams Market Market Attractiveness Analysis by Application, 2016-2032
- Figure 7: Global Packaging Foams Market Revenue (US$ Mn) Market Share by End Userin 2022
- Figure 8: Global Packaging Foams Market Market Attractiveness Analysis by End User, 2016-2032
- Figure 9: Global Packaging Foams Market Revenue (US$ Mn) Market Share by Region in 2022
- Figure 10: Global Packaging Foams Market Market Attractiveness Analysis by Region, 2016-2032
- Figure 11: Global Packaging Foams Market Market Revenue (US$ Mn) (2016-2032)
- Figure 12: Global Packaging Foams Market Market Revenue (US$ Mn) Comparison by Region (2016-2032)
- Figure 13: Global Packaging Foams Market Market Revenue (US$ Mn) Comparison by Material Type (2016-2032)
- Figure 14: Global Packaging Foams Market Market Revenue (US$ Mn) Comparison by Product Type (2016-2032)
- Figure 15: Global Packaging Foams Market Market Revenue (US$ Mn) Comparison by Application (2016-2032)
- Figure 16: Global Packaging Foams Market Market Revenue (US$ Mn) Comparison by End User (2016-2032)
- Figure 17: Global Packaging Foams Market Market Y-o-Y Growth Rate Comparison by Region (2016-2032)
- Figure 18: Global Packaging Foams Market Market Y-o-Y Growth Rate Comparison by Material Type (2016-2032)
- Figure 19: Global Packaging Foams Market Market Y-o-Y Growth Rate Comparison by Product Type (2016-2032)
- Figure 20: Global Packaging Foams Market Market Y-o-Y Growth Rate Comparison by Application (2016-2032)
- Figure 21: Global Packaging Foams Market Market Y-o-Y Growth Rate Comparison by End User (2016-2032)
- Figure 22: Global Packaging Foams Market Market Share Comparison by Region (2016-2032)
- Figure 23: Global Packaging Foams Market Market Share Comparison by Material Type (2016-2032)
- Figure 24: Global Packaging Foams Market Market Share Comparison by Product Type (2016-2032)
- Figure 25: Global Packaging Foams Market Market Share Comparison by Application (2016-2032)
- Figure 26: Global Packaging Foams Market Market Share Comparison by End User (2016-2032)
- Figure 27: North America Packaging Foams Market Revenue (US$ Mn) Market Share by Material Typein 2022
- Figure 28: North America Packaging Foams Market Market Attractiveness Analysis by Material Type, 2016-2032
- Figure 29: North America Packaging Foams Market Revenue (US$ Mn) Market Share by Product Typein 2022
- Figure 30: North America Packaging Foams Market Market Attractiveness Analysis by Product Type, 2016-2032
- Figure 31: North America Packaging Foams Market Revenue (US$ Mn) Market Share by Applicationin 2022
- Figure 32: North America Packaging Foams Market Market Attractiveness Analysis by Application, 2016-2032
- Figure 33: North America Packaging Foams Market Revenue (US$ Mn) Market Share by End Userin 2022
- Figure 34: North America Packaging Foams Market Market Attractiveness Analysis by End User, 2016-2032
- Figure 35: North America Packaging Foams Market Revenue (US$ Mn) Market Share by Country in 2022
- Figure 36: North America Packaging Foams Market Market Attractiveness Analysis by Country, 2016-2032
- Figure 37: North America Packaging Foams Market Market Revenue (US$ Mn) (2016-2032)
- Figure 38: North America Packaging Foams Market Market Revenue (US$ Mn) Comparison by Country (2016-2032)
- Figure 39: North America Packaging Foams Market Market Revenue (US$ Mn) Comparison by Material Type (2016-2032)
- Figure 40: North America Packaging Foams Market Market Revenue (US$ Mn) Comparison by Product Type (2016-2032)
- Figure 41: North America Packaging Foams Market Market Revenue (US$ Mn) Comparison by Application (2016-2032)
- Figure 42: North America Packaging Foams Market Market Revenue (US$ Mn) Comparison by End User (2016-2032)
- Figure 43: North America Packaging Foams Market Market Y-o-Y Growth Rate Comparison by Country (2016-2032)
- Figure 44: North America Packaging Foams Market Market Y-o-Y Growth Rate Comparison by Material Type (2016-2032)
- Figure 45: North America Packaging Foams Market Market Y-o-Y Growth Rate Comparison by Product Type (2016-2032)
- Figure 46: North America Packaging Foams Market Market Y-o-Y Growth Rate Comparison by Application (2016-2032)
- Figure 47: North America Packaging Foams Market Market Y-o-Y Growth Rate Comparison by End User (2016-2032)
- Figure 48: North America Packaging Foams Market Market Share Comparison by Country (2016-2032)
- Figure 49: North America Packaging Foams Market Market Share Comparison by Material Type (2016-2032)
- Figure 50: North America Packaging Foams Market Market Share Comparison by Product Type (2016-2032)
- Figure 51: North America Packaging Foams Market Market Share Comparison by Application (2016-2032)
- Figure 52: North America Packaging Foams Market Market Share Comparison by End User (2016-2032)
- Figure 53: Western Europe Packaging Foams Market Revenue (US$ Mn) Market Share by Material Typein 2022
- Figure 54: Western Europe Packaging Foams Market Market Attractiveness Analysis by Material Type, 2016-2032
- Figure 55: Western Europe Packaging Foams Market Revenue (US$ Mn) Market Share by Product Typein 2022
- Figure 56: Western Europe Packaging Foams Market Market Attractiveness Analysis by Product Type, 2016-2032
- Figure 57: Western Europe Packaging Foams Market Revenue (US$ Mn) Market Share by Applicationin 2022
- Figure 58: Western Europe Packaging Foams Market Market Attractiveness Analysis by Application, 2016-2032
- Figure 59: Western Europe Packaging Foams Market Revenue (US$ Mn) Market Share by End Userin 2022
- Figure 60: Western Europe Packaging Foams Market Market Attractiveness Analysis by End User, 2016-2032
- Figure 61: Western Europe Packaging Foams Market Revenue (US$ Mn) Market Share by Country in 2022
- Figure 62: Western Europe Packaging Foams Market Market Attractiveness Analysis by Country, 2016-2032
- Figure 63: Western Europe Packaging Foams Market Market Revenue (US$ Mn) (2016-2032)
- Figure 64: Western Europe Packaging Foams Market Market Revenue (US$ Mn) Comparison by Country (2016-2032)
- Figure 65: Western Europe Packaging Foams Market Market Revenue (US$ Mn) Comparison by Material Type (2016-2032)
- Figure 66: Western Europe Packaging Foams Market Market Revenue (US$ Mn) Comparison by Product Type (2016-2032)
- Figure 67: Western Europe Packaging Foams Market Market Revenue (US$ Mn) Comparison by Application (2016-2032)
- Figure 68: Western Europe Packaging Foams Market Market Revenue (US$ Mn) Comparison by End User (2016-2032)
- Figure 69: Western Europe Packaging Foams Market Market Y-o-Y Growth Rate Comparison by Country (2016-2032)
- Figure 70: Western Europe Packaging Foams Market Market Y-o-Y Growth Rate Comparison by Material Type (2016-2032)
- Figure 71: Western Europe Packaging Foams Market Market Y-o-Y Growth Rate Comparison by Product Type (2016-2032)
- Figure 72: Western Europe Packaging Foams Market Market Y-o-Y Growth Rate Comparison by Application (2016-2032)
- Figure 73: Western Europe Packaging Foams Market Market Y-o-Y Growth Rate Comparison by End User (2016-2032)
- Figure 74: Western Europe Packaging Foams Market Market Share Comparison by Country (2016-2032)
- Figure 75: Western Europe Packaging Foams Market Market Share Comparison by Material Type (2016-2032)
- Figure 76: Western Europe Packaging Foams Market Market Share Comparison by Product Type (2016-2032)
- Figure 77: Western Europe Packaging Foams Market Market Share Comparison by Application (2016-2032)
- Figure 78: Western Europe Packaging Foams Market Market Share Comparison by End User (2016-2032)
- Figure 79: Eastern Europe Packaging Foams Market Revenue (US$ Mn) Market Share by Material Typein 2022
- Figure 80: Eastern Europe Packaging Foams Market Market Attractiveness Analysis by Material Type, 2016-2032
- Figure 81: Eastern Europe Packaging Foams Market Revenue (US$ Mn) Market Share by Product Typein 2022
- Figure 82: Eastern Europe Packaging Foams Market Market Attractiveness Analysis by Product Type, 2016-2032
- Figure 83: Eastern Europe Packaging Foams Market Revenue (US$ Mn) Market Share by Applicationin 2022
- Figure 84: Eastern Europe Packaging Foams Market Market Attractiveness Analysis by Application, 2016-2032
- Figure 85: Eastern Europe Packaging Foams Market Revenue (US$ Mn) Market Share by End Userin 2022
- Figure 86: Eastern Europe Packaging Foams Market Market Attractiveness Analysis by End User, 2016-2032
- Figure 87: Eastern Europe Packaging Foams Market Revenue (US$ Mn) Market Share by Country in 2022
- Figure 88: Eastern Europe Packaging Foams Market Market Attractiveness Analysis by Country, 2016-2032
- Figure 89: Eastern Europe Packaging Foams Market Market Revenue (US$ Mn) (2016-2032)
- Figure 90: Eastern Europe Packaging Foams Market Market Revenue (US$ Mn) Comparison by Country (2016-2032)
- Figure 91: Eastern Europe Packaging Foams Market Market Revenue (US$ Mn) Comparison by Material Type (2016-2032)
- Figure 92: Eastern Europe Packaging Foams Market Market Revenue (US$ Mn) Comparison by Product Type (2016-2032)
- Figure 93: Eastern Europe Packaging Foams Market Market Revenue (US$ Mn) Comparison by Application (2016-2032)
- Figure 94: Eastern Europe Packaging Foams Market Market Revenue (US$ Mn) Comparison by End User (2016-2032)
- Figure 95: Eastern Europe Packaging Foams Market Market Y-o-Y Growth Rate Comparison by Country (2016-2032)
- Figure 96: Eastern Europe Packaging Foams Market Market Y-o-Y Growth Rate Comparison by Material Type (2016-2032)
- Figure 97: Eastern Europe Packaging Foams Market Market Y-o-Y Growth Rate Comparison by Product Type (2016-2032)
- Figure 98: Eastern Europe Packaging Foams Market Market Y-o-Y Growth Rate Comparison by Application (2016-2032)
- Figure 99: Eastern Europe Packaging Foams Market Market Y-o-Y Growth Rate Comparison by End User (2016-2032)
- Figure 100: Eastern Europe Packaging Foams Market Market Share Comparison by Country (2016-2032)
- Figure 101: Eastern Europe Packaging Foams Market Market Share Comparison by Material Type (2016-2032)
- Figure 102: Eastern Europe Packaging Foams Market Market Share Comparison by Product Type (2016-2032)
- Figure 103: Eastern Europe Packaging Foams Market Market Share Comparison by Application (2016-2032)
- Figure 104: Eastern Europe Packaging Foams Market Market Share Comparison by End User (2016-2032)
- Figure 105: APAC Packaging Foams Market Revenue (US$ Mn) Market Share by Material Typein 2022
- Figure 106: APAC Packaging Foams Market Market Attractiveness Analysis by Material Type, 2016-2032
- Figure 107: APAC Packaging Foams Market Revenue (US$ Mn) Market Share by Product Typein 2022
- Figure 108: APAC Packaging Foams Market Market Attractiveness Analysis by Product Type, 2016-2032
- Figure 109: APAC Packaging Foams Market Revenue (US$ Mn) Market Share by Applicationin 2022
- Figure 110: APAC Packaging Foams Market Market Attractiveness Analysis by Application, 2016-2032
- Figure 111: APAC Packaging Foams Market Revenue (US$ Mn) Market Share by End Userin 2022
- Figure 112: APAC Packaging Foams Market Market Attractiveness Analysis by End User, 2016-2032
- Figure 113: APAC Packaging Foams Market Revenue (US$ Mn) Market Share by Country in 2022
- Figure 114: APAC Packaging Foams Market Market Attractiveness Analysis by Country, 2016-2032
- Figure 115: APAC Packaging Foams Market Market Revenue (US$ Mn) (2016-2032)
- Figure 116: APAC Packaging Foams Market Market Revenue (US$ Mn) Comparison by Country (2016-2032)
- Figure 117: APAC Packaging Foams Market Market Revenue (US$ Mn) Comparison by Material Type (2016-2032)
- Figure 118: APAC Packaging Foams Market Market Revenue (US$ Mn) Comparison by Product Type (2016-2032)
- Figure 119: APAC Packaging Foams Market Market Revenue (US$ Mn) Comparison by Application (2016-2032)
- Figure 120: APAC Packaging Foams Market Market Revenue (US$ Mn) Comparison by End User (2016-2032)
- Figure 121: APAC Packaging Foams Market Market Y-o-Y Growth Rate Comparison by Country (2016-2032)
- Figure 122: APAC Packaging Foams Market Market Y-o-Y Growth Rate Comparison by Material Type (2016-2032)
- Figure 123: APAC Packaging Foams Market Market Y-o-Y Growth Rate Comparison by Product Type (2016-2032)
- Figure 124: APAC Packaging Foams Market Market Y-o-Y Growth Rate Comparison by Application (2016-2032)
- Figure 125: APAC Packaging Foams Market Market Y-o-Y Growth Rate Comparison by End User (2016-2032)
- Figure 126: APAC Packaging Foams Market Market Share Comparison by Country (2016-2032)
- Figure 127: APAC Packaging Foams Market Market Share Comparison by Material Type (2016-2032)
- Figure 128: APAC Packaging Foams Market Market Share Comparison by Product Type (2016-2032)
- Figure 129: APAC Packaging Foams Market Market Share Comparison by Application (2016-2032)
- Figure 130: APAC Packaging Foams Market Market Share Comparison by End User (2016-2032)
- Figure 131: Latin America Packaging Foams Market Revenue (US$ Mn) Market Share by Material Typein 2022
- Figure 132: Latin America Packaging Foams Market Market Attractiveness Analysis by Material Type, 2016-2032
- Figure 133: Latin America Packaging Foams Market Revenue (US$ Mn) Market Share by Product Typein 2022
- Figure 134: Latin America Packaging Foams Market Market Attractiveness Analysis by Product Type, 2016-2032
- Figure 135: Latin America Packaging Foams Market Revenue (US$ Mn) Market Share by Applicationin 2022
- Figure 136: Latin America Packaging Foams Market Market Attractiveness Analysis by Application, 2016-2032
- Figure 137: Latin America Packaging Foams Market Revenue (US$ Mn) Market Share by End Userin 2022
- Figure 138: Latin America Packaging Foams Market Market Attractiveness Analysis by End User, 2016-2032
- Figure 139: Latin America Packaging Foams Market Revenue (US$ Mn) Market Share by Country in 2022
- Figure 140: Latin America Packaging Foams Market Market Attractiveness Analysis by Country, 2016-2032
- Figure 141: Latin America Packaging Foams Market Market Revenue (US$ Mn) (2016-2032)
- Figure 142: Latin America Packaging Foams Market Market Revenue (US$ Mn) Comparison by Country (2016-2032)
- Figure 143: Latin America Packaging Foams Market Market Revenue (US$ Mn) Comparison by Material Type (2016-2032)
- Figure 144: Latin America Packaging Foams Market Market Revenue (US$ Mn) Comparison by Product Type (2016-2032)
- Figure 145: Latin America Packaging Foams Market Market Revenue (US$ Mn) Comparison by Application (2016-2032)
- Figure 146: Latin America Packaging Foams Market Market Revenue (US$ Mn) Comparison by End User (2016-2032)
- Figure 147: Latin America Packaging Foams Market Market Y-o-Y Growth Rate Comparison by Country (2016-2032)
- Figure 148: Latin America Packaging Foams Market Market Y-o-Y Growth Rate Comparison by Material Type (2016-2032)
- Figure 149: Latin America Packaging Foams Market Market Y-o-Y Growth Rate Comparison by Product Type (2016-2032)
- Figure 150: Latin America Packaging Foams Market Market Y-o-Y Growth Rate Comparison by Application (2016-2032)
- Figure 151: Latin America Packaging Foams Market Market Y-o-Y Growth Rate Comparison by End User (2016-2032)
- Figure 152: Latin America Packaging Foams Market Market Share Comparison by Country (2016-2032)
- Figure 153: Latin America Packaging Foams Market Market Share Comparison by Material Type (2016-2032)
- Figure 154: Latin America Packaging Foams Market Market Share Comparison by Product Type (2016-2032)
- Figure 155: Latin America Packaging Foams Market Market Share Comparison by Application (2016-2032)
- Figure 156: Latin America Packaging Foams Market Market Share Comparison by End User (2016-2032)
- Figure 157: Middle East & Africa Packaging Foams Market Revenue (US$ Mn) Market Share by Material Typein 2022
- Figure 158: Middle East & Africa Packaging Foams Market Market Attractiveness Analysis by Material Type, 2016-2032
- Figure 159: Middle East & Africa Packaging Foams Market Revenue (US$ Mn) Market Share by Product Typein 2022
- Figure 160: Middle East & Africa Packaging Foams Market Market Attractiveness Analysis by Product Type, 2016-2032
- Figure 161: Middle East & Africa Packaging Foams Market Revenue (US$ Mn) Market Share by Applicationin 2022
- Figure 162: Middle East & Africa Packaging Foams Market Market Attractiveness Analysis by Application, 2016-2032
- Figure 163: Middle East & Africa Packaging Foams Market Revenue (US$ Mn) Market Share by End Userin 2022
- Figure 164: Middle East & Africa Packaging Foams Market Market Attractiveness Analysis by End User, 2016-2032
- Figure 165: Middle East & Africa Packaging Foams Market Revenue (US$ Mn) Market Share by Country in 2022
- Figure 166: Middle East & Africa Packaging Foams Market Market Attractiveness Analysis by Country, 2016-2032
- Figure 167: Middle East & Africa Packaging Foams Market Market Revenue (US$ Mn) (2016-2032)
- Figure 168: Middle East & Africa Packaging Foams Market Market Revenue (US$ Mn) Comparison by Country (2016-2032)
- Figure 169: Middle East & Africa Packaging Foams Market Market Revenue (US$ Mn) Comparison by Material Type (2016-2032)
- Figure 170: Middle East & Africa Packaging Foams Market Market Revenue (US$ Mn) Comparison by Product Type (2016-2032)
- Figure 171: Middle East & Africa Packaging Foams Market Market Revenue (US$ Mn) Comparison by Application (2016-2032)
- Figure 172: Middle East & Africa Packaging Foams Market Market Revenue (US$ Mn) Comparison by End User (2016-2032)
- Figure 173: Middle East & Africa Packaging Foams Market Market Y-o-Y Growth Rate Comparison by Country (2016-2032)
- Figure 174: Middle East & Africa Packaging Foams Market Market Y-o-Y Growth Rate Comparison by Material Type (2016-2032)
- Figure 175: Middle East & Africa Packaging Foams Market Market Y-o-Y Growth Rate Comparison by Product Type (2016-2032)
- Figure 176: Middle East & Africa Packaging Foams Market Market Y-o-Y Growth Rate Comparison by Application (2016-2032)
- Figure 177: Middle East & Africa Packaging Foams Market Market Y-o-Y Growth Rate Comparison by End User (2016-2032)
- Figure 178: Middle East & Africa Packaging Foams Market Market Share Comparison by Country (2016-2032)
- Figure 179: Middle East & Africa Packaging Foams Market Market Share Comparison by Material Type (2016-2032)
- Figure 180: Middle East & Africa Packaging Foams Market Market Share Comparison by Product Type (2016-2032)
- Figure 181: Middle East & Africa Packaging Foams Market Market Share Comparison by Application (2016-2032)
- Figure 182: Middle East & Africa Packaging Foams Market Market Share Comparison by End User (2016-2032)
"
- List of Tables
- "
- Table 1: Global Packaging Foams Market Market Comparison by Material Type (2016-2032)
- Table 2: Global Packaging Foams Market Market Comparison by Product Type (2016-2032)
- Table 3: Global Packaging Foams Market Market Comparison by Application (2016-2032)
- Table 4: Global Packaging Foams Market Market Comparison by End User (2016-2032)
- Table 5: Global Packaging Foams Market Revenue (US$ Mn) Comparison by Region (2016-2032)
- Table 6: Global Packaging Foams Market Market Revenue (US$ Mn) (2016-2032)
- Table 7: Global Packaging Foams Market Market Revenue (US$ Mn) Comparison by Region (2016-2032)
- Table 8: Global Packaging Foams Market Market Revenue (US$ Mn) Comparison by Material Type (2016-2032)
- Table 9: Global Packaging Foams Market Market Revenue (US$ Mn) Comparison by Product Type (2016-2032)
- Table 10: Global Packaging Foams Market Market Revenue (US$ Mn) Comparison by Application (2016-2032)
- Table 11: Global Packaging Foams Market Market Revenue (US$ Mn) Comparison by End User (2016-2032)
- Table 12: Global Packaging Foams Market Market Y-o-Y Growth Rate Comparison by Region (2016-2032)
- Table 13: Global Packaging Foams Market Market Y-o-Y Growth Rate Comparison by Material Type (2016-2032)
- Table 14: Global Packaging Foams Market Market Y-o-Y Growth Rate Comparison by Product Type (2016-2032)
- Table 15: Global Packaging Foams Market Market Y-o-Y Growth Rate Comparison by Application (2016-2032)
- Table 16: Global Packaging Foams Market Market Y-o-Y Growth Rate Comparison by End User (2016-2032)
- Table 17: Global Packaging Foams Market Market Share Comparison by Region (2016-2032)
- Table 18: Global Packaging Foams Market Market Share Comparison by Material Type (2016-2032)
- Table 19: Global Packaging Foams Market Market Share Comparison by Product Type (2016-2032)
- Table 20: Global Packaging Foams Market Market Share Comparison by Application (2016-2032)
- Table 21: Global Packaging Foams Market Market Share Comparison by End User (2016-2032)
- Table 22: North America Packaging Foams Market Market Comparison by Product Type (2016-2032)
- Table 23: North America Packaging Foams Market Market Comparison by Application (2016-2032)
- Table 24: North America Packaging Foams Market Market Comparison by End User (2016-2032)
- Table 25: North America Packaging Foams Market Revenue (US$ Mn) Comparison by Country (2016-2032)
- Table 26: North America Packaging Foams Market Market Revenue (US$ Mn) (2016-2032)
- Table 27: North America Packaging Foams Market Market Revenue (US$ Mn) Comparison by Country (2016-2032)
- Table 28: North America Packaging Foams Market Market Revenue (US$ Mn) Comparison by Material Type (2016-2032)
- Table 29: North America Packaging Foams Market Market Revenue (US$ Mn) Comparison by Product Type (2016-2032)
- Table 30: North America Packaging Foams Market Market Revenue (US$ Mn) Comparison by Application (2016-2032)
- Table 31: North America Packaging Foams Market Market Revenue (US$ Mn) Comparison by End User (2016-2032)
- Table 32: North America Packaging Foams Market Market Y-o-Y Growth Rate Comparison by Country (2016-2032)
- Table 33: North America Packaging Foams Market Market Y-o-Y Growth Rate Comparison by Material Type (2016-2032)
- Table 34: North America Packaging Foams Market Market Y-o-Y Growth Rate Comparison by Product Type (2016-2032)
- Table 35: North America Packaging Foams Market Market Y-o-Y Growth Rate Comparison by Application (2016-2032)
- Table 36: North America Packaging Foams Market Market Y-o-Y Growth Rate Comparison by End User (2016-2032)
- Table 37: North America Packaging Foams Market Market Share Comparison by Country (2016-2032)
- Table 38: North America Packaging Foams Market Market Share Comparison by Material Type (2016-2032)
- Table 39: North America Packaging Foams Market Market Share Comparison by Product Type (2016-2032)
- Table 40: North America Packaging Foams Market Market Share Comparison by Application (2016-2032)
- Table 41: North America Packaging Foams Market Market Share Comparison by End User (2016-2032)
- Table 42: Western Europe Packaging Foams Market Market Comparison by Material Type (2016-2032)
- Table 43: Western Europe Packaging Foams Market Market Comparison by Product Type (2016-2032)
- Table 44: Western Europe Packaging Foams Market Market Comparison by Application (2016-2032)
- Table 45: Western Europe Packaging Foams Market Market Comparison by End User (2016-2032)
- Table 46: Western Europe Packaging Foams Market Revenue (US$ Mn) Comparison by Country (2016-2032)
- Table 47: Western Europe Packaging Foams Market Market Revenue (US$ Mn) (2016-2032)
- Table 48: Western Europe Packaging Foams Market Market Revenue (US$ Mn) Comparison by Country (2016-2032)
- Table 49: Western Europe Packaging Foams Market Market Revenue (US$ Mn) Comparison by Material Type (2016-2032)
- Table 50: Western Europe Packaging Foams Market Market Revenue (US$ Mn) Comparison by Product Type (2016-2032)
- Table 51: Western Europe Packaging Foams Market Market Revenue (US$ Mn) Comparison by Application (2016-2032)
- Table 52: Western Europe Packaging Foams Market Market Revenue (US$ Mn) Comparison by End User (2016-2032)
- Table 53: Western Europe Packaging Foams Market Market Y-o-Y Growth Rate Comparison by Country (2016-2032)
- Table 54: Western Europe Packaging Foams Market Market Y-o-Y Growth Rate Comparison by Material Type (2016-2032)
- Table 55: Western Europe Packaging Foams Market Market Y-o-Y Growth Rate Comparison by Product Type (2016-2032)
- Table 56: Western Europe Packaging Foams Market Market Y-o-Y Growth Rate Comparison by Application (2016-2032)
- Table 57: Western Europe Packaging Foams Market Market Y-o-Y Growth Rate Comparison by End User (2016-2032)
- Table 58: Western Europe Packaging Foams Market Market Share Comparison by Country (2016-2032)
- Table 59: Western Europe Packaging Foams Market Market Share Comparison by Material Type (2016-2032)
- Table 60: Western Europe Packaging Foams Market Market Share Comparison by Product Type (2016-2032)
- Table 61: Western Europe Packaging Foams Market Market Share Comparison by Application (2016-2032)
- Table 62: Western Europe Packaging Foams Market Market Share Comparison by End User (2016-2032)
- Table 63: Eastern Europe Packaging Foams Market Market Comparison by Material Type (2016-2032)
- Table 64: Eastern Europe Packaging Foams Market Market Comparison by Product Type (2016-2032)
- Table 65: Eastern Europe Packaging Foams Market Market Comparison by Application (2016-2032)
- Table 66: Eastern Europe Packaging Foams Market Market Comparison by End User (2016-2032)
- Table 67: Eastern Europe Packaging Foams Market Revenue (US$ Mn) Comparison by Country (2016-2032)
- Table 68: Eastern Europe Packaging Foams Market Market Revenue (US$ Mn) (2016-2032)
- Table 69: Eastern Europe Packaging Foams Market Market Revenue (US$ Mn) Comparison by Country (2016-2032)
- Table 70: Eastern Europe Packaging Foams Market Market Revenue (US$ Mn) Comparison by Material Type (2016-2032)
- Table 71: Eastern Europe Packaging Foams Market Market Revenue (US$ Mn) Comparison by Product Type (2016-2032)
- Table 72: Eastern Europe Packaging Foams Market Market Revenue (US$ Mn) Comparison by Application (2016-2032)
- Table 73: Eastern Europe Packaging Foams Market Market Revenue (US$ Mn) Comparison by End User (2016-2032)
- Table 74: Eastern Europe Packaging Foams Market Market Y-o-Y Growth Rate Comparison by Country (2016-2032)
- Table 75: Eastern Europe Packaging Foams Market Market Y-o-Y Growth Rate Comparison by Material Type (2016-2032)
- Table 76: Eastern Europe Packaging Foams Market Market Y-o-Y Growth Rate Comparison by Product Type (2016-2032)
- Table 77: Eastern Europe Packaging Foams Market Market Y-o-Y Growth Rate Comparison by Application (2016-2032)
- Table 78: Eastern Europe Packaging Foams Market Market Y-o-Y Growth Rate Comparison by End User (2016-2032)
- Table 79: Eastern Europe Packaging Foams Market Market Share Comparison by Country (2016-2032)
- Table 80: Eastern Europe Packaging Foams Market Market Share Comparison by Material Type (2016-2032)
- Table 81: Eastern Europe Packaging Foams Market Market Share Comparison by Product Type (2016-2032)
- Table 82: Eastern Europe Packaging Foams Market Market Share Comparison by Application (2016-2032)
- Table 83: Eastern Europe Packaging Foams Market Market Share Comparison by End User (2016-2032)
- Table 84: APAC Packaging Foams Market Market Comparison by Material Type (2016-2032)
- Table 85: APAC Packaging Foams Market Market Comparison by Product Type (2016-2032)
- Table 86: APAC Packaging Foams Market Market Comparison by Application (2016-2032)
- Table 87: APAC Packaging Foams Market Market Comparison by End User (2016-2032)
- Table 88: APAC Packaging Foams Market Revenue (US$ Mn) Comparison by Country (2016-2032)
- Table 89: APAC Packaging Foams Market Market Revenue (US$ Mn) (2016-2032)
- Table 90: APAC Packaging Foams Market Market Revenue (US$ Mn) Comparison by Country (2016-2032)
- Table 91: APAC Packaging Foams Market Market Revenue (US$ Mn) Comparison by Material Type (2016-2032)
- Table 92: APAC Packaging Foams Market Market Revenue (US$ Mn) Comparison by Product Type (2016-2032)
- Table 93: APAC Packaging Foams Market Market Revenue (US$ Mn) Comparison by Application (2016-2032)
- Table 94: APAC Packaging Foams Market Market Revenue (US$ Mn) Comparison by End User (2016-2032)
- Table 95: APAC Packaging Foams Market Market Y-o-Y Growth Rate Comparison by Country (2016-2032)
- Table 96: APAC Packaging Foams Market Market Y-o-Y Growth Rate Comparison by Material Type (2016-2032)
- Table 97: APAC Packaging Foams Market Market Y-o-Y Growth Rate Comparison by Product Type (2016-2032)
- Table 98: APAC Packaging Foams Market Market Y-o-Y Growth Rate Comparison by Application (2016-2032)
- Table 99: APAC Packaging Foams Market Market Y-o-Y Growth Rate Comparison by End User (2016-2032)
- Table 100: APAC Packaging Foams Market Market Share Comparison by Country (2016-2032)
- Table 101: APAC Packaging Foams Market Market Share Comparison by Material Type (2016-2032)
- Table 102: APAC Packaging Foams Market Market Share Comparison by Product Type (2016-2032)
- Table 103: APAC Packaging Foams Market Market Share Comparison by Application (2016-2032)
- Table 104: APAC Packaging Foams Market Market Share Comparison by End User (2016-2032)
- Table 105: Latin America Packaging Foams Market Market Comparison by Material Type (2016-2032)
- Table 106: Latin America Packaging Foams Market Market Comparison by Product Type (2016-2032)
- Table 107: Latin America Packaging Foams Market Market Comparison by Application (2016-2032)
- Table 108: Latin America Packaging Foams Market Market Comparison by End User (2016-2032)
- Table 109: Latin America Packaging Foams Market Revenue (US$ Mn) Comparison by Country (2016-2032)
- Table 110: Latin America Packaging Foams Market Market Revenue (US$ Mn) (2016-2032)
- Table 111: Latin America Packaging Foams Market Market Revenue (US$ Mn) Comparison by Country (2016-2032)
- Table 112: Latin America Packaging Foams Market Market Revenue (US$ Mn) Comparison by Material Type (2016-2032)
- Table 113: Latin America Packaging Foams Market Market Revenue (US$ Mn) Comparison by Product Type (2016-2032)
- Table 114: Latin America Packaging Foams Market Market Revenue (US$ Mn) Comparison by Application (2016-2032)
- Table 115: Latin America Packaging Foams Market Market Revenue (US$ Mn) Comparison by End User (2016-2032)
- Table 116: Latin America Packaging Foams Market Market Y-o-Y Growth Rate Comparison by Country (2016-2032)
- Table 117: Latin America Packaging Foams Market Market Y-o-Y Growth Rate Comparison by Material Type (2016-2032)
- Table 118: Latin America Packaging Foams Market Market Y-o-Y Growth Rate Comparison by Product Type (2016-2032)
- Table 119: Latin America Packaging Foams Market Market Y-o-Y Growth Rate Comparison by Application (2016-2032)
- Table 120: Latin America Packaging Foams Market Market Y-o-Y Growth Rate Comparison by End User (2016-2032)
- Table 121: Latin America Packaging Foams Market Market Share Comparison by Country (2016-2032)
- Table 122: Latin America Packaging Foams Market Market Share Comparison by Material Type (2016-2032)
- Table 123: Latin America Packaging Foams Market Market Share Comparison by Product Type (2016-2032)
- Table 124: Latin America Packaging Foams Market Market Share Comparison by Application (2016-2032)
- Table 125: Latin America Packaging Foams Market Market Share Comparison by End User (2016-2032)
- Table 126: Middle East & Africa Packaging Foams Market Market Comparison by Material Type (2016-2032)
- Table 127: Middle East & Africa Packaging Foams Market Market Comparison by Product Type (2016-2032)
- Table 128: Middle East & Africa Packaging Foams Market Market Comparison by Application (2016-2032)
- Table 129: Middle East & Africa Packaging Foams Market Market Comparison by End User (2016-2032)
- Table 130: Middle East & Africa Packaging Foams Market Revenue (US$ Mn) Comparison by Country (2016-2032)
- Table 131: Middle East & Africa Packaging Foams Market Market Revenue (US$ Mn) (2016-2032)
- Table 132: Middle East & Africa Packaging Foams Market Market Revenue (US$ Mn) Comparison by Country (2016-2032)
- Table 133: Middle East & Africa Packaging Foams Market Market Revenue (US$ Mn) Comparison by Material Type (2016-2032)
- Table 134: Middle East & Africa Packaging Foams Market Market Revenue (US$ Mn) Comparison by Product Type (2016-2032)
- Table 135: Middle East & Africa Packaging Foams Market Market Revenue (US$ Mn) Comparison by Application (2016-2032)
- Table 136: Middle East & Africa Packaging Foams Market Market Revenue (US$ Mn) Comparison by End User (2016-2032)
- Table 137: Middle East & Africa Packaging Foams Market Market Y-o-Y Growth Rate Comparison by Country (2016-2032)
- Table 138: Middle East & Africa Packaging Foams Market Market Y-o-Y Growth Rate Comparison by Material Type (2016-2032)
- Table 139: Middle East & Africa Packaging Foams Market Market Y-o-Y Growth Rate Comparison by Product Type (2016-2032)
- Table 140: Middle East & Africa Packaging Foams Market Market Y-o-Y Growth Rate Comparison by Application (2016-2032)
- Table 141: Middle East & Africa Packaging Foams Market Market Y-o-Y Growth Rate Comparison by End User (2016-2032)
- Table 142: Middle East & Africa Packaging Foams Market Market Share Comparison by Country (2016-2032)
- Table 143: Middle East & Africa Packaging Foams Market Market Share Comparison by Material Type (2016-2032)
- Table 144: Middle East & Africa Packaging Foams Market Market Share Comparison by Product Type (2016-2032)
- Table 145: Middle East & Africa Packaging Foams Market Market Share Comparison by Application (2016-2032)
- Table 146: Middle East & Africa Packaging Foams Market Market Share Comparison by End User (2016-2032)
- 1. Executive Summary
-
- Sealed Air Corporation
- BASF SE
- Synthos SA
- FoamPartner Group
- Rogers Corporation
- JSP Corporation
- UFP Technologies Inc.
- Synbra Holding bv
- UFP Technologies
- Armacell LLC
- Tosoh Corporation
- ACH Foam Technologies
- FoamCraft Packaging Inc
- Hanwha Corporation
- Plastifoam Company
- Marko Foam Products Inc.
- TotalEnergies
- NCFI Polyurethanes
- Huebach Corporation
- Wasatch Container
- Dongshing Industry Inc.
- Zotefoams Plc.
- Borealis
- Kaneka Corporation
Our Clients


View Our Licence Options
