
Organic Sugar Market By Product Type(Cane Sugar, Beet Sugar, Coconut Sugar, Others), By Form(Granulated Sugar, Powdered Sugar, Others), By Application(Bakery & Confectionery Beverages, Others), By Distribution Channel(Hypermarkets/Supermarkets, Retailers, Online Stores, Others), By Region And Companies - Industry Segment Outlook, Market Assessment, Competition Scenario, Trends, And Forecast 2024-2033
-
28510
-
February 2025
-
300
-


-
This report was compiled by Shreyas Rokade Shreyas Rokade is a seasoned Research Analyst with CMFE, bringing extensive expertise in market research and consulting, with a strong background in Chemical Engineering. Correspondence Team Lead-CMFE Linkedin | Detailed Market research Methodology Our methodology involves a mix of primary research, including interviews with leading mental health experts, and secondary research from reputable medical journals and databases. View Detailed Methodology Page
-
Quick Navigation
Report Overview
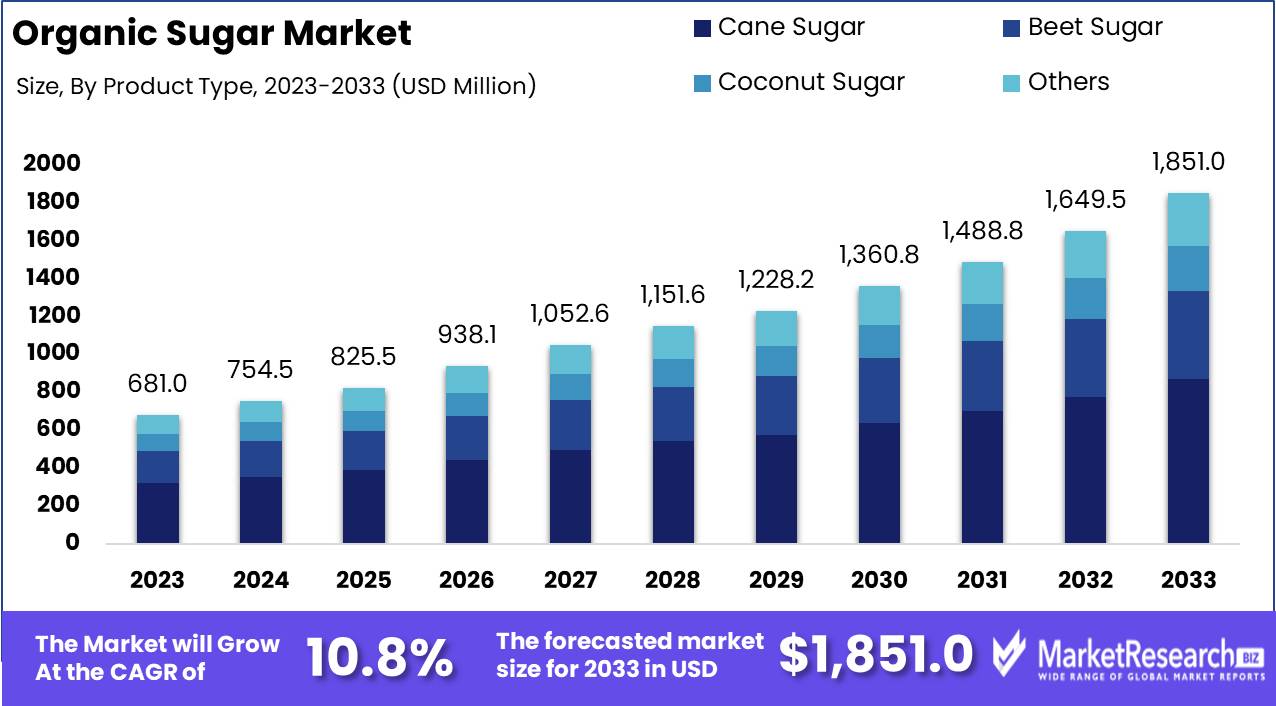
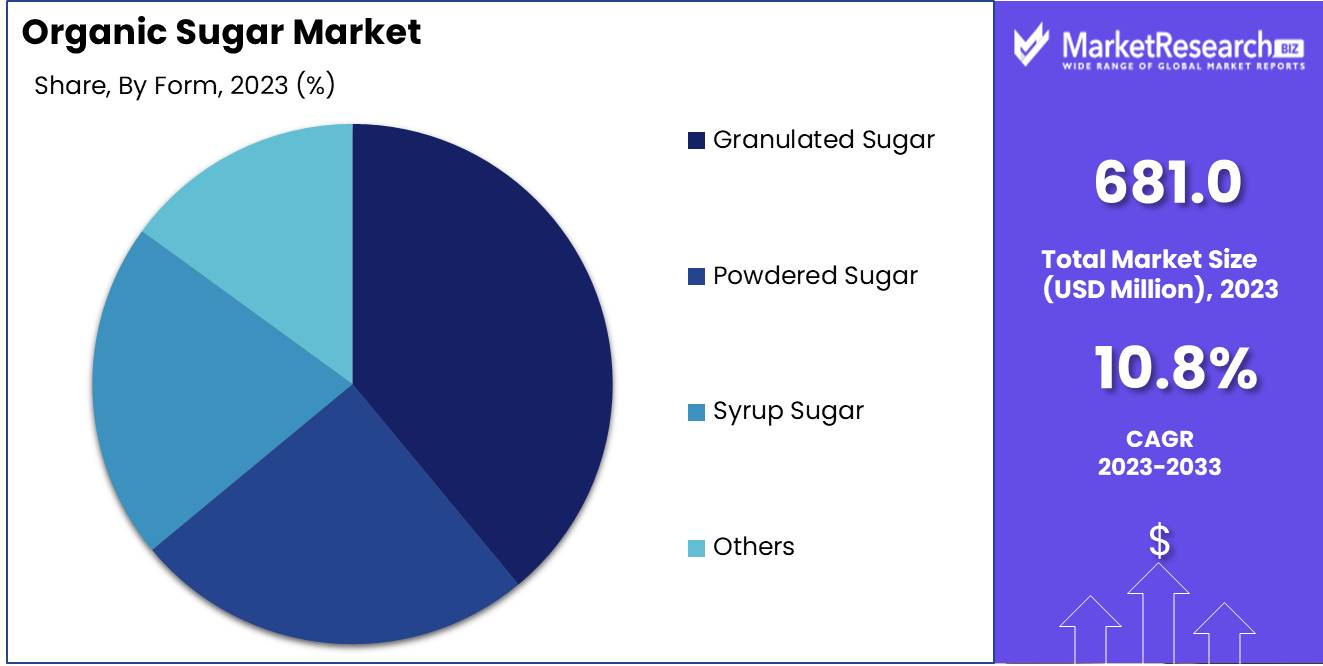
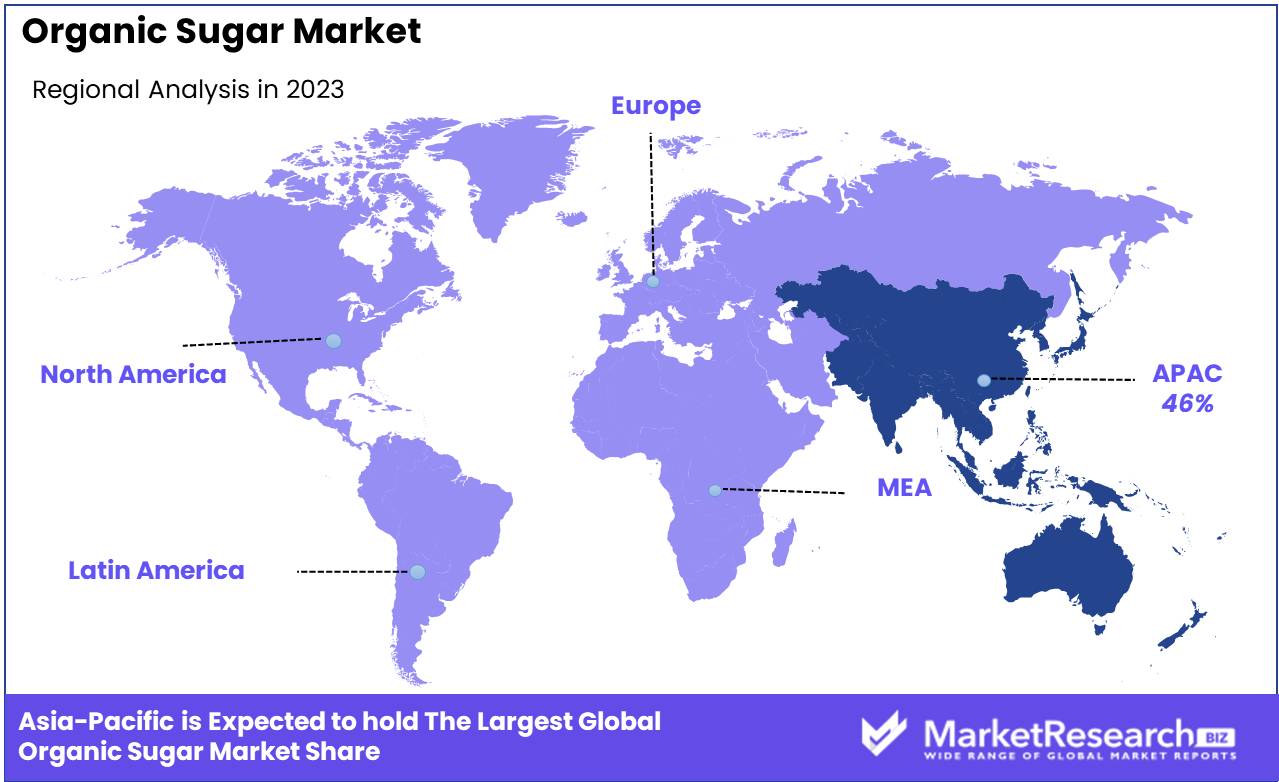
The Organic Sugar Market was valued at USD 681.0 million in 2023. It is expected to reach USD 1851.0 million by 2033, with a CAGR of 10.8% during the forecast period from 2024 to 2033. Asia Pacific dominates the global organic sugar market with a 46% largest share.
Organic Sugar refers to sugar that is produced from organically grown sugarcane or sugar beet, cultivated without the use of synthetic pesticides, fertilizers, or genetically modified organisms (GMOs). The production process of organic sugar also ensures that no artificial additives are used, making it a healthier and more environmentally friendly alternative to conventional sugar. Organic sugar is available in different forms, including raw sugar, refined sugar, and liquid syrup.
Organic Sugar Market is a growing segment within the broader sugar industry, driven by increasing consumer demand for healthier, sustainable food products. The market includes both organic sugar produced for direct consumption and organic sugar used as an ingredient in processed foods and beverages. The growth of the organic sugar market is closely tied to the rising awareness of the environmental impact of conventional sugar farming and the increasing preference for organic and natural food options among health-conscious consumers.
The organic sugar market is expanding rapidly due to several key factors. Rising health consciousness among consumers is one of the major drivers, as people increasingly seek natural, unprocessed alternatives to refined sugar. Additionally, the increasing adoption of sustainable farming practices and the growing trend toward organic products across various industries, such as food, beverages, and cosmetics, are pushing the demand for organic sugar. Government regulations promoting organic farming and the increasing awareness of the environmental impact of traditional sugar production also contribute to the market’s growth.
The demand for organic sugar is particularly high in regions like North America and Europe, where consumers are increasingly aware of the benefits of organic products. The rising popularity of organic and clean-label foods, which promise fewer artificial additives, is fueling the demand for organic sugar. Moreover, manufacturers of processed foods and beverages are increasingly incorporating organic sugar in their products to meet consumer demand for more natural ingredients.
There is a significant opportunity in the organic sugar market for both producers and suppliers. As more food and beverage companies transition to using organic ingredients, the demand for organic sugar will continue to rise. Emerging markets, such as Asia-Pacific, also present growth opportunities, as consumer awareness about organic products expands. Additionally, as the trend toward plant-based diets and sustainability grows, organic sugar is poised to benefit from being perceived as a cleaner, greener choice.
Key Takeaways
- Market Growth: The Organic Sugar Market was valued at USD 681.0 million in 2023. It is expected to reach USD 1851.0 million by 2033, with a CAGR of 10.8% during the forecast period from 2024 to 2033.
- By Product Type: Cane Sugar dominated the Organic Sugar Market with 46.3% of the largest share.
- By Form: Granulated Sugar dominated the diverse Organic Sugar Market forms.
- By Application: Bakery & Confectionery Beverages dominated the Organic Sugar Market.
- By Distribution Channel: Hypermarkets/Supermarkets dominated the organic sugar market distribution.
- Regional Dominance: Asia Pacific dominates the global organic sugar market with a 46% largest share.
- Growth Opportunity: The global organic sugar market will thrive on regulatory support and the rise of innovative, value-added products.
Driving factors
Rising Consumer Demand for Natural and Organic Food Products
The growth of the organic sugar market is significantly driven by the increasing consumer demand for natural and organic food products. This trend is fueled by a shift in consumer preferences towards healthier and more sustainable food options. Consumers are becoming more health-conscious and seeking products free from synthetic additives and chemicals. This surge in demand for organic products, including organic sugar, is expected to continue as consumers become more aware of the benefits of organic foods.
Increasing Disposable Incomes
The rise in disposable incomes across various regions is another critical factor contributing to the growth of the organic sugar market. Higher disposable incomes enable consumers to spend more on premium and organic food products, which are often priced higher than their conventional counterparts. The World Bank reports that global disposable incomes have been rising steadily, particularly in emerging economies. This increase in purchasing power allows more consumers to afford organic products, thereby expanding the market for organic sugar. Furthermore, the trend towards premiumization in the food and beverage sector, where consumers are willing to pay more for higher quality and organic products, supports this growth.
Growing Awareness of the Negative Health Effects of Pesticides
A growing body of evidence linking the use of pesticides to various health issues has heightened consumer awareness and concern. Studies have shown that long-term exposure to pesticides can lead to serious health problems, including cancer, hormone disruption, and neurological disorders. This awareness is driving consumers to seek out organic products, which are produced without synthetic pesticides and fertilizers. The Environmental Working Group (EWG) has consistently highlighted the dangers of pesticide residues in conventional produce, encouraging consumers to choose organic options. As a result, the demand for organic sugar, which is free from such harmful chemicals, is increasing. This shift in consumer behavior is further amplified by campaigns and information dissemination from health organizations and advocacy groups, underscoring the importance of reducing pesticide exposure through the consumption of organic products.
Restraining Factors
High Production Costs and Low Crop Yields: A Barrier to Market Expansion
The organic sugar market faces significant challenges due to the high production costs and low crop yields associated with organic farming practices. Organic farming requires adherence to stringent standards that prohibit the use of synthetic fertilizers and pesticides, leading to a reliance on more labor-intensive and costlier organic alternatives. These increased costs of inputs and the necessity for more manual labor contribute to higher overall production expenses.
Furthermore, organic sugarcane and sugar beet crops generally exhibit lower yields compared to their conventional counterparts. The lack of synthetic growth enhancers and the susceptibility to pests and diseases without chemical intervention often result in reduced productivity. According to industry reports, organic sugar yields can be 20-30% lower than conventional sugar yields. This disparity in production efficiency directly impacts market growth by limiting the supply and increasing the cost of organic sugar, thereby making it less competitive in the broader sugar market.
Limited Availability of Organic Sugarcane and Beet Seeds: Constraining Supply Chains
Another critical factor restraining the growth of the organic sugar market is the limited availability of organic sugarcane and beet seeds. The production of these seeds requires adherence to organic standards from the very beginning, including the avoidance of genetic modification and synthetic chemicals. This leads to a more complex and costly seed production process, resulting in a restricted supply of certified organic seeds.
The limited seed availability impacts the scalability of organic sugar production. Farmers interested in transitioning to or expanding their organic sugar operations often face difficulties in sourcing sufficient quantities of high-quality organic seeds. This bottleneck in the supply chain hampers the ability to increase production volumes, thus restricting market growth.
Moreover, the dependency on a limited seed supply can also lead to higher seed prices, further increasing the production costs for organic sugar. The combination of high seed costs and the challenges associated with maintaining organic farming practices contributes to a slow expansion of organic sugar production capabilities.
By Product Type Analysis
In 2023, Cane Sugar dominated the Organic Sugar Market with 46.3% of the largest share.
In 2023, Cane Sugar held a dominant market position in the By Product Type segment of the Organic Sugar Market, capturing more than a 46.3% share. This significant share can be attributed to its widespread use in various applications, including baking, beverages, and confectionery, due to its high sweetness level and superior flavor profile.
Beet Sugar accounted for approximately 27.5% of the market share. The appeal of beet sugar lies in its high-quality sucrose content and the increasing cultivation of organic beet crops, which align with the rising consumer demand for sustainably sourced and non-GMO products.
Coconut Sugar followed with a 16.7% market share, driven by its low glycemic index and nutritional benefits, including the presence of vitamins and minerals. This type is favored in health-conscious demographics and those seeking alternatives to traditional sweeteners.
The Others category, comprising less common types like date sugar and palm sugar, held a 9.5% share. These sugars are gaining traction due to their unique flavors and health benefits, although they are still niche compared to cane and beet sugar.
By Form Analysis
In 2023, Granulated Sugar dominated the diverse Organic Sugar Market forms.
In 2023, Granulated Sugar held a dominant market position in the By Form segment of the Organic Sugar Market. This category encompasses various forms of organic sugar, including Granulated Sugar, Powdered Sugar, Syrup Sugar, and Others.
Granulated Sugar, due to its versatile application in baking, beverages, and general food preparation, has seen substantial demand, driven by consumer preference for natural and unrefined sweeteners. Its market dominance is further attributed to its widespread availability and ease of use in everyday culinary practices.
Powdered Sugar, primarily used in confectionery and bakery products, ranks second in market share. Its fine texture and rapid solubility make it ideal for icings, frostings, and dustings on desserts, enhancing its demand among bakers and home cooks alike.
Syrup Sugar, though smaller in market share, plays a crucial role in specialty products and beverages. It is favored for its unique flavor profiles and as a healthier alternative to conventional syrups.
The Others category includes less common forms like sugar cubes and jaggery, catering to niche markets. These variations, though limited in scope, serve specific consumer needs, contributing to the overall diversity of the Organic Sugar Market.
By Application Analysis
In 2023, Bakery & Confectionery Beverages dominated the Organic Sugar Market.
In 2023, The Bakery & Confectionery Beverages held a dominant market position in the By Application segment of the Organic Sugar Market, capturing more than a 49.3% share. This segment's prominence is attributed to the rising consumer demand for organic and healthier ingredient alternatives in baked goods and confectionery products. The emphasis on natural and clean-label products has driven significant growth in this application.
Dairy & Frozen Desserts accounted for a substantial portion of the market as well, driven by the increased use of organic sugar in the production of ice creams, yogurts, and other frozen treats. Consumer's growing preference for organic and minimally processed dairy products has bolstered this segment's market share.
Sweet & Savory Snacks also contributed significantly to the organic sugar market. The shift towards healthier snacking options has led manufacturers to incorporate organic sugar into their products, thereby catering to health-conscious consumers seeking better-for-you snack options.
The Others category, encompassing applications such as cereals, beverages, and condiments, also showed notable growth. The versatility of organic sugar in various food and beverage formulations has ensured its widespread adoption across multiple product categories, enhancing its market penetration.
By Distribution Channel Analysis
In 2023, Hypermarkets/Supermarkets dominated the organic sugar market distribution.
In 2023, Hypermarkets/Supermarkets held a dominant market position in the By Distribution Channel segment of the Organic Sugar Market, capturing more than a 39.5% share. This prevalence is attributable to their extensive product offerings, competitive pricing, and significant footfall, enabling widespread consumer access to organic sugar. Hypermarkets and supermarkets' ability to stock a diverse range of organic sugar brands enhances consumer choice, driving sales volumes.
Retailers followed closely, contributing significantly to market revenue through specialized offerings and personalized customer service. Their focus on quality and organic certification reassures consumers, fostering loyalty and repeat purchases.
Online Stores emerged as a dynamic channel, driven by the increasing preference for e-commerce. Convenience, a broad selection, and frequent discounts attract a diverse consumer base, bolstering market penetration. The rise of digital platforms and home delivery services has particularly appealed to the younger demographic and urban populations.
Convenience Stores, although contributing a smaller share, remain vital for immediate purchase needs and local availability. Their strategic locations and extended operating hours cater to impulse buying and last-minute purchases, adding value to the market.
Others category, encompassing farmers' markets, cooperatives, and specialty organic stores, provides niche and artisanal options, meeting the demands of highly health-conscious consumers. These channels emphasize direct sourcing and sustainable practices, aligning with the values of a growing segment of organic sugar consumers.
Key Market Segments
By Product Type
- Cane Sugar
- Beet Sugar
- Coconut Sugar
- Others
By Form
- Granulated Sugar
- Powdered Sugar
- Syrup Sugar
- Others
By Application
- Bakery & Confectionery Beverages
- Dairy & Frozen Desserts
- Sweet & Savory Snacks
- Others
By Distribution Channel
- Hypermarkets/Supermarkets
- Retailers
- Online Stores
- Convenience Stores
- Others
Growth Opportunity
Regulatory Support and Advancements in Organic Farming
The growth of the global organic sugar market is significantly supported by enhanced regulatory frameworks favoring organic agriculture. Governments worldwide are increasingly facilitating the transition to organic farming through subsidies, certifications, and training, which serves to increase the production capacity of organic sugar. These regulatory measures are vital in reassuring consumers about the authenticity and ecological benefits of organic sugar, thus driving demand. Additionally, advancements in organic farming techniques are set to improve yields and the sustainability of sugar crops, further bolstering market growth.
Development of Value-Added Organic Sugar Products
The development of value-added products within the organic sugar sector presents a substantial growth opportunity. Manufacturers are increasingly innovating with organic sugar as a base for health-centric and premium products, such as organic sugar with added nutritional benefits or flavored varieties. This diversification is attracting a broader consumer base, eager for products that align with their health-conscious and environmentally friendly lifestyles. The trend towards clean-label products, which emphasize natural and simple ingredients, is particularly synergistic with the expansion of the organic sugar market.
Latest Trends
Expanding Applications in Bakery, Beverages, and Confectionery
The organic sugar market is experiencing robust growth driven by its expanding applications across diverse sectors. A significant demand is observed for bakery products, beverages, and confectioneries. This trend is underpinned by the increasing consumer preference for organic ingredients, which are perceived as healthier and more sustainable alternatives to conventional raw sugar. As manufacturers aim to cater to the evolving tastes and preferences of health-conscious consumers, the incorporation of organic sugar in these applications enhances product appeal and aligns with current market demands. Notably, the surge in organic product launches by key players in the food and beverage industry signifies a strategic response to these consumer trends, further propelling market growth.
Increasing Health Consciousness
Health consciousness is a pivotal factor influencing consumer choices, with a clear shift towards products offering health benefits without compromising on taste or quality. Organic sugar, derived from organically grown sugarcane and processed without synthetic chemicals, is gaining traction among health-aware consumers. This trend is supported by the broader movement towards organic and natural products, as consumers increasingly scrutinize product labels and seek transparency in sourcing and production processes. The market's expansion is facilitated by this heightened health awareness, driving both consumer demand and manufacturer innovation in providing healthier, organic alternatives to traditional sugar.
Regional Analysis
Asia Pacific dominates the global organic sugar market with a 46% largest share.
The organic sugar market demonstrates diverse dynamics across global regions, influenced by varying consumer preferences, regulatory landscapes, and levels of market maturity. In North America, the market is characterized by a robust demand for organic products, with consumers increasingly favoring sustainable and health-conscious choices. This region has witnessed a steady growth in organic sugar sales, catalyzed by heightened awareness regarding the benefits of organic farming practices.
Europe follows closely, marked by stringent EU regulations supporting organic agriculture. The demand in Europe is driven by environmental concerns and a strong preference for non-GMO products. The region sees significant growth in the organic sector, with countries like Germany and France leading in consumption.
Asia Pacific stands out as the dominating region, accounting for approximately 46% of the global organic sugar market. This substantial share is fueled by increasing income levels, urbanization, and the expansion of retail infrastructure, particularly in countries like India and China, which are also major producers of organic sugar.
Middle East & Africa and Latin America are emerging markets with the potential for significant growth. Latin America, in particular, benefits from favorable climatic conditions for sugar cultivation and is ramping up its organic production capabilities. The Middle East and Africa are gradually adopting organic diets, influenced by health trends and increasing international trade in organic products.
Key Regions and Countries
North America
- The US
- Canada
- Rest of North America
Europe
- Germany
- France
- The UK
- Spain
- Netherlands
- Russia
- Italy
- Rest of Europe
Asia-Pacific
- China
- Japan
- Singapore
- Thailand
- South Korea
- Vietnam
- India
- New Zealand
- Rest of Asia Pacific
Latin America
- Mexico
- Brazil
- Rest of Latin America
Middle East & Africa
- Saudi Arabia
- South Africa
- UAE
- Rest of the Middle East & Africa
Key Players Analysis
In the evolving landscape of the global organic sugar market, key players are instrumental in shaping industry dynamics. As of 2024, companies such as C&H Sugar, Cosan Ltd., and Domino Sugar continue to strengthen their market positions through strategic initiatives that include expansion into new regions and enhancements in sustainable farming practices.
Florida Crystals Corporation and Imperial Sugar are noted for their commitment to organic methods, which is increasingly resonating with eco-conscious consumers. Meanwhile, international entities like Jalles Machado S/A and Nordic Sugar are leveraging their geographical advantages to optimize supply chain efficiencies and reduce environmental impacts, aligning with global sustainability goals.
Nordzucker AG and NOW Health Group are enhancing their product portfolios to include a broader range of organic sugar types, catering to the diverse needs of health-aware consumers. Similarly, Pronatec AG and Santushti International are focusing on transparency and ethical sourcing, which are critical for maintaining consumer trust in organic labels.
European giants such as Südzucker AG, Tate & Lyle, and Tereos SCA are investing in R&D to innovate processing techniques that retain more natural qualities of sugar while adhering to organic standards. Agrana Beteiligungs AG is another notable player, driving growth through its dual focus on quality and expansive market reach.
Wholesome Sweeteners stands out for its aggressive marketing strategies and customer engagement initiatives, which are essential for brand loyalty in a competitive market. Collectively, these companies are setting the stage for a robust growth trajectory in the organic sugar sector, fueled by consumer demand for healthier and environmentally sustainable alternatives.
Market Key Players
- C&H Sugar
- Cosan Ltd
- Domino Sugar
- Florida Crystals Corporation
- Imperial Sugar
- Jalles Machado S/A
- Nordic Sugar
- Nordzucker AG
- NOW Health Group
- Pronatec Ag
- Santushti International
- Südzucker AG
- Taikoo Sugar
- Tate & Lyle
- Tereos SCA, Agrana Beteiligungs AG
- Wholesome Sweeteners
Recent Development
- In June 2023, Florida Crystals Corporation announced a significant increase in their organic sugar production capacity. The company invested in new processing technologies to enhance efficiency and reduce the environmental impact of its operations, responding to the rising market demand for organic sugar.
- In May 2023, Nordic Sugar introduced a new sustainable packaging initiative for their organic sugar products. The new packaging is fully recyclable and made from biodegradable materials, aligning with the company's commitment to reducing its environmental footprint.
- In March 2023, Wholesome Sweeteners, a leading supplier of organic sugar and sweeteners, announced the expansion of their product line to include new organic sugar varieties sourced from sustainable farms in South America. This move aims to meet the growing consumer demand for organic and ethically sourced sweeteners.
Report Scope
Report Features Description Market Value (2023) USD 681.0 Million Forecast Revenue (2033) USD 1851.0 Million CAGR (2024-2032) 10.8% Base Year for Estimation 2023 Historic Period 2016-2023 Forecast Period 2024-2033 Report Coverage Revenue Forecast, Market Dynamics, COVID-19 Impact, Competitive Landscape, Recent Developments Segments Covered By Product Type (Cane Sugar, Beet Sugar, Coconut Sugar, Others), By Form (Granulated Sugar, Powdered Sugar, Syrup Sugar, Others), By Application (Bakery & Confectionery Beverages, Dairy & Frozen Desserts, Sweet & Savory Snacks, Others), By Distribution Channel (Hypermarkets/Supermarkets, Retailers, Online Stores, Convenience Stores, Others) Regional Analysis North America - The US, Canada, Rest of North America, Europe - Germany, France, The UK, Spain, Italy, Russia, Netherlands, Rest of Europe, Asia-Pacific - China, Japan, South Korea, India, New Zealand, Singapore, Thailand, Vietnam, Rest of Asia Pacific, Latin America - Brazil, Mexico, Rest of Latin America, Middle East & Africa - South Africa, Saudi Arabia, UAE, Rest of Middle East & Africa Competitive Landscape C&H Sugar, Cosan Ltd, Domino Sugar, Florida Crystals Corporation, Imperial Sugar, Jalles Machado S/A, Nordic Sugar, Nordzucker AG, NOW Health Group, Pronatec Ag, Santushti International, Südzucker AG, Taikoo Sugar, Tate & Lyle, Tereos SCA, Agrana Beteiligungs AG, Wholesome Sweeteners Customization Scope Customization for segments, region/country-level will be provided. Moreover, additional customization can be done based on the requirements. Purchase Options We have three licenses to opt for Single User License, Multi-User License (Up to 5 Users), Corporate Use License (Unlimited User and Printable PDF) -
-
- C&H Sugar
- Cosan Ltd
- Domino Sugar
- Florida Crystals Corporation
- Imperial Sugar
- Jalles Machado S/A
- Nordic Sugar
- Nordzucker AG
- NOW Health Group
- Pronatec Ag
- Santushti International
- Südzucker AG
- Taikoo Sugar
- Tate & Lyle
- Tereos SCA, Agrana Beteiligungs AG
- Wholesome Sweeteners
Our Clients


View Our Licence Options
