Organic Cosmetics Market By Product Type (Skincare, Haircare, Bodycare, Other), By End-User (Men, Women, Kids), By Distribution Channel (Supermarket/Hypermarket, Pharmacy & Drugstore, Other), By Region And Companies - Industry Segment Outlook, Market Assessment, Competition Scenario, Trends, And Forecast 2023-2032
-
39988
-
July 2023
-
179
-


-
This report was compiled by Research Team Research team of over 50 passionate professionals leverages advanced research methodologies and analytical expertise to deliver insightful, data-driven market intelligence that empowers businesses across diverse industries to make strategic, well-informed Correspondence Research Team Linkedin | Detailed Market research Methodology Our methodology involves a mix of primary research, including interviews with leading mental health experts, and secondary research from reputable medical journals and databases. View Detailed Methodology Page
-
Quick Navigation
Report Overview
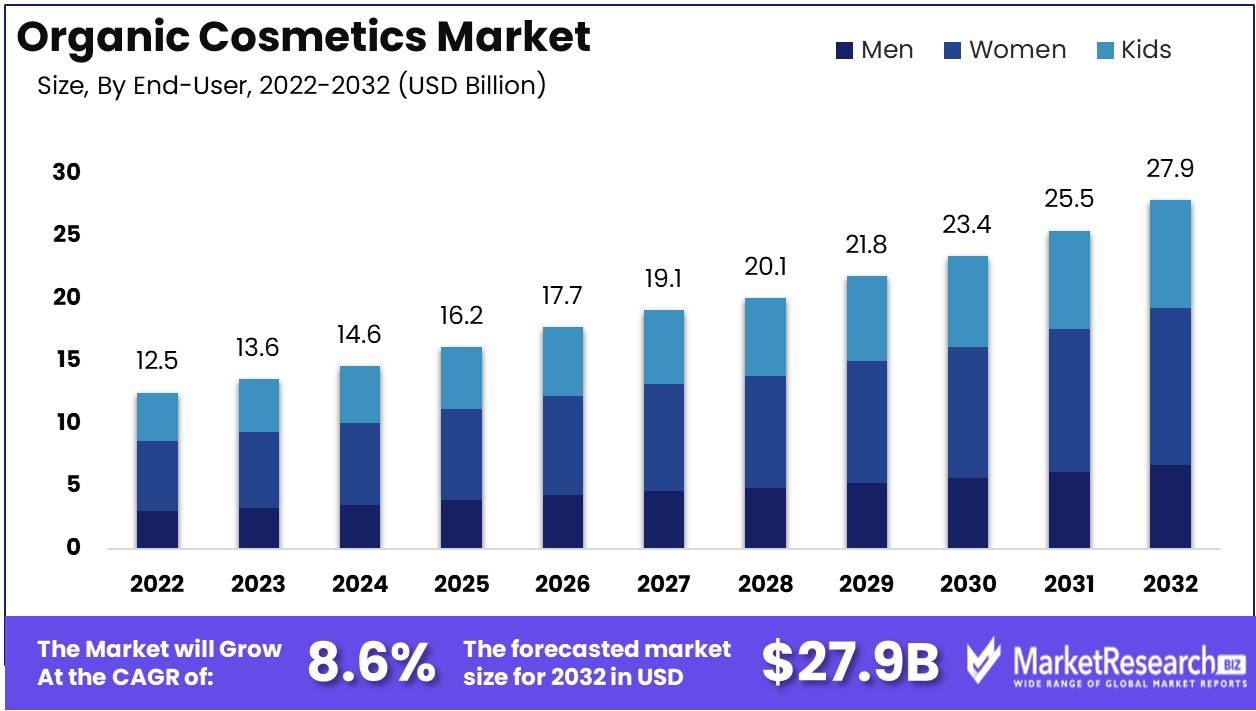
Organic Cosmetics Market size is expected to be worth around USD 27.9 Bn by 2032 from USD 12.5 Bn in 2022, growing at a CAGR of 8.6% during the forecast period from 2023 to 2032.
The expansion of the organic cosmetics market can be ascribed to a multitude of factors. There has been an increase in consumer awareness regarding the potential hazards linked to conventional products, leading to a growing demand for safer alternatives, such as organic cosmetics. The utilization of organic alternatives offers numerous benefits, such as a decrease in exposure to detrimental chemicals, a reduction in the environmental footprint, and an augmentation of skin health advantages.
The introduction of organic cosmetics innovations has significantly transformed the industry, leading to the emergence of novel and captivating products and services. Prominent developments encompass the utilization of natural preservatives, the implementation of sustainable packaging solutions, and the adoption of cruelty-free testing methods. These innovations have significantly propelled the organic cosmetics industry onto a global platform, captivating the interest and imagination of beauty enthusiasts worldwide.
The organic cosmetics market has experienced remarkable growth and has found various applications, primarily due to factors such as rising consumer demand, the expansion of distribution channels, and increased awareness of environmental concerns. In addition, organic cosmetics have found application across various segments of the beauty industry, encompassing skincare, haircare, makeup, and fragrance products.
Various industries are making investments in the organic cosmetics market due to its significant potential for both profitability and sustainability. The demand for natural cosmetics has exhibited a consistent growth trajectory, leading to an increase in consumer interest across various channels such as beauty retailers, online platforms, traditional brick-and-mortar stores, wellness centers, spas, and sustainable lifestyle brands. Embrace clean beauty with organic cosmetics, harnessing nature's purity for radiant skin without harmful additives.
Nevertheless, the organic cosmetics industry is not exempt from ethical concerns. The growing market demand for natural and organic products necessitates the industry's responsible handling of concerns such as ingredient sourcing, fair trade practices, and ecological impact. In order to substantiate their assertions regarding organic certifications, sustainable sourcing practices, and cruelty-free policies, it is imperative for brands to maintain transparency by obtaining credible certifications or undergoing independent verification processes.
Driving factors
Organic Cosmetics Demand Rising
Consumers are becoming more aware of the health and environmental effects of the products they purchase. Consumers now choose natural and organic products. The demand for organic cosmetics has grown due to consumers' desire for safer, chemical-free solutions, which has fueled market growth.
Organic Cosmetics Grow
Consumer knowledge of the detrimental consequences of synthetic ingredients in traditional cosmetics is boosting demand for organic cosmetics. Many consumers are questioning the ingredients in skincare and beauty products and seeking chemical-free alternatives. As consumers choose natural products, the organic cosmetics market has grown.
Beautiful Growth
More consumers are looking for sustainable and eco-friendly beauty options as green and clean beauty trends continue to gain popularity. These trends match organic cosmetics' natural ingredients and eco-friendly production. Manufacturers are using eco-friendly packaging, sustainable ingredients, and more sustainable production techniques. Conscious consumers recognize this and demand organic cosmetics.
Ethical Cosmetics
The beauty industry has also embraced ethical and sustainable practices. Traditional cosmetics, including animal testing and non-renewable resource use, are now more environmentally conscious. Demand for cruelty-free, vegan, and eco-friendly organic cosmetics has grown as a result of the emergence of ethical and sustainable beauty practices. This emphasis on ethical manufacture and sourcing has propelled the organic cosmetics market growth.
Regulation Promotes Organic Cosmetics
Regulatory agencies worldwide are supporting organic cosmetics with legislation and certifications. Organic cosmetics must meet requirements including no synthetic ingredients and market claims. Consumers may buy with confidence thanks to the precise definition and labeling rules for organic cosmetics. Additionally, governmental support guarantees that organic cosmetics market companies meet quality standards, which boosts customer trust and market growth.
Restraining Factors
Higher Prices Than Conventional Cosmetics
Organic cosmetics are more expensive than conventional cosmetics, which is a key barrier to their wider acceptance. This is due to the use of high-quality natural and organic components, rigorous manufacturing procedures, and the absence of dangerous chemicals. Organic cosmetics may be beneficial, but the greater cost may deter some consumers. When buying organic cosmetics, consumers are supporting sustainable practices and ethical sourcing as well as their personal health.
Few Distribution Channels
Limited availability and distribution channels hinder organic cosmetics market growth. Organic beauty brands often struggle to attract a bigger audience than conventional beauty brands, which have a large network of retail outlets and online platforms. This limited availability makes it hard for consumers to find and buy organic cosmetics. To meet the growing demand for organic products, online platforms, and organic beauty retailers have arisen. As more consumers demand organic cosmetics, large retailers are stocking more options.
Formulation Issues, Shorter Shelf Life
The absence of synthetic components and the requirement for natural preservatives might create numerous challenges when creating organic cosmetics. Stability, efficacy, and a pleasing sensory experience with natural substances might be difficult. Organic cosmetics may expire faster than conventional cosmetics. These formulation challenges and reduced shelf life can make it harder for brands to mass produce and sell organic cosmetics. These challenges are being overcome by organic formulation processes and ingredient innovation.
Difficulty in Obtaining Organic Certifications
Organic certifications establish customer trust and distinguish organic cosmetics from conventional ones. Organic certification is a difficult process for many brands. The certification process requires strict ingredient sourcing, production, and sustainability criteria. Smaller brands may find the accreditation process financially and administratively difficult. However, USDA Organic and COSMOS (Cosmetic Organic and Natural Standard) are aiming to streamline the certification process and make it more accessible for organic cosmetics brands.
Mainstream Beauty Brand Competition
Mainstream beauty brands are extending their natural and organic product ranges, making the organic cosmetics market more competitive. Major beauty brands are capitalizing on the organic trend by launching organic or natural product lines. Organic cosmetics brands are under added pressure to innovate, maintain product quality, and effectively explain the unique benefits of their products to consumers. Some consumers may prefer mainstream brands over organic ones due to their familiarity and convenience.
Product Type Analysis
In recent years, consumers have become more conscious of the products they use on their skin, driving growth in the organic cosmetics market. In this market, skincare dominates sales and attention.
The growing importance of skin care is one of the main reasons the skincare segment dominates. With the rise of social media and beauty influencers, consumers are more conscious of the need to follow a skincare routine that emphasizes organic and natural products. This trend has led to a surge in demand for organic skincare products, making them the most sought-after in the market.
As emerging economies enjoy economic growth, consumers' disposable incomes have increased. With more money, people spend more on self-care and grooming. This economic development has led to the skincare segment's adoption in these economies.
End-User Analysis
The women segment dominates the organic cosmetics market. Women have always been the main consumers of beauty and skincare products, and this trend continues in the organic cosmetics market.
Women have particular skincare demands and concerns, which led to the development of products specifically for them. Organic skincare businesses have created a wide selection of products for women, addressing their specific needs, from anti-aging creams to products that target hormone imbalances.
As emerging economies experience economic growth and women's empowerment, demand for women-centric products has increased. With more financial independence, women in these economies want to invest in personal care and self-improvement.
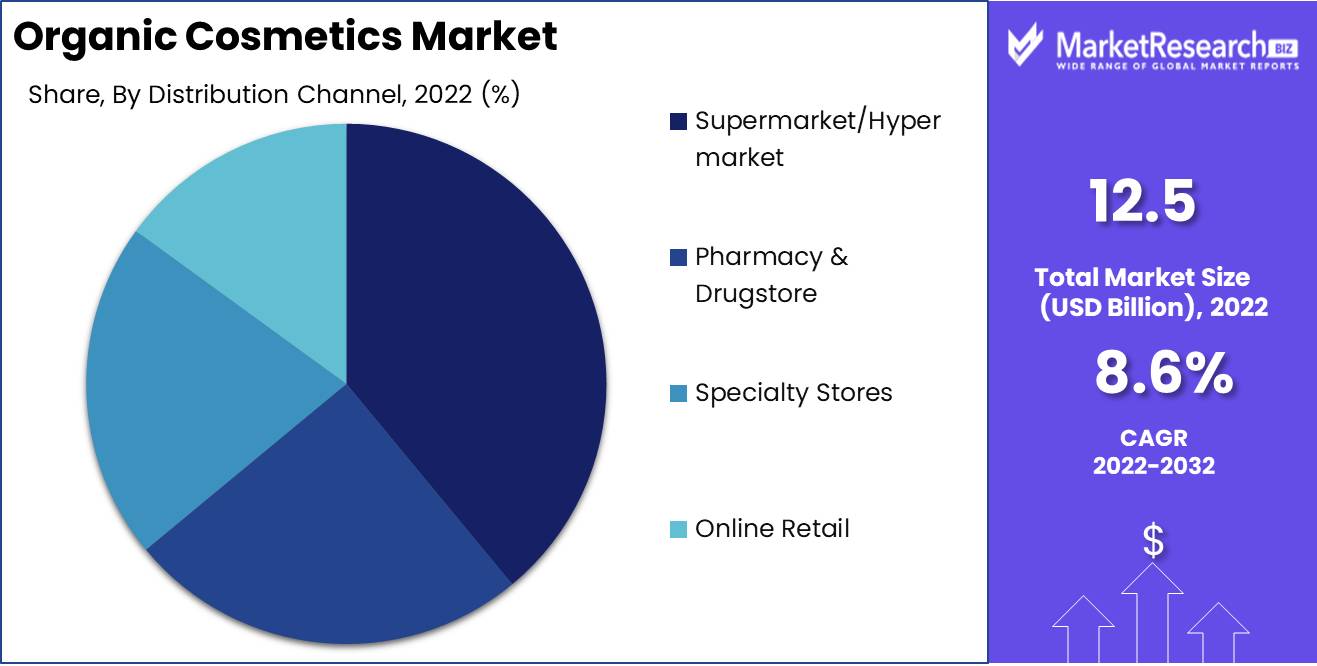
Distribution Channel Analysis
The supermarket/hypermarket segment has emerged as the dominant distribution channel in the organic cosmetics market. Organic cosmetics are easily available at huge retail chains in this segment.
Factors like convenience, accessibility, and cost can be used to explain the popularity of the supermarket/hypermarket segment. These retail chains are widespread, making them accessible to consumers in various regions. These stores also make organic cosmetics more affordable for a wider audience with competitive prices and promotions.
Emerging economies' economic development has led to urbanization and a shift in consumer tastes. More middle-class people relocate to cities and modify their buying habits. Supermarkets and hypermarkets offer one-stop shopping, making them appealing to consumers.
Key Market Segments
Product Type
- Skincare
- Haircare
- Bodycare
- Makeup Products
- Fragrance & Mist
By End-User
- Men
- Women
- Kids
By Distribution Channel
- Supermarket/Hypermarket
- Pharmacy & Drugstore
- Specialty Stores
- Online Retail
Growth Opportunity
Organic Cosmetics Market Growth
Due to public knowledge of synthetic chemicals' detrimental effects and a desire for natural, sustainable products, the organic cosmetics market is growing rapidly. Companies must constantly improve and innovate their product lines in order to compete in this business. Organic cosmetics producers can build unique formulas that fit consumers' shifting needs by investing in R&D.
Adding Organic Products
Expanding organic and natural products is a growth opportunity. More organic cosmetics are needed as consumers become more aware of what they put on their bodies. New product lines including organic skincare, haircare, body care, and makeup can capitalize on this opportunity. They can gain new customers by targeting different demographics and market sectors.
Ethical Sustainability Collaboration
Consumers have prioritized ethical and environmental activities in recent years. Organic cosmetics companies can capitalize on this trend by collaborating with organic ingredient suppliers and implementing fair-trade programs. This protects the quality and originality of their products and helps local communities and the environment.
Digitizing Marketing
The organic cosmetics market has changed with the digital age. Companies should prioritize digital market strategies and e-commerce platforms in order to leverage this trend. Success requires a strong online presence as more consumers shop online and use social media for product recommendations and information.
Latest Trends
Organic Beauty Boom
A global shift toward healthier, more sustainable lives has boosted organic skincare and personal care products. The demand for organic alternatives is rising as consumers become more aware of the possible dangers of synthetic substances in standard cosmetic products. This tendency has affected skincare and other beauty sectors.
Organic Cosmetics
Organic makeup and color cosmetics are growing in the organic cosmetics market. The days of limited variety and effectiveness for natural makeup are over. Today, consumers can choose from several organic makeup products that give high-quality results without compromising health and well-being. As more individuals choose natural cosmetic products, the organic makeup market is growing.
Natural Haircare Boom
Organic and natural hair care products are another organic cosmetics trend. Sulfates and parabens in traditional hair care products damage hair and scalp over time. Thus, consumers are choosing gentle yet effective organic and natural alternatives. Botanical extracts, essential oils, and plant-based components nourish and shine hair with these products.
Green Packaging
The organic cosmetics market is also using plant-based and biodegradable packaging. Brands are understanding the necessity of sustainable packaging solutions as demand for eco-friendly products develops. Biodegradable packaging from bamboo or sugarcane reduces environmental impact. This trend attracts eco-conscious consumers that appreciate product sustainability throughout its existence.
Cosmetics Transparency
Recently, transparency and traceability have shaped the organic cosmetics market. Consumers want to know where their products come from, how they're created, and brand ethics. To gain consumers' trust, corporations are offering thorough information about their sourcing, manufacturing, and certifications. Transparency and traceability help consumers choose brands that match their ideals.
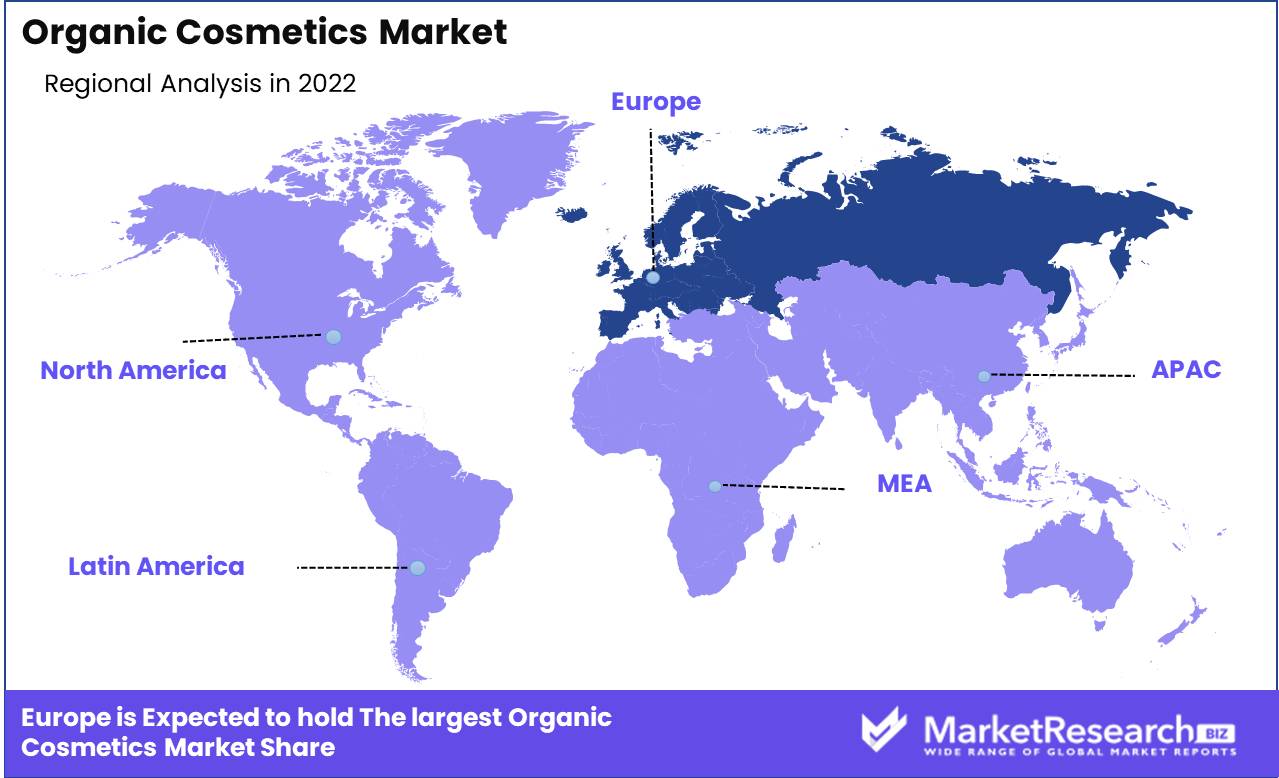
Regional Analysis
Europe region's dominance in the organic cosmetics market can be attributed to many things. The region has traditionally prioritized natural and sustainable methods. European cosmetics laws prohibit strong chemicals. European organic cosmetics exceed the highest safety and efficacy standards due to this commitment to tight standards and meticulous quality control.
Second, Europe's superb craftsmanship and high-quality products extend to organic cosmetics. French, German, Italian, and British brands are known worldwide for their competence and inventiveness. European organic cosmetics stand out for their rigorous attention to detail and commitment to using the best ingredients.
The unique climate and biodiversity of Europe contribute to the region's dominance in the organic cosmetics market. Europe's native plants, herbs, and botanicals provide a wealth of natural substances. European cosmetic makers have refined making effective, sustainable, and eco-friendly products using these unique materials.
Ethical consumer preferences have also benefited the European organic cosmetics business. The region's producers have pioneered cruelty-free and sustainable packaging. European brands have won over mindful consumers worldwide with skin-friendly, eco-friendly products.
The popularity of organic cosmetics in Europe is also due to the region's research and development. European cosmetic scientists are developing novel formulations and methods to increase organic cosmetics' efficacy and experience. European brands offer safe, effective products because of their commitment to innovation.
Key Regions and Countries
North America
- US
- Canada
- Mexico
Western Europe
- Germany
- France
- The UK
- Spain
- Italy
- Portugal
- Ireland
- Austria
- Switzerland
- Benelux
- Nordic
- Rest of Western Europe
Eastern Europe
- Russia
- Poland
- The Czech Republic
- Greece
- Rest of Eastern Europe
APAC
- China
- Japan
- South Korea
- India
- Australia & New Zealand
- Indonesia
- Malaysia
- Philippines
- Singapore
- Thailand
- Vietnam
- Rest of APAC
Latin America
- Brazil
- Colombia
- Chile
- Argentina
- Costa Rica
- Rest of Latin America
Middle East & Africa
- Algeria
- Egypt
- Israel
- Kuwait
- Nigeria
- Saudi Arabia
- South Africa
- Turkey
- United Arab Emirates
- Rest of MEA
Key Players Analysis
ALDI North Group dominates the retail industry. ALDI North Group is a leader in the organic cosmetics market. Their dedication to cost, sustainability, and customer happiness has helped. ALDI North Group offers a wide range of organic cosmetics to suit customers' tastes.
In the organic cosmetics sector, Alnatura Produktions und Handels GmbH is a pioneer. Alnatura is known for its organic beauty products and commitment to nature. The company's emphasis on ecological methods and natural ingredients has resonated with consumers, making them a market force.
AVON Beauty Products India Pvt Ltd has penetrated the organic cosmetics market. AVON has won consumers worldwide with its strong distribution network and focus on empowering women. The company's commitment to high-quality, affordable organic beauty products has made it a leader. AVON's inclusion and entrepreneurship have helped them dominate the market.
Benefit Cosmetics LLC stands out in the organic cosmetics market with its distinct approach and vivid product line. Benefit Cosmetics distinguishes for its humorous logo and creative marketing. Their dedication to making high-performance cosmetics with natural ingredients has garnered a dedicated following. Benefit Cosmetics is a leader in organic cosmetics by delivering excellent customer service and adapting to changing beauty trends.
Burt's Bees embodies organic products. Burt's Bees was founded on the concepts of sustainability and organic ingredients. Their commitment to comprehensive well-being and environmental sustainability has ensured their success. Burt's Bees dominates the organic cosmetics market with their quality, ethics, and transparency.
Chanel, a luxury brand, has entered the organic cosmetics market. Chanel's organic beauty products combine elegance and glamour. Their ability to mix natural ingredients with cutting-edge technology and premium packaging has resonated with consumers seeking a balance between enjoyment and ethical beauty. Chanel's move into organic cosmetics shows its versatility and commitment to modern consumers.
Top Key Players in the Organic Cosmetics Market
- ALDI North Group
- Alnatura Produktions- und Handels GmbH
- AVON Beauty Products India Pvt Ltd
- Benefit Cosmetics LLC
- Burt's Bees.
- Chanel
- Coty Inc.
- Dabur
- The Estée Lauder Companies Inc.
- Hain Celestial
- Johnson & Johnson Services, Inc.
- Lush Retail Ltd.
- L'ORÉAL
- MAESA
- Nails Inc. limited.
- Physicians Formula.
- Procter & Gamble.
- REWE FAR EAST LIMITED
- REVLON
- Unilever
Recent Development
- In 2023, The Body Shop, a prominent cosmetics firm, announced its complete switch to vegan products.
- In 2022, Lush, known for its fresh, homemade cosmetics, launched a new line of organic, sustainable products.
- In 2021, Burt's Bees, a prominent organic cosmetics company, expanded their men's product line.
- In 2020, The renowned vegan shop Credo Beauty made a huge stride by opening its first location.
- In 2019, Jessica Alba's cosmetics brand Honest Beauty made waves by going public, strengthening its position in the organic cosmetics market.
Report Scope:
Report Features Description Market Value (2022) USD 12.5 Bn Forecast Revenue (2032) USD 27.9 Bn CAGR (2023-2032) 8.6% Base Year for Estimation 2022 Historic Period 2016-2022 Forecast Period 2023-2032 Report Coverage Revenue Forecast, Market Dynamics, COVID-19 Impact, Competitive Landscape, Recent Developments Segments Covered By Product Type (Skincare, Haircare, Bodycare, Makeup Products, Fragrance & Mist), By End-User (Men, Women, Kids), By Distribution Channel (Supermarket/Hypermarket, Pharmacy & Drugstore, Specialty Stores, Online Retail) Regional Analysis North America – The US, Canada, & Mexico; Western Europe – Germany, France, The UK, Spain, Italy, Portugal, Ireland, Austria, Switzerland, Benelux, Nordic, & Rest of Western Europe; Eastern Europe – Russia, Poland, The Czech Republic, Greece, & Rest of Eastern Europe; APAC – China, Japan, South Korea, India, Australia & New Zealand, Indonesia, Malaysia, Philippines, Singapore, Thailand, Vietnam, & Rest of APAC; Latin America – Brazil, Colombia, Chile, Argentina, Costa Rica, & Rest of Latin America; Middle East & Africa – Algeria, Egypt, Israel, Kuwait, Nigeria, Saudi Arabia, South Africa, Turkey, United Arab Emirates, & Rest of MEA Competitive Landscape ALDI North Group, Alnatura Produktions- und Handels GmbH, AVON Beauty Products India Pvt Ltd, Benefit Cosmetics LLC, Burt's Bees., Chanel, Coty Inc., Dabur, The Estée Lauder Companies Inc., Hain Celestial, Johnson & Johnson Services, Inc., Lush Retail Ltd., L'ORÉAL, MAESA, Nails inc. limited., Physicians Formula., Procter & Gamble., REWE FAR EAST LIMITED, REVLON, Unilever Customization Scope Customization for segments, region/country-level will be provided. Moreover, additional customization can be done based on the requirements. Purchase Options We have three licenses to opt for: Single User License, Multi-User License (Up to 5 Users), Corporate Use License (Unlimited User and Printable PDF) -
- 1. Executive Summary
- 1.1. Definition
- 1.2. Taxonomy
- 1.3. Research Scope
- 1.4. Key Analysis
- 1.5. Key Findings by Major Segments
- 1.6. Top strategies by Major Players
- 2. Global Organic Cosmetics Market Overview
- 2.1. Organic Cosmetics Market Dynamics
- 2.1.1. Drivers
- 2.1.2. Opportunities
- 2.1.3. Restraints
- 2.1.4. Challenges
- 2.2. Macro-economic Factors
- 2.3. Regulatory Framework
- 2.4. Market Investment Feasibility Index
- 2.5. PEST Analysis
- 2.6. PORTER’S Five Force Analysis
- 2.7. Drivers & Restraints Impact Analysis
- 2.8. Industry Chain Analysis
- 2.9. Cost Structure Analysis
- 2.10. Marketing Strategy
- 2.11. Russia-Ukraine War Impact Analysis
- 2.12. Opportunity Map Analysis
- 2.13. Market Competition Scenario Analysis
- 2.14. Product Life Cycle Analysis
- 2.15. Opportunity Orbits
- 2.16. Manufacturer Intensity Map
- 2.17. Major Companies sales by Value & Volume
- 2.1. Organic Cosmetics Market Dynamics
- 3. Global Organic Cosmetics Market Analysis, Opportunity and Forecast, 2016-2032
- 3.1. Global Organic Cosmetics Market Analysis, 2016-2021
- 3.2. Global Organic Cosmetics Market Opportunity and Forecast, 2023-2032
- 3.3. Global Organic Cosmetics Market Analysis, Opportunity and Forecast, By Product Type, 2016-2032
- 3.3.1. Global Organic Cosmetics Market Analysis by Product Type: Introduction
- 3.3.2. Market Size Absolute $ Opportunity Analysis and Forecast, By Product Type, 2016-2032
- 3.3.3. Skincare
- 3.3.4. Haircare
- 3.3.5. Bodycare
- 3.3.6. Makeup Products
- 3.3.7. Fragrance & Mist
- 3.4. Global Organic Cosmetics Market Analysis, Opportunity and Forecast, By By End-User, 2016-2032
- 3.4.1. Global Organic Cosmetics Market Analysis by By End-User: Introduction
- 3.4.2. Market Size Absolute $ Opportunity Analysis and Forecast, By By End-User, 2016-2032
- 3.4.3. Men
- 3.4.4. Women
- 3.4.5. Kids
- 3.5. Global Organic Cosmetics Market Analysis, Opportunity and Forecast, By By Distribution Channel, 2016-2032
- 3.5.1. Global Organic Cosmetics Market Analysis by By Distribution Channel: Introduction
- 3.5.2. Market Size Absolute $ Opportunity Analysis and Forecast, By By Distribution Channel, 2016-2032
- 3.5.3. Supermarket/Hypermarket
- 3.5.4. Pharmacy & Drugstore
- 3.5.5. Specialty Stores
- 3.5.6. Online Retail
- 4. North America Organic Cosmetics Market Analysis, Opportunity and Forecast, 2016-2032
- 4.1. North America Organic Cosmetics Market Analysis, 2016-2021
- 4.2. North America Organic Cosmetics Market Opportunity and Forecast, 2023-2032
- 4.3. North America Organic Cosmetics Market Analysis, Opportunity and Forecast, By Product Type, 2016-2032
- 4.3.1. North America Organic Cosmetics Market Analysis by Product Type: Introduction
- 4.3.2. Market Size Absolute $ Opportunity Analysis and Forecast, By Product Type, 2016-2032
- 4.3.3. Skincare
- 4.3.4. Haircare
- 4.3.5. Bodycare
- 4.3.6. Makeup Products
- 4.3.7. Fragrance & Mist
- 4.4. North America Organic Cosmetics Market Analysis, Opportunity and Forecast, By By End-User, 2016-2032
- 4.4.1. North America Organic Cosmetics Market Analysis by By End-User: Introduction
- 4.4.2. Market Size Absolute $ Opportunity Analysis and Forecast, By By End-User, 2016-2032
- 4.4.3. Men
- 4.4.4. Women
- 4.4.5. Kids
- 4.5. North America Organic Cosmetics Market Analysis, Opportunity and Forecast, By By Distribution Channel, 2016-2032
- 4.5.1. North America Organic Cosmetics Market Analysis by By Distribution Channel: Introduction
- 4.5.2. Market Size Absolute $ Opportunity Analysis and Forecast, By By Distribution Channel, 2016-2032
- 4.5.3. Supermarket/Hypermarket
- 4.5.4. Pharmacy & Drugstore
- 4.5.5. Specialty Stores
- 4.5.6. Online Retail
- 4.6. North America Organic Cosmetics Market Analysis, Opportunity and Forecast, By Country , 2016-2032
- 4.6.1. North America Organic Cosmetics Market Analysis by Country : Introduction
- 4.6.2. Market Size Absolute $ Opportunity Analysis and Forecast, Country , 2016-2032
- 4.6.2.1. The US
- 4.6.2.2. Canada
- 4.6.2.3. Mexico
- 5. Western Europe Organic Cosmetics Market Analysis, Opportunity and Forecast, 2016-2032
- 5.1. Western Europe Organic Cosmetics Market Analysis, 2016-2021
- 5.2. Western Europe Organic Cosmetics Market Opportunity and Forecast, 2023-2032
- 5.3. Western Europe Organic Cosmetics Market Analysis, Opportunity and Forecast, By Product Type, 2016-2032
- 5.3.1. Western Europe Organic Cosmetics Market Analysis by Product Type: Introduction
- 5.3.2. Market Size Absolute $ Opportunity Analysis and Forecast, By Product Type, 2016-2032
- 5.3.3. Skincare
- 5.3.4. Haircare
- 5.3.5. Bodycare
- 5.3.6. Makeup Products
- 5.3.7. Fragrance & Mist
- 5.4. Western Europe Organic Cosmetics Market Analysis, Opportunity and Forecast, By By End-User, 2016-2032
- 5.4.1. Western Europe Organic Cosmetics Market Analysis by By End-User: Introduction
- 5.4.2. Market Size Absolute $ Opportunity Analysis and Forecast, By By End-User, 2016-2032
- 5.4.3. Men
- 5.4.4. Women
- 5.4.5. Kids
- 5.5. Western Europe Organic Cosmetics Market Analysis, Opportunity and Forecast, By By Distribution Channel, 2016-2032
- 5.5.1. Western Europe Organic Cosmetics Market Analysis by By Distribution Channel: Introduction
- 5.5.2. Market Size Absolute $ Opportunity Analysis and Forecast, By By Distribution Channel, 2016-2032
- 5.5.3. Supermarket/Hypermarket
- 5.5.4. Pharmacy & Drugstore
- 5.5.5. Specialty Stores
- 5.5.6. Online Retail
- 5.6. Western Europe Organic Cosmetics Market Analysis, Opportunity and Forecast, By Country , 2016-2032
- 5.6.1. Western Europe Organic Cosmetics Market Analysis by Country : Introduction
- 5.6.2. Market Size Absolute $ Opportunity Analysis and Forecast, Country , 2016-2032
- 5.6.2.1. Germany
- 5.6.2.2. France
- 5.6.2.3. The UK
- 5.6.2.4. Spain
- 5.6.2.5. Italy
- 5.6.2.6. Portugal
- 5.6.2.7. Ireland
- 5.6.2.8. Austria
- 5.6.2.9. Switzerland
- 5.6.2.10. Benelux
- 5.6.2.11. Nordic
- 5.6.2.12. Rest of Western Europe
- 6. Eastern Europe Organic Cosmetics Market Analysis, Opportunity and Forecast, 2016-2032
- 6.1. Eastern Europe Organic Cosmetics Market Analysis, 2016-2021
- 6.2. Eastern Europe Organic Cosmetics Market Opportunity and Forecast, 2023-2032
- 6.3. Eastern Europe Organic Cosmetics Market Analysis, Opportunity and Forecast, By Product Type, 2016-2032
- 6.3.1. Eastern Europe Organic Cosmetics Market Analysis by Product Type: Introduction
- 6.3.2. Market Size Absolute $ Opportunity Analysis and Forecast, By Product Type, 2016-2032
- 6.3.3. Skincare
- 6.3.4. Haircare
- 6.3.5. Bodycare
- 6.3.6. Makeup Products
- 6.3.7. Fragrance & Mist
- 6.4. Eastern Europe Organic Cosmetics Market Analysis, Opportunity and Forecast, By By End-User, 2016-2032
- 6.4.1. Eastern Europe Organic Cosmetics Market Analysis by By End-User: Introduction
- 6.4.2. Market Size Absolute $ Opportunity Analysis and Forecast, By By End-User, 2016-2032
- 6.4.3. Men
- 6.4.4. Women
- 6.4.5. Kids
- 6.5. Eastern Europe Organic Cosmetics Market Analysis, Opportunity and Forecast, By By Distribution Channel, 2016-2032
- 6.5.1. Eastern Europe Organic Cosmetics Market Analysis by By Distribution Channel: Introduction
- 6.5.2. Market Size Absolute $ Opportunity Analysis and Forecast, By By Distribution Channel, 2016-2032
- 6.5.3. Supermarket/Hypermarket
- 6.5.4. Pharmacy & Drugstore
- 6.5.5. Specialty Stores
- 6.5.6. Online Retail
- 6.6. Eastern Europe Organic Cosmetics Market Analysis, Opportunity and Forecast, By Country , 2016-2032
- 6.6.1. Eastern Europe Organic Cosmetics Market Analysis by Country : Introduction
- 6.6.2. Market Size Absolute $ Opportunity Analysis and Forecast, Country , 2016-2032
- 6.6.2.1. Russia
- 6.6.2.2. Poland
- 6.6.2.3. The Czech Republic
- 6.6.2.4. Greece
- 6.6.2.5. Rest of Eastern Europe
- 7. APAC Organic Cosmetics Market Analysis, Opportunity and Forecast, 2016-2032
- 7.1. APAC Organic Cosmetics Market Analysis, 2016-2021
- 7.2. APAC Organic Cosmetics Market Opportunity and Forecast, 2023-2032
- 7.3. APAC Organic Cosmetics Market Analysis, Opportunity and Forecast, By Product Type, 2016-2032
- 7.3.1. APAC Organic Cosmetics Market Analysis by Product Type: Introduction
- 7.3.2. Market Size Absolute $ Opportunity Analysis and Forecast, By Product Type, 2016-2032
- 7.3.3. Skincare
- 7.3.4. Haircare
- 7.3.5. Bodycare
- 7.3.6. Makeup Products
- 7.3.7. Fragrance & Mist
- 7.4. APAC Organic Cosmetics Market Analysis, Opportunity and Forecast, By By End-User, 2016-2032
- 7.4.1. APAC Organic Cosmetics Market Analysis by By End-User: Introduction
- 7.4.2. Market Size Absolute $ Opportunity Analysis and Forecast, By By End-User, 2016-2032
- 7.4.3. Men
- 7.4.4. Women
- 7.4.5. Kids
- 7.5. APAC Organic Cosmetics Market Analysis, Opportunity and Forecast, By By Distribution Channel, 2016-2032
- 7.5.1. APAC Organic Cosmetics Market Analysis by By Distribution Channel: Introduction
- 7.5.2. Market Size Absolute $ Opportunity Analysis and Forecast, By By Distribution Channel, 2016-2032
- 7.5.3. Supermarket/Hypermarket
- 7.5.4. Pharmacy & Drugstore
- 7.5.5. Specialty Stores
- 7.5.6. Online Retail
- 7.6. APAC Organic Cosmetics Market Analysis, Opportunity and Forecast, By Country , 2016-2032
- 7.6.1. APAC Organic Cosmetics Market Analysis by Country : Introduction
- 7.6.2. Market Size Absolute $ Opportunity Analysis and Forecast, Country , 2016-2032
- 7.6.2.1. China
- 7.6.2.2. Japan
- 7.6.2.3. South Korea
- 7.6.2.4. India
- 7.6.2.5. Australia & New Zeland
- 7.6.2.6. Indonesia
- 7.6.2.7. Malaysia
- 7.6.2.8. Philippines
- 7.6.2.9. Singapore
- 7.6.2.10. Thailand
- 7.6.2.11. Vietnam
- 7.6.2.12. Rest of APAC
- 8. Latin America Organic Cosmetics Market Analysis, Opportunity and Forecast, 2016-2032
- 8.1. Latin America Organic Cosmetics Market Analysis, 2016-2021
- 8.2. Latin America Organic Cosmetics Market Opportunity and Forecast, 2023-2032
- 8.3. Latin America Organic Cosmetics Market Analysis, Opportunity and Forecast, By Product Type, 2016-2032
- 8.3.1. Latin America Organic Cosmetics Market Analysis by Product Type: Introduction
- 8.3.2. Market Size Absolute $ Opportunity Analysis and Forecast, By Product Type, 2016-2032
- 8.3.3. Skincare
- 8.3.4. Haircare
- 8.3.5. Bodycare
- 8.3.6. Makeup Products
- 8.3.7. Fragrance & Mist
- 8.4. Latin America Organic Cosmetics Market Analysis, Opportunity and Forecast, By By End-User, 2016-2032
- 8.4.1. Latin America Organic Cosmetics Market Analysis by By End-User: Introduction
- 8.4.2. Market Size Absolute $ Opportunity Analysis and Forecast, By By End-User, 2016-2032
- 8.4.3. Men
- 8.4.4. Women
- 8.4.5. Kids
- 8.5. Latin America Organic Cosmetics Market Analysis, Opportunity and Forecast, By By Distribution Channel, 2016-2032
- 8.5.1. Latin America Organic Cosmetics Market Analysis by By Distribution Channel: Introduction
- 8.5.2. Market Size Absolute $ Opportunity Analysis and Forecast, By By Distribution Channel, 2016-2032
- 8.5.3. Supermarket/Hypermarket
- 8.5.4. Pharmacy & Drugstore
- 8.5.5. Specialty Stores
- 8.5.6. Online Retail
- 8.6. Latin America Organic Cosmetics Market Analysis, Opportunity and Forecast, By Country , 2016-2032
- 8.6.1. Latin America Organic Cosmetics Market Analysis by Country : Introduction
- 8.6.2. Market Size Absolute $ Opportunity Analysis and Forecast, Country , 2016-2032
- 8.6.2.1. Brazil
- 8.6.2.2. Colombia
- 8.6.2.3. Chile
- 8.6.2.4. Argentina
- 8.6.2.5. Costa Rica
- 8.6.2.6. Rest of Latin America
- 9. Middle East & Africa Organic Cosmetics Market Analysis, Opportunity and Forecast, 2016-2032
- 9.1. Middle East & Africa Organic Cosmetics Market Analysis, 2016-2021
- 9.2. Middle East & Africa Organic Cosmetics Market Opportunity and Forecast, 2023-2032
- 9.3. Middle East & Africa Organic Cosmetics Market Analysis, Opportunity and Forecast, By Product Type, 2016-2032
- 9.3.1. Middle East & Africa Organic Cosmetics Market Analysis by Product Type: Introduction
- 9.3.2. Market Size Absolute $ Opportunity Analysis and Forecast, By Product Type, 2016-2032
- 9.3.3. Skincare
- 9.3.4. Haircare
- 9.3.5. Bodycare
- 9.3.6. Makeup Products
- 9.3.7. Fragrance & Mist
- 9.4. Middle East & Africa Organic Cosmetics Market Analysis, Opportunity and Forecast, By By End-User, 2016-2032
- 9.4.1. Middle East & Africa Organic Cosmetics Market Analysis by By End-User: Introduction
- 9.4.2. Market Size Absolute $ Opportunity Analysis and Forecast, By By End-User, 2016-2032
- 9.4.3. Men
- 9.4.4. Women
- 9.4.5. Kids
- 9.5. Middle East & Africa Organic Cosmetics Market Analysis, Opportunity and Forecast, By By Distribution Channel, 2016-2032
- 9.5.1. Middle East & Africa Organic Cosmetics Market Analysis by By Distribution Channel: Introduction
- 9.5.2. Market Size Absolute $ Opportunity Analysis and Forecast, By By Distribution Channel, 2016-2032
- 9.5.3. Supermarket/Hypermarket
- 9.5.4. Pharmacy & Drugstore
- 9.5.5. Specialty Stores
- 9.5.6. Online Retail
- 9.6. Middle East & Africa Organic Cosmetics Market Analysis, Opportunity and Forecast, By Country , 2016-2032
- 9.6.1. Middle East & Africa Organic Cosmetics Market Analysis by Country : Introduction
- 9.6.2. Market Size Absolute $ Opportunity Analysis and Forecast, Country , 2016-2032
- 9.6.2.1. Algeria
- 9.6.2.2. Egypt
- 9.6.2.3. Israel
- 9.6.2.4. Kuwait
- 9.6.2.5. Nigeria
- 9.6.2.6. Saudi Arabia
- 9.6.2.7. South Africa
- 9.6.2.8. Turkey
- 9.6.2.9. The UAE
- 9.6.2.10. Rest of MEA
- 10. Global Organic Cosmetics Market Analysis, Opportunity and Forecast, By Region , 2016-2032
- 10.1. Global Organic Cosmetics Market Analysis by Region : Introduction
- 10.2. Market Size Absolute $ Opportunity Analysis and Forecast, By Region , 2016-2032
- 10.2.1. North America
- 10.2.2. Western Europe
- 10.2.3. Eastern Europe
- 10.2.4. APAC
- 10.2.5. Latin America
- 10.2.6. Middle East & Africa
- 11. Global Organic Cosmetics Market Competitive Landscape, Market Share Analysis, and Company Profiles
- 11.1. Market Share Analysis
- 11.2. Company Profiles
- 11.3. ALDI North Group
- 11.3.1. Company Overview
- 11.3.2. Financial Highlights
- 11.3.3. Product Portfolio
- 11.3.4. SWOT Analysis
- 11.3.5. Key Strategies and Developments
- 11.4. Alnatura Produktions- und Handels GmbH
- 11.4.1. Company Overview
- 11.4.2. Financial Highlights
- 11.4.3. Product Portfolio
- 11.4.4. SWOT Analysis
- 11.4.5. Key Strategies and Developments
- 11.5. AVON Beauty Products India Pvt Ltd
- 11.5.1. Company Overview
- 11.5.2. Financial Highlights
- 11.5.3. Product Portfolio
- 11.5.4. SWOT Analysis
- 11.5.5. Key Strategies and Developments
- 11.6. Benefit Cosmetics LLC
- 11.6.1. Company Overview
- 11.6.2. Financial Highlights
- 11.6.3. Product Portfolio
- 11.6.4. SWOT Analysis
- 11.6.5. Key Strategies and Developments
- 11.7. Burt's Bees.
- 11.7.1. Company Overview
- 11.7.2. Financial Highlights
- 11.7.3. Product Portfolio
- 11.7.4. SWOT Analysis
- 11.7.5. Key Strategies and Developments
- 11.8. Chanel
- 11.8.1. Company Overview
- 11.8.2. Financial Highlights
- 11.8.3. Product Portfolio
- 11.8.4. SWOT Analysis
- 11.8.5. Key Strategies and Developments
- 11.9. Coty Inc.
- 11.9.1. Company Overview
- 11.9.2. Financial Highlights
- 11.9.3. Product Portfolio
- 11.9.4. SWOT Analysis
- 11.9.5. Key Strategies and Developments
- 11.10. Dabur
- 11.10.1. Company Overview
- 11.10.2. Financial Highlights
- 11.10.3. Product Portfolio
- 11.10.4. SWOT Analysis
- 11.10.5. Key Strategies and Developments
- 11.11. The Estée Lauder Companies Inc.
- 11.11.1. Company Overview
- 11.11.2. Financial Highlights
- 11.11.3. Product Portfolio
- 11.11.4. SWOT Analysis
- 11.11.5. Key Strategies and Developments
- 11.12. Hain Celestial
- 11.12.1. Company Overview
- 11.12.2. Financial Highlights
- 11.12.3. Product Portfolio
- 11.12.4. SWOT Analysis
- 11.12.5. Key Strategies and Developments
- 11.13. Johnson & Johnson Services, Inc.
- 11.13.1. Company Overview
- 11.13.2. Financial Highlights
- 11.13.3. Product Portfolio
- 11.13.4. SWOT Analysis
- 11.13.5. Key Strategies and Developments
- 11.14. Lush Retail Ltd.
- 11.14.1. Company Overview
- 11.14.2. Financial Highlights
- 11.14.3. Product Portfolio
- 11.14.4. SWOT Analysis
- 11.14.5. Key Strategies and Developments
- 11.15. L'ORÉAL
- 11.15.1. Company Overview
- 11.15.2. Financial Highlights
- 11.15.3. Product Portfolio
- 11.15.4. SWOT Analysis
- 11.15.5. Key Strategies and Developments
- 11.16. MAESA
- 11.16.1. Company Overview
- 11.16.2. Financial Highlights
- 11.16.3. Product Portfolio
- 11.16.4. SWOT Analysis
- 11.16.5. Key Strategies and Developments
- 11.17. Nails Inc. limited.
- 11.17.1. Company Overview
- 11.17.2. Financial Highlights
- 11.17.3. Product Portfolio
- 11.17.4. SWOT Analysis
- 11.17.5. Key Strategies and Developments
- 11.18. Physicians Formula.
- 11.18.1. Company Overview
- 11.18.2. Financial Highlights
- 11.18.3. Product Portfolio
- 11.18.4. SWOT Analysis
- 11.18.5. Key Strategies and Developments
- 11.19. Procter & Gamble.
- 11.19.1. Company Overview
- 11.19.2. Financial Highlights
- 11.19.3. Product Portfolio
- 11.19.4. SWOT Analysis
- 11.19.5. Key Strategies and Developments
- 11.20. REWE FAR EAST LIMITED
- 11.20.1. Company Overview
- 11.20.2. Financial Highlights
- 11.20.3. Product Portfolio
- 11.20.4. SWOT Analysis
- 11.20.5. Key Strategies and Developments
- 11.21. REVLON
- 11.21.1. Company Overview
- 11.21.2. Financial Highlights
- 11.21.3. Product Portfolio
- 11.21.4. SWOT Analysis
- 11.21.5. Key Strategies and Developments
- 11.22. Unilever
- 11.22.1. Company Overview
- 11.22.2. Financial Highlights
- 11.22.3. Product Portfolio
- 11.22.4. SWOT Analysis
- 11.22.5. Key Strategies and Developments
- 12. Assumptions and Acronyms
- 13. Research Methodology
- 14. Contact
- List of Figures
- Figure 1: Global Organic Cosmetics Market Revenue (US$ Mn) Market Share by Product Type in 2022
- Figure 2: Global Organic Cosmetics Market Attractiveness Analysis by Product Type, 2016-2032
- Figure 3: Global Organic Cosmetics Market Revenue (US$ Mn) Market Share by End-Userin 2022
- Figure 4: Global Organic Cosmetics Market Attractiveness Analysis by End-User, 2016-2032
- Figure 5: Global Organic Cosmetics Market Revenue (US$ Mn) Market Share by Distribution Channelin 2022
- Figure 6: Global Organic Cosmetics Market Attractiveness Analysis by Distribution Channel, 2016-2032
- Figure 7: Global Organic Cosmetics Market Revenue (US$ Mn) Market Share by Region in 2022
- Figure 8: Global Organic Cosmetics Market Attractiveness Analysis by Region, 2016-2032
- Figure 9: Global Organic Cosmetics Market Revenue (US$ Mn) (2016-2032)
- Figure 10: Global Organic Cosmetics Market Revenue (US$ Mn) Comparison by Region (2016-2032)
- Figure 11: Global Organic Cosmetics Market Revenue (US$ Mn) Comparison by Product Type (2016-2032)
- Figure 12: Global Organic Cosmetics Market Revenue (US$ Mn) Comparison by End-User (2016-2032)
- Figure 13: Global Organic Cosmetics Market Revenue (US$ Mn) Comparison by Distribution Channel (2016-2032)
- Figure 14: Global Organic Cosmetics Market Y-o-Y Growth Rate Comparison by Region (2016-2032)
- Figure 15: Global Organic Cosmetics Market Y-o-Y Growth Rate Comparison by Product Type (2016-2032)
- Figure 16: Global Organic Cosmetics Market Y-o-Y Growth Rate Comparison by End-User (2016-2032)
- Figure 17: Global Organic Cosmetics Market Y-o-Y Growth Rate Comparison by Distribution Channel (2016-2032)
- Figure 18: Global Organic Cosmetics Market Share Comparison by Region (2016-2032)
- Figure 19: Global Organic Cosmetics Market Share Comparison by Product Type (2016-2032)
- Figure 20: Global Organic Cosmetics Market Share Comparison by End-User (2016-2032)
- Figure 21: Global Organic Cosmetics Market Share Comparison by Distribution Channel (2016-2032)
- Figure 22: North America Organic Cosmetics Market Revenue (US$ Mn) Market Share by Product Typein 2022
- Figure 23: North America Organic Cosmetics Market Attractiveness Analysis by Product Type, 2016-2032
- Figure 24: North America Organic Cosmetics Market Revenue (US$ Mn) Market Share by End-Userin 2022
- Figure 25: North America Organic Cosmetics Market Attractiveness Analysis by End-User, 2016-2032
- Figure 26: North America Organic Cosmetics Market Revenue (US$ Mn) Market Share by Distribution Channelin 2022
- Figure 27: North America Organic Cosmetics Market Attractiveness Analysis by Distribution Channel, 2016-2032
- Figure 28: North America Organic Cosmetics Market Revenue (US$ Mn) Market Share by Country in 2022
- Figure 29: North America Organic Cosmetics Market Attractiveness Analysis by Country, 2016-2032
- Figure 30: North America Organic Cosmetics Market Revenue (US$ Mn) (2016-2032)
- Figure 31: North America Organic Cosmetics Market Revenue (US$ Mn) Comparison by Country (2016-2032)
- Figure 32: North America Organic Cosmetics Market Revenue (US$ Mn) Comparison by Product Type (2016-2032)
- Figure 33: North America Organic Cosmetics Market Revenue (US$ Mn) Comparison by End-User (2016-2032)
- Figure 34: North America Organic Cosmetics Market Revenue (US$ Mn) Comparison by Distribution Channel (2016-2032)
- Figure 35: North America Organic Cosmetics Market Y-o-Y Growth Rate Comparison by Country (2016-2032)
- Figure 36: North America Organic Cosmetics Market Y-o-Y Growth Rate Comparison by Product Type (2016-2032)
- Figure 37: North America Organic Cosmetics Market Y-o-Y Growth Rate Comparison by End-User (2016-2032)
- Figure 38: North America Organic Cosmetics Market Y-o-Y Growth Rate Comparison by Distribution Channel (2016-2032)
- Figure 39: North America Organic Cosmetics Market Share Comparison by Country (2016-2032)
- Figure 40: North America Organic Cosmetics Market Share Comparison by Product Type (2016-2032)
- Figure 41: North America Organic Cosmetics Market Share Comparison by End-User (2016-2032)
- Figure 42: North America Organic Cosmetics Market Share Comparison by Distribution Channel (2016-2032)
- Figure 43: Western Europe Organic Cosmetics Market Revenue (US$ Mn) Market Share by Product Typein 2022
- Figure 44: Western Europe Organic Cosmetics Market Attractiveness Analysis by Product Type, 2016-2032
- Figure 45: Western Europe Organic Cosmetics Market Revenue (US$ Mn) Market Share by End-Userin 2022
- Figure 46: Western Europe Organic Cosmetics Market Attractiveness Analysis by End-User, 2016-2032
- Figure 47: Western Europe Organic Cosmetics Market Revenue (US$ Mn) Market Share by Distribution Channelin 2022
- Figure 48: Western Europe Organic Cosmetics Market Attractiveness Analysis by Distribution Channel, 2016-2032
- Figure 49: Western Europe Organic Cosmetics Market Revenue (US$ Mn) Market Share by Country in 2022
- Figure 50: Western Europe Organic Cosmetics Market Attractiveness Analysis by Country, 2016-2032
- Figure 51: Western Europe Organic Cosmetics Market Revenue (US$ Mn) (2016-2032)
- Figure 52: Western Europe Organic Cosmetics Market Revenue (US$ Mn) Comparison by Country (2016-2032)
- Figure 53: Western Europe Organic Cosmetics Market Revenue (US$ Mn) Comparison by Product Type (2016-2032)
- Figure 54: Western Europe Organic Cosmetics Market Revenue (US$ Mn) Comparison by End-User (2016-2032)
- Figure 55: Western Europe Organic Cosmetics Market Revenue (US$ Mn) Comparison by Distribution Channel (2016-2032)
- Figure 56: Western Europe Organic Cosmetics Market Y-o-Y Growth Rate Comparison by Country (2016-2032)
- Figure 57: Western Europe Organic Cosmetics Market Y-o-Y Growth Rate Comparison by Product Type (2016-2032)
- Figure 58: Western Europe Organic Cosmetics Market Y-o-Y Growth Rate Comparison by End-User (2016-2032)
- Figure 59: Western Europe Organic Cosmetics Market Y-o-Y Growth Rate Comparison by Distribution Channel (2016-2032)
- Figure 60: Western Europe Organic Cosmetics Market Share Comparison by Country (2016-2032)
- Figure 61: Western Europe Organic Cosmetics Market Share Comparison by Product Type (2016-2032)
- Figure 62: Western Europe Organic Cosmetics Market Share Comparison by End-User (2016-2032)
- Figure 63: Western Europe Organic Cosmetics Market Share Comparison by Distribution Channel (2016-2032)
- Figure 64: Eastern Europe Organic Cosmetics Market Revenue (US$ Mn) Market Share by Product Typein 2022
- Figure 65: Eastern Europe Organic Cosmetics Market Attractiveness Analysis by Product Type, 2016-2032
- Figure 66: Eastern Europe Organic Cosmetics Market Revenue (US$ Mn) Market Share by End-Userin 2022
- Figure 67: Eastern Europe Organic Cosmetics Market Attractiveness Analysis by End-User, 2016-2032
- Figure 68: Eastern Europe Organic Cosmetics Market Revenue (US$ Mn) Market Share by Distribution Channelin 2022
- Figure 69: Eastern Europe Organic Cosmetics Market Attractiveness Analysis by Distribution Channel, 2016-2032
- Figure 70: Eastern Europe Organic Cosmetics Market Revenue (US$ Mn) Market Share by Country in 2022
- Figure 71: Eastern Europe Organic Cosmetics Market Attractiveness Analysis by Country, 2016-2032
- Figure 72: Eastern Europe Organic Cosmetics Market Revenue (US$ Mn) (2016-2032)
- Figure 73: Eastern Europe Organic Cosmetics Market Revenue (US$ Mn) Comparison by Country (2016-2032)
- Figure 74: Eastern Europe Organic Cosmetics Market Revenue (US$ Mn) Comparison by Product Type (2016-2032)
- Figure 75: Eastern Europe Organic Cosmetics Market Revenue (US$ Mn) Comparison by End-User (2016-2032)
- Figure 76: Eastern Europe Organic Cosmetics Market Revenue (US$ Mn) Comparison by Distribution Channel (2016-2032)
- Figure 77: Eastern Europe Organic Cosmetics Market Y-o-Y Growth Rate Comparison by Country (2016-2032)
- Figure 78: Eastern Europe Organic Cosmetics Market Y-o-Y Growth Rate Comparison by Product Type (2016-2032)
- Figure 79: Eastern Europe Organic Cosmetics Market Y-o-Y Growth Rate Comparison by End-User (2016-2032)
- Figure 80: Eastern Europe Organic Cosmetics Market Y-o-Y Growth Rate Comparison by Distribution Channel (2016-2032)
- Figure 81: Eastern Europe Organic Cosmetics Market Share Comparison by Country (2016-2032)
- Figure 82: Eastern Europe Organic Cosmetics Market Share Comparison by Product Type (2016-2032)
- Figure 83: Eastern Europe Organic Cosmetics Market Share Comparison by End-User (2016-2032)
- Figure 84: Eastern Europe Organic Cosmetics Market Share Comparison by Distribution Channel (2016-2032)
- Figure 85: APAC Organic Cosmetics Market Revenue (US$ Mn) Market Share by Product Typein 2022
- Figure 86: APAC Organic Cosmetics Market Attractiveness Analysis by Product Type, 2016-2032
- Figure 87: APAC Organic Cosmetics Market Revenue (US$ Mn) Market Share by End-Userin 2022
- Figure 88: APAC Organic Cosmetics Market Attractiveness Analysis by End-User, 2016-2032
- Figure 89: APAC Organic Cosmetics Market Revenue (US$ Mn) Market Share by Distribution Channelin 2022
- Figure 90: APAC Organic Cosmetics Market Attractiveness Analysis by Distribution Channel, 2016-2032
- Figure 91: APAC Organic Cosmetics Market Revenue (US$ Mn) Market Share by Country in 2022
- Figure 92: APAC Organic Cosmetics Market Attractiveness Analysis by Country, 2016-2032
- Figure 93: APAC Organic Cosmetics Market Revenue (US$ Mn) (2016-2032)
- Figure 94: APAC Organic Cosmetics Market Revenue (US$ Mn) Comparison by Country (2016-2032)
- Figure 95: APAC Organic Cosmetics Market Revenue (US$ Mn) Comparison by Product Type (2016-2032)
- Figure 96: APAC Organic Cosmetics Market Revenue (US$ Mn) Comparison by End-User (2016-2032)
- Figure 97: APAC Organic Cosmetics Market Revenue (US$ Mn) Comparison by Distribution Channel (2016-2032)
- Figure 98: APAC Organic Cosmetics Market Y-o-Y Growth Rate Comparison by Country (2016-2032)
- Figure 99: APAC Organic Cosmetics Market Y-o-Y Growth Rate Comparison by Product Type (2016-2032)
- Figure 100: APAC Organic Cosmetics Market Y-o-Y Growth Rate Comparison by End-User (2016-2032)
- Figure 101: APAC Organic Cosmetics Market Y-o-Y Growth Rate Comparison by Distribution Channel (2016-2032)
- Figure 102: APAC Organic Cosmetics Market Share Comparison by Country (2016-2032)
- Figure 103: APAC Organic Cosmetics Market Share Comparison by Product Type (2016-2032)
- Figure 104: APAC Organic Cosmetics Market Share Comparison by End-User (2016-2032)
- Figure 105: APAC Organic Cosmetics Market Share Comparison by Distribution Channel (2016-2032)
- Figure 106: Latin America Organic Cosmetics Market Revenue (US$ Mn) Market Share by Product Typein 2022
- Figure 107: Latin America Organic Cosmetics Market Attractiveness Analysis by Product Type, 2016-2032
- Figure 108: Latin America Organic Cosmetics Market Revenue (US$ Mn) Market Share by End-Userin 2022
- Figure 109: Latin America Organic Cosmetics Market Attractiveness Analysis by End-User, 2016-2032
- Figure 110: Latin America Organic Cosmetics Market Revenue (US$ Mn) Market Share by Distribution Channelin 2022
- Figure 111: Latin America Organic Cosmetics Market Attractiveness Analysis by Distribution Channel, 2016-2032
- Figure 112: Latin America Organic Cosmetics Market Revenue (US$ Mn) Market Share by Country in 2022
- Figure 113: Latin America Organic Cosmetics Market Attractiveness Analysis by Country, 2016-2032
- Figure 114: Latin America Organic Cosmetics Market Revenue (US$ Mn) (2016-2032)
- Figure 115: Latin America Organic Cosmetics Market Revenue (US$ Mn) Comparison by Country (2016-2032)
- Figure 116: Latin America Organic Cosmetics Market Revenue (US$ Mn) Comparison by Product Type (2016-2032)
- Figure 117: Latin America Organic Cosmetics Market Revenue (US$ Mn) Comparison by End-User (2016-2032)
- Figure 118: Latin America Organic Cosmetics Market Revenue (US$ Mn) Comparison by Distribution Channel (2016-2032)
- Figure 119: Latin America Organic Cosmetics Market Y-o-Y Growth Rate Comparison by Country (2016-2032)
- Figure 120: Latin America Organic Cosmetics Market Y-o-Y Growth Rate Comparison by Product Type (2016-2032)
- Figure 121: Latin America Organic Cosmetics Market Y-o-Y Growth Rate Comparison by End-User (2016-2032)
- Figure 122: Latin America Organic Cosmetics Market Y-o-Y Growth Rate Comparison by Distribution Channel (2016-2032)
- Figure 123: Latin America Organic Cosmetics Market Share Comparison by Country (2016-2032)
- Figure 124: Latin America Organic Cosmetics Market Share Comparison by Product Type (2016-2032)
- Figure 125: Latin America Organic Cosmetics Market Share Comparison by End-User (2016-2032)
- Figure 126: Latin America Organic Cosmetics Market Share Comparison by Distribution Channel (2016-2032)
- Figure 127: Middle East & Africa Organic Cosmetics Market Revenue (US$ Mn) Market Share by Product Typein 2022
- Figure 128: Middle East & Africa Organic Cosmetics Market Attractiveness Analysis by Product Type, 2016-2032
- Figure 129: Middle East & Africa Organic Cosmetics Market Revenue (US$ Mn) Market Share by End-Userin 2022
- Figure 130: Middle East & Africa Organic Cosmetics Market Attractiveness Analysis by End-User, 2016-2032
- Figure 131: Middle East & Africa Organic Cosmetics Market Revenue (US$ Mn) Market Share by Distribution Channelin 2022
- Figure 132: Middle East & Africa Organic Cosmetics Market Attractiveness Analysis by Distribution Channel, 2016-2032
- Figure 133: Middle East & Africa Organic Cosmetics Market Revenue (US$ Mn) Market Share by Country in 2022
- Figure 134: Middle East & Africa Organic Cosmetics Market Attractiveness Analysis by Country, 2016-2032
- Figure 135: Middle East & Africa Organic Cosmetics Market Revenue (US$ Mn) (2016-2032)
- Figure 136: Middle East & Africa Organic Cosmetics Market Revenue (US$ Mn) Comparison by Country (2016-2032)
- Figure 137: Middle East & Africa Organic Cosmetics Market Revenue (US$ Mn) Comparison by Product Type (2016-2032)
- Figure 138: Middle East & Africa Organic Cosmetics Market Revenue (US$ Mn) Comparison by End-User (2016-2032)
- Figure 139: Middle East & Africa Organic Cosmetics Market Revenue (US$ Mn) Comparison by Distribution Channel (2016-2032)
- Figure 140: Middle East & Africa Organic Cosmetics Market Y-o-Y Growth Rate Comparison by Country (2016-2032)
- Figure 141: Middle East & Africa Organic Cosmetics Market Y-o-Y Growth Rate Comparison by Product Type (2016-2032)
- Figure 142: Middle East & Africa Organic Cosmetics Market Y-o-Y Growth Rate Comparison by End-User (2016-2032)
- Figure 143: Middle East & Africa Organic Cosmetics Market Y-o-Y Growth Rate Comparison by Distribution Channel (2016-2032)
- Figure 144: Middle East & Africa Organic Cosmetics Market Share Comparison by Country (2016-2032)
- Figure 145: Middle East & Africa Organic Cosmetics Market Share Comparison by Product Type (2016-2032)
- Figure 146: Middle East & Africa Organic Cosmetics Market Share Comparison by End-User (2016-2032)
- Figure 147: Middle East & Africa Organic Cosmetics Market Share Comparison by Distribution Channel (2016-2032)
List of Tables
- Table 1: Global Organic Cosmetics Market Market Comparison by Product Type (2016-2032)
- Table 2: Global Organic Cosmetics Market Market Comparison by End-User (2016-2032)
- Table 3: Global Organic Cosmetics Market Market Comparison by Distribution Channel (2016-2032)
- Table 4: Global Organic Cosmetics Market Revenue (US$ Mn) Comparison by Region (2016-2032)
- Table 5: Global Organic Cosmetics Market Market Revenue (US$ Mn) (2016-2032)
- Table 6: Global Organic Cosmetics Market Market Revenue (US$ Mn) Comparison by Region (2016-2032)
- Table 7: Global Organic Cosmetics Market Market Revenue (US$ Mn) Comparison by Product Type (2016-2032)
- Table 8: Global Organic Cosmetics Market Market Revenue (US$ Mn) Comparison by End-User (2016-2032)
- Table 9: Global Organic Cosmetics Market Market Revenue (US$ Mn) Comparison by Distribution Channel (2016-2032)
- Table 10: Global Organic Cosmetics Market Market Y-o-Y Growth Rate Comparison by Region (2016-2032)
- Table 11: Global Organic Cosmetics Market Market Y-o-Y Growth Rate Comparison by Product Type (2016-2032)
- Table 12: Global Organic Cosmetics Market Market Y-o-Y Growth Rate Comparison by End-User (2016-2032)
- Table 13: Global Organic Cosmetics Market Market Y-o-Y Growth Rate Comparison by Distribution Channel (2016-2032)
- Table 14: Global Organic Cosmetics Market Market Share Comparison by Region (2016-2032)
- Table 15: Global Organic Cosmetics Market Market Share Comparison by Product Type (2016-2032)
- Table 16: Global Organic Cosmetics Market Market Share Comparison by End-User (2016-2032)
- Table 17: Global Organic Cosmetics Market Market Share Comparison by Distribution Channel (2016-2032)
- Table 18: North America Organic Cosmetics Market Market Comparison by End-User (2016-2032)
- Table 19: North America Organic Cosmetics Market Market Comparison by Distribution Channel (2016-2032)
- Table 20: North America Organic Cosmetics Market Revenue (US$ Mn) Comparison by Country (2016-2032)
- Table 21: North America Organic Cosmetics Market Market Revenue (US$ Mn) (2016-2032)
- Table 22: North America Organic Cosmetics Market Market Revenue (US$ Mn) Comparison by Country (2016-2032)
- Table 23: North America Organic Cosmetics Market Market Revenue (US$ Mn) Comparison by Product Type (2016-2032)
- Table 24: North America Organic Cosmetics Market Market Revenue (US$ Mn) Comparison by End-User (2016-2032)
- Table 25: North America Organic Cosmetics Market Market Revenue (US$ Mn) Comparison by Distribution Channel (2016-2032)
- Table 26: North America Organic Cosmetics Market Market Y-o-Y Growth Rate Comparison by Country (2016-2032)
- Table 27: North America Organic Cosmetics Market Market Y-o-Y Growth Rate Comparison by Product Type (2016-2032)
- Table 28: North America Organic Cosmetics Market Market Y-o-Y Growth Rate Comparison by End-User (2016-2032)
- Table 29: North America Organic Cosmetics Market Market Y-o-Y Growth Rate Comparison by Distribution Channel (2016-2032)
- Table 30: North America Organic Cosmetics Market Market Share Comparison by Country (2016-2032)
- Table 31: North America Organic Cosmetics Market Market Share Comparison by Product Type (2016-2032)
- Table 32: North America Organic Cosmetics Market Market Share Comparison by End-User (2016-2032)
- Table 33: North America Organic Cosmetics Market Market Share Comparison by Distribution Channel (2016-2032)
- Table 34: Western Europe Organic Cosmetics Market Market Comparison by Product Type (2016-2032)
- Table 35: Western Europe Organic Cosmetics Market Market Comparison by End-User (2016-2032)
- Table 36: Western Europe Organic Cosmetics Market Market Comparison by Distribution Channel (2016-2032)
- Table 37: Western Europe Organic Cosmetics Market Revenue (US$ Mn) Comparison by Country (2016-2032)
- Table 38: Western Europe Organic Cosmetics Market Market Revenue (US$ Mn) (2016-2032)
- Table 39: Western Europe Organic Cosmetics Market Market Revenue (US$ Mn) Comparison by Country (2016-2032)
- Table 40: Western Europe Organic Cosmetics Market Market Revenue (US$ Mn) Comparison by Product Type (2016-2032)
- Table 41: Western Europe Organic Cosmetics Market Market Revenue (US$ Mn) Comparison by End-User (2016-2032)
- Table 42: Western Europe Organic Cosmetics Market Market Revenue (US$ Mn) Comparison by Distribution Channel (2016-2032)
- Table 43: Western Europe Organic Cosmetics Market Market Y-o-Y Growth Rate Comparison by Country (2016-2032)
- Table 44: Western Europe Organic Cosmetics Market Market Y-o-Y Growth Rate Comparison by Product Type (2016-2032)
- Table 45: Western Europe Organic Cosmetics Market Market Y-o-Y Growth Rate Comparison by End-User (2016-2032)
- Table 46: Western Europe Organic Cosmetics Market Market Y-o-Y Growth Rate Comparison by Distribution Channel (2016-2032)
- Table 47: Western Europe Organic Cosmetics Market Market Share Comparison by Country (2016-2032)
- Table 48: Western Europe Organic Cosmetics Market Market Share Comparison by Product Type (2016-2032)
- Table 49: Western Europe Organic Cosmetics Market Market Share Comparison by End-User (2016-2032)
- Table 50: Western Europe Organic Cosmetics Market Market Share Comparison by Distribution Channel (2016-2032)
- Table 51: Eastern Europe Organic Cosmetics Market Market Comparison by Product Type (2016-2032)
- Table 52: Eastern Europe Organic Cosmetics Market Market Comparison by End-User (2016-2032)
- Table 53: Eastern Europe Organic Cosmetics Market Market Comparison by Distribution Channel (2016-2032)
- Table 54: Eastern Europe Organic Cosmetics Market Revenue (US$ Mn) Comparison by Country (2016-2032)
- Table 55: Eastern Europe Organic Cosmetics Market Market Revenue (US$ Mn) (2016-2032)
- Table 56: Eastern Europe Organic Cosmetics Market Market Revenue (US$ Mn) Comparison by Country (2016-2032)
- Table 57: Eastern Europe Organic Cosmetics Market Market Revenue (US$ Mn) Comparison by Product Type (2016-2032)
- Table 58: Eastern Europe Organic Cosmetics Market Market Revenue (US$ Mn) Comparison by End-User (2016-2032)
- Table 59: Eastern Europe Organic Cosmetics Market Market Revenue (US$ Mn) Comparison by Distribution Channel (2016-2032)
- Table 60: Eastern Europe Organic Cosmetics Market Market Y-o-Y Growth Rate Comparison by Country (2016-2032)
- Table 61: Eastern Europe Organic Cosmetics Market Market Y-o-Y Growth Rate Comparison by Product Type (2016-2032)
- Table 62: Eastern Europe Organic Cosmetics Market Market Y-o-Y Growth Rate Comparison by End-User (2016-2032)
- Table 63: Eastern Europe Organic Cosmetics Market Market Y-o-Y Growth Rate Comparison by Distribution Channel (2016-2032)
- Table 64: Eastern Europe Organic Cosmetics Market Market Share Comparison by Country (2016-2032)
- Table 65: Eastern Europe Organic Cosmetics Market Market Share Comparison by Product Type (2016-2032)
- Table 66: Eastern Europe Organic Cosmetics Market Market Share Comparison by End-User (2016-2032)
- Table 67: Eastern Europe Organic Cosmetics Market Market Share Comparison by Distribution Channel (2016-2032)
- Table 68: APAC Organic Cosmetics Market Market Comparison by Product Type (2016-2032)
- Table 69: APAC Organic Cosmetics Market Market Comparison by End-User (2016-2032)
- Table 70: APAC Organic Cosmetics Market Market Comparison by Distribution Channel (2016-2032)
- Table 71: APAC Organic Cosmetics Market Revenue (US$ Mn) Comparison by Country (2016-2032)
- Table 72: APAC Organic Cosmetics Market Market Revenue (US$ Mn) (2016-2032)
- Table 73: APAC Organic Cosmetics Market Market Revenue (US$ Mn) Comparison by Country (2016-2032)
- Table 74: APAC Organic Cosmetics Market Market Revenue (US$ Mn) Comparison by Product Type (2016-2032)
- Table 75: APAC Organic Cosmetics Market Market Revenue (US$ Mn) Comparison by End-User (2016-2032)
- Table 76: APAC Organic Cosmetics Market Market Revenue (US$ Mn) Comparison by Distribution Channel (2016-2032)
- Table 77: APAC Organic Cosmetics Market Market Y-o-Y Growth Rate Comparison by Country (2016-2032)
- Table 78: APAC Organic Cosmetics Market Market Y-o-Y Growth Rate Comparison by Product Type (2016-2032)
- Table 79: APAC Organic Cosmetics Market Market Y-o-Y Growth Rate Comparison by End-User (2016-2032)
- Table 80: APAC Organic Cosmetics Market Market Y-o-Y Growth Rate Comparison by Distribution Channel (2016-2032)
- Table 81: APAC Organic Cosmetics Market Market Share Comparison by Country (2016-2032)
- Table 82: APAC Organic Cosmetics Market Market Share Comparison by Product Type (2016-2032)
- Table 83: APAC Organic Cosmetics Market Market Share Comparison by End-User (2016-2032)
- Table 84: APAC Organic Cosmetics Market Market Share Comparison by Distribution Channel (2016-2032)
- Table 85: Latin America Organic Cosmetics Market Market Comparison by Product Type (2016-2032)
- Table 86: Latin America Organic Cosmetics Market Market Comparison by End-User (2016-2032)
- Table 87: Latin America Organic Cosmetics Market Market Comparison by Distribution Channel (2016-2032)
- Table 88: Latin America Organic Cosmetics Market Revenue (US$ Mn) Comparison by Country (2016-2032)
- Table 89: Latin America Organic Cosmetics Market Market Revenue (US$ Mn) (2016-2032)
- Table 90: Latin America Organic Cosmetics Market Market Revenue (US$ Mn) Comparison by Country (2016-2032)
- Table 91: Latin America Organic Cosmetics Market Market Revenue (US$ Mn) Comparison by Product Type (2016-2032)
- Table 92: Latin America Organic Cosmetics Market Market Revenue (US$ Mn) Comparison by End-User (2016-2032)
- Table 93: Latin America Organic Cosmetics Market Market Revenue (US$ Mn) Comparison by Distribution Channel (2016-2032)
- Table 94: Latin America Organic Cosmetics Market Market Y-o-Y Growth Rate Comparison by Country (2016-2032)
- Table 95: Latin America Organic Cosmetics Market Market Y-o-Y Growth Rate Comparison by Product Type (2016-2032)
- Table 96: Latin America Organic Cosmetics Market Market Y-o-Y Growth Rate Comparison by End-User (2016-2032)
- Table 97: Latin America Organic Cosmetics Market Market Y-o-Y Growth Rate Comparison by Distribution Channel (2016-2032)
- Table 98: Latin America Organic Cosmetics Market Market Share Comparison by Country (2016-2032)
- Table 99: Latin America Organic Cosmetics Market Market Share Comparison by Product Type (2016-2032)
- Table 100: Latin America Organic Cosmetics Market Market Share Comparison by End-User (2016-2032)
- Table 101: Latin America Organic Cosmetics Market Market Share Comparison by Distribution Channel (2016-2032)
- Table 102: Middle East & Africa Organic Cosmetics Market Market Comparison by Product Type (2016-2032)
- Table 103: Middle East & Africa Organic Cosmetics Market Market Comparison by End-User (2016-2032)
- Table 104: Middle East & Africa Organic Cosmetics Market Market Comparison by Distribution Channel (2016-2032)
- Table 105: Middle East & Africa Organic Cosmetics Market Revenue (US$ Mn) Comparison by Country (2016-2032)
- Table 106: Middle East & Africa Organic Cosmetics Market Market Revenue (US$ Mn) (2016-2032)
- Table 107: Middle East & Africa Organic Cosmetics Market Market Revenue (US$ Mn) Comparison by Country (2016-2032)
- Table 108: Middle East & Africa Organic Cosmetics Market Market Revenue (US$ Mn) Comparison by Product Type (2016-2032)
- Table 109: Middle East & Africa Organic Cosmetics Market Market Revenue (US$ Mn) Comparison by End-User (2016-2032)
- Table 110: Middle East & Africa Organic Cosmetics Market Market Revenue (US$ Mn) Comparison by Distribution Channel (2016-2032)
- Table 111: Middle East & Africa Organic Cosmetics Market Market Y-o-Y Growth Rate Comparison by Country (2016-2032)
- Table 112: Middle East & Africa Organic Cosmetics Market Market Y-o-Y Growth Rate Comparison by Product Type (2016-2032)
- Table 113: Middle East & Africa Organic Cosmetics Market Market Y-o-Y Growth Rate Comparison by End-User (2016-2032)
- Table 114: Middle East & Africa Organic Cosmetics Market Market Y-o-Y Growth Rate Comparison by Distribution Channel (2016-2032)
- Table 115: Middle East & Africa Organic Cosmetics Market Market Share Comparison by Country (2016-2032)
- Table 116: Middle East & Africa Organic Cosmetics Market Market Share Comparison by Product Type (2016-2032)
- Table 117: Middle East & Africa Organic Cosmetics Market Market Share Comparison by End-User (2016-2032)
- Table 118: Middle East & Africa Organic Cosmetics Market Market Share Comparison by Distribution Channel (2016-2032)
- 1. Executive Summary
-
- ALDI North Group
- Alnatura Produktions- und Handels GmbH
- AVON Beauty Products India Pvt Ltd
- Benefit Cosmetics LLC
- Burt's Bees.
- Chanel
- Coty Inc.
- Dabur
- The Estée Lauder Companies Inc.
- Hain Celestial
- Johnson & Johnson Services, Inc.
- Lush Retail Ltd.
- L'ORÉAL
- MAESA
- Nails Inc. limited.
- Physicians Formula.
- Procter & Gamble.
- REWE FAR EAST LIMITED
- REVLON
- Unilever
Our Clients


View Our Licence Options
