
Oncology Drugs Market By Drug Class Analysis (Chemotherapy, Targeted Therapy, Other), By Indication Analysis (Lung Cancer, Breast Cancer, Others), By Distribution Channel Analysis (Hospitals Pharmacies, Retail Pharmacies, Other), By Region And Companies - Industry Segment Outlook, Market Assessment, Competition Scenario, Trends, And Forecast 2024-2033
-
9606
-
May 2023
-
160
-


-
This report was compiled by Trishita Deb Trishita Deb is an experienced market research and consulting professional with over 7 years of expertise across healthcare, consumer goods, and materials, contributing to over 400 healthcare-related reports. Correspondence Team Lead- Healthcare Linkedin | Detailed Market research Methodology Our methodology involves a mix of primary research, including interviews with leading mental health experts, and secondary research from reputable medical journals and databases. View Detailed Methodology Page
-
Quick Navigation
Report Overview
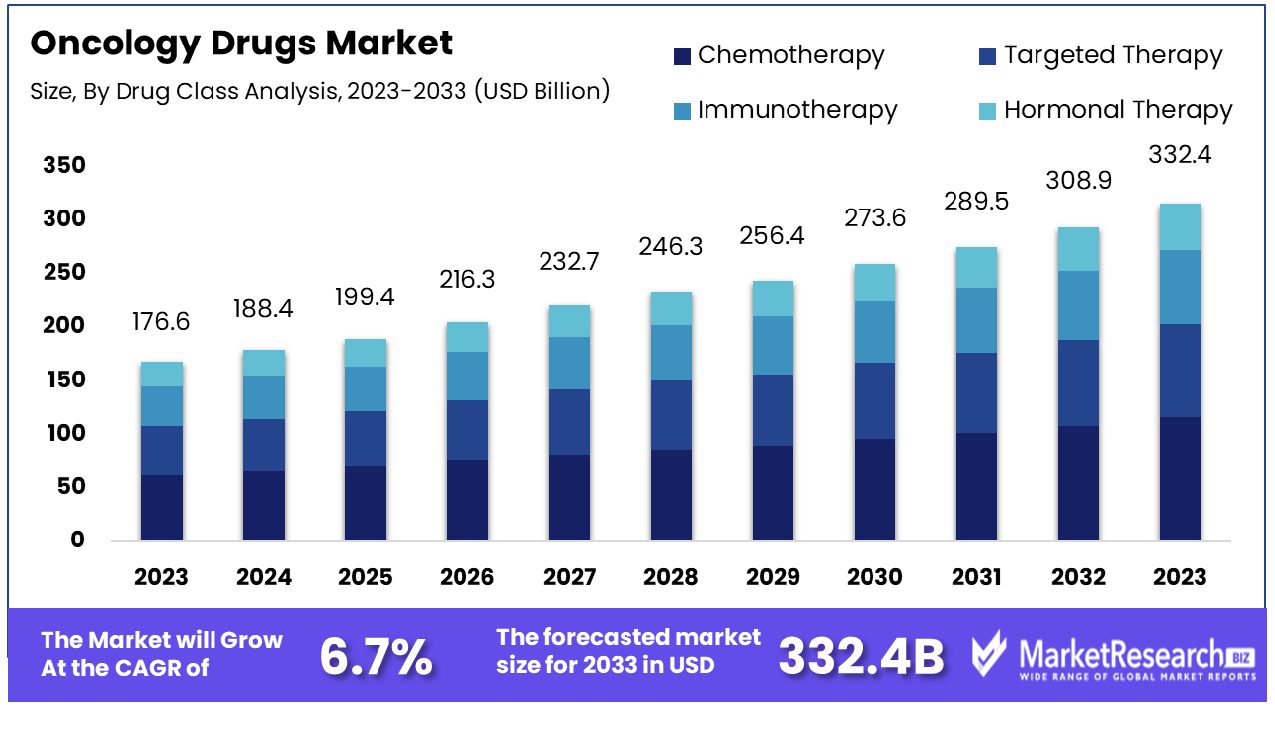
The Oncology Drugs Market size is expected to be worth around USD 332.4 Bn by 2033 from USD 176.6 Bn in 2023, growing at a CAGR of 6.7% during the forecast period from 2024 to 2033.
The surge in demand for new drug developments and the rise in different types of cancer are some of the main driving factors for the oncology drug market. Oncology is the branch of medicine that deals with the treatment and diagnosis of cancer.
Cancer is caused by the unrestrained expansion, growth, and reproduction of a cell that is started by a group of mutations in a normal cell. There are symbols of cancer that distinguish it from benign situations. Moreover, in addition to unrestrained expansion and growth, cancer cells work to develop new blood vessels to distribute their growth and resist death.
According to a report published by the American Cancer Society in January 2023, there have been more than 1,958,310 new cancer cases reported, and among those, 609,820 deaths have been registered in the US. Moreover, according to a PubMed Central report in March 2023, there were approx. 14,61,427 cancer cases reported in India for the year 2022. In India, 1 out of 9 individuals is likely to get affected by cancer in their lifetime. Lung and breast cancers are the main sites of cancer in males and females, respectively.
According to the National Centre for Chronic Disease Prevention and Health Promotion (NCCDPHP), more than 1.7 million individuals are affected by cancer, and among that, 600,000 die due to cancer. Not only that, people spend $185 billion on cancer healthcare.
Oncology drugs are used for the treatment of cancer. It comprises a wide range of applications like chemotherapy agents, immunotherapies, targeted therapy, and hormone therapy. It has several types of benefits, such as decreasing the spread of cancer to other parts of the body, preventing the growth of cancer, reducing the size of tumors if they are pushing a lot of pressure on the spine, eliminating cancer cells that remain after the surgery, and also enhancing the results from other treatments that ultimately cure the cancer. The demand for oncology drugs will increase due to their requirement in medical and therapeutic treatment for cancer, which will help in market expansion in the coming years.
Driving factors
Rising Demand for Cancer
The oncology drugs market has been on the rise due to a number of factors that have had a favorable impact on the industry. The increasing incidence of cancer worldwide is one of the factors propelling this market. As the number of cancer cases continues to rise, the demand for effective treatments to combat this disease increases. The expansion of cancer research and development activities has also had a positive effect on this market.
Population Aging Boosts Market
The geriatric population is a significant factor that has contributed to the growth of the oncology drugs market. As the population continues to age, the incidence of cancer increases, leading to a greater demand for cancer treatments. In addition to technological advances in drug development, this market has been significantly propelled by these developments. With innovations such as gene therapy and precision medicine, improved and more targeted cancer treatments can be developed.
Technological Advances Fuel Economic Expansion.
In addition, there has been a rise in cancer awareness campaigns, leading to an increase in individuals seeking treatment earlier, thereby increasing the demand for oncology drugs. In addition, personalized medicine and targeted therapies for cancer treatment have acquired popularity, leading to an increase in demand. Government initiatives to expand access to cancer treatments and rising healthcare costs have also contributed to the expansion of the oncology drugs market.
Awareness Drives Drug Demand
Currently, certain regulations may have an effect on the oncology drugs market, such as the increasing need for regulatory authorities' approval of new drugs, which can result in a lengthened development period. Emerging technologies such as artificial intelligence, machine learning, and robotics have the potential to introduce novel solutions to the market for oncology drugs.
Authorities and Disruptors
The increasing competition in the market for oncology drugs and the emergence of new entrants are potential market disruptors. Changes in consumer behavior, such as an increasing preference for alternative treatments, could also have an effect on drug demand.
Restraining Factors
The Barrier of Cost-Expensive Cancer Treatments
The high cost of cancer treatments is one of the most significant challenges facing the oncology drugs market. The development and testing of oncology drugs are costly and time-consuming, which frequently results in high drug prices. However, the high cost of cancer drugs makes them prohibitive for many individuals, particularly in low-income nations with limited health insurance coverage.
Regulatory Obstacles for Oncology's Rigorous Approval
Approval of drugs is essential to the pharmaceutical industry, and regulatory bodies have established stringent guidelines for drug manufacturers to ensure the safety and efficacy of drugs. However, oncology drugs have more stringent regulatory requirements than other drug classes. Extensive clinical trials are required to demonstrate the drug's efficacy and safety, a procedure that can take several years and cost billions of dollars.
Individualized Treatment Tailoring Cancer Care
Various adverse effects caused by cancer treatments can negatively impact the patient's quality of life. For example, chemotherapy frequently results in hair loss, vertigo, and vomiting, whereas radiation therapy can result in fatigue, skin irritation, and tissue damage. Furthermore, adverse effects frequently differ from patient to patient, making it challenging to predict and manage them. Consequently, cancer patients require individualized treatment that addresses their specific requirements and side effects.
Regional Disparity Inadequate Cancer Care
The availability of effective cancer treatments varies considerably across regions, with underdeveloped regions frequently falling significantly behind. In such regions, the infrastructure for cancer treatment is insufficient, and oncology drugs may be scarce, resulting in delayed cancer diagnosis and treatment as well as a higher cancer mortality rate. In addition, the lack of cancer education and awareness in these regions leads to late cancer diagnosis, when the disease has already advanced, making it more difficult to treat.
Clinical Trial Problematizes Dangerous Cancer Research
The development of oncology drugs is a high-risk, high-reward endeavor; however, the high failure rates in clinical trials present substantial obstacles for drug manufacturers. Clinical trials are the backbone of drug development and provide valuable information about a drug's safety and efficacy. However, the inherent complexity of cancer and the diversity of patient populations make it challenging to develop cancer treatments that are effective for all patients.
Drug Class Analysis
The chemotherapy segment has dominated the oncology drugs market and driven its expansion. Chemotherapy drugs kill or slow cancer cells. Combining chemotherapy drugs boosts their efficacy.
Due to economic growth, emerging economies are adopting chemotherapy drugs. Increased disposable money, healthcare infrastructure, and an aging population drive this expansion. Due to rising cancer rates in emerging economies, the oncology drugs market has grown.
Oncologists and primary care providers have shaped consumer behavior toward chemotherapy drugs. These doctors recommend chemotherapy drugs for cancer treatment because of their efficacy. The global cancer epidemic has also increased the demand for chemotherapy drugs.
Due to increased cancer rates, chemotherapy drug use, and an aging population, the chemotherapy segment of the oncology drugs market is expected to rise quickest. The aging population has increased the prevalence of chronic diseases, including cancer, increasing the demand for chemotherapy drugs.
Indication Analysis
Due to its high prevalence worldwide, the oncology drugs market has dominated the lung cancer drugs segment. Lung cancer can cause coughing, chest pain, and breathlessness. Lung cancer is the most frequent cancer in the world, hence oncology drug development is focused on it.
Due to rising disposable budgets, older populations, and improved healthcare infrastructure, emerging economies have started adopting lung cancer drugs like chemotherapy. The demand for lung cancer drugs has increased due to the high prevalence of lung cancer in emerging economies.
Healthcare experts and increased lung cancer knowledge have shaped consumer attitudes toward lung cancer drugs. Tobacco use, a major risk factor for lung cancer, has been the subject of public health efforts to raise public awareness.
Due to rising lung cancer rates, rising lung cancer drug usage, and aging populations, the lung cancer segment of the oncology drugs market is expected to grow the quickest. The aging population has increased the prevalence of chronic diseases, including lung cancer, driving up demand for lung cancer drugs.
Distribution Channel Analysis
Due to developing hospital chains, healthcare infrastructure investments, and demand for oncology drugs, the hospital pharmacies segment leads the oncology drug market.Due to growing healthcare infrastructure and investments, emerging economies are adopting hospital pharmacies. Hospital pharmacy sales have increased due to the growing market of hospital networks.
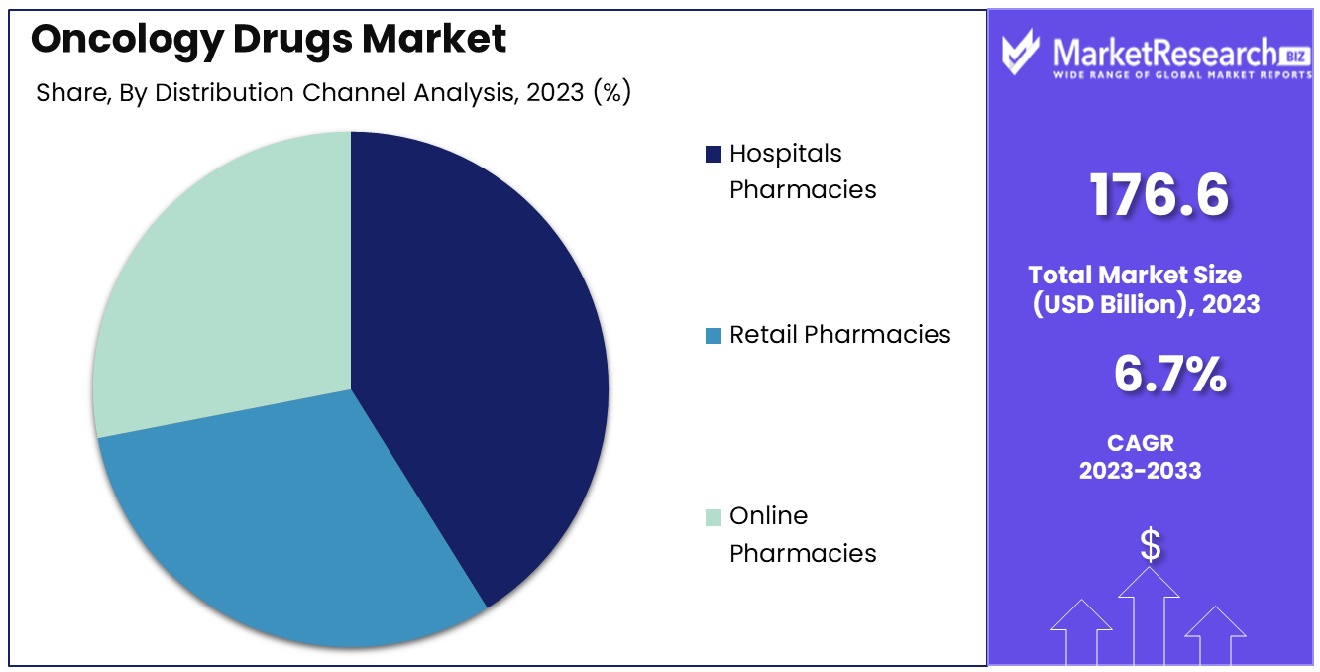
The growing number of hospital chains, greater access to medicine, and cost-effectiveness have altered consumer attitudes regarding hospital pharmacies. Due to increased healthcare infrastructure, demand for medical facilities, and cancer rates in emerging nations, the hospital pharmacies segment of the oncology drugs market is expected to grow the fastest.
Key Market Segments
By Drug Class Analysis
- Chemotherapy
- Targeted Therapy
- Immunotherapy
- Hormonal Therapy
By Indication Analysis
- Lung Cancer
- Breast Cancer
- Colorectal Cancer
- Prostate Cancer
- Blood Cancer
- Bladder Cancer
- Others
By Distribution Channel Analysis
- Hospitals Pharmacies
- Retail Pharmacies
- Online Pharmacies
Growth Opportunity
Biosimilar Demand Fuels Oncology Drugs Market
Opportunity drives oncology medication growth demand for cancer biosimilars is rising. Combination therapies for treating cancer are becoming increasingly prevalent. Precision medicine is being used more frequently in cancer treatment, early cancer detection is being prioritized, and Emerging markets give oncology medication producers enormous growth potential.
Combinations Transform Cancer Treatment
This growth is driven by increasing demand for biosimilars in cancer treatment, combination therapies' popularity, precision medicine's adoption, early cancer detection, and growth opportunities in emerging markets.
Precision Cancer Treatment
Biosimilars are substantially similar to regulatory-approved biological goods. Because they're cheaper than branded drugs, they're increasing in popularity in cancer treatment.
Cancer Screening Saves Lives
Combination therapies are a new cancer therapy approach that combines two or more medications to optimize efficacy and negative effects. Combination therapies are popular because they are effective and safe. Chemotherapy, immunotherapy, and targeted therapy are frequent combinations.
Emerging Markets Fuel Oncology Drug Growth
Precision medicine is an innovative approach to cancer treatment that incorporates genetic information. Precision medicine drug approvals are growing rapidly.
Biosimilars Change Cancer Treatment
Early cancer identification improves survival and reduces disease burden. Oncology drugmakers are developing early cancer detection methods including liquid biopsy, which uses blood tests.
Precision Cancer Treatment
Due to aging populations and increased risk factors like tobacco use and toxin exposure, China, India, and Brazil are seeing a rise in cancer incidence and mortality. These nations are boosting cancer treatment infrastructure and technologies to combat this rise.
Latest Trends
Shifting Oncology Drug Paradigms
The field of oncology drugs is enduring a paradigm shift, which is largely influenced by five significant market trends. Increasing use of biomarkers in cancer treatment, growing adoption of gene therapies for cancer treatment, rise in collaborations and partnerships among key market players, shift toward value-based pricing models for oncology drugs, and growing emphasis on developing cancer treatments with fewer side effects are all factors that are shaping the oncology drugs market.
Biomarkers Transform Cancer Therapy
In recent years, the use of biomarkers in cancer treatment has acquired momentum. These biomarkers are molecules found in the blood, urine, or tissues that can be used to detect the presence of cancer, predict the response to treatment, and track the progression of the disease. Biomarkers have revolutionized cancer treatment by allowing doctors to tailor treatment plans to the unique requirements of each patient.
Gene Therapies Revolutionize Oncology
Gene therapies are quickly becoming a new frontier in the treatment of cancer. By modifying the genetic makeup of cancer cells, gene therapies can induce cell death or reprogram malignant cells to be less aggressive. The introduction of CRISPR-Cas9 technology, which permits precise gene editing, has substantially accelerated the development of gene therapies for the treatment of cancer.
Collaborations Drive Oncology Innovation
The increasing complexity of cancer treatment and the need for innovation is driving a rise in collaborations and partnerships between major participants in the oncology drugs market. These collaborations facilitate the pooling of resources, expertise, and technologies, resulting in accelerated drug development, decreased R&D costs, and enhanced patient outcomes.
Pricing Based on Value in Oncology
The market for oncology drugs is shifting toward value-based pricing models, which link the price of drugs to their clinical utility and patient benefits. Payers, such as insurance companies and governments, are increasingly adopting this strategy to ensure that patients receive the most effective treatments at a reasonable cost.
Regional Analysis
The North American market for oncology drugs is the largest, with the United States being the largest contributor to the region's growth of 36%. This statement says a great deal about the prevalence of cancer in our society and the demand for effective drug remedies on the North American market.
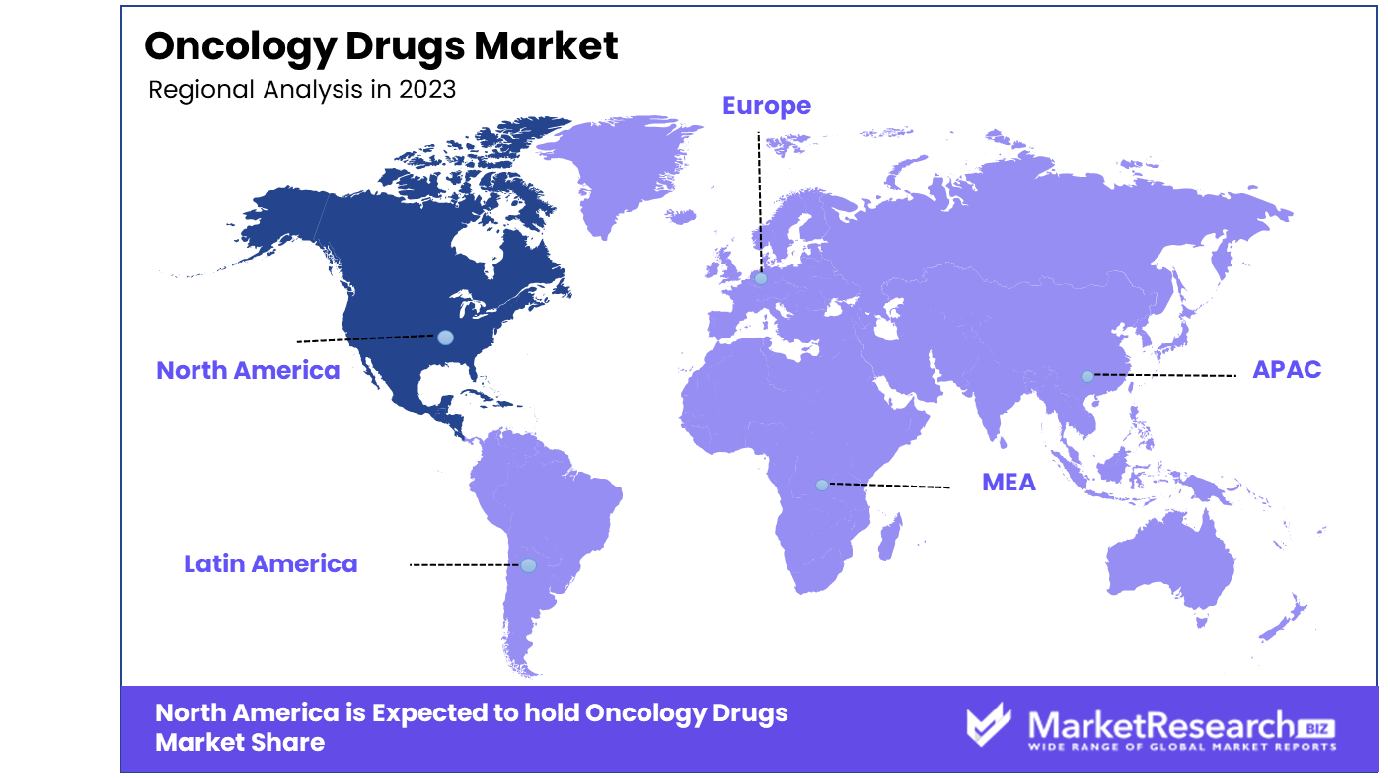
Cancer is one of the primary causes of death globally, and it remains a significant public health concern for both individuals and healthcare professionals. According to the World Health Organization (WHO), approximately one in six fatalities worldwide are caused by cancer. Cancer can affect anyone, but it is more prevalent among senior people, and the risk of developing cancer increases with age.
In North America, the demand for oncology drugs is not restricted to the United States alone. Canada contributes significantly to the North American oncology drug market. According to the Canadian Cancer Society, approximately one in two Canadians will develop cancer during their lifetime. This high incidence of cancer places a substantial strain on the Canadian healthcare system and highlights the need for effective treatments.
Several factors contribute to the growth of the North American oncology drug market. First and foremost, the creation of new and innovative drugs has been a significant growth driver. Medical research advancements have led to the discovery of new treatments that are more effective at targeting cancer cells and minimizing collateral damage to healthy cells. In addition, an aging population and rising healthcare costs are factors fueling the demand for oncology drugs.
Key Regions and Countries
North America
- The US
- Canada
- Rest of North America
Europe
- Germany
- France
- The UK
- Spain
- Italy
- Russia
- Netherlands
- Rest of Europe
Asia-Pacific
- China
- Japan
- South Korea
- India
- New Zealand
- Singapore
- Thailand
- Vietnam
- Rest of Asia Pacific
Latin America
- Brazil
- Mexico
- Rest of Latin America
Middle East & Africa
- South Africa
- Saudi Arabia
- UAE
- Rest of Middle East & Africa
Key Players Analysis
The global oncology drugs market is presently one of the pharmaceutical industry's fastest-growing markets. Roche, Novartis, Pfizer, AstraZeneca, and Merck & Co. are the leading competitors in this market.
Roche is the market leader in oncology drugs and is recognized for its innovative cancer treatments. Avastin, Herceptin, and Rituxan are its flagship drugs. In addition, Roche has recently introduced Tecentriq, a promising drug for treating advanced bladder cancer.
Novartis is another significant player in the market for oncology drugs, with a portfolio of cancer treatments including Gleevec and Tasigna, which are used to treat leukemia.
With drugs like Ibrance, Sutent, and Xalkori, which are used to treat breast cancer, renal cell carcinoma, and non-small cell lung cancer, respectively, Pfizer has a strong presence in the oncology cancer treatment market.
AstraZeneca's portfolio of oncology drugs includes Tagrisso, Lynparza, and Imfinzi, which are utilized for the treatment of lung cancer, ovarian cancer, and bladder cancer, respectively.
Merck & Co. is renowned for its innovative immunotherapy medication Keytruda, which has demonstrated efficacy in treating a variety of cancers, including lung cancer, melanoma, and bladder cancer.
These key players are investing significantly in R&D to create new and innovative oncology drugs. As demand for effective cancer treatments rises, the global market for oncology drugs is anticipated to continue expanding.
Top Key Players in Oncology Drugs Market
- Hoffmann-La Roche Ltd.
- Novartis International AG
- AstraZeneca
- Merck & Co
- Celgene Corporation
- Johnson & Johnson
- Bristol-Myers Squibb Company
- Pfizer Inc.
- Merck & Co., Inc.
- Eli Lilly and Company
- AbbVie Inc.
- Bayer AG
Recent Development
- In 2023, Liquid biopsies have acquired popularity as a noninvasive method of detecting and monitoring cancer.
- In 2022, Human Epidermal Growth Factor Receptor 2 (HER2) is an overexpressed protein in breast and gastric cancer 2022.
- In 2021, Idecabtagene violence (Abecma) for relapsed or refractory multiple myeloma and lisocabtagene maraleucel (Breyanzi) for large B-cell lymphoma were two of the multiple CAR-T therapies approved by the FDA in 2021.
- In 2020, several targeted therapies for non-small cell lung cancer (NSCLC), the most prevalent form of lung cancer, were approved.
- In 2019, Pembrolizumab (Keytruda) was approved by the U.S. Food and Drug Administration (FDA) in 2019 as the first immunotherapy treatment for solid tumors with specific genetic features, regardless of the form of cancer.
Report Scope
Report Features Description Market Value (2023) USD 176.6 Bn Forecast Revenue (2033) USD 332.4 Bn CAGR (2024-2032) 6.7% Base Year for Estimation 2023 Historic Period 2016-2023 Forecast Period 2024-2033 Report Coverage Revenue Forecast, Market Dynamics, COVID-19 Impact, Competitive Landscape, Recent Developments Segments Covered By Drug Class Analysis (Chemotherapy, Targeted Therapy, Immunotherapy , Hormonal Therapy), By Indication Analysis (Lung Cancer, Breast Cancer, Colorectal Cancer, Prostate Cancer, Blood Cancer, Bladder Cancer, Others), By Distribution Channel Analysis (Hospitals Pharmacies, Retail Pharmacies, Online Pharmacies) Regional Analysis North America – The US, Canada, & Mexico; Western Europe – Germany, France, The UK, Spain, Italy, Portugal, Ireland, Austria, Switzerland, Benelux, Nordic, & Rest of Western Europe; Eastern Europe – Russia, Poland, The Czech Republic, Greece, & Rest of Eastern Europe; APAC – China, Japan, South Korea, India, Australia & New Zealand, Indonesia, Malaysia, Philippines, Singapore, Thailand, Vietnam, & Rest of APAC; Latin America – Brazil, Colombia, Chile, Argentina, Costa Rica, & Rest of Latin America; Middle East & Africa – Algeria, Egypt, Israel, Kuwait, Nigeria, Saudi Arabia, South Africa, Turkey, United Arab Emirates, & Rest of MEA Competitive Landscape Hoffmann-La Roche Ltd., Novartis International AG, AstraZeneca, Merck & Co, Celgene Corporation, Johnson & Johnson, Bristol-Myers Squibb Company, Pfizer Inc., Merck & Co., Inc., Eli Lilly and Company, AbbVie Inc., Bayer AG Customization Scope Customization for segments, region/country-level will be provided. Moreover, additional customization can be done based on the requirements. Purchase Options We have three licenses to opt for: Single User License, Multi-User License (Up to 5 Users), Corporate Use License (Unlimited User and Printable PDF) -
- 1. Executive Summary
- 1.1. Definition
- 1.2. Taxonomy
- 1.3. Research Scope
- 1.4. Key Analysis
- 1.5. Key Findings by Major Segments
- 1.6. Top strategies by Major Players
- 2. Global Oncology Drugs Market Overview
- 2.1. Oncology Drugs Market Dynamics
- 2.1.1. Drivers
- 2.1.2. Opportunities
- 2.1.3. Restraints
- 2.1.4. Challenges
- 2.2. Macro-economic Factors
- 2.3. Regulatory Framework
- 2.4. Market Investment Feasibility Index
- 2.5. PEST Analysis
- 2.6. PORTER’S Five Force Analysis
- 2.7. Drivers & Restraints Impact Analysis
- 2.8. Industry Chain Analysis
- 2.9. Cost Structure Analysis
- 2.10. Marketing Strategy
- 2.11. Russia-Ukraine War Impact Analysis
- 2.12. Opportunity Map Analysis
- 2.13. Market Competition Scenario Analysis
- 2.14. Product Life Cycle Analysis
- 2.15. Opportunity Orbits
- 2.16. Manufacturer Intensity Map
- 2.17. Major Companies sales by Value & Volume
- 2.1. Oncology Drugs Market Dynamics
- 3. Global Oncology Drugs Market Analysis, Opportunity and Forecast, 2016-2032
- 3.1. Global Oncology Drugs Market Analysis, 2016-2021
- 3.2. Global Oncology Drugs Market Opportunity and Forecast, 2023-2032
- 3.3. Global Oncology Drugs Market Analysis, Opportunity and Forecast, By By Drug Class Analysis, 2016-2032
- 3.3.1. Global Oncology Drugs Market Analysis by By Drug Class Analysis: Introduction
- 3.3.2. Market Size Absolute $ Opportunity Analysis and Forecast, By By Drug Class Analysis, 2016-2032
- 3.3.3. Chemotherapy
- 3.3.4. Targeted Therapy
- 3.3.5. Immunotherapy
- 3.3.6. Hormonal Therapy
- 3.4. Global Oncology Drugs Market Analysis, Opportunity and Forecast, By By Indication Analysis, 2016-2032
- 3.4.1. Global Oncology Drugs Market Analysis by By Indication Analysis: Introduction
- 3.4.2. Market Size Absolute $ Opportunity Analysis and Forecast, By By Indication Analysis, 2016-2032
- 3.4.3. Lung Cancer
- 3.4.4. Breast Cancer
- 3.4.5. Colorectal Cancer
- 3.4.6. Prostate Cancer
- 3.4.7. Blood Cancer
- 3.4.8. Bladder Cancer
- 3.4.9. Others
- 3.5. Global Oncology Drugs Market Analysis, Opportunity and Forecast, By By Distribution Channel Analysis, 2016-2032
- 3.5.1. Global Oncology Drugs Market Analysis by By Distribution Channel Analysis: Introduction
- 3.5.2. Market Size Absolute $ Opportunity Analysis and Forecast, By By Distribution Channel Analysis, 2016-2032
- 3.5.3. Hospitals Pharmacies
- 3.5.4. Retail Pharmacies
- 3.5.5. Online Pharmacies
- 4. North America Oncology Drugs Market Analysis, Opportunity and Forecast, 2016-2032
- 4.1. North America Oncology Drugs Market Analysis, 2016-2021
- 4.2. North America Oncology Drugs Market Opportunity and Forecast, 2023-2032
- 4.3. North America Oncology Drugs Market Analysis, Opportunity and Forecast, By By Drug Class Analysis, 2016-2032
- 4.3.1. North America Oncology Drugs Market Analysis by By Drug Class Analysis: Introduction
- 4.3.2. Market Size Absolute $ Opportunity Analysis and Forecast, By By Drug Class Analysis, 2016-2032
- 4.3.3. Chemotherapy
- 4.3.4. Targeted Therapy
- 4.3.5. Immunotherapy
- 4.3.6. Hormonal Therapy
- 4.4. North America Oncology Drugs Market Analysis, Opportunity and Forecast, By By Indication Analysis, 2016-2032
- 4.4.1. North America Oncology Drugs Market Analysis by By Indication Analysis: Introduction
- 4.4.2. Market Size Absolute $ Opportunity Analysis and Forecast, By By Indication Analysis, 2016-2032
- 4.4.3. Lung Cancer
- 4.4.4. Breast Cancer
- 4.4.5. Colorectal Cancer
- 4.4.6. Prostate Cancer
- 4.4.7. Blood Cancer
- 4.4.8. Bladder Cancer
- 4.4.9. Others
- 4.5. North America Oncology Drugs Market Analysis, Opportunity and Forecast, By By Distribution Channel Analysis, 2016-2032
- 4.5.1. North America Oncology Drugs Market Analysis by By Distribution Channel Analysis: Introduction
- 4.5.2. Market Size Absolute $ Opportunity Analysis and Forecast, By By Distribution Channel Analysis, 2016-2032
- 4.5.3. Hospitals Pharmacies
- 4.5.4. Retail Pharmacies
- 4.5.5. Online Pharmacies
- 4.6. North America Oncology Drugs Market Analysis, Opportunity and Forecast, By Country , 2016-2032
- 4.6.1. North America Oncology Drugs Market Analysis by Country : Introduction
- 4.6.2. Market Size Absolute $ Opportunity Analysis and Forecast, Country , 2016-2032
- 4.6.2.1. The US
- 4.6.2.2. Canada
- 4.6.2.3. Mexico
- 5. Western Europe Oncology Drugs Market Analysis, Opportunity and Forecast, 2016-2032
- 5.1. Western Europe Oncology Drugs Market Analysis, 2016-2021
- 5.2. Western Europe Oncology Drugs Market Opportunity and Forecast, 2023-2032
- 5.3. Western Europe Oncology Drugs Market Analysis, Opportunity and Forecast, By By Drug Class Analysis, 2016-2032
- 5.3.1. Western Europe Oncology Drugs Market Analysis by By Drug Class Analysis: Introduction
- 5.3.2. Market Size Absolute $ Opportunity Analysis and Forecast, By By Drug Class Analysis, 2016-2032
- 5.3.3. Chemotherapy
- 5.3.4. Targeted Therapy
- 5.3.5. Immunotherapy
- 5.3.6. Hormonal Therapy
- 5.4. Western Europe Oncology Drugs Market Analysis, Opportunity and Forecast, By By Indication Analysis, 2016-2032
- 5.4.1. Western Europe Oncology Drugs Market Analysis by By Indication Analysis: Introduction
- 5.4.2. Market Size Absolute $ Opportunity Analysis and Forecast, By By Indication Analysis, 2016-2032
- 5.4.3. Lung Cancer
- 5.4.4. Breast Cancer
- 5.4.5. Colorectal Cancer
- 5.4.6. Prostate Cancer
- 5.4.7. Blood Cancer
- 5.4.8. Bladder Cancer
- 5.4.9. Others
- 5.5. Western Europe Oncology Drugs Market Analysis, Opportunity and Forecast, By By Distribution Channel Analysis, 2016-2032
- 5.5.1. Western Europe Oncology Drugs Market Analysis by By Distribution Channel Analysis: Introduction
- 5.5.2. Market Size Absolute $ Opportunity Analysis and Forecast, By By Distribution Channel Analysis, 2016-2032
- 5.5.3. Hospitals Pharmacies
- 5.5.4. Retail Pharmacies
- 5.5.5. Online Pharmacies
- 5.6. Western Europe Oncology Drugs Market Analysis, Opportunity and Forecast, By Country , 2016-2032
- 5.6.1. Western Europe Oncology Drugs Market Analysis by Country : Introduction
- 5.6.2. Market Size Absolute $ Opportunity Analysis and Forecast, Country , 2016-2032
- 5.6.2.1. Germany
- 5.6.2.2. France
- 5.6.2.3. The UK
- 5.6.2.4. Spain
- 5.6.2.5. Italy
- 5.6.2.6. Portugal
- 5.6.2.7. Ireland
- 5.6.2.8. Austria
- 5.6.2.9. Switzerland
- 5.6.2.10. Benelux
- 5.6.2.11. Nordic
- 5.6.2.12. Rest of Western Europe
- 6. Eastern Europe Oncology Drugs Market Analysis, Opportunity and Forecast, 2016-2032
- 6.1. Eastern Europe Oncology Drugs Market Analysis, 2016-2021
- 6.2. Eastern Europe Oncology Drugs Market Opportunity and Forecast, 2023-2032
- 6.3. Eastern Europe Oncology Drugs Market Analysis, Opportunity and Forecast, By By Drug Class Analysis, 2016-2032
- 6.3.1. Eastern Europe Oncology Drugs Market Analysis by By Drug Class Analysis: Introduction
- 6.3.2. Market Size Absolute $ Opportunity Analysis and Forecast, By By Drug Class Analysis, 2016-2032
- 6.3.3. Chemotherapy
- 6.3.4. Targeted Therapy
- 6.3.5. Immunotherapy
- 6.3.6. Hormonal Therapy
- 6.4. Eastern Europe Oncology Drugs Market Analysis, Opportunity and Forecast, By By Indication Analysis, 2016-2032
- 6.4.1. Eastern Europe Oncology Drugs Market Analysis by By Indication Analysis: Introduction
- 6.4.2. Market Size Absolute $ Opportunity Analysis and Forecast, By By Indication Analysis, 2016-2032
- 6.4.3. Lung Cancer
- 6.4.4. Breast Cancer
- 6.4.5. Colorectal Cancer
- 6.4.6. Prostate Cancer
- 6.4.7. Blood Cancer
- 6.4.8. Bladder Cancer
- 6.4.9. Others
- 6.5. Eastern Europe Oncology Drugs Market Analysis, Opportunity and Forecast, By By Distribution Channel Analysis, 2016-2032
- 6.5.1. Eastern Europe Oncology Drugs Market Analysis by By Distribution Channel Analysis: Introduction
- 6.5.2. Market Size Absolute $ Opportunity Analysis and Forecast, By By Distribution Channel Analysis, 2016-2032
- 6.5.3. Hospitals Pharmacies
- 6.5.4. Retail Pharmacies
- 6.5.5. Online Pharmacies
- 6.6. Eastern Europe Oncology Drugs Market Analysis, Opportunity and Forecast, By Country , 2016-2032
- 6.6.1. Eastern Europe Oncology Drugs Market Analysis by Country : Introduction
- 6.6.2. Market Size Absolute $ Opportunity Analysis and Forecast, Country , 2016-2032
- 6.6.2.1. Russia
- 6.6.2.2. Poland
- 6.6.2.3. The Czech Republic
- 6.6.2.4. Greece
- 6.6.2.5. Rest of Eastern Europe
- 7. APAC Oncology Drugs Market Analysis, Opportunity and Forecast, 2016-2032
- 7.1. APAC Oncology Drugs Market Analysis, 2016-2021
- 7.2. APAC Oncology Drugs Market Opportunity and Forecast, 2023-2032
- 7.3. APAC Oncology Drugs Market Analysis, Opportunity and Forecast, By By Drug Class Analysis, 2016-2032
- 7.3.1. APAC Oncology Drugs Market Analysis by By Drug Class Analysis: Introduction
- 7.3.2. Market Size Absolute $ Opportunity Analysis and Forecast, By By Drug Class Analysis, 2016-2032
- 7.3.3. Chemotherapy
- 7.3.4. Targeted Therapy
- 7.3.5. Immunotherapy
- 7.3.6. Hormonal Therapy
- 7.4. APAC Oncology Drugs Market Analysis, Opportunity and Forecast, By By Indication Analysis, 2016-2032
- 7.4.1. APAC Oncology Drugs Market Analysis by By Indication Analysis: Introduction
- 7.4.2. Market Size Absolute $ Opportunity Analysis and Forecast, By By Indication Analysis, 2016-2032
- 7.4.3. Lung Cancer
- 7.4.4. Breast Cancer
- 7.4.5. Colorectal Cancer
- 7.4.6. Prostate Cancer
- 7.4.7. Blood Cancer
- 7.4.8. Bladder Cancer
- 7.4.9. Others
- 7.5. APAC Oncology Drugs Market Analysis, Opportunity and Forecast, By By Distribution Channel Analysis, 2016-2032
- 7.5.1. APAC Oncology Drugs Market Analysis by By Distribution Channel Analysis: Introduction
- 7.5.2. Market Size Absolute $ Opportunity Analysis and Forecast, By By Distribution Channel Analysis, 2016-2032
- 7.5.3. Hospitals Pharmacies
- 7.5.4. Retail Pharmacies
- 7.5.5. Online Pharmacies
- 7.6. APAC Oncology Drugs Market Analysis, Opportunity and Forecast, By Country , 2016-2032
- 7.6.1. APAC Oncology Drugs Market Analysis by Country : Introduction
- 7.6.2. Market Size Absolute $ Opportunity Analysis and Forecast, Country , 2016-2032
- 7.6.2.1. China
- 7.6.2.2. Japan
- 7.6.2.3. South Korea
- 7.6.2.4. India
- 7.6.2.5. Australia & New Zeland
- 7.6.2.6. Indonesia
- 7.6.2.7. Malaysia
- 7.6.2.8. Philippines
- 7.6.2.9. Singapore
- 7.6.2.10. Thailand
- 7.6.2.11. Vietnam
- 7.6.2.12. Rest of APAC
- 8. Latin America Oncology Drugs Market Analysis, Opportunity and Forecast, 2016-2032
- 8.1. Latin America Oncology Drugs Market Analysis, 2016-2021
- 8.2. Latin America Oncology Drugs Market Opportunity and Forecast, 2023-2032
- 8.3. Latin America Oncology Drugs Market Analysis, Opportunity and Forecast, By By Drug Class Analysis, 2016-2032
- 8.3.1. Latin America Oncology Drugs Market Analysis by By Drug Class Analysis: Introduction
- 8.3.2. Market Size Absolute $ Opportunity Analysis and Forecast, By By Drug Class Analysis, 2016-2032
- 8.3.3. Chemotherapy
- 8.3.4. Targeted Therapy
- 8.3.5. Immunotherapy
- 8.3.6. Hormonal Therapy
- 8.4. Latin America Oncology Drugs Market Analysis, Opportunity and Forecast, By By Indication Analysis, 2016-2032
- 8.4.1. Latin America Oncology Drugs Market Analysis by By Indication Analysis: Introduction
- 8.4.2. Market Size Absolute $ Opportunity Analysis and Forecast, By By Indication Analysis, 2016-2032
- 8.4.3. Lung Cancer
- 8.4.4. Breast Cancer
- 8.4.5. Colorectal Cancer
- 8.4.6. Prostate Cancer
- 8.4.7. Blood Cancer
- 8.4.8. Bladder Cancer
- 8.4.9. Others
- 8.5. Latin America Oncology Drugs Market Analysis, Opportunity and Forecast, By By Distribution Channel Analysis, 2016-2032
- 8.5.1. Latin America Oncology Drugs Market Analysis by By Distribution Channel Analysis: Introduction
- 8.5.2. Market Size Absolute $ Opportunity Analysis and Forecast, By By Distribution Channel Analysis, 2016-2032
- 8.5.3. Hospitals Pharmacies
- 8.5.4. Retail Pharmacies
- 8.5.5. Online Pharmacies
- 8.6. Latin America Oncology Drugs Market Analysis, Opportunity and Forecast, By Country , 2016-2032
- 8.6.1. Latin America Oncology Drugs Market Analysis by Country : Introduction
- 8.6.2. Market Size Absolute $ Opportunity Analysis and Forecast, Country , 2016-2032
- 8.6.2.1. Brazil
- 8.6.2.2. Colombia
- 8.6.2.3. Chile
- 8.6.2.4. Argentina
- 8.6.2.5. Costa Rica
- 8.6.2.6. Rest of Latin America
- 9. Middle East & Africa Oncology Drugs Market Analysis, Opportunity and Forecast, 2016-2032
- 9.1. Middle East & Africa Oncology Drugs Market Analysis, 2016-2021
- 9.2. Middle East & Africa Oncology Drugs Market Opportunity and Forecast, 2023-2032
- 9.3. Middle East & Africa Oncology Drugs Market Analysis, Opportunity and Forecast, By By Drug Class Analysis, 2016-2032
- 9.3.1. Middle East & Africa Oncology Drugs Market Analysis by By Drug Class Analysis: Introduction
- 9.3.2. Market Size Absolute $ Opportunity Analysis and Forecast, By By Drug Class Analysis, 2016-2032
- 9.3.3. Chemotherapy
- 9.3.4. Targeted Therapy
- 9.3.5. Immunotherapy
- 9.3.6. Hormonal Therapy
- 9.4. Middle East & Africa Oncology Drugs Market Analysis, Opportunity and Forecast, By By Indication Analysis, 2016-2032
- 9.4.1. Middle East & Africa Oncology Drugs Market Analysis by By Indication Analysis: Introduction
- 9.4.2. Market Size Absolute $ Opportunity Analysis and Forecast, By By Indication Analysis, 2016-2032
- 9.4.3. Lung Cancer
- 9.4.4. Breast Cancer
- 9.4.5. Colorectal Cancer
- 9.4.6. Prostate Cancer
- 9.4.7. Blood Cancer
- 9.4.8. Bladder Cancer
- 9.4.9. Others
- 9.5. Middle East & Africa Oncology Drugs Market Analysis, Opportunity and Forecast, By By Distribution Channel Analysis, 2016-2032
- 9.5.1. Middle East & Africa Oncology Drugs Market Analysis by By Distribution Channel Analysis: Introduction
- 9.5.2. Market Size Absolute $ Opportunity Analysis and Forecast, By By Distribution Channel Analysis, 2016-2032
- 9.5.3. Hospitals Pharmacies
- 9.5.4. Retail Pharmacies
- 9.5.5. Online Pharmacies
- 9.6. Middle East & Africa Oncology Drugs Market Analysis, Opportunity and Forecast, By Country , 2016-2032
- 9.6.1. Middle East & Africa Oncology Drugs Market Analysis by Country : Introduction
- 9.6.2. Market Size Absolute $ Opportunity Analysis and Forecast, Country , 2016-2032
- 9.6.2.1. Algeria
- 9.6.2.2. Egypt
- 9.6.2.3. Israel
- 9.6.2.4. Kuwait
- 9.6.2.5. Nigeria
- 9.6.2.6. Saudi Arabia
- 9.6.2.7. South Africa
- 9.6.2.8. Turkey
- 9.6.2.9. The UAE
- 9.6.2.10. Rest of MEA
- 10. Global Oncology Drugs Market Analysis, Opportunity and Forecast, By Region , 2016-2032
- 10.1. Global Oncology Drugs Market Analysis by Region : Introduction
- 10.2. Market Size Absolute $ Opportunity Analysis and Forecast, By Region , 2016-2032
- 10.2.1. North America
- 10.2.2. Western Europe
- 10.2.3. Eastern Europe
- 10.2.4. APAC
- 10.2.5. Latin America
- 10.2.6. Middle East & Africa
- 11. Global Oncology Drugs Market Competitive Landscape, Market Share Analysis, and Company Profiles
- 11.1. Market Share Analysis
- 11.2. Company Profiles
- 11.3. Hoffmann-La Roche Ltd.
- 11.3.1. Company Overview
- 11.3.2. Financial Highlights
- 11.3.3. Product Portfolio
- 11.3.4. SWOT Analysis
- 11.3.5. Key Strategies and Developments
- 11.4. Novartis International AG
- 11.4.1. Company Overview
- 11.4.2. Financial Highlights
- 11.4.3. Product Portfolio
- 11.4.4. SWOT Analysis
- 11.4.5. Key Strategies and Developments
- 11.5. AstraZeneca
- 11.5.1. Company Overview
- 11.5.2. Financial Highlights
- 11.5.3. Product Portfolio
- 11.5.4. SWOT Analysis
- 11.5.5. Key Strategies and Developments
- 11.6. Merck & Co
- 11.6.1. Company Overview
- 11.6.2. Financial Highlights
- 11.6.3. Product Portfolio
- 11.6.4. SWOT Analysis
- 11.6.5. Key Strategies and Developments
- 11.7. Celgene Corporation
- 11.7.1. Company Overview
- 11.7.2. Financial Highlights
- 11.7.3. Product Portfolio
- 11.7.4. SWOT Analysis
- 11.7.5. Key Strategies and Developments
- 11.8. Johnson & Johnson
- 11.8.1. Company Overview
- 11.8.2. Financial Highlights
- 11.8.3. Product Portfolio
- 11.8.4. SWOT Analysis
- 11.8.5. Key Strategies and Developments
- 11.9. Bristol-Myers Squibb Company
- 11.9.1. Company Overview
- 11.9.2. Financial Highlights
- 11.9.3. Product Portfolio
- 11.9.4. SWOT Analysis
- 11.9.5. Key Strategies and Developments
- 11.10. Pfizer Inc.
- 11.10.1. Company Overview
- 11.10.2. Financial Highlights
- 11.10.3. Product Portfolio
- 11.10.4. SWOT Analysis
- 11.10.5. Key Strategies and Developments
- 11.11. Merck & Co., Inc.
- 11.11.1. Company Overview
- 11.11.2. Financial Highlights
- 11.11.3. Product Portfolio
- 11.11.4. SWOT Analysis
- 11.11.5. Key Strategies and Developments
- 11.12. Eli Lilly and Company
- 11.12.1. Company Overview
- 11.12.2. Financial Highlights
- 11.12.3. Product Portfolio
- 11.12.4. SWOT Analysis
- 11.12.5. Key Strategies and Developments
- 11.13.1. Company Overview
- 11.13.2. Financial Highlights
- 11.13.3. Product Portfolio
- 11.13.4. SWOT Analysis
- 11.13.5. Key Strategies and Developments
- 11.14. AbbVie Inc.
- 11.14.1. Company Overview
- 11.14.2. Financial Highlights
- 11.14.3. Product Portfolio
- 11.14.4. SWOT Analysis
- 11.14.5. Key Strategies and Developments
- 12. Assumptions and Acronyms
- 13. Research Methodology
- 14. Contact
"
- List of Figures
- "
- Figure 1: Global Oncology Drugs Market Revenue (US$ Mn) Market Share by By Drug Class Analysis in 2022
- Figure 2: Global Oncology Drugs Market Market Attractiveness Analysis by By Drug Class Analysis, 2016-2032
- Figure 3: Global Oncology Drugs Market Revenue (US$ Mn) Market Share by By Indication Analysisin 2022
- Figure 4: Global Oncology Drugs Market Market Attractiveness Analysis by By Indication Analysis, 2016-2032
- Figure 5: Global Oncology Drugs Market Revenue (US$ Mn) Market Share by By Distribution Channel Analysisin 2022
- Figure 6: Global Oncology Drugs Market Market Attractiveness Analysis by By Distribution Channel Analysis, 2016-2032
- Figure 7: Global Oncology Drugs Market Revenue (US$ Mn) Market Share by Region in 2022
- Figure 8: Global Oncology Drugs Market Market Attractiveness Analysis by Region, 2016-2032
- Figure 9: Global Oncology Drugs Market Market Revenue (US$ Mn) (2016-2032)
- Figure 10: Global Oncology Drugs Market Market Revenue (US$ Mn) Comparison by Region (2016-2032)
- Figure 11: Global Oncology Drugs Market Market Revenue (US$ Mn) Comparison by By Drug Class Analysis (2016-2032)
- Figure 12: Global Oncology Drugs Market Market Revenue (US$ Mn) Comparison by By Indication Analysis (2016-2032)
- Figure 13: Global Oncology Drugs Market Market Revenue (US$ Mn) Comparison by By Distribution Channel Analysis (2016-2032)
- Figure 14: Global Oncology Drugs Market Market Y-o-Y Growth Rate Comparison by Region (2016-2032)
- Figure 15: Global Oncology Drugs Market Market Y-o-Y Growth Rate Comparison by By Drug Class Analysis (2016-2032)
- Figure 16: Global Oncology Drugs Market Market Y-o-Y Growth Rate Comparison by By Indication Analysis (2016-2032)
- Figure 17: Global Oncology Drugs Market Market Y-o-Y Growth Rate Comparison by By Distribution Channel Analysis (2016-2032)
- Figure 18: Global Oncology Drugs Market Market Share Comparison by Region (2016-2032)
- Figure 19: Global Oncology Drugs Market Market Share Comparison by By Drug Class Analysis (2016-2032)
- Figure 20: Global Oncology Drugs Market Market Share Comparison by By Indication Analysis (2016-2032)
- Figure 21: Global Oncology Drugs Market Market Share Comparison by By Distribution Channel Analysis (2016-2032)
- Figure 22: North America Oncology Drugs Market Revenue (US$ Mn) Market Share by By Drug Class Analysisin 2022
- Figure 23: North America Oncology Drugs Market Market Attractiveness Analysis by By Drug Class Analysis, 2016-2032
- Figure 24: North America Oncology Drugs Market Revenue (US$ Mn) Market Share by By Indication Analysisin 2022
- Figure 25: North America Oncology Drugs Market Market Attractiveness Analysis by By Indication Analysis, 2016-2032
- Figure 26: North America Oncology Drugs Market Revenue (US$ Mn) Market Share by By Distribution Channel Analysisin 2022
- Figure 27: North America Oncology Drugs Market Market Attractiveness Analysis by By Distribution Channel Analysis, 2016-2032
- Figure 28: North America Oncology Drugs Market Revenue (US$ Mn) Market Share by Country in 2022
- Figure 29: North America Oncology Drugs Market Market Attractiveness Analysis by Country, 2016-2032
- Figure 30: North America Oncology Drugs Market Market Revenue (US$ Mn) (2016-2032)
- Figure 31: North America Oncology Drugs Market Market Revenue (US$ Mn) Comparison by Country (2016-2032)
- Figure 32: North America Oncology Drugs Market Market Revenue (US$ Mn) Comparison by By Drug Class Analysis (2016-2032)
- Figure 33: North America Oncology Drugs Market Market Revenue (US$ Mn) Comparison by By Indication Analysis (2016-2032)
- Figure 34: North America Oncology Drugs Market Market Revenue (US$ Mn) Comparison by By Distribution Channel Analysis (2016-2032)
- Figure 35: North America Oncology Drugs Market Market Y-o-Y Growth Rate Comparison by Country (2016-2032)
- Figure 36: North America Oncology Drugs Market Market Y-o-Y Growth Rate Comparison by By Drug Class Analysis (2016-2032)
- Figure 37: North America Oncology Drugs Market Market Y-o-Y Growth Rate Comparison by By Indication Analysis (2016-2032)
- Figure 38: North America Oncology Drugs Market Market Y-o-Y Growth Rate Comparison by By Distribution Channel Analysis (2016-2032)
- Figure 39: North America Oncology Drugs Market Market Share Comparison by Country (2016-2032)
- Figure 40: North America Oncology Drugs Market Market Share Comparison by By Drug Class Analysis (2016-2032)
- Figure 41: North America Oncology Drugs Market Market Share Comparison by By Indication Analysis (2016-2032)
- Figure 42: North America Oncology Drugs Market Market Share Comparison by By Distribution Channel Analysis (2016-2032)
- Figure 43: Western Europe Oncology Drugs Market Revenue (US$ Mn) Market Share by By Drug Class Analysisin 2022
- Figure 44: Western Europe Oncology Drugs Market Market Attractiveness Analysis by By Drug Class Analysis, 2016-2032
- Figure 45: Western Europe Oncology Drugs Market Revenue (US$ Mn) Market Share by By Indication Analysisin 2022
- Figure 46: Western Europe Oncology Drugs Market Market Attractiveness Analysis by By Indication Analysis, 2016-2032
- Figure 47: Western Europe Oncology Drugs Market Revenue (US$ Mn) Market Share by By Distribution Channel Analysisin 2022
- Figure 48: Western Europe Oncology Drugs Market Market Attractiveness Analysis by By Distribution Channel Analysis, 2016-2032
- Figure 49: Western Europe Oncology Drugs Market Revenue (US$ Mn) Market Share by Country in 2022
- Figure 50: Western Europe Oncology Drugs Market Market Attractiveness Analysis by Country, 2016-2032
- Figure 51: Western Europe Oncology Drugs Market Market Revenue (US$ Mn) (2016-2032)
- Figure 52: Western Europe Oncology Drugs Market Market Revenue (US$ Mn) Comparison by Country (2016-2032)
- Figure 53: Western Europe Oncology Drugs Market Market Revenue (US$ Mn) Comparison by By Drug Class Analysis (2016-2032)
- Figure 54: Western Europe Oncology Drugs Market Market Revenue (US$ Mn) Comparison by By Indication Analysis (2016-2032)
- Figure 55: Western Europe Oncology Drugs Market Market Revenue (US$ Mn) Comparison by By Distribution Channel Analysis (2016-2032)
- Figure 56: Western Europe Oncology Drugs Market Market Y-o-Y Growth Rate Comparison by Country (2016-2032)
- Figure 57: Western Europe Oncology Drugs Market Market Y-o-Y Growth Rate Comparison by By Drug Class Analysis (2016-2032)
- Figure 58: Western Europe Oncology Drugs Market Market Y-o-Y Growth Rate Comparison by By Indication Analysis (2016-2032)
- Figure 59: Western Europe Oncology Drugs Market Market Y-o-Y Growth Rate Comparison by By Distribution Channel Analysis (2016-2032)
- Figure 60: Western Europe Oncology Drugs Market Market Share Comparison by Country (2016-2032)
- Figure 61: Western Europe Oncology Drugs Market Market Share Comparison by By Drug Class Analysis (2016-2032)
- Figure 62: Western Europe Oncology Drugs Market Market Share Comparison by By Indication Analysis (2016-2032)
- Figure 63: Western Europe Oncology Drugs Market Market Share Comparison by By Distribution Channel Analysis (2016-2032)
- Figure 64: Eastern Europe Oncology Drugs Market Revenue (US$ Mn) Market Share by By Drug Class Analysisin 2022
- Figure 65: Eastern Europe Oncology Drugs Market Market Attractiveness Analysis by By Drug Class Analysis, 2016-2032
- Figure 66: Eastern Europe Oncology Drugs Market Revenue (US$ Mn) Market Share by By Indication Analysisin 2022
- Figure 67: Eastern Europe Oncology Drugs Market Market Attractiveness Analysis by By Indication Analysis, 2016-2032
- Figure 68: Eastern Europe Oncology Drugs Market Revenue (US$ Mn) Market Share by By Distribution Channel Analysisin 2022
- Figure 69: Eastern Europe Oncology Drugs Market Market Attractiveness Analysis by By Distribution Channel Analysis, 2016-2032
- Figure 70: Eastern Europe Oncology Drugs Market Revenue (US$ Mn) Market Share by Country in 2022
- Figure 71: Eastern Europe Oncology Drugs Market Market Attractiveness Analysis by Country, 2016-2032
- Figure 72: Eastern Europe Oncology Drugs Market Market Revenue (US$ Mn) (2016-2032)
- Figure 73: Eastern Europe Oncology Drugs Market Market Revenue (US$ Mn) Comparison by Country (2016-2032)
- Figure 74: Eastern Europe Oncology Drugs Market Market Revenue (US$ Mn) Comparison by By Drug Class Analysis (2016-2032)
- Figure 75: Eastern Europe Oncology Drugs Market Market Revenue (US$ Mn) Comparison by By Indication Analysis (2016-2032)
- Figure 76: Eastern Europe Oncology Drugs Market Market Revenue (US$ Mn) Comparison by By Distribution Channel Analysis (2016-2032)
- Figure 77: Eastern Europe Oncology Drugs Market Market Y-o-Y Growth Rate Comparison by Country (2016-2032)
- Figure 78: Eastern Europe Oncology Drugs Market Market Y-o-Y Growth Rate Comparison by By Drug Class Analysis (2016-2032)
- Figure 79: Eastern Europe Oncology Drugs Market Market Y-o-Y Growth Rate Comparison by By Indication Analysis (2016-2032)
- Figure 80: Eastern Europe Oncology Drugs Market Market Y-o-Y Growth Rate Comparison by By Distribution Channel Analysis (2016-2032)
- Figure 81: Eastern Europe Oncology Drugs Market Market Share Comparison by Country (2016-2032)
- Figure 82: Eastern Europe Oncology Drugs Market Market Share Comparison by By Drug Class Analysis (2016-2032)
- Figure 83: Eastern Europe Oncology Drugs Market Market Share Comparison by By Indication Analysis (2016-2032)
- Figure 84: Eastern Europe Oncology Drugs Market Market Share Comparison by By Distribution Channel Analysis (2016-2032)
- Figure 85: APAC Oncology Drugs Market Revenue (US$ Mn) Market Share by By Drug Class Analysisin 2022
- Figure 86: APAC Oncology Drugs Market Market Attractiveness Analysis by By Drug Class Analysis, 2016-2032
- Figure 87: APAC Oncology Drugs Market Revenue (US$ Mn) Market Share by By Indication Analysisin 2022
- Figure 88: APAC Oncology Drugs Market Market Attractiveness Analysis by By Indication Analysis, 2016-2032
- Figure 89: APAC Oncology Drugs Market Revenue (US$ Mn) Market Share by By Distribution Channel Analysisin 2022
- Figure 90: APAC Oncology Drugs Market Market Attractiveness Analysis by By Distribution Channel Analysis, 2016-2032
- Figure 91: APAC Oncology Drugs Market Revenue (US$ Mn) Market Share by Country in 2022
- Figure 92: APAC Oncology Drugs Market Market Attractiveness Analysis by Country, 2016-2032
- Figure 93: APAC Oncology Drugs Market Market Revenue (US$ Mn) (2016-2032)
- Figure 94: APAC Oncology Drugs Market Market Revenue (US$ Mn) Comparison by Country (2016-2032)
- Figure 95: APAC Oncology Drugs Market Market Revenue (US$ Mn) Comparison by By Drug Class Analysis (2016-2032)
- Figure 96: APAC Oncology Drugs Market Market Revenue (US$ Mn) Comparison by By Indication Analysis (2016-2032)
- Figure 97: APAC Oncology Drugs Market Market Revenue (US$ Mn) Comparison by By Distribution Channel Analysis (2016-2032)
- Figure 98: APAC Oncology Drugs Market Market Y-o-Y Growth Rate Comparison by Country (2016-2032)
- Figure 99: APAC Oncology Drugs Market Market Y-o-Y Growth Rate Comparison by By Drug Class Analysis (2016-2032)
- Figure 100: APAC Oncology Drugs Market Market Y-o-Y Growth Rate Comparison by By Indication Analysis (2016-2032)
- Figure 101: APAC Oncology Drugs Market Market Y-o-Y Growth Rate Comparison by By Distribution Channel Analysis (2016-2032)
- Figure 102: APAC Oncology Drugs Market Market Share Comparison by Country (2016-2032)
- Figure 103: APAC Oncology Drugs Market Market Share Comparison by By Drug Class Analysis (2016-2032)
- Figure 104: APAC Oncology Drugs Market Market Share Comparison by By Indication Analysis (2016-2032)
- Figure 105: APAC Oncology Drugs Market Market Share Comparison by By Distribution Channel Analysis (2016-2032)
- Figure 106: Latin America Oncology Drugs Market Revenue (US$ Mn) Market Share by By Drug Class Analysisin 2022
- Figure 107: Latin America Oncology Drugs Market Market Attractiveness Analysis by By Drug Class Analysis, 2016-2032
- Figure 108: Latin America Oncology Drugs Market Revenue (US$ Mn) Market Share by By Indication Analysisin 2022
- Figure 109: Latin America Oncology Drugs Market Market Attractiveness Analysis by By Indication Analysis, 2016-2032
- Figure 110: Latin America Oncology Drugs Market Revenue (US$ Mn) Market Share by By Distribution Channel Analysisin 2022
- Figure 111: Latin America Oncology Drugs Market Market Attractiveness Analysis by By Distribution Channel Analysis, 2016-2032
- Figure 112: Latin America Oncology Drugs Market Revenue (US$ Mn) Market Share by Country in 2022
- Figure 113: Latin America Oncology Drugs Market Market Attractiveness Analysis by Country, 2016-2032
- Figure 114: Latin America Oncology Drugs Market Market Revenue (US$ Mn) (2016-2032)
- Figure 115: Latin America Oncology Drugs Market Market Revenue (US$ Mn) Comparison by Country (2016-2032)
- Figure 116: Latin America Oncology Drugs Market Market Revenue (US$ Mn) Comparison by By Drug Class Analysis (2016-2032)
- Figure 117: Latin America Oncology Drugs Market Market Revenue (US$ Mn) Comparison by By Indication Analysis (2016-2032)
- Figure 118: Latin America Oncology Drugs Market Market Revenue (US$ Mn) Comparison by By Distribution Channel Analysis (2016-2032)
- Figure 119: Latin America Oncology Drugs Market Market Y-o-Y Growth Rate Comparison by Country (2016-2032)
- Figure 120: Latin America Oncology Drugs Market Market Y-o-Y Growth Rate Comparison by By Drug Class Analysis (2016-2032)
- Figure 121: Latin America Oncology Drugs Market Market Y-o-Y Growth Rate Comparison by By Indication Analysis (2016-2032)
- Figure 122: Latin America Oncology Drugs Market Market Y-o-Y Growth Rate Comparison by By Distribution Channel Analysis (2016-2032)
- Figure 123: Latin America Oncology Drugs Market Market Share Comparison by Country (2016-2032)
- Figure 124: Latin America Oncology Drugs Market Market Share Comparison by By Drug Class Analysis (2016-2032)
- Figure 125: Latin America Oncology Drugs Market Market Share Comparison by By Indication Analysis (2016-2032)
- Figure 126: Latin America Oncology Drugs Market Market Share Comparison by By Distribution Channel Analysis (2016-2032)
- Figure 127: Middle East & Africa Oncology Drugs Market Revenue (US$ Mn) Market Share by By Drug Class Analysisin 2022
- Figure 128: Middle East & Africa Oncology Drugs Market Market Attractiveness Analysis by By Drug Class Analysis, 2016-2032
- Figure 129: Middle East & Africa Oncology Drugs Market Revenue (US$ Mn) Market Share by By Indication Analysisin 2022
- Figure 130: Middle East & Africa Oncology Drugs Market Market Attractiveness Analysis by By Indication Analysis, 2016-2032
- Figure 131: Middle East & Africa Oncology Drugs Market Revenue (US$ Mn) Market Share by By Distribution Channel Analysisin 2022
- Figure 132: Middle East & Africa Oncology Drugs Market Market Attractiveness Analysis by By Distribution Channel Analysis, 2016-2032
- Figure 133: Middle East & Africa Oncology Drugs Market Revenue (US$ Mn) Market Share by Country in 2022
- Figure 134: Middle East & Africa Oncology Drugs Market Market Attractiveness Analysis by Country, 2016-2032
- Figure 135: Middle East & Africa Oncology Drugs Market Market Revenue (US$ Mn) (2016-2032)
- Figure 136: Middle East & Africa Oncology Drugs Market Market Revenue (US$ Mn) Comparison by Country (2016-2032)
- Figure 137: Middle East & Africa Oncology Drugs Market Market Revenue (US$ Mn) Comparison by By Drug Class Analysis (2016-2032)
- Figure 138: Middle East & Africa Oncology Drugs Market Market Revenue (US$ Mn) Comparison by By Indication Analysis (2016-2032)
- Figure 139: Middle East & Africa Oncology Drugs Market Market Revenue (US$ Mn) Comparison by By Distribution Channel Analysis (2016-2032)
- Figure 140: Middle East & Africa Oncology Drugs Market Market Y-o-Y Growth Rate Comparison by Country (2016-2032)
- Figure 141: Middle East & Africa Oncology Drugs Market Market Y-o-Y Growth Rate Comparison by By Drug Class Analysis (2016-2032)
- Figure 142: Middle East & Africa Oncology Drugs Market Market Y-o-Y Growth Rate Comparison by By Indication Analysis (2016-2032)
- Figure 143: Middle East & Africa Oncology Drugs Market Market Y-o-Y Growth Rate Comparison by By Distribution Channel Analysis (2016-2032)
- Figure 144: Middle East & Africa Oncology Drugs Market Market Share Comparison by Country (2016-2032)
- Figure 145: Middle East & Africa Oncology Drugs Market Market Share Comparison by By Drug Class Analysis (2016-2032)
- Figure 146: Middle East & Africa Oncology Drugs Market Market Share Comparison by By Indication Analysis (2016-2032)
- Figure 147: Middle East & Africa Oncology Drugs Market Market Share Comparison by By Distribution Channel Analysis (2016-2032)
"
- List of Tables
- "
- Table 1: Global Oncology Drugs Market Market Comparison by By Drug Class Analysis (2016-2032)
- Table 2: Global Oncology Drugs Market Market Comparison by By Indication Analysis (2016-2032)
- Table 3: Global Oncology Drugs Market Market Comparison by By Distribution Channel Analysis (2016-2032)
- Table 4: Global Oncology Drugs Market Revenue (US$ Mn) Comparison by Region (2016-2032)
- Table 5: Global Oncology Drugs Market Market Revenue (US$ Mn) (2016-2032)
- Table 6: Global Oncology Drugs Market Market Revenue (US$ Mn) Comparison by Region (2016-2032)
- Table 7: Global Oncology Drugs Market Market Revenue (US$ Mn) Comparison by By Drug Class Analysis (2016-2032)
- Table 8: Global Oncology Drugs Market Market Revenue (US$ Mn) Comparison by By Indication Analysis (2016-2032)
- Table 9: Global Oncology Drugs Market Market Revenue (US$ Mn) Comparison by By Distribution Channel Analysis (2016-2032)
- Table 10: Global Oncology Drugs Market Market Y-o-Y Growth Rate Comparison by Region (2016-2032)
- Table 11: Global Oncology Drugs Market Market Y-o-Y Growth Rate Comparison by By Drug Class Analysis (2016-2032)
- Table 12: Global Oncology Drugs Market Market Y-o-Y Growth Rate Comparison by By Indication Analysis (2016-2032)
- Table 13: Global Oncology Drugs Market Market Y-o-Y Growth Rate Comparison by By Distribution Channel Analysis (2016-2032)
- Table 14: Global Oncology Drugs Market Market Share Comparison by Region (2016-2032)
- Table 15: Global Oncology Drugs Market Market Share Comparison by By Drug Class Analysis (2016-2032)
- Table 16: Global Oncology Drugs Market Market Share Comparison by By Indication Analysis (2016-2032)
- Table 17: Global Oncology Drugs Market Market Share Comparison by By Distribution Channel Analysis (2016-2032)
- Table 18: North America Oncology Drugs Market Market Comparison by By Indication Analysis (2016-2032)
- Table 19: North America Oncology Drugs Market Market Comparison by By Distribution Channel Analysis (2016-2032)
- Table 20: North America Oncology Drugs Market Revenue (US$ Mn) Comparison by Country (2016-2032)
- Table 21: North America Oncology Drugs Market Market Revenue (US$ Mn) (2016-2032)
- Table 22: North America Oncology Drugs Market Market Revenue (US$ Mn) Comparison by Country (2016-2032)
- Table 23: North America Oncology Drugs Market Market Revenue (US$ Mn) Comparison by By Drug Class Analysis (2016-2032)
- Table 24: North America Oncology Drugs Market Market Revenue (US$ Mn) Comparison by By Indication Analysis (2016-2032)
- Table 25: North America Oncology Drugs Market Market Revenue (US$ Mn) Comparison by By Distribution Channel Analysis (2016-2032)
- Table 26: North America Oncology Drugs Market Market Y-o-Y Growth Rate Comparison by Country (2016-2032)
- Table 27: North America Oncology Drugs Market Market Y-o-Y Growth Rate Comparison by By Drug Class Analysis (2016-2032)
- Table 28: North America Oncology Drugs Market Market Y-o-Y Growth Rate Comparison by By Indication Analysis (2016-2032)
- Table 29: North America Oncology Drugs Market Market Y-o-Y Growth Rate Comparison by By Distribution Channel Analysis (2016-2032)
- Table 30: North America Oncology Drugs Market Market Share Comparison by Country (2016-2032)
- Table 31: North America Oncology Drugs Market Market Share Comparison by By Drug Class Analysis (2016-2032)
- Table 32: North America Oncology Drugs Market Market Share Comparison by By Indication Analysis (2016-2032)
- Table 33: North America Oncology Drugs Market Market Share Comparison by By Distribution Channel Analysis (2016-2032)
- Table 34: Western Europe Oncology Drugs Market Market Comparison by By Drug Class Analysis (2016-2032)
- Table 35: Western Europe Oncology Drugs Market Market Comparison by By Indication Analysis (2016-2032)
- Table 36: Western Europe Oncology Drugs Market Market Comparison by By Distribution Channel Analysis (2016-2032)
- Table 37: Western Europe Oncology Drugs Market Revenue (US$ Mn) Comparison by Country (2016-2032)
- Table 38: Western Europe Oncology Drugs Market Market Revenue (US$ Mn) (2016-2032)
- Table 39: Western Europe Oncology Drugs Market Market Revenue (US$ Mn) Comparison by Country (2016-2032)
- Table 40: Western Europe Oncology Drugs Market Market Revenue (US$ Mn) Comparison by By Drug Class Analysis (2016-2032)
- Table 41: Western Europe Oncology Drugs Market Market Revenue (US$ Mn) Comparison by By Indication Analysis (2016-2032)
- Table 42: Western Europe Oncology Drugs Market Market Revenue (US$ Mn) Comparison by By Distribution Channel Analysis (2016-2032)
- Table 43: Western Europe Oncology Drugs Market Market Y-o-Y Growth Rate Comparison by Country (2016-2032)
- Table 44: Western Europe Oncology Drugs Market Market Y-o-Y Growth Rate Comparison by By Drug Class Analysis (2016-2032)
- Table 45: Western Europe Oncology Drugs Market Market Y-o-Y Growth Rate Comparison by By Indication Analysis (2016-2032)
- Table 46: Western Europe Oncology Drugs Market Market Y-o-Y Growth Rate Comparison by By Distribution Channel Analysis (2016-2032)
- Table 47: Western Europe Oncology Drugs Market Market Share Comparison by Country (2016-2032)
- Table 48: Western Europe Oncology Drugs Market Market Share Comparison by By Drug Class Analysis (2016-2032)
- Table 49: Western Europe Oncology Drugs Market Market Share Comparison by By Indication Analysis (2016-2032)
- Table 50: Western Europe Oncology Drugs Market Market Share Comparison by By Distribution Channel Analysis (2016-2032)
- Table 51: Eastern Europe Oncology Drugs Market Market Comparison by By Drug Class Analysis (2016-2032)
- Table 52: Eastern Europe Oncology Drugs Market Market Comparison by By Indication Analysis (2016-2032)
- Table 53: Eastern Europe Oncology Drugs Market Market Comparison by By Distribution Channel Analysis (2016-2032)
- Table 54: Eastern Europe Oncology Drugs Market Revenue (US$ Mn) Comparison by Country (2016-2032)
- Table 55: Eastern Europe Oncology Drugs Market Market Revenue (US$ Mn) (2016-2032)
- Table 56: Eastern Europe Oncology Drugs Market Market Revenue (US$ Mn) Comparison by Country (2016-2032)
- Table 57: Eastern Europe Oncology Drugs Market Market Revenue (US$ Mn) Comparison by By Drug Class Analysis (2016-2032)
- Table 58: Eastern Europe Oncology Drugs Market Market Revenue (US$ Mn) Comparison by By Indication Analysis (2016-2032)
- Table 59: Eastern Europe Oncology Drugs Market Market Revenue (US$ Mn) Comparison by By Distribution Channel Analysis (2016-2032)
- Table 60: Eastern Europe Oncology Drugs Market Market Y-o-Y Growth Rate Comparison by Country (2016-2032)
- Table 61: Eastern Europe Oncology Drugs Market Market Y-o-Y Growth Rate Comparison by By Drug Class Analysis (2016-2032)
- Table 62: Eastern Europe Oncology Drugs Market Market Y-o-Y Growth Rate Comparison by By Indication Analysis (2016-2032)
- Table 63: Eastern Europe Oncology Drugs Market Market Y-o-Y Growth Rate Comparison by By Distribution Channel Analysis (2016-2032)
- Table 64: Eastern Europe Oncology Drugs Market Market Share Comparison by Country (2016-2032)
- Table 65: Eastern Europe Oncology Drugs Market Market Share Comparison by By Drug Class Analysis (2016-2032)
- Table 66: Eastern Europe Oncology Drugs Market Market Share Comparison by By Indication Analysis (2016-2032)
- Table 67: Eastern Europe Oncology Drugs Market Market Share Comparison by By Distribution Channel Analysis (2016-2032)
- Table 68: APAC Oncology Drugs Market Market Comparison by By Drug Class Analysis (2016-2032)
- Table 69: APAC Oncology Drugs Market Market Comparison by By Indication Analysis (2016-2032)
- Table 70: APAC Oncology Drugs Market Market Comparison by By Distribution Channel Analysis (2016-2032)
- Table 71: APAC Oncology Drugs Market Revenue (US$ Mn) Comparison by Country (2016-2032)
- Table 72: APAC Oncology Drugs Market Market Revenue (US$ Mn) (2016-2032)
- Table 73: APAC Oncology Drugs Market Market Revenue (US$ Mn) Comparison by Country (2016-2032)
- Table 74: APAC Oncology Drugs Market Market Revenue (US$ Mn) Comparison by By Drug Class Analysis (2016-2032)
- Table 75: APAC Oncology Drugs Market Market Revenue (US$ Mn) Comparison by By Indication Analysis (2016-2032)
- Table 76: APAC Oncology Drugs Market Market Revenue (US$ Mn) Comparison by By Distribution Channel Analysis (2016-2032)
- Table 77: APAC Oncology Drugs Market Market Y-o-Y Growth Rate Comparison by Country (2016-2032)
- Table 78: APAC Oncology Drugs Market Market Y-o-Y Growth Rate Comparison by By Drug Class Analysis (2016-2032)
- Table 79: APAC Oncology Drugs Market Market Y-o-Y Growth Rate Comparison by By Indication Analysis (2016-2032)
- Table 80: APAC Oncology Drugs Market Market Y-o-Y Growth Rate Comparison by By Distribution Channel Analysis (2016-2032)
- Table 81: APAC Oncology Drugs Market Market Share Comparison by Country (2016-2032)
- Table 82: APAC Oncology Drugs Market Market Share Comparison by By Drug Class Analysis (2016-2032)
- Table 83: APAC Oncology Drugs Market Market Share Comparison by By Indication Analysis (2016-2032)
- Table 84: APAC Oncology Drugs Market Market Share Comparison by By Distribution Channel Analysis (2016-2032)
- Table 85: Latin America Oncology Drugs Market Market Comparison by By Drug Class Analysis (2016-2032)
- Table 86: Latin America Oncology Drugs Market Market Comparison by By Indication Analysis (2016-2032)
- Table 87: Latin America Oncology Drugs Market Market Comparison by By Distribution Channel Analysis (2016-2032)
- Table 88: Latin America Oncology Drugs Market Revenue (US$ Mn) Comparison by Country (2016-2032)
- Table 89: Latin America Oncology Drugs Market Market Revenue (US$ Mn) (2016-2032)
- Table 90: Latin America Oncology Drugs Market Market Revenue (US$ Mn) Comparison by Country (2016-2032)
- Table 91: Latin America Oncology Drugs Market Market Revenue (US$ Mn) Comparison by By Drug Class Analysis (2016-2032)
- Table 92: Latin America Oncology Drugs Market Market Revenue (US$ Mn) Comparison by By Indication Analysis (2016-2032)
- Table 93: Latin America Oncology Drugs Market Market Revenue (US$ Mn) Comparison by By Distribution Channel Analysis (2016-2032)
- Table 94: Latin America Oncology Drugs Market Market Y-o-Y Growth Rate Comparison by Country (2016-2032)
- Table 95: Latin America Oncology Drugs Market Market Y-o-Y Growth Rate Comparison by By Drug Class Analysis (2016-2032)
- Table 96: Latin America Oncology Drugs Market Market Y-o-Y Growth Rate Comparison by By Indication Analysis (2016-2032)
- Table 97: Latin America Oncology Drugs Market Market Y-o-Y Growth Rate Comparison by By Distribution Channel Analysis (2016-2032)
- Table 98: Latin America Oncology Drugs Market Market Share Comparison by Country (2016-2032)
- Table 99: Latin America Oncology Drugs Market Market Share Comparison by By Drug Class Analysis (2016-2032)
- Table 100: Latin America Oncology Drugs Market Market Share Comparison by By Indication Analysis (2016-2032)
- Table 101: Latin America Oncology Drugs Market Market Share Comparison by By Distribution Channel Analysis (2016-2032)
- Table 102: Middle East & Africa Oncology Drugs Market Market Comparison by By Drug Class Analysis (2016-2032)
- Table 103: Middle East & Africa Oncology Drugs Market Market Comparison by By Indication Analysis (2016-2032)
- Table 104: Middle East & Africa Oncology Drugs Market Market Comparison by By Distribution Channel Analysis (2016-2032)
- Table 105: Middle East & Africa Oncology Drugs Market Revenue (US$ Mn) Comparison by Country (2016-2032)
- Table 106: Middle East & Africa Oncology Drugs Market Market Revenue (US$ Mn) (2016-2032)
- Table 107: Middle East & Africa Oncology Drugs Market Market Revenue (US$ Mn) Comparison by Country (2016-2032)
- Table 108: Middle East & Africa Oncology Drugs Market Market Revenue (US$ Mn) Comparison by By Drug Class Analysis (2016-2032)
- Table 109: Middle East & Africa Oncology Drugs Market Market Revenue (US$ Mn) Comparison by By Indication Analysis (2016-2032)
- Table 110: Middle East & Africa Oncology Drugs Market Market Revenue (US$ Mn) Comparison by By Distribution Channel Analysis (2016-2032)
- Table 111: Middle East & Africa Oncology Drugs Market Market Y-o-Y Growth Rate Comparison by Country (2016-2032)
- Table 112: Middle East & Africa Oncology Drugs Market Market Y-o-Y Growth Rate Comparison by By Drug Class Analysis (2016-2032)
- Table 113: Middle East & Africa Oncology Drugs Market Market Y-o-Y Growth Rate Comparison by By Indication Analysis (2016-2032)
- Table 114: Middle East & Africa Oncology Drugs Market Market Y-o-Y Growth Rate Comparison by By Distribution Channel Analysis (2016-2032)
- Table 115: Middle East & Africa Oncology Drugs Market Market Share Comparison by Country (2016-2032)
- Table 116: Middle East & Africa Oncology Drugs Market Market Share Comparison by By Drug Class Analysis (2016-2032)
- Table 117: Middle East & Africa Oncology Drugs Market Market Share Comparison by By Indication Analysis (2016-2032)
- Table 118: Middle East & Africa Oncology Drugs Market Market Share Comparison by By Distribution Channel Analysis (2016-2032)
- 1. Executive Summary
-
- Hoffmann-La Roche Ltd.
- Novartis International AG
- AstraZeneca
- Merck & Co
- Celgene Corporation
- Johnson & Johnson
- Bristol-Myers Squibb Company
- Pfizer Inc.
- Merck & Co., Inc.
- Eli Lilly and Company
- AbbVie Inc.
- Bayer AG
Our Clients


View Our Licence Options
