
Nuclear Fusion Market By Technology(Magnetic Confinement, Inertial Confinement), By Fuels(Deuterium/tritium , Deuterium,Deuterium, helium-3, Proton Boron), By Region And Companies - Industry Segment Outlook, Market Assessment, Competition Scenario, Trends, And Forecast 2024-2033
-
44290
-
April 2024
-
300
-


-
This report was compiled by Shreyas Rokade Shreyas Rokade is a seasoned Research Analyst with CMFE, bringing extensive expertise in market research and consulting, with a strong background in Chemical Engineering. Correspondence Team Lead-CMFE Linkedin | Detailed Market research Methodology Our methodology involves a mix of primary research, including interviews with leading mental health experts, and secondary research from reputable medical journals and databases. View Detailed Methodology Page
-
Quick Navigation
Report Overview
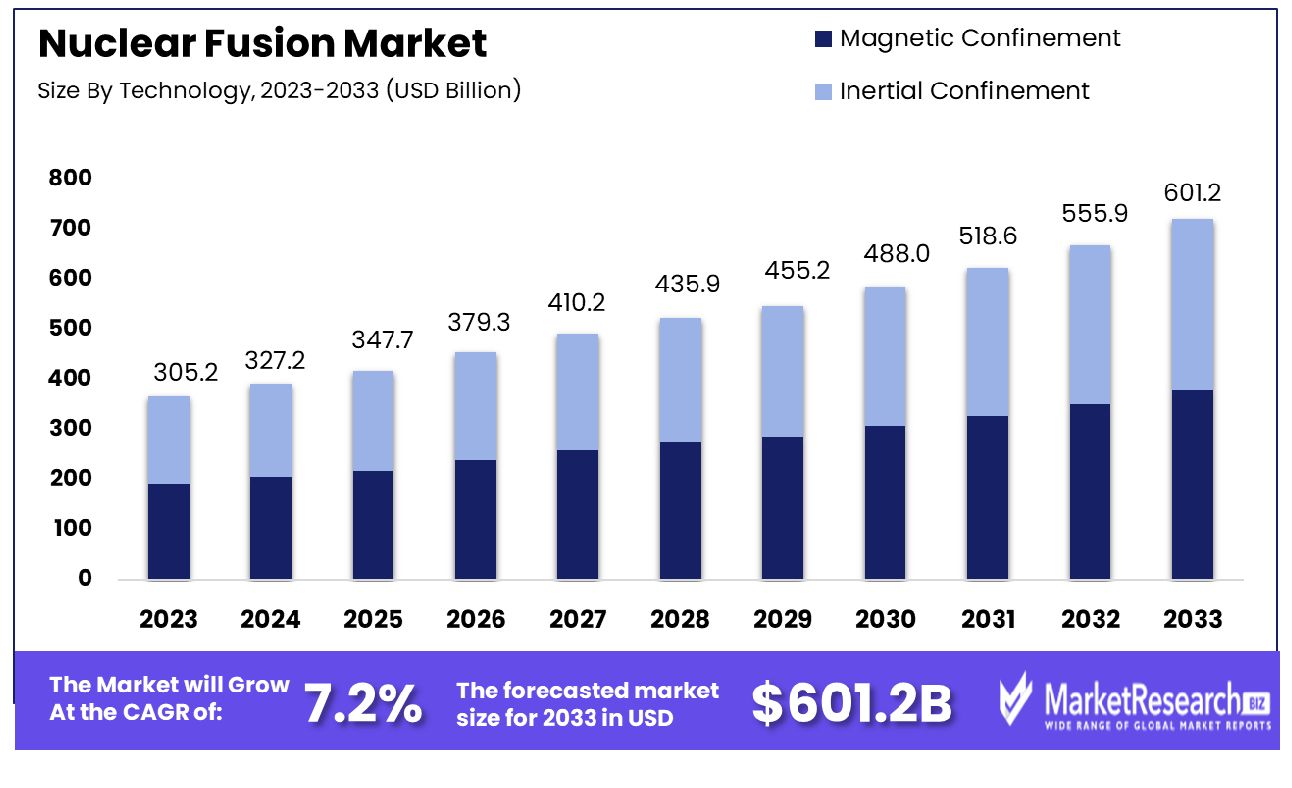
The Nuclear Fusion Market was valued at USD 305.2 billion in 2023. It is expected to reach USD 601.2 billion by 2033, with a CAGR of 7.2% during the forecast period from 2024 to 2033.
The surge in demand for advanced technologies and urbanization are some of the main driving factors for the nuclear fusion market expansion. Nuclear fusion is the source of energy at the center of stars that comprises the sun itself. It is a process through which two light atomic nuclei integrate to build an individual weightier one while generating a huge amount of energy. Fusion produces 4 times more energy per kilogram of fuel than nuclear power generation fission and nearly about four million times more energy than burning coal.
Many scientists and engineers are on an expedition to restore nuclear fusion because once nuclear fusion is imitated on Earth at a manufacturing level, this could offer unlimited fresh, safe, and cost-effective energy to meet the world’s requirements. Most of the fusion reactor theories are under progression and will use a combination of deuterium and tritium with hydrogen station atoms that consist of extra neutrons. By this concept, with the use of just a few grams of these reactants, it can generate a terajoule of energy which is approx. the energy of a single person in an industrialized country that requires over 60 years.
According to Newsweek 90, nuclear fusion funding will boost as it progresses towards bringing clean energy closer. The second global fusion industry report by the Fusion Industry Association (FIA), displays that the total amount of private investment in fusion amounts to USD 4.7 billion dwarfing the total USD 117 million of the public investment announced by the organization’s survey. In total USD 2.83 billion in new investment was proclaimed in the year since the last survey.
Nuclear fusion is important because the waste generated by nuclear fusion is less radioactive and decomposes more quickly than nuclear fission which generates harmful radioactive wastes. Nuclear fusion doesn’t require any fossil fuels or greenhouse gases as most of the fusion experiments use hydrogen which is derived low from seawater and lithium which means the fuel distribution will be available for millions of years. The demand for the nuclear fusion market will increase due to high-end requirements in different sectors that will help contribute to market expansion in the coming years.
Key Takeaways
- Market Growth: The Nuclear Fusion Market was valued at USD 305.2 billion in 2023. It is expected to reach USD 601.2 billion by 2033, with a CAGR of 7.2% during the forecast period from 2024 to 2033.
- By Technology: The magnetic confinement technology facilitates plasma stabilization in fusion reactors. This approach enhances the efficiency of energy production processes significantly.
- By Fuels: Deuterium/tritium fuels serve as the primary material for nuclear fusion reactions. Their utilization promises a substantial increase in the output of fusion energy.
- Regional Dominance: The European Nuclear Fusion Market currently commands a 30.3% global share.
- Growth Opportunity: Advancements in materials science and increased investment in fusion startups are pivotal for the nuclear fusion market, enhancing reactor efficiency and accelerating the commercial viability of sustainable fusion energy.
Driving factors
Growing Demand for Fusion Power
The escalating interest in fusion power can be attributed to its potential as a sustainable and virtually limitless source of energy, addressing the global imperative for clean energy solutions. This burgeoning demand is fundamentally driven by the imperative to mitigate climate change and reduce reliance on fossil fuels.
As societies worldwide intensify their efforts to decarbonize energy systems, fusion power emerges as a compelling alternative, promising to supply large quantities of energy without the greenhouse gas emissions associated with conventional energy sources. Consequently, this shift towards cleaner energy paradigms propels investment and development within the nuclear fusion market, catalyzing technological advancements and amplifying market growth prospects.
Increasing Need for Tooling in the Industry
The nuclear fusion sector is experiencing an escalating requirement for specialized tooling and infrastructure, essential for the construction and maintenance of fusion reactors. This need is propelled by the complexity and precision required in fusion reactor design and operation, where high-quality tooling becomes indispensable for achieving the requisite conditions for fusion.
The development and manufacturing of these tools not only foster innovation in materials science and engineering but also stimulate the expansion of the supply chain ecosystem supporting the fusion industry. This, in turn, enhances the operational efficiency and safety of fusion plants, further invigorating market growth through increased investments and collaborations across related industries.
Advancements in Generation IV Technology
Generation IV nuclear reactor technologies represent the frontier in nuclear energy, offering enhanced safety, efficiency, and sustainability over their predecessors. These advancements are pivotal to the nuclear fusion market, as they provide critical solutions to longstanding challenges such as waste management, fuel efficiency, and operational safety. The integration of Generation IV technologies in fusion reactors embodies a significant leap forward, enabling more efficient and safer reactors.
This progress not only enhances the feasibility and attractiveness of fusion energy but also attracts significant investments in research and development, thereby fueling the market's expansion. The synergy between Generation IV advancements and fusion technology development creates a conducive environment for innovation, drawing attention from governments, private investors, and international collaborations eager to pioneer the next era of energy production.
Restraining Factors
High Cost of Nuclear Energy: A Barrier to Adoption and Innovation
The high cost associated with nuclear fusion technology stands as a significant barrier to its widespread adoption and subsequent market growth. Developing nuclear fusion reactors requires immense capital investment, not only in the construction phase but also in research and development. This high cost is attributed to the complexity of the technology, the need for advanced materials capable of withstanding extreme conditions, and the lengthy timeline required to bring a reactor from concept to operational status.
As a result, the financial burden places nuclear fusion at a competitive disadvantage compared to more established and less expensive renewable energy sources. Consequently, the growth of the Nuclear Fusion Market is constrained, as potential investors and governments weigh the economic feasibility of such projects against other energy production methods.
Increasing Incidents Impacting Market Growth: Safety Concerns and Regulatory Scrutiny
The second primary restraining factor is the increasing number of incidents associated with nuclear technologies, which casts a shadow on the market's growth potential. Although nuclear fusion is fundamentally different from nuclear fission, with a safer operational profile and less hazardous waste, public perception and regulatory scrutiny remain challenges.
Incidents in nuclear facilities, regardless of their origin in fusion or fission processes, foster a climate of safety concerns and elevate the regulatory hurdles for new projects. This heightened scrutiny prolongs project timelines, increases costs, and dampens investor enthusiasm. The cumulative effect of these incidents contributes to a cautious approach from stakeholders, further restraining the market's growth as efforts intensify to address safety concerns and meet regulatory standards.
By Technology Analysis
Magnetic confinement technology is pivotal for achieving controlled thermonuclear fusion, utilizing magnetic fields to confine the plasma.
In 2023, Magnetic Confinement secured a dominant market position in the "By Technology" segment of the Nuclear Fusion Market, underpinning significant advancements and investments in fusion research. This technology, central to the fusion process, leverages magnetic fields to contain plasma—a state of matter composed of charged particles—at extremely high temperatures, facilitating the conditions necessary for nuclear fusion.
Magnetic Confinement Fusion (MCF) technology, exemplified by Tokamak and Stellarator devices, has witnessed considerable developmental milestones, attributed to its preeminence. The global inclination towards sustainable and limitless energy sources has further catalyzed the R&D efforts in MCF. Despite the complexity and high capital investment associated with this technology, its potential for scalable and continuous energy production positions it favorably within the market.
In comparison, Inertial Confinement Fusion (ICF) presents an alternative approach, utilizing high-energy lasers or ion beams to compress and heat fuel pellets to achieve fusion. While ICF offers distinct advantages in terms of containment and initiation of fusion reactions, its application has been predominantly experimental, with significant challenges in achieving the requisite conditions for net energy gain.
The growth of the Magnetic Confinement segment can be attributed to its advanced state of research, global collaboration initiatives, and the promise of a sustainable energy future. As the nuclear fusion market evolves, the strategic focus on overcoming the technological and financial barriers associated with Magnetic Confinement will be crucial for accelerating its commercial viability and adoption. Nonetheless, both Magnetic and Inertial Confinement technologies remain pivotal to the long-term success and sustainability of nuclear fusion as a clean energy source.
By Fuels Analysis
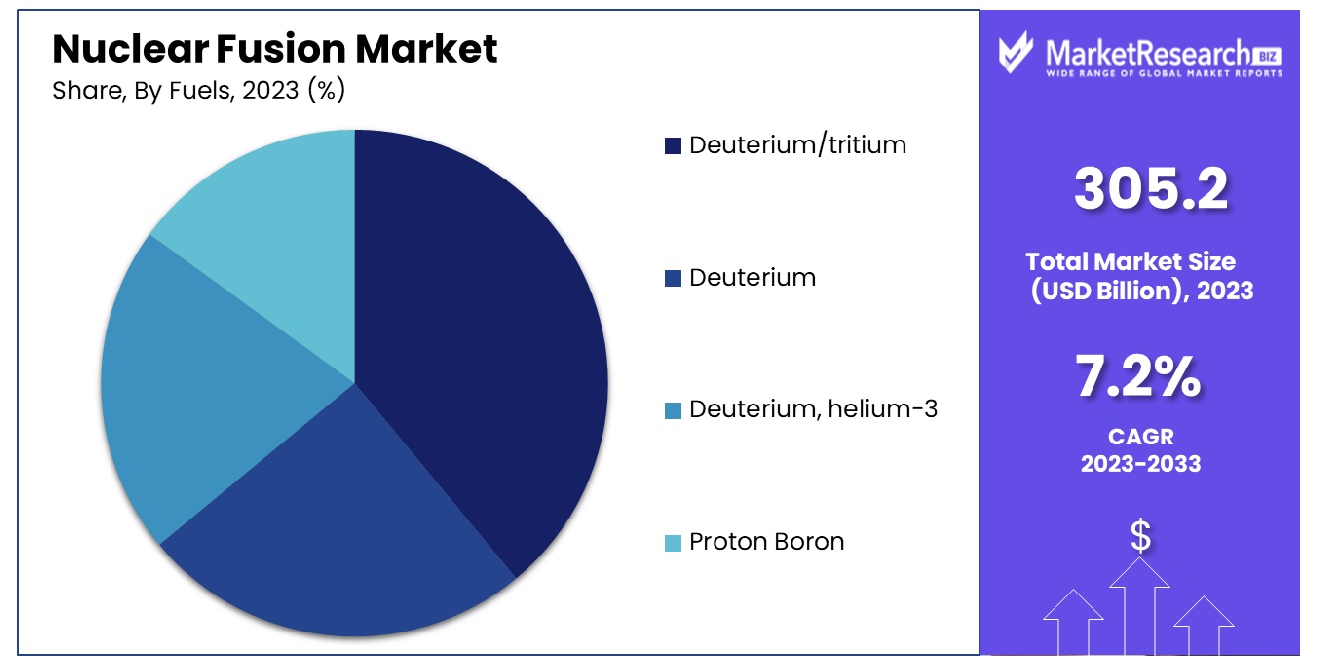
Deuterium/tritium fuel, essential for fusion reactions, offers a high energy yield with minimal radioactive waste.
In 2023, deuterium/tritium maintained a dominant market position in the By Fuels segment of the Nuclear Fusion Market, underscoring its pivotal role in driving advancements within the sector. This prominence is primarily attributed to the high efficiency and abundant availability of deuterium and tritium as fusion materials. Deuterium, an isotope of hydrogen, is widely accessible in ocean water, presenting a virtually inexhaustible resource for fusion reactors. Tritium, although less abundant naturally, can be bred from lithium, which itself is relatively plentiful. The combination of these two isotopes yields a fusion process with a significantly high energy output, making deuterium/tritium fusion the most technologically mature approach to date.
Parallel to deuterium/tritium, the deuterium fuel segment has exhibited steady growth, leveraging its advantage of being easier to source compared to tritium. Despite the lower energy yield of deuterium-deuterium reactions compared to deuterium/tritium, the safety and logistical benefits present compelling reasons for its continued development and application in fusion technology.
Exploration into deuterium, and helium-3 fusion processes also presents a noteworthy frontier. Although helium-3 is scarce on Earth, it's potential for a near aneutronic fusion reaction—yielding minimal radioactive waste—positions it as an attractive long-term option for sustainable energy production. The moon has been identified as a potential source of helium-3, inviting considerations for extraterrestrial resource extraction to support future fusion energy needs.
Key Market Segments
By Technology
- Magnetic Confinement
- Inertial Confinement
By Fuels
- Deuterium/tritium
- Deuterium
- Deuterium, helium-3
- Proton Boron
Growth Opportunity
Materials Science Innovations
The global nuclear fusion market stands on the cusp of transformation, driven predominantly by breakthroughs in materials science. Innovations in the development of superalloys and nanomaterials are poised to redefine the operational parameters of fusion reactors. The creation of materials capable of withstanding the extreme thermal and radiation conditions inherent in nuclear fusion processes is pivotal. Such advancements are not merely augmentative but foundational, enhancing reactor durability and operational efficiency.
This progression in materials science can significantly mitigate the technological and financial challenges associated with reactor construction and maintenance, thereby accelerating the feasibility and deployment of nuclear fusion as a sustainable energy source. The implications of these innovations extend beyond the immediate horizon of energy generation, promising to catalyze a paradigm shift in how energy sustainability and security are approached globally.
Investment in Fusion Startups
The landscape of the global nuclear fusion market is increasingly characterized by the dynamic influx of venture capital and corporate investment. This trend underscores a burgeoning recognition of nuclear fusion's potential to revolutionize the energy sector. Investment in fusion technology startups is not merely a financial endeavor but a strategic move to spearhead innovation and expedite the commercial viability of fusion energy.
The influx of capital facilitates the critical early-stage development of fusion technologies, nurturing the ecosystem necessary for breakthroughs and scaling operations. As these startups forge ahead, leveraging novel research and development pathways, they embody the vanguard of the transition towards a sustainable energy future. This wave of investment signifies a pivotal juncture, marking the confluence of scientific potential and market confidence, which could ultimately lead to the realization of nuclear fusion as a cornerstone of global energy strategy.
Latest Trends
Advancements in Tokamak Design
In 2023, the global nuclear fusion market witnessed significant strides in the domain of Tokamak design, which has long stood as the cornerstone of fusion reactor research. The focus has been increasingly on enhancing the efficiency and feasibility of these reactors through pioneering innovations in plasma containment and stability control. Such advancements are not merely technical milestones; they are reshaping the landscape of nuclear fusion by improving the potential for sustainable, large-scale energy production.
The evolution of the Tokamak design is indicative of a concerted effort within the scientific community to address the critical challenges of energy confinement and control, which are essential for achieving practical fusion energy. These developments underscore a promising trajectory toward overcoming the technical and economic barriers that have historically impeded the commercialization of fusion energy.
Development of Stellarators
Parallel to the advancements in Tokamak technology, 2023 has also seen a renewed interest in the development of Stellarators. This resurgence is driven by their intrinsic ability to maintain plasma in a stable state for extended periods, thereby offering a potentially more viable approach to continuous fusion energy production. Stellarators represent a critical area of exploration within the nuclear fusion market, as their unique design circumvents some of the limitations associated with Tokamak reactors, particularly in terms of plasma stability and the complexity of engineering required to sustain operation.
The growing attention towards Stellarators highlights the diversification of research and development efforts in the nuclear fusion sector, emphasizing a holistic approach to overcoming the multifaceted challenges of achieving practical and economically feasible fusion power. This trend not only broadens the scope of fusion energy research but also enhances the probability of achieving a breakthrough in continuous energy production technologies.
Regional Analysis
The market share for nuclear fusion in Europe stands at 30.3%, indicating a significant industry presence.
The Nuclear Fusion Market exhibits significant variation across different regions, characterized by unique developmental stages, investments, and technological advancements. In North America, the market is propelled by robust government funding and strategic partnerships between research institutions and private entities, aiming to accelerate the commercialization of nuclear fusion technology. This region demonstrates a keen focus on enhancing the efficiency and safety of fusion reactors, with the United States leading in terms of investment and technological innovation.
Europe, holding a dominant market share of 30.3%, stands at the forefront of nuclear fusion research, underpinned by collaborative efforts such as the ITER project in France. The region's commitment is further evidenced by substantial investments from the European Union, aimed at achieving grid parity and sustainable energy production. The emphasis on environmental sustainability and energy security positions Europe as a pivotal player in advancing nuclear fusion technology.
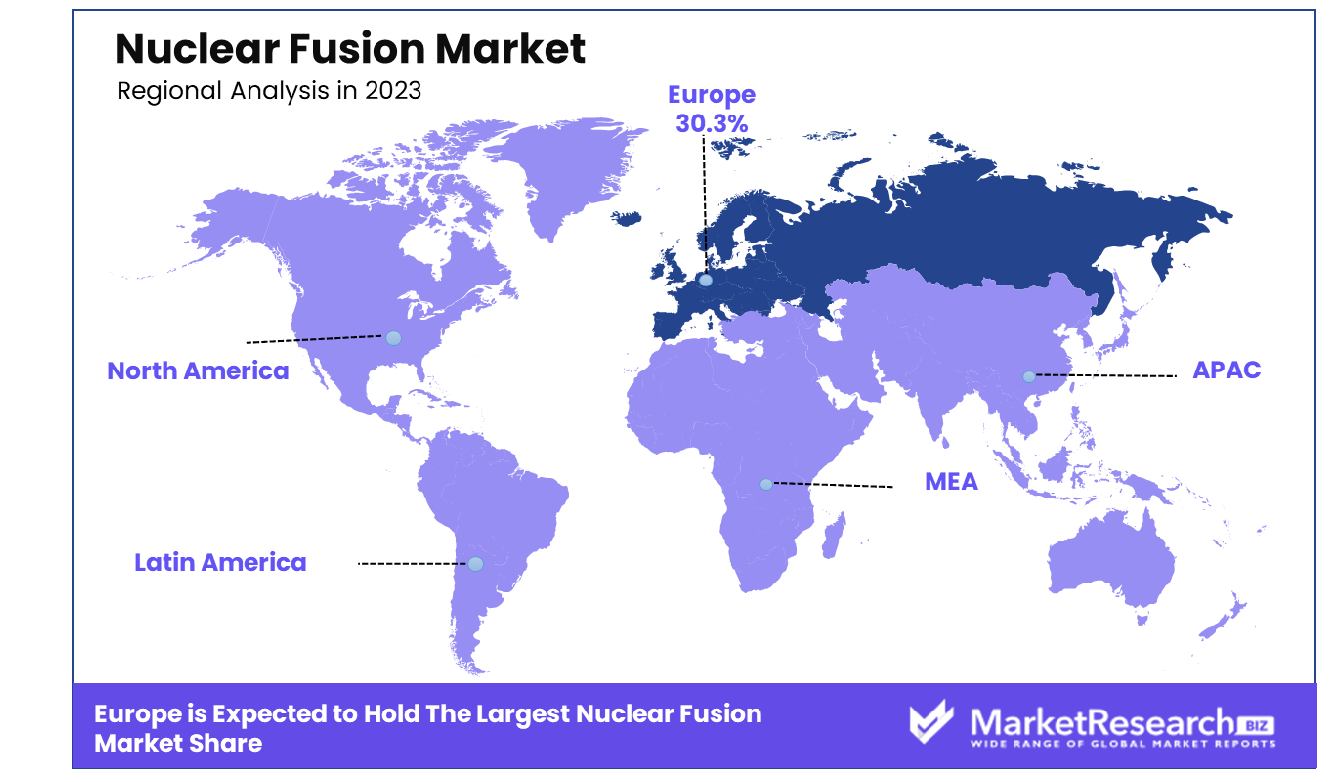
The Asia Pacific region is witnessing rapid growth in the nuclear fusion market, driven by escalating energy demands and strong governmental support, particularly in countries like China and South Korea. These nations are investing heavily in research and development facilities, aiming to lead in the fusion energy race. The focus on long-term energy solutions to combat climate change significantly contributes to the market's expansion in this region.
Meanwhile, the Middle East & Africa, and Latin America regions are in the nascent stages of entering the nuclear fusion market. These regions exhibit growth potential, contingent upon the development of infrastructure and increased investments. The pursuit of diversifying energy sources and reducing reliance on fossil fuels may catalyze the exploration and adoption of nuclear fusion technology in these areas.
Key Regions and Countries
North America
- The US
- Canada
- Rest of North America
Europe
- Germany
- France
- The UK
- Spain
- Netherlands
- Russia
- Italy
- Rest of Europe
Asia-Pacific
- China
- Japan
- Singapore
- Thailand
- South Korea
- Vietnam
- India
- New Zealand
- Rest of Asia Pacific
Latin America
- Mexico
- Brazil
- Rest of Latin America
Middle East & Africa
- Saudi Arabia
- South Africa
- UAE
- Rest of the Middle East & Africa
Key Players Analysis
In the global nuclear fusion market in 2023, several key players have emerged as pivotal forces shaping the industry's trajectory. Among these, Zap Energy, First Light Fusion, and General Fusion stand out for their innovative approaches toward sustainable energy solutions. Zap Energy's focus on sheared-flow stabilized Z-pinch technology exemplifies a promising avenue for achieving cost-effective fusion energy. First Light Fusion's pursuit of inertial confinement fusion, employing a novel projectile-based method, underscores its unique position in the field.
TAE Technologies and Commonwealth Fusion Systems have made significant strides in magnetic confinement fusion, with TAE Technologies' focus on aneutronic fusion and Commonwealth Fusion Systems' emphasis on high-temperature superconducting magnets, marking critical advancements in the sector. Meanwhile, Tokamak Energy is advancing the development of compact, modular tokamaks, promising to revolutionize energy production with its scalable approach.
Lockheed Martin's foray into compact fusion reactor technology illustrates the defense sector's interest in fusion energy, underscoring the cross-sectoral relevance of nuclear fusion. Hyperjet Fusion (formerly known as HyperV Technologies) continues to make progress with its plasma-jet-driven magneto-inertial fusion, indicating the growing diversity of technological pathways being explored.
Marvel Fusion, Helion, HB11, and Agni Fusion Energy represent the innovative spirit driving the nuclear fusion market. Marvel Fusion's focus on laser-driven fusion, Helion's dedication to pulsed magnetic fusion, HB11's groundbreaking approach to laser-boron fusion, and Agni Fusion Energy's work on hybrid nuclear fusion technologies all highlight the sector's dynamic nature and the wide array of strategies being employed to harness fusion energy.
Market Key Players
- Zap Energy
- First Light Fusion
- General Fusion
- TAE Technologies
- Commonwealth Fusion
- Tokamak Energy
- Lockheed Martin
- Hyperjet Fusion
- Marvel Fusion
- Helion
- HB11
- Agni Fusion Energy
Recent Development
- In March 2024, The European Commission explores a public-private partnership for fusion commercialization, leveraging the industry's growing investment and technological breakthroughs, aiming to maintain EU competitiveness and leadership in fusion energy.
- In February 2024, DIII-D National Fusion Facility scientists developed an AI model to predict and prevent tearing mode instabilities in nuclear fusion plasma, enhancing stability and efficiency in fusion reactors.
- In February 2024, Kairos Power signed an agreement with the DOE, adopting a payment-for-milestones model to develop a novel fluoride high-temperature test reactor, marking a new approach in nuclear energy partnership.
Report Scope
Report Features Description Market Value (2023) USD 305.2 Billion Forecast Revenue (2033) USD 601.2 Billion CAGR (2024-2032) 7.2% Base Year for Estimation 2023 Historic Period 2016-2023 Forecast Period 2024-2033 Report Coverage Revenue Forecast, Market Dynamics, COVID-19 Impact, Competitive Landscape, Recent Developments Segments Covered By Technology(Magnetic Confinement, Inertial Confinement), By Fuels(Deuterium/tritium , Deuterium,Deuterium, helium-3, Proton Boron) Regional Analysis North America - The US, Canada, Rest of North America, Europe - Germany, France, The UK, Spain, Italy, Russia, Netherlands, Rest of Europe, Asia-Pacific - China, Japan, South Korea, India, New Zealand, Singapore, Thailand, Vietnam, Rest of Asia Pacific, Latin America - Brazil, Mexico, Rest of Latin America, Middle East & Africa - South Africa, Saudi Arabia, UAE, Rest of Middle East & Africa Competitive Landscape Zap Energy, First Light Fusion, General Fusion, TAE Technologies, Commonwealth Fusion, Tokamak Energy, Lockheed Martin, Hyperjet Fusion, Marvel Fusion, Helion, HB11, Agni Fusion Energy Customization Scope Customization for segments, region/country-level will be provided. Moreover, additional customization can be done based on the requirements. Purchase Options We have three licenses to opt for Single User License, Multi-User License (Up to 5 Users), Corporate Use License (Unlimited User and Printable PDF) -
- 1. Executive Summary
- 1.1. Definition
- 1.2. Taxonomy
- 1.3. Research Scope
- 1.4. Key Analysis
- 1.5. Key Findings by Major Segments
- 1.6. Top strategies by Major Players
- 2. Global Nuclear Fusion Market Overview
- 2.1. Nuclear Fusion Market Dynamics
- 2.1.1. Drivers
- 2.1.2. Opportunities
- 2.1.3. Restraints
- 2.1.4. Challenges
- 2.2. Macro-economic Factors
- 2.3. Regulatory Framework
- 2.4. Market Investment Feasibility Index
- 2.5. PEST Analysis
- 2.6. PORTER’S Five Force Analysis
- 2.7. Drivers & Restraints Impact Analysis
- 2.8. Industry Chain Analysis
- 2.9. Cost Structure Analysis
- 2.10. Marketing Strategy
- 2.11. Russia-Ukraine War Impact Analysis
- 2.12. Opportunity Map Analysis
- 2.13. Market Competition Scenario Analysis
- 2.14. Product Life Cycle Analysis
- 2.15. Opportunity Orbits
- 2.16. Manufacturer Intensity Map
- 2.17. Major Companies sales by Value & Volume
- 2.1. Nuclear Fusion Market Dynamics
- 3. Global Nuclear Fusion Market Analysis, Opportunity and Forecast, 2016-2032
- 3.1. Global Nuclear Fusion Market Analysis, 2016-2021
- 3.2. Global Nuclear Fusion Market Opportunity and Forecast, 2023-2032
- 3.3. Global Nuclear Fusion Market Analysis, Opportunity and Forecast, By By Technology, 2016-2032
- 3.3.1. Global Nuclear Fusion Market Analysis by By Technology: Introduction
- 3.3.2. Market Size Absolute $ Opportunity Analysis and Forecast, By By Technology, 2016-2032
- 3.3.3. Magnetic Confinement
- 3.3.4. Inertial Confinement
- 3.4. Global Nuclear Fusion Market Analysis, Opportunity and Forecast, By By Fuels, 2016-2032
- 3.4.1. Global Nuclear Fusion Market Analysis by By Fuels: Introduction
- 3.4.2. Market Size Absolute $ Opportunity Analysis and Forecast, By By Fuels, 2016-2032
- 3.4.3. Deuterium/tritium
- 3.4.4. Deuterium
- 3.4.5. Deuterium, helium-3
- 3.4.6. Proton Boron
- 4. North America Nuclear Fusion Market Analysis, Opportunity and Forecast, 2016-2032
- 4.1. North America Nuclear Fusion Market Analysis, 2016-2021
- 4.2. North America Nuclear Fusion Market Opportunity and Forecast, 2023-2032
- 4.3. North America Nuclear Fusion Market Analysis, Opportunity and Forecast, By By Technology, 2016-2032
- 4.3.1. North America Nuclear Fusion Market Analysis by By Technology: Introduction
- 4.3.2. Market Size Absolute $ Opportunity Analysis and Forecast, By By Technology, 2016-2032
- 4.3.3. Magnetic Confinement
- 4.3.4. Inertial Confinement
- 4.4. North America Nuclear Fusion Market Analysis, Opportunity and Forecast, By By Fuels, 2016-2032
- 4.4.1. North America Nuclear Fusion Market Analysis by By Fuels: Introduction
- 4.4.2. Market Size Absolute $ Opportunity Analysis and Forecast, By By Fuels, 2016-2032
- 4.4.3. Deuterium/tritium
- 4.4.4. Deuterium
- 4.4.5. Deuterium, helium-3
- 4.4.6. Proton Boron
- 4.5. North America Nuclear Fusion Market Analysis, Opportunity and Forecast, By Country , 2016-2032
- 4.5.1. North America Nuclear Fusion Market Analysis by Country : Introduction
- 4.5.2. Market Size Absolute $ Opportunity Analysis and Forecast, Country , 2016-2032
- 4.5.2.1. The US
- 4.5.2.2. Canada
- 4.5.2.3. Mexico
- 5. Western Europe Nuclear Fusion Market Analysis, Opportunity and Forecast, 2016-2032
- 5.1. Western Europe Nuclear Fusion Market Analysis, 2016-2021
- 5.2. Western Europe Nuclear Fusion Market Opportunity and Forecast, 2023-2032
- 5.3. Western Europe Nuclear Fusion Market Analysis, Opportunity and Forecast, By By Technology, 2016-2032
- 5.3.1. Western Europe Nuclear Fusion Market Analysis by By Technology: Introduction
- 5.3.2. Market Size Absolute $ Opportunity Analysis and Forecast, By By Technology, 2016-2032
- 5.3.3. Magnetic Confinement
- 5.3.4. Inertial Confinement
- 5.4. Western Europe Nuclear Fusion Market Analysis, Opportunity and Forecast, By By Fuels, 2016-2032
- 5.4.1. Western Europe Nuclear Fusion Market Analysis by By Fuels: Introduction
- 5.4.2. Market Size Absolute $ Opportunity Analysis and Forecast, By By Fuels, 2016-2032
- 5.4.3. Deuterium/tritium
- 5.4.4. Deuterium
- 5.4.5. Deuterium, helium-3
- 5.4.6. Proton Boron
- 5.5. Western Europe Nuclear Fusion Market Analysis, Opportunity and Forecast, By Country , 2016-2032
- 5.5.1. Western Europe Nuclear Fusion Market Analysis by Country : Introduction
- 5.5.2. Market Size Absolute $ Opportunity Analysis and Forecast, Country , 2016-2032
- 5.5.2.1. Germany
- 5.5.2.2. France
- 5.5.2.3. The UK
- 5.5.2.4. Spain
- 5.5.2.5. Italy
- 5.5.2.6. Portugal
- 5.5.2.7. Ireland
- 5.5.2.8. Austria
- 5.5.2.9. Switzerland
- 5.5.2.10. Benelux
- 5.5.2.11. Nordic
- 5.5.2.12. Rest of Western Europe
- 6. Eastern Europe Nuclear Fusion Market Analysis, Opportunity and Forecast, 2016-2032
- 6.1. Eastern Europe Nuclear Fusion Market Analysis, 2016-2021
- 6.2. Eastern Europe Nuclear Fusion Market Opportunity and Forecast, 2023-2032
- 6.3. Eastern Europe Nuclear Fusion Market Analysis, Opportunity and Forecast, By By Technology, 2016-2032
- 6.3.1. Eastern Europe Nuclear Fusion Market Analysis by By Technology: Introduction
- 6.3.2. Market Size Absolute $ Opportunity Analysis and Forecast, By By Technology, 2016-2032
- 6.3.3. Magnetic Confinement
- 6.3.4. Inertial Confinement
- 6.4. Eastern Europe Nuclear Fusion Market Analysis, Opportunity and Forecast, By By Fuels, 2016-2032
- 6.4.1. Eastern Europe Nuclear Fusion Market Analysis by By Fuels: Introduction
- 6.4.2. Market Size Absolute $ Opportunity Analysis and Forecast, By By Fuels, 2016-2032
- 6.4.3. Deuterium/tritium
- 6.4.4. Deuterium
- 6.4.5. Deuterium, helium-3
- 6.4.6. Proton Boron
- 6.5. Eastern Europe Nuclear Fusion Market Analysis, Opportunity and Forecast, By Country , 2016-2032
- 6.5.1. Eastern Europe Nuclear Fusion Market Analysis by Country : Introduction
- 6.5.2. Market Size Absolute $ Opportunity Analysis and Forecast, Country , 2016-2032
- 6.5.2.1. Russia
- 6.5.2.2. Poland
- 6.5.2.3. The Czech Republic
- 6.5.2.4. Greece
- 6.5.2.5. Rest of Eastern Europe
- 7. APAC Nuclear Fusion Market Analysis, Opportunity and Forecast, 2016-2032
- 7.1. APAC Nuclear Fusion Market Analysis, 2016-2021
- 7.2. APAC Nuclear Fusion Market Opportunity and Forecast, 2023-2032
- 7.3. APAC Nuclear Fusion Market Analysis, Opportunity and Forecast, By By Technology, 2016-2032
- 7.3.1. APAC Nuclear Fusion Market Analysis by By Technology: Introduction
- 7.3.2. Market Size Absolute $ Opportunity Analysis and Forecast, By By Technology, 2016-2032
- 7.3.3. Magnetic Confinement
- 7.3.4. Inertial Confinement
- 7.4. APAC Nuclear Fusion Market Analysis, Opportunity and Forecast, By By Fuels, 2016-2032
- 7.4.1. APAC Nuclear Fusion Market Analysis by By Fuels: Introduction
- 7.4.2. Market Size Absolute $ Opportunity Analysis and Forecast, By By Fuels, 2016-2032
- 7.4.3. Deuterium/tritium
- 7.4.4. Deuterium
- 7.4.5. Deuterium, helium-3
- 7.4.6. Proton Boron
- 7.5. APAC Nuclear Fusion Market Analysis, Opportunity and Forecast, By Country , 2016-2032
- 7.5.1. APAC Nuclear Fusion Market Analysis by Country : Introduction
- 7.5.2. Market Size Absolute $ Opportunity Analysis and Forecast, Country , 2016-2032
- 7.5.2.1. China
- 7.5.2.2. Japan
- 7.5.2.3. South Korea
- 7.5.2.4. India
- 7.5.2.5. Australia & New Zeland
- 7.5.2.6. Indonesia
- 7.5.2.7. Malaysia
- 7.5.2.8. Philippines
- 7.5.2.9. Singapore
- 7.5.2.10. Thailand
- 7.5.2.11. Vietnam
- 7.5.2.12. Rest of APAC
- 8. Latin America Nuclear Fusion Market Analysis, Opportunity and Forecast, 2016-2032
- 8.1. Latin America Nuclear Fusion Market Analysis, 2016-2021
- 8.2. Latin America Nuclear Fusion Market Opportunity and Forecast, 2023-2032
- 8.3. Latin America Nuclear Fusion Market Analysis, Opportunity and Forecast, By By Technology, 2016-2032
- 8.3.1. Latin America Nuclear Fusion Market Analysis by By Technology: Introduction
- 8.3.2. Market Size Absolute $ Opportunity Analysis and Forecast, By By Technology, 2016-2032
- 8.3.3. Magnetic Confinement
- 8.3.4. Inertial Confinement
- 8.4. Latin America Nuclear Fusion Market Analysis, Opportunity and Forecast, By By Fuels, 2016-2032
- 8.4.1. Latin America Nuclear Fusion Market Analysis by By Fuels: Introduction
- 8.4.2. Market Size Absolute $ Opportunity Analysis and Forecast, By By Fuels, 2016-2032
- 8.4.3. Deuterium/tritium
- 8.4.4. Deuterium
- 8.4.5. Deuterium, helium-3
- 8.4.6. Proton Boron
- 8.5. Latin America Nuclear Fusion Market Analysis, Opportunity and Forecast, By Country , 2016-2032
- 8.5.1. Latin America Nuclear Fusion Market Analysis by Country : Introduction
- 8.5.2. Market Size Absolute $ Opportunity Analysis and Forecast, Country , 2016-2032
- 8.5.2.1. Brazil
- 8.5.2.2. Colombia
- 8.5.2.3. Chile
- 8.5.2.4. Argentina
- 8.5.2.5. Costa Rica
- 8.5.2.6. Rest of Latin America
- 9. Middle East & Africa Nuclear Fusion Market Analysis, Opportunity and Forecast, 2016-2032
- 9.1. Middle East & Africa Nuclear Fusion Market Analysis, 2016-2021
- 9.2. Middle East & Africa Nuclear Fusion Market Opportunity and Forecast, 2023-2032
- 9.3. Middle East & Africa Nuclear Fusion Market Analysis, Opportunity and Forecast, By By Technology, 2016-2032
- 9.3.1. Middle East & Africa Nuclear Fusion Market Analysis by By Technology: Introduction
- 9.3.2. Market Size Absolute $ Opportunity Analysis and Forecast, By By Technology, 2016-2032
- 9.3.3. Magnetic Confinement
- 9.3.4. Inertial Confinement
- 9.4. Middle East & Africa Nuclear Fusion Market Analysis, Opportunity and Forecast, By By Fuels, 2016-2032
- 9.4.1. Middle East & Africa Nuclear Fusion Market Analysis by By Fuels: Introduction
- 9.4.2. Market Size Absolute $ Opportunity Analysis and Forecast, By By Fuels, 2016-2032
- 9.4.3. Deuterium/tritium
- 9.4.4. Deuterium
- 9.4.5. Deuterium, helium-3
- 9.4.6. Proton Boron
- 9.5. Middle East & Africa Nuclear Fusion Market Analysis, Opportunity and Forecast, By Country , 2016-2032
- 9.5.1. Middle East & Africa Nuclear Fusion Market Analysis by Country : Introduction
- 9.5.2. Market Size Absolute $ Opportunity Analysis and Forecast, Country , 2016-2032
- 9.5.2.1. Algeria
- 9.5.2.2. Egypt
- 9.5.2.3. Israel
- 9.5.2.4. Kuwait
- 9.5.2.5. Nigeria
- 9.5.2.6. Saudi Arabia
- 9.5.2.7. South Africa
- 9.5.2.8. Turkey
- 9.5.2.9. The UAE
- 9.5.2.10. Rest of MEA
- 10. Global Nuclear Fusion Market Analysis, Opportunity and Forecast, By Region , 2016-2032
- 10.1. Global Nuclear Fusion Market Analysis by Region : Introduction
- 10.2. Market Size Absolute $ Opportunity Analysis and Forecast, By Region , 2016-2032
- 10.2.1. North America
- 10.2.2. Western Europe
- 10.2.3. Eastern Europe
- 10.2.4. APAC
- 10.2.5. Latin America
- 10.2.6. Middle East & Africa
- 11. Global Nuclear Fusion Market Competitive Landscape, Market Share Analysis, and Company Profiles
- 11.1. Market Share Analysis
- 11.2. Company Profiles
- 11.3. Zap Energy
- 11.3.1. Company Overview
- 11.3.2. Financial Highlights
- 11.3.3. Product Portfolio
- 11.3.4. SWOT Analysis
- 11.3.5. Key Strategies and Developments
- 11.4. First Light Fusion
- 11.4.1. Company Overview
- 11.4.2. Financial Highlights
- 11.4.3. Product Portfolio
- 11.4.4. SWOT Analysis
- 11.4.5. Key Strategies and Developments
- 11.5. General Fusion
- 11.5.1. Company Overview
- 11.5.2. Financial Highlights
- 11.5.3. Product Portfolio
- 11.5.4. SWOT Analysis
- 11.5.5. Key Strategies and Developments
- 11.6. TAE Technologies
- 11.6.1. Company Overview
- 11.6.2. Financial Highlights
- 11.6.3. Product Portfolio
- 11.6.4. SWOT Analysis
- 11.6.5. Key Strategies and Developments
- 11.7. Commonwealth Fusion
- 11.7.1. Company Overview
- 11.7.2. Financial Highlights
- 11.7.3. Product Portfolio
- 11.7.4. SWOT Analysis
- 11.7.5. Key Strategies and Developments
- 11.8. Tokamak Energy
- 11.8.1. Company Overview
- 11.8.2. Financial Highlights
- 11.8.3. Product Portfolio
- 11.8.4. SWOT Analysis
- 11.8.5. Key Strategies and Developments
- 11.9. Lockheed Martin
- 11.9.1. Company Overview
- 11.9.2. Financial Highlights
- 11.9.3. Product Portfolio
- 11.9.4. SWOT Analysis
- 11.9.5. Key Strategies and Developments
- 11.10. Hyperjet Fusion
- 11.10.1. Company Overview
- 11.10.2. Financial Highlights
- 11.10.3. Product Portfolio
- 11.10.4. SWOT Analysis
- 11.10.5. Key Strategies and Developments
- 11.11. Marvel Fusion
- 11.11.1. Company Overview
- 11.11.2. Financial Highlights
- 11.11.3. Product Portfolio
- 11.11.4. SWOT Analysis
- 11.11.5. Key Strategies and Developments
- 11.12. Helion
- 11.12.1. Company Overview
- 11.12.2. Financial Highlights
- 11.12.3. Product Portfolio
- 11.12.4. SWOT Analysis
- 11.12.5. Key Strategies and Developments
- 11.13.1. Company Overview
- 11.13.2. Financial Highlights
- 11.13.3. Product Portfolio
- 11.13.4. SWOT Analysis
- 11.13.5. Key Strategies and Developments
- 11.14. HB11
- 11.14.1. Company Overview
- 11.14.2. Financial Highlights
- 11.14.3. Product Portfolio
- 11.14.4. SWOT Analysis
- 11.14.5. Key Strategies and Developments
- 12. Assumptions and Acronyms
- 13. Research Methodology
- 14. Contact
"
- List of Figures
- "
- Figure 1: Global Nuclear Fusion Market Revenue (US$ Mn) Market Share by By Technology in 2022
- Figure 2: Global Nuclear Fusion Market Market Attractiveness Analysis by By Technology, 2016-2032
- Figure 3: Global Nuclear Fusion Market Revenue (US$ Mn) Market Share by By Fuelsin 2022
- Figure 4: Global Nuclear Fusion Market Market Attractiveness Analysis by By Fuels, 2016-2032
- Figure 5: Global Nuclear Fusion Market Revenue (US$ Mn) Market Share by Region in 2022
- Figure 6: Global Nuclear Fusion Market Market Attractiveness Analysis by Region, 2016-2032
- Figure 7: Global Nuclear Fusion Market Market Revenue (US$ Mn) (2016-2032)
- Figure 8: Global Nuclear Fusion Market Market Revenue (US$ Mn) Comparison by Region (2016-2032)
- Figure 9: Global Nuclear Fusion Market Market Revenue (US$ Mn) Comparison by By Technology (2016-2032)
- Figure 10: Global Nuclear Fusion Market Market Revenue (US$ Mn) Comparison by By Fuels (2016-2032)
- Figure 11: Global Nuclear Fusion Market Market Y-o-Y Growth Rate Comparison by Region (2016-2032)
- Figure 12: Global Nuclear Fusion Market Market Y-o-Y Growth Rate Comparison by By Technology (2016-2032)
- Figure 13: Global Nuclear Fusion Market Market Y-o-Y Growth Rate Comparison by By Fuels (2016-2032)
- Figure 14: Global Nuclear Fusion Market Market Share Comparison by Region (2016-2032)
- Figure 15: Global Nuclear Fusion Market Market Share Comparison by By Technology (2016-2032)
- Figure 16: Global Nuclear Fusion Market Market Share Comparison by By Fuels (2016-2032)
- Figure 17: North America Nuclear Fusion Market Revenue (US$ Mn) Market Share by By Technologyin 2022
- Figure 18: North America Nuclear Fusion Market Market Attractiveness Analysis by By Technology, 2016-2032
- Figure 19: North America Nuclear Fusion Market Revenue (US$ Mn) Market Share by By Fuelsin 2022
- Figure 20: North America Nuclear Fusion Market Market Attractiveness Analysis by By Fuels, 2016-2032
- Figure 21: North America Nuclear Fusion Market Revenue (US$ Mn) Market Share by Country in 2022
- Figure 22: North America Nuclear Fusion Market Market Attractiveness Analysis by Country, 2016-2032
- Figure 23: North America Nuclear Fusion Market Market Revenue (US$ Mn) (2016-2032)
- Figure 24: North America Nuclear Fusion Market Market Revenue (US$ Mn) Comparison by Country (2016-2032)
- Figure 25: North America Nuclear Fusion Market Market Revenue (US$ Mn) Comparison by By Technology (2016-2032)
- Figure 26: North America Nuclear Fusion Market Market Revenue (US$ Mn) Comparison by By Fuels (2016-2032)
- Figure 27: North America Nuclear Fusion Market Market Y-o-Y Growth Rate Comparison by Country (2016-2032)
- Figure 28: North America Nuclear Fusion Market Market Y-o-Y Growth Rate Comparison by By Technology (2016-2032)
- Figure 29: North America Nuclear Fusion Market Market Y-o-Y Growth Rate Comparison by By Fuels (2016-2032)
- Figure 30: North America Nuclear Fusion Market Market Share Comparison by Country (2016-2032)
- Figure 31: North America Nuclear Fusion Market Market Share Comparison by By Technology (2016-2032)
- Figure 32: North America Nuclear Fusion Market Market Share Comparison by By Fuels (2016-2032)
- Figure 33: Western Europe Nuclear Fusion Market Revenue (US$ Mn) Market Share by By Technologyin 2022
- Figure 34: Western Europe Nuclear Fusion Market Market Attractiveness Analysis by By Technology, 2016-2032
- Figure 35: Western Europe Nuclear Fusion Market Revenue (US$ Mn) Market Share by By Fuelsin 2022
- Figure 36: Western Europe Nuclear Fusion Market Market Attractiveness Analysis by By Fuels, 2016-2032
- Figure 37: Western Europe Nuclear Fusion Market Revenue (US$ Mn) Market Share by Country in 2022
- Figure 38: Western Europe Nuclear Fusion Market Market Attractiveness Analysis by Country, 2016-2032
- Figure 39: Western Europe Nuclear Fusion Market Market Revenue (US$ Mn) (2016-2032)
- Figure 40: Western Europe Nuclear Fusion Market Market Revenue (US$ Mn) Comparison by Country (2016-2032)
- Figure 41: Western Europe Nuclear Fusion Market Market Revenue (US$ Mn) Comparison by By Technology (2016-2032)
- Figure 42: Western Europe Nuclear Fusion Market Market Revenue (US$ Mn) Comparison by By Fuels (2016-2032)
- Figure 43: Western Europe Nuclear Fusion Market Market Y-o-Y Growth Rate Comparison by Country (2016-2032)
- Figure 44: Western Europe Nuclear Fusion Market Market Y-o-Y Growth Rate Comparison by By Technology (2016-2032)
- Figure 45: Western Europe Nuclear Fusion Market Market Y-o-Y Growth Rate Comparison by By Fuels (2016-2032)
- Figure 46: Western Europe Nuclear Fusion Market Market Share Comparison by Country (2016-2032)
- Figure 47: Western Europe Nuclear Fusion Market Market Share Comparison by By Technology (2016-2032)
- Figure 48: Western Europe Nuclear Fusion Market Market Share Comparison by By Fuels (2016-2032)
- Figure 49: Eastern Europe Nuclear Fusion Market Revenue (US$ Mn) Market Share by By Technologyin 2022
- Figure 50: Eastern Europe Nuclear Fusion Market Market Attractiveness Analysis by By Technology, 2016-2032
- Figure 51: Eastern Europe Nuclear Fusion Market Revenue (US$ Mn) Market Share by By Fuelsin 2022
- Figure 52: Eastern Europe Nuclear Fusion Market Market Attractiveness Analysis by By Fuels, 2016-2032
- Figure 53: Eastern Europe Nuclear Fusion Market Revenue (US$ Mn) Market Share by Country in 2022
- Figure 54: Eastern Europe Nuclear Fusion Market Market Attractiveness Analysis by Country, 2016-2032
- Figure 55: Eastern Europe Nuclear Fusion Market Market Revenue (US$ Mn) (2016-2032)
- Figure 56: Eastern Europe Nuclear Fusion Market Market Revenue (US$ Mn) Comparison by Country (2016-2032)
- Figure 57: Eastern Europe Nuclear Fusion Market Market Revenue (US$ Mn) Comparison by By Technology (2016-2032)
- Figure 58: Eastern Europe Nuclear Fusion Market Market Revenue (US$ Mn) Comparison by By Fuels (2016-2032)
- Figure 59: Eastern Europe Nuclear Fusion Market Market Y-o-Y Growth Rate Comparison by Country (2016-2032)
- Figure 60: Eastern Europe Nuclear Fusion Market Market Y-o-Y Growth Rate Comparison by By Technology (2016-2032)
- Figure 61: Eastern Europe Nuclear Fusion Market Market Y-o-Y Growth Rate Comparison by By Fuels (2016-2032)
- Figure 62: Eastern Europe Nuclear Fusion Market Market Share Comparison by Country (2016-2032)
- Figure 63: Eastern Europe Nuclear Fusion Market Market Share Comparison by By Technology (2016-2032)
- Figure 64: Eastern Europe Nuclear Fusion Market Market Share Comparison by By Fuels (2016-2032)
- Figure 65: APAC Nuclear Fusion Market Revenue (US$ Mn) Market Share by By Technologyin 2022
- Figure 66: APAC Nuclear Fusion Market Market Attractiveness Analysis by By Technology, 2016-2032
- Figure 67: APAC Nuclear Fusion Market Revenue (US$ Mn) Market Share by By Fuelsin 2022
- Figure 68: APAC Nuclear Fusion Market Market Attractiveness Analysis by By Fuels, 2016-2032
- Figure 69: APAC Nuclear Fusion Market Revenue (US$ Mn) Market Share by Country in 2022
- Figure 70: APAC Nuclear Fusion Market Market Attractiveness Analysis by Country, 2016-2032
- Figure 71: APAC Nuclear Fusion Market Market Revenue (US$ Mn) (2016-2032)
- Figure 72: APAC Nuclear Fusion Market Market Revenue (US$ Mn) Comparison by Country (2016-2032)
- Figure 73: APAC Nuclear Fusion Market Market Revenue (US$ Mn) Comparison by By Technology (2016-2032)
- Figure 74: APAC Nuclear Fusion Market Market Revenue (US$ Mn) Comparison by By Fuels (2016-2032)
- Figure 75: APAC Nuclear Fusion Market Market Y-o-Y Growth Rate Comparison by Country (2016-2032)
- Figure 76: APAC Nuclear Fusion Market Market Y-o-Y Growth Rate Comparison by By Technology (2016-2032)
- Figure 77: APAC Nuclear Fusion Market Market Y-o-Y Growth Rate Comparison by By Fuels (2016-2032)
- Figure 78: APAC Nuclear Fusion Market Market Share Comparison by Country (2016-2032)
- Figure 79: APAC Nuclear Fusion Market Market Share Comparison by By Technology (2016-2032)
- Figure 80: APAC Nuclear Fusion Market Market Share Comparison by By Fuels (2016-2032)
- Figure 81: Latin America Nuclear Fusion Market Revenue (US$ Mn) Market Share by By Technologyin 2022
- Figure 82: Latin America Nuclear Fusion Market Market Attractiveness Analysis by By Technology, 2016-2032
- Figure 83: Latin America Nuclear Fusion Market Revenue (US$ Mn) Market Share by By Fuelsin 2022
- Figure 84: Latin America Nuclear Fusion Market Market Attractiveness Analysis by By Fuels, 2016-2032
- Figure 85: Latin America Nuclear Fusion Market Revenue (US$ Mn) Market Share by Country in 2022
- Figure 86: Latin America Nuclear Fusion Market Market Attractiveness Analysis by Country, 2016-2032
- Figure 87: Latin America Nuclear Fusion Market Market Revenue (US$ Mn) (2016-2032)
- Figure 88: Latin America Nuclear Fusion Market Market Revenue (US$ Mn) Comparison by Country (2016-2032)
- Figure 89: Latin America Nuclear Fusion Market Market Revenue (US$ Mn) Comparison by By Technology (2016-2032)
- Figure 90: Latin America Nuclear Fusion Market Market Revenue (US$ Mn) Comparison by By Fuels (2016-2032)
- Figure 91: Latin America Nuclear Fusion Market Market Y-o-Y Growth Rate Comparison by Country (2016-2032)
- Figure 92: Latin America Nuclear Fusion Market Market Y-o-Y Growth Rate Comparison by By Technology (2016-2032)
- Figure 93: Latin America Nuclear Fusion Market Market Y-o-Y Growth Rate Comparison by By Fuels (2016-2032)
- Figure 94: Latin America Nuclear Fusion Market Market Share Comparison by Country (2016-2032)
- Figure 95: Latin America Nuclear Fusion Market Market Share Comparison by By Technology (2016-2032)
- Figure 96: Latin America Nuclear Fusion Market Market Share Comparison by By Fuels (2016-2032)
- Figure 97: Middle East & Africa Nuclear Fusion Market Revenue (US$ Mn) Market Share by By Technologyin 2022
- Figure 98: Middle East & Africa Nuclear Fusion Market Market Attractiveness Analysis by By Technology, 2016-2032
- Figure 99: Middle East & Africa Nuclear Fusion Market Revenue (US$ Mn) Market Share by By Fuelsin 2022
- Figure 100: Middle East & Africa Nuclear Fusion Market Market Attractiveness Analysis by By Fuels, 2016-2032
- Figure 101: Middle East & Africa Nuclear Fusion Market Revenue (US$ Mn) Market Share by Country in 2022
- Figure 102: Middle East & Africa Nuclear Fusion Market Market Attractiveness Analysis by Country, 2016-2032
- Figure 103: Middle East & Africa Nuclear Fusion Market Market Revenue (US$ Mn) (2016-2032)
- Figure 104: Middle East & Africa Nuclear Fusion Market Market Revenue (US$ Mn) Comparison by Country (2016-2032)
- Figure 105: Middle East & Africa Nuclear Fusion Market Market Revenue (US$ Mn) Comparison by By Technology (2016-2032)
- Figure 106: Middle East & Africa Nuclear Fusion Market Market Revenue (US$ Mn) Comparison by By Fuels (2016-2032)
- Figure 107: Middle East & Africa Nuclear Fusion Market Market Y-o-Y Growth Rate Comparison by Country (2016-2032)
- Figure 108: Middle East & Africa Nuclear Fusion Market Market Y-o-Y Growth Rate Comparison by By Technology (2016-2032)
- Figure 109: Middle East & Africa Nuclear Fusion Market Market Y-o-Y Growth Rate Comparison by By Fuels (2016-2032)
- Figure 110: Middle East & Africa Nuclear Fusion Market Market Share Comparison by Country (2016-2032)
- Figure 111: Middle East & Africa Nuclear Fusion Market Market Share Comparison by By Technology (2016-2032)
- Figure 112: Middle East & Africa Nuclear Fusion Market Market Share Comparison by By Fuels (2016-2032)
"
- List of Tables
- "
- Table 1: Global Nuclear Fusion Market Market Comparison by By Technology (2016-2032)
- Table 2: Global Nuclear Fusion Market Market Comparison by By Fuels (2016-2032)
- Table 3: Global Nuclear Fusion Market Revenue (US$ Mn) Comparison by Region (2016-2032)
- Table 4: Global Nuclear Fusion Market Market Revenue (US$ Mn) (2016-2032)
- Table 5: Global Nuclear Fusion Market Market Revenue (US$ Mn) Comparison by Region (2016-2032)
- Table 6: Global Nuclear Fusion Market Market Revenue (US$ Mn) Comparison by By Technology (2016-2032)
- Table 7: Global Nuclear Fusion Market Market Revenue (US$ Mn) Comparison by By Fuels (2016-2032)
- Table 8: Global Nuclear Fusion Market Market Y-o-Y Growth Rate Comparison by Region (2016-2032)
- Table 9: Global Nuclear Fusion Market Market Y-o-Y Growth Rate Comparison by By Technology (2016-2032)
- Table 10: Global Nuclear Fusion Market Market Y-o-Y Growth Rate Comparison by By Fuels (2016-2032)
- Table 11: Global Nuclear Fusion Market Market Share Comparison by Region (2016-2032)
- Table 12: Global Nuclear Fusion Market Market Share Comparison by By Technology (2016-2032)
- Table 13: Global Nuclear Fusion Market Market Share Comparison by By Fuels (2016-2032)
- Table 14: North America Nuclear Fusion Market Market Comparison by By Fuels (2016-2032)
- Table 15: North America Nuclear Fusion Market Revenue (US$ Mn) Comparison by Country (2016-2032)
- Table 16: North America Nuclear Fusion Market Market Revenue (US$ Mn) (2016-2032)
- Table 17: North America Nuclear Fusion Market Market Revenue (US$ Mn) Comparison by Country (2016-2032)
- Table 18: North America Nuclear Fusion Market Market Revenue (US$ Mn) Comparison by By Technology (2016-2032)
- Table 19: North America Nuclear Fusion Market Market Revenue (US$ Mn) Comparison by By Fuels (2016-2032)
- Table 20: North America Nuclear Fusion Market Market Y-o-Y Growth Rate Comparison by Country (2016-2032)
- Table 21: North America Nuclear Fusion Market Market Y-o-Y Growth Rate Comparison by By Technology (2016-2032)
- Table 22: North America Nuclear Fusion Market Market Y-o-Y Growth Rate Comparison by By Fuels (2016-2032)
- Table 23: North America Nuclear Fusion Market Market Share Comparison by Country (2016-2032)
- Table 24: North America Nuclear Fusion Market Market Share Comparison by By Technology (2016-2032)
- Table 25: North America Nuclear Fusion Market Market Share Comparison by By Fuels (2016-2032)
- Table 26: Western Europe Nuclear Fusion Market Market Comparison by By Technology (2016-2032)
- Table 27: Western Europe Nuclear Fusion Market Market Comparison by By Fuels (2016-2032)
- Table 28: Western Europe Nuclear Fusion Market Revenue (US$ Mn) Comparison by Country (2016-2032)
- Table 29: Western Europe Nuclear Fusion Market Market Revenue (US$ Mn) (2016-2032)
- Table 30: Western Europe Nuclear Fusion Market Market Revenue (US$ Mn) Comparison by Country (2016-2032)
- Table 31: Western Europe Nuclear Fusion Market Market Revenue (US$ Mn) Comparison by By Technology (2016-2032)
- Table 32: Western Europe Nuclear Fusion Market Market Revenue (US$ Mn) Comparison by By Fuels (2016-2032)
- Table 33: Western Europe Nuclear Fusion Market Market Y-o-Y Growth Rate Comparison by Country (2016-2032)
- Table 34: Western Europe Nuclear Fusion Market Market Y-o-Y Growth Rate Comparison by By Technology (2016-2032)
- Table 35: Western Europe Nuclear Fusion Market Market Y-o-Y Growth Rate Comparison by By Fuels (2016-2032)
- Table 36: Western Europe Nuclear Fusion Market Market Share Comparison by Country (2016-2032)
- Table 37: Western Europe Nuclear Fusion Market Market Share Comparison by By Technology (2016-2032)
- Table 38: Western Europe Nuclear Fusion Market Market Share Comparison by By Fuels (2016-2032)
- Table 39: Eastern Europe Nuclear Fusion Market Market Comparison by By Technology (2016-2032)
- Table 40: Eastern Europe Nuclear Fusion Market Market Comparison by By Fuels (2016-2032)
- Table 41: Eastern Europe Nuclear Fusion Market Revenue (US$ Mn) Comparison by Country (2016-2032)
- Table 42: Eastern Europe Nuclear Fusion Market Market Revenue (US$ Mn) (2016-2032)
- Table 43: Eastern Europe Nuclear Fusion Market Market Revenue (US$ Mn) Comparison by Country (2016-2032)
- Table 44: Eastern Europe Nuclear Fusion Market Market Revenue (US$ Mn) Comparison by By Technology (2016-2032)
- Table 45: Eastern Europe Nuclear Fusion Market Market Revenue (US$ Mn) Comparison by By Fuels (2016-2032)
- Table 46: Eastern Europe Nuclear Fusion Market Market Y-o-Y Growth Rate Comparison by Country (2016-2032)
- Table 47: Eastern Europe Nuclear Fusion Market Market Y-o-Y Growth Rate Comparison by By Technology (2016-2032)
- Table 48: Eastern Europe Nuclear Fusion Market Market Y-o-Y Growth Rate Comparison by By Fuels (2016-2032)
- Table 49: Eastern Europe Nuclear Fusion Market Market Share Comparison by Country (2016-2032)
- Table 50: Eastern Europe Nuclear Fusion Market Market Share Comparison by By Technology (2016-2032)
- Table 51: Eastern Europe Nuclear Fusion Market Market Share Comparison by By Fuels (2016-2032)
- Table 52: APAC Nuclear Fusion Market Market Comparison by By Technology (2016-2032)
- Table 53: APAC Nuclear Fusion Market Market Comparison by By Fuels (2016-2032)
- Table 54: APAC Nuclear Fusion Market Revenue (US$ Mn) Comparison by Country (2016-2032)
- Table 55: APAC Nuclear Fusion Market Market Revenue (US$ Mn) (2016-2032)
- Table 56: APAC Nuclear Fusion Market Market Revenue (US$ Mn) Comparison by Country (2016-2032)
- Table 57: APAC Nuclear Fusion Market Market Revenue (US$ Mn) Comparison by By Technology (2016-2032)
- Table 58: APAC Nuclear Fusion Market Market Revenue (US$ Mn) Comparison by By Fuels (2016-2032)
- Table 59: APAC Nuclear Fusion Market Market Y-o-Y Growth Rate Comparison by Country (2016-2032)
- Table 60: APAC Nuclear Fusion Market Market Y-o-Y Growth Rate Comparison by By Technology (2016-2032)
- Table 61: APAC Nuclear Fusion Market Market Y-o-Y Growth Rate Comparison by By Fuels (2016-2032)
- Table 62: APAC Nuclear Fusion Market Market Share Comparison by Country (2016-2032)
- Table 63: APAC Nuclear Fusion Market Market Share Comparison by By Technology (2016-2032)
- Table 64: APAC Nuclear Fusion Market Market Share Comparison by By Fuels (2016-2032)
- Table 65: Latin America Nuclear Fusion Market Market Comparison by By Technology (2016-2032)
- Table 66: Latin America Nuclear Fusion Market Market Comparison by By Fuels (2016-2032)
- Table 67: Latin America Nuclear Fusion Market Revenue (US$ Mn) Comparison by Country (2016-2032)
- Table 68: Latin America Nuclear Fusion Market Market Revenue (US$ Mn) (2016-2032)
- Table 69: Latin America Nuclear Fusion Market Market Revenue (US$ Mn) Comparison by Country (2016-2032)
- Table 70: Latin America Nuclear Fusion Market Market Revenue (US$ Mn) Comparison by By Technology (2016-2032)
- Table 71: Latin America Nuclear Fusion Market Market Revenue (US$ Mn) Comparison by By Fuels (2016-2032)
- Table 72: Latin America Nuclear Fusion Market Market Y-o-Y Growth Rate Comparison by Country (2016-2032)
- Table 73: Latin America Nuclear Fusion Market Market Y-o-Y Growth Rate Comparison by By Technology (2016-2032)
- Table 74: Latin America Nuclear Fusion Market Market Y-o-Y Growth Rate Comparison by By Fuels (2016-2032)
- Table 75: Latin America Nuclear Fusion Market Market Share Comparison by Country (2016-2032)
- Table 76: Latin America Nuclear Fusion Market Market Share Comparison by By Technology (2016-2032)
- Table 77: Latin America Nuclear Fusion Market Market Share Comparison by By Fuels (2016-2032)
- Table 78: Middle East & Africa Nuclear Fusion Market Market Comparison by By Technology (2016-2032)
- Table 79: Middle East & Africa Nuclear Fusion Market Market Comparison by By Fuels (2016-2032)
- Table 80: Middle East & Africa Nuclear Fusion Market Revenue (US$ Mn) Comparison by Country (2016-2032)
- Table 81: Middle East & Africa Nuclear Fusion Market Market Revenue (US$ Mn) (2016-2032)
- Table 82: Middle East & Africa Nuclear Fusion Market Market Revenue (US$ Mn) Comparison by Country (2016-2032)
- Table 83: Middle East & Africa Nuclear Fusion Market Market Revenue (US$ Mn) Comparison by By Technology (2016-2032)
- Table 84: Middle East & Africa Nuclear Fusion Market Market Revenue (US$ Mn) Comparison by By Fuels (2016-2032)
- Table 85: Middle East & Africa Nuclear Fusion Market Market Y-o-Y Growth Rate Comparison by Country (2016-2032)
- Table 86: Middle East & Africa Nuclear Fusion Market Market Y-o-Y Growth Rate Comparison by By Technology (2016-2032)
- Table 87: Middle East & Africa Nuclear Fusion Market Market Y-o-Y Growth Rate Comparison by By Fuels (2016-2032)
- Table 88: Middle East & Africa Nuclear Fusion Market Market Share Comparison by Country (2016-2032)
- Table 89: Middle East & Africa Nuclear Fusion Market Market Share Comparison by By Technology (2016-2032)
- Table 90: Middle East & Africa Nuclear Fusion Market Market Share Comparison by By Fuels (2016-2032)
- 1. Executive Summary
-
Our Clients


View Our Licence Options
