
Neuromorphic Computing Market By Component (Hardware, Software, and Services), By Deployment Mode (Edge Computing, and Cloud Computing), By End-Use(Consumer Electronics, Automotive and Others), By Application(Signal Processing, Image Processing and Others) By Region And Companies - Industry Segment Outlook, Market Assessment, Competition Scenario, Trends, And Forecast Period 2024-2033
-
51219
-
Sept 2024
-
378
-


-
This report was compiled by Vishwa Gaul Vishwa is an experienced market research and consulting professional with over 8 years of expertise in the ICT industry, contributing to over 700 reports across telecommunications, software, hardware, and digital solutions. Correspondence Team Lead- ICT Linkedin | Detailed Market research Methodology Our methodology involves a mix of primary research, including interviews with leading mental health experts, and secondary research from reputable medical journals and databases. View Detailed Methodology Page
-
Quick Navigation
- Report Overview
- Key Takeaways
- Driving factors
- Restraining Factors
- By Component Analysis
- By Deployment Analysis
- By End-Use Analysis
- By Application Analysis
- Key Market Segments
- Growth Opportunity
- Latest Trends
- Regional Analysis
- North America Leads the Neuromorphic Computing Market with 40.1% Largest Share
- Key Players Analysis
- Recent Developments
- Report Scope
Report Overview
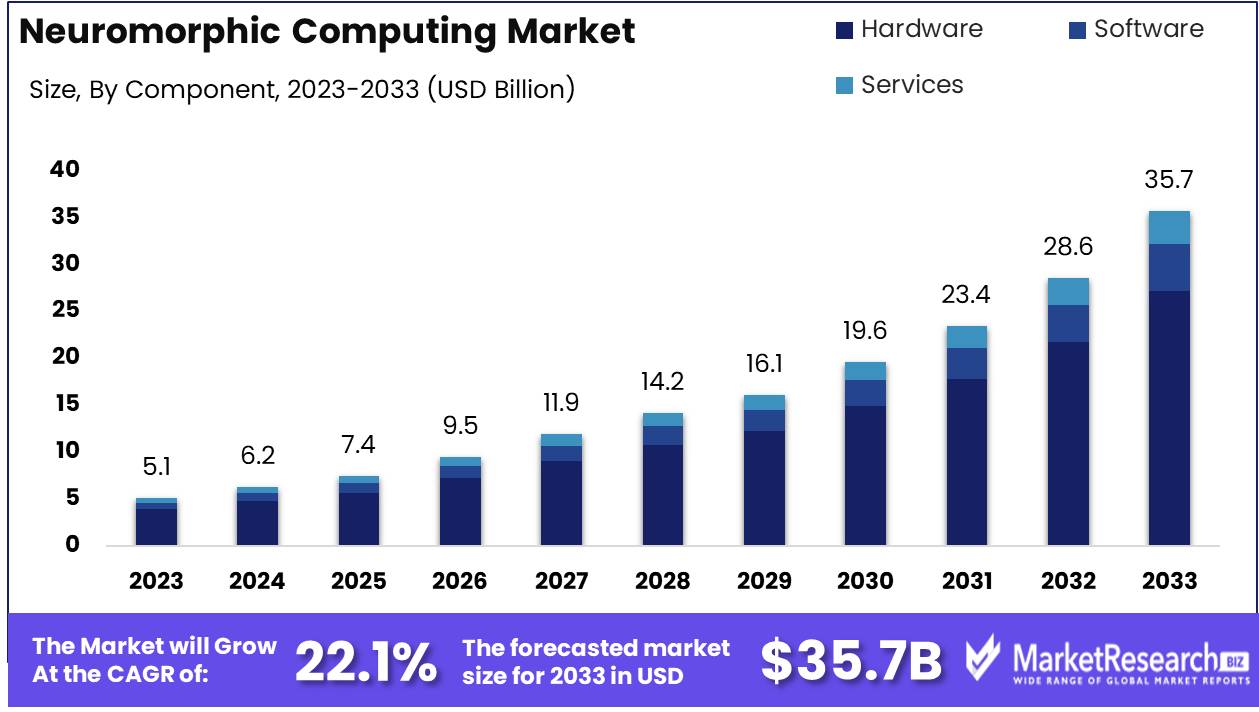
Neuromorphic Computing Market size was valued at USD 5.1 Billion in 2023. It is expected to reach USD 35.7 Billion by 2033, with a Compound annual growth rate (CAGR) of 22.1% during the forecast period from 2024 to 2033.
The Neuromorphic Computing Market focuses on the development and deployment of advanced technologies that mimic the architecture and functioning of the human brain, enhancing computing efficiency. By using artificial neurons and synapses to process information akin to biological neural networks, neuromorphic systems offer substantial improvements in speed, energy efficiency, and cognitive capabilities compared to traditional computing architectures. This technology is poised to revolutionize key sectors such as aerospace & defense and self-driving cars, where real-time data processing and decision-making are critical. Neuromorphic computing also holds transformative potential in fields like artificial intelligence, machine learning, and deep learning, enabling highly efficient, low-power solutions for complex problem-solving and edge computing applications.
The Neuromorphic Computing Market is poised for transformative growth, driven by substantial investments and the expanding integration of artificial intelligence (AI) across diverse industry verticals. Foremost companies including Intel, IBM, and Samsung are channeling substantial resources into neuromorphic technologies, heralding a paradigm shift away from conventional computing architectures towards more advanced AI and robotics applications. This strategic pivot is anticipated to unlock significant advancements and efficiencies, propelling the market forward.
Recent funding activities underscore the market's dynamic nature and its appeal to investors. In 2023, SynSense garnered an additional USD 10 million led by Ausvic Capital, earmarked for ramping up the production of their Speck smart vision sensor. This sensor integrates a neuromorphic AI processor, showcasing the potential of neuromorphic technology in commercial applications. Furthermore, notable developments such as BrainChip Holdings’ collaboration with Lorser Industries to leverage the Akida™ technology in software-defined radio devices exemplify the market’s innovative trajectory. Similarly, Prophesee's release of the GenX320 Event-based Metavision sensor in October 2023, which caters to ultra-low-power Edge AI vision devices, illustrates the expanding applications of neuromorphic computing in cutting-edge markets like AR/VR and security systems.
Intel’s collaborations, notably with the Italian Institute of Technology and the Technical University of Munich, are refining neural network-based learning methods specifically tailored for robotic applications, enhancing the capabilities of neuromorphic computing to process and analyze data more efficiently. This growing trend not only highlights the inherent scalability and efficiency of neuromorphic technologies but also aligns with the rising demand for AI and machine learning solutions across various sectors. Collectively, these developments signify a robust, forward-moving trajectory for the neuromorphic computing market, cementing its critical role in shaping the future landscape of global technology and innovation.
Key Takeaways
- Market Growth: The Neuromorphic Computing market is projected to grow from USD 5.1 billion in 2023 to USD 35.7 billion by 2033, driven by a robust CAGR of 22.1%.
- By Component: Hardware segment dominated the Neuromorphic Computing Market in 2023, capturing over 76% revenue market share.
- By Deployment: Edge Computing dominated the Neuromorphic Computing Market in 2023, capturing over 67.2% of the largest market share due to its real-time, low-latency processing capabilities.
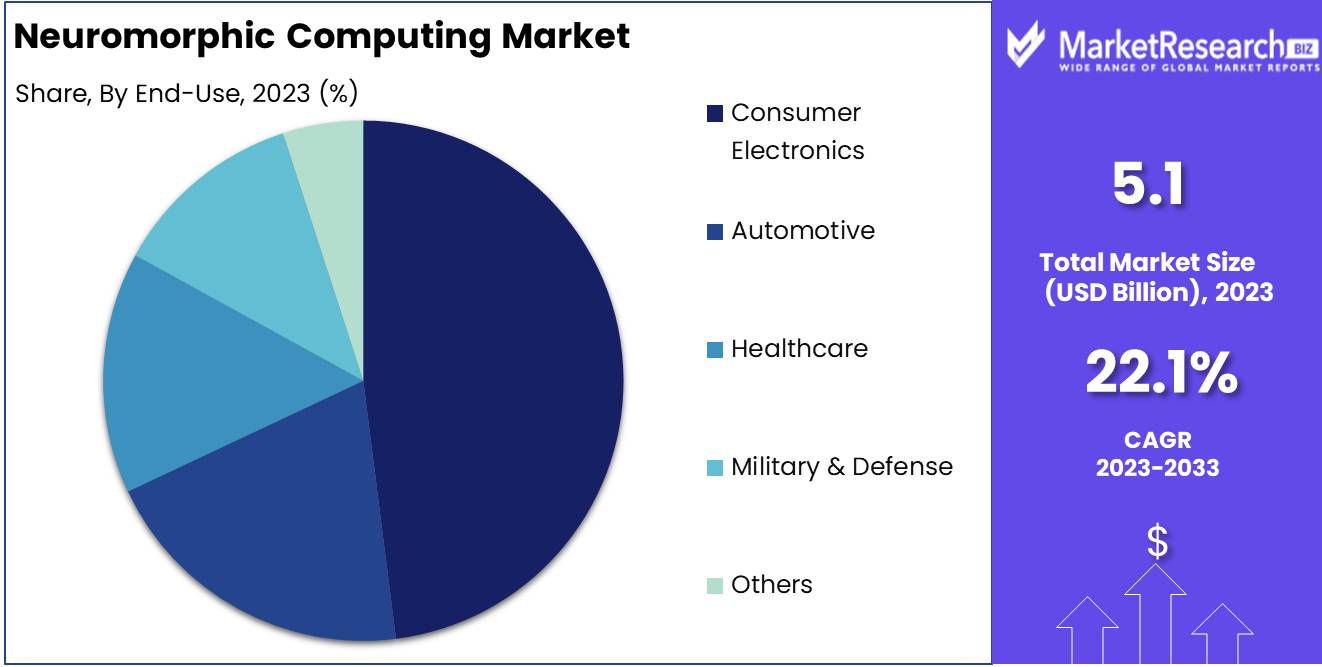
- By End-Use: Consumer Electronics dominated the Neuromorphic Computing Market in 2023, capturing 48.1% of the market share.
- By Application : Image Processing led the Neuromorphic Computing Market in 2023, holding a dominant 48% share due to its widespread adoption in advanced analytics and machine vision technologies.
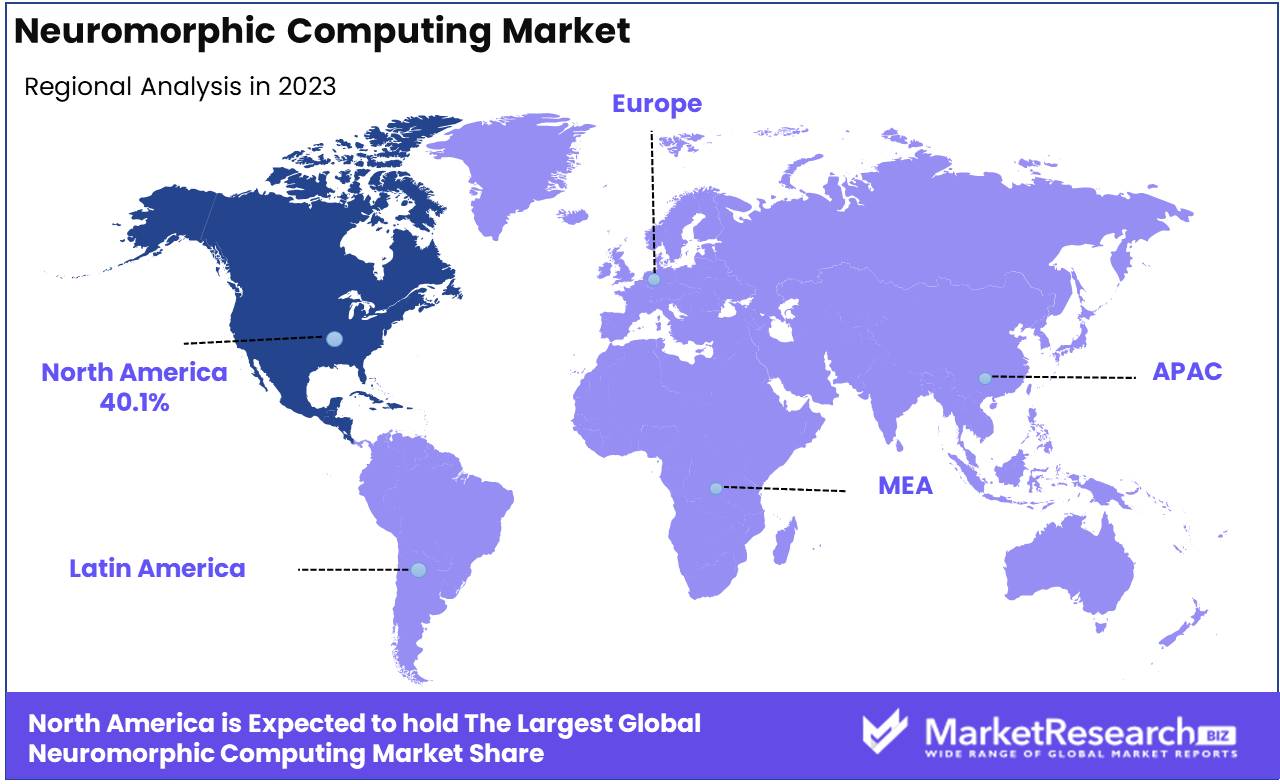
- Regional Growth: North America leads the neuromorphic computing market with a 40.1% share, driven by strong R&D and major AI investments in the U.S.
- Growth Opportunity: Expansion in AI and IoT applications, particularly in real-time data processing and decision-making, presents a substantial growth opportunity for neuromorphic computing.
- Restraining Factor: Limited software compatibility and knowledge gaps hinder the broader adoption of neuromorphic systems, stalling innovation and integration across industries.
Driving factors
The rising demand for Artificial Intelligence (AI) and Machine Learning (ML) is accelerating the growth of the neuromorphic computing market, driven by its application across a wide range of industries. As sectors like healthcare, autonomous vehicles, robotics, and natural language processing increasingly adopt AI, neuromorphic systems designed to mimic the neural networks of the human brain are becoming essential in enhancing the efficiency, speed, and energy consumption of advanced electronic devices.
AI and ML require advanced computing architectures capable of processing vast datasets in real-time, posing limitations for traditional computing systems. Neuromorphic computing’s ability to facilitate parallel processing while minimizing energy usage makes it an attractive solution for supporting AI-driven tasks. According to a recent market research report, with global AI spending projected to reach USD 300 billion by 2026, the synergy between AI advancements and neuromorphic technology is expected to fuel the latter's impressive CAGR of 22.1% over the next decade.
Development of Real-Time Learning Algorithms Drives Innovation and Market Demand
The creation of real-time learning algorithms—central to neuromorphic computing—enhances system adaptability and efficiency, addressing dynamic, real-world problems more effectively than conventional computing architectures. These algorithms enable neuromorphic processors to learn and adapt on-the-fly, mimicking the brain's plasticity and improving performance in AI and ML applications that require continuous learning, such as autonomous systems and IoT devices. This ability to process data instantly and evolve in real-time underpins the rising demand for neuromorphic systems across industries.
Additionally, the development of these algorithms plays a pivotal role in reducing latency and energy consumption in AI applications, further reinforcing neuromorphic computing's competitive edge in emerging markets. Combined with AI and ML’s growing influence, advancements in real-time learning algorithms are key to driving market innovation and expansion.
Restraining Factors
Limited Software Compatibility Awareness and Knowledge Gaps
The neuromorphic computing market faces significant restraint due to limited software compatibility and knowledge gaps within the ecosystem. Neuromorphic systems, inspired by biological neural networks, require specialized software frameworks that are not widely available or fully integrated into mainstream platforms. This lack of compatibility creates challenges for developers and enterprises attempting to implement neuromorphic architectures, often forcing them to invest in proprietary or custom-built software solutions. This drives up costs and elongates the development cycle, stalling broader adoption.
Additionally, knowledge gaps among both technical professionals and potential end users exacerbate the issue. Without a clear understanding of how neuromorphic computing can be effectively utilized in various applications, from AI to edge computing, companies are hesitant to invest. According to industry reports, only a small fraction of AI-related companies have fully grasped neuromorphic computing's potential, slowing the pace of investment and innovation. When key stakeholders lack awareness or expertise, the market misses out on broader integration into industries like healthcare, automotive, and defense, where neuromorphic systems could offer significant benefits.
Lack of Standardization and Ecosystem Maturity
The absence of standardization in neuromorphic computing is closely related to software compatibility challenges, further hampering market growth. A fragmented ecosystem, where companies develop their own frameworks or use specialized, non-standardized tools, prevents the scaling of neuromorphic solutions across industries. This lack of interoperability between hardware and software platforms creates significant barriers for businesses looking to scale neuromorphic computing solutions globally. It also limits the ability to build a collaborative ecosystem where advancements in one area can easily transfer to another, delaying the maturation of the overall market.
Moreover, without a well-defined ecosystem, the market lacks the necessary resources to train developers and engineers in neuromorphic computing, further deepening the knowledge gap. As a result, research and development cycles are protracted, and the commercialization of new innovations is slowed. Overcoming these barriers requires industry-wide initiatives for standardization, training programs, and partnerships to increase ecosystem maturity and accelerate the integration of neuromorphic systems into more applications. Until these systemic issues are addressed, the neuromorphic computing market will struggle to achieve its full growth potential.
By Component Analysis
Hardware Segment Dominates Neuromorphic Computing Market with Over 76% Market Share in 2023
In 2023, Hardware held a dominant market position in the "By Component" segment of the neuromorphic computing market, capturing more than 76% of the market share, making it the largest contributor to overall market growth. The hardware segment encompasses neuromorphic chips, processors, and other integrated systems designed to emulate the neural architecture of the human brain. This significant share is driven by increasing investments in specialized neuromorphic hardware by industries such as defense, automotive, and healthcare, where real-time processing, energy efficiency, and advanced computational capabilities are critical.
The Software segment, although smaller in comparison, is expected to experience accelerated growth due to the rising demand for algorithms, machine learning frameworks, and neuromorphic simulation tools. These solutions are increasingly being integrated with hardware to optimize applications such as pattern recognition, autonomous systems, and cognitive computing, facilitating more adaptive and efficient data processing.
The Services segment, including consulting, integration, and support services, also plays a critical role in the market. While it currently holds a relatively smaller share, the demand for expert guidance in the implementation of neuromorphic systems is projected to rise as organizations across various sectors adopt this technology. This segment is poised for growth as enterprises seek to navigate the complexities of deploying neuromorphic solutions tailored to their specific use cases.
Each component segment is integral to the overall expansion of the neuromorphic computing market, with hardware leading the way, supported by the increasing synergy between software advancements and service offerings.
By Deployment Analysis
In 2023, Edge Computing held a dominant market position in the "By Deployment" segment of the Neuromorphic Computing Market, capturing more than 67.2% of the total market share. This leadership underscores the growing importance of decentralized data processing solutions, particularly in applications where real-time data analysis and minimal latency are critical. Edge Computing's ability to process data closer to the source significantly enhances operational efficiency across industries such as autonomous vehicles, robotics, and IoT (Internet of Things), where rapid decision-making is imperative.
Moreover, the demand for localized computation has risen sharply as organizations seek to reduce the bandwidth and costs associated with transferring massive datasets to centralized cloud servers. The inherent security advantages of processing data at the edge also play a crucial role in this segment's strong market presence, especially in sectors like healthcare and defense, where data sensitivity and privacy are paramount.
In contrast, Cloud Computing, although highly scalable and cost-efficient for large-scale data processing tasks, accounted for the remaining share of the deployment market. Its centralized model, while ideal for batch processing and storage of extensive datasets, is increasingly viewed as less suitable for latency-sensitive neuromorphic computing applications. However, it continues to serve as a complementary technology, particularly in scenarios where storage capacity and extensive machine learning model training are essential. Despite its lower share in this segment, Cloud Computing remains a key component of the broader neuromorphic computing ecosystem, providing the necessary infrastructure to support the vast amount of data generated at the edge.
By End-Use Analysis
Consumer Electronics Dominates the Neuromorphic Computing Market in 2023, Capturing 48.1% Market Share
In 2023, Consumer Electronics held a dominant market position in the By End-Use segment of the Neuromorphic Computing Market, capturing more than 48.1% of the market share. The growing demand for advanced artificial intelligence (AI) applications, edge computing, and energy-efficient processing in devices such as smartphones, wearables, and smart home systems is driving the adoption of neuromorphic computing technologies. As consumer preferences shift towards more intelligent and efficient devices, the integration of neuromorphic processors has become critical to enhancing the performance of real-time applications, boosting this segment's substantial market lead.
Automotive is another rapidly expanding segment, fueled by the increasing focus on autonomous driving systems and advanced driver-assistance systems (ADAS). Neuromorphic computing’s ability to process sensory data in a manner similar to the human brain is highly beneficial for real-time decision-making, a crucial requirement for autonomous vehicles. This segment is poised for robust growth, as the automotive industry increasingly adopts AI-driven technologies to enhance safety, navigation, and operational efficiency.
In the Healthcare sector, neuromorphic computing is gaining traction, particularly in areas such as medical imaging, diagnostic systems, and brain-machine interfaces. The technology's potential to mimic human neural pathways has far-reaching applications in neuroscience, allowing for improved patient outcomes in fields such as prosthetics and rehabilitation. With rising investments in healthcare AI, this segment is projected to witness accelerated growth in the coming years.
The Military & Defense sector is increasingly leveraging neuromorphic computing for applications such as autonomous systems, cybersecurity, and situational awareness. Its ability to process complex data rapidly with low power consumption makes it ideal for high-stakes environments. As global defense budgets prioritize AI-driven technologies, this segment is likely to see sustained growth.
The Others segment, encompassing industries like industrial automation and financial services, is witnessing a gradual adoption of neuromorphic computing technologies. These industries benefit from enhanced decision-making capabilities and improved operational efficiency through real-time processing of large datasets. While currently smaller compared to the aforementioned sectors, this segment is expected to expand as neuromorphic computing becomes more widely understood and applicable across diverse industries.
By Application Analysis
Image Processing Dominates Neuromorphic Computing Market with a 48% Revenue Share in 2023
In 2023, the Image Processing segment secured a dominant position within the Neuromorphic Computing Market, capturing over 48% of the market share. This leading role in the application segment is attributed to the growing demand for image recognition technologies, particularly in industries such as automotive, healthcare, and surveillance. As processing technologies continue to advance, the image processing segment has emerged as a critical area of application, powering market expansion through its use in advanced analytics and machine vision systems.
A detailed analysis of the market reveals that beyond image processing, other application areas also contribute significantly to the industry's growth. Signal Processing, a key enabler of efficient communication and real-time data translation, holds a substantial share of the market, reinforcing its relevance in dynamic data environments. Similarly, Data Processing plays a pivotal role in managing the surge of information generated by IoT devices and sensors, making it indispensable for extracting actionable insights from complex datasets.
Additionally, Object Detection applications are witnessing steady growth, driven by the increasing need for enhanced security and quality control across various sectors. This highlights the broad applicability of neuromorphic computing in modern technology landscapes. The "Others" category, encompassing specialized applications such as robotics and drones, while currently smaller in comparison, shows promising potential for future growth as processing technologies evolve and industries adopt higher levels of automation.
In summary, the market segmentation of neuromorphic computing demonstrates the transformative potential of this technology across various applications, with the image processing segment maintaining its dominant position and paving the way for further market expansion.
Key Market Segments
By Component
- Hardware
- Software
- Services
By Deployment
- Edge Computing
- Cloud Computing
By End-Use
- Consumer Electronics
- Automotive
- Healthcare
- Military & Defense
- Others
By Application
- Signal Processing
- Image Processing
- Data Processing
- Object Detection
- Others
Growth Opportunity
Expansion in AI and IoT Applications
AI and IoT represent major growth drivers for neuromorphic computing. AI-based systems, particularly in autonomous vehicles, robotics, and smart city infrastructure, rely on real-time data processing and decision-making capabilities. Neuromorphic chips, which simulate the way human brains process information, offer a breakthrough in achieving this.
Their ability to process vast amounts of data with low power consumption is highly advantageous for IoT devices, which require efficient, low-latency computing at the edge. This growing intersection of AI and IoT is anticipated to significantly accelerate the adoption of neuromorphic technologies in 2024.
Real-Time Training Algorithms
The development of real-time training algorithms for neuromorphic computing is another critical opportunity. These algorithms enable systems to adapt in real-time, learning from ongoing inputs, which is essential for applications such as autonomous driving, robotics, and healthcare. For instance, autonomous vehicles must process dynamic environments and make immediate decisions, while healthcare devices can use real-time data to adjust treatment protocols. This capability not only enhances the functionality of intelligent systems but also broadens the market's potential across industries where adaptability is paramount.
In 2024, these advancements are expected to drive widespread adoption, creating new avenues for growth in the global neuromorphic computing market.
Latest Trends
Mimicking Human Brain Architecture
One of the most compelling trends in 2024 is the increasing capability of neuromorphic systems to mimic the human brain's architecture. Leveraging spiking neural networks (SNNs) and brain-inspired algorithms, these systems emulate human cognition, offering enhanced pattern recognition, decision-making, and problem-solving capabilities. The rise of AI-driven industries, from robotics to autonomous systems, is driving demand for Neuromorphic Computing that can replicate brain-like processing in real time.
By reducing the energy and data requirements typical of traditional computing architectures, neuromorphic technology is poised to revolutionize AI applications where efficiency and real-time response are critical, such as medical diagnostics, autonomous driving, and edge computing.
Advancements in Neuromorphic Hardware
2024 will see significant breakthroughs in neuromorphic hardware, with major players like Intel, IBM, and BrainChip accelerating development. These companies are focusing on developing chips that integrate neurons and synapses into their architecture, allowing for more efficient and parallel processing. Advances in memristors, a key component in neuromorphic designs, are enabling systems to store and process data simultaneously, reducing latency and energy consumption.
Additionally, the scaling down of neuromorphic hardware for mobile and wearable devices is becoming increasingly viable, broadening the technology's application in consumer electronics and healthcare. These advancements underscore the potential for neuromorphic hardware to become a cornerstone in next-generation computing platforms, particularly in edge and low-power AI scenarios.
Regional Analysis
North America leads the global neuromorphic computing market, with a commanding 40.1% share, driven primarily by the United States' strong R&D infrastructure and significant investments in AI technologies. The region benefits from a concentration of tech giants and research institutions that are advancing neuromorphic computing applications across sectors such as defense, healthcare, and automotive. The U.S. dominates within North America, while Canada and the rest of the region contribute to growth through innovation hubs and startup ecosystems.
Europe is another key player, with countries like Germany, France, and the UK spearheading neuromorphic computing research and development. Germany, a leader in industrial automation, heavily invests in neuromorphic systems for smart manufacturing. Meanwhile, the UK's strong AI sector and France's advancements in aerospace and defense also support the market's expansion. Other notable contributors include Spain, the Netherlands, and Italy, all working towards integrating neuromorphic technologies in AI-driven industries like transportation and healthcare.
The Asia-Pacific region, with its rapid technological adoption and a growing emphasis on AI, is witnessing significant growth in neuromorphic computing. China and Japan are at the forefront, investing heavily in neuromorphic R&D to support AI applications across automotive, consumer electronics, and healthcare sectors. South Korea and India are emerging as key markets, with South Korea's advancements in semiconductor technologies and India's increasing focus on AI development. Singapore, Thailand, and Vietnam are also contributing to the region's growth, driven by government initiatives supporting digital transformation.
In Latin America, Mexico and Brazil are leading the market for neuromorphic computing, with Brazil focusing on advanced AI research and Mexico enhancing its manufacturing capabilities through smart technologies. While the market here is still emerging compared to North America and Asia, increased investments in AI applications, particularly in automation and healthcare, are expected to drive steady growth across the region.
The Middle East & Africa region is gradually adopting neuromorphic computing, with countries like Saudi Arabia, the UAE, and South Africa focusing on AI to drive smart city projects, healthcare advancements, and defense modernization. While the region currently trails others in terms of market size, growing governmental support for AI and digital transformation initiatives is expected to accelerate neuromorphic computing development across the Rest of the Middle East & Africa in the coming years.
Key Regions and Countries
North America
- The US
- Canada
- Rest of North America
Europe
- Germany
- France
- The UK
- Spain
- Netherlands
- Russia
- Italy
- Rest of Europe
Asia-Pacific
- China
- Japan
- Singapore
- Thailand
- South Korea
- Vietnam
- India
- New Zealand
- Rest of Asia Pacific
Latin America
- Mexico
- Brazil
- Rest of Latin America
Middle East & Africa
- Saudi Arabia
- South Africa
- UAE
- Rest of Middle East & Africa
Key Players Analysis
The global neuromorphic computing market is set for significant growth in 2024, driven by rapid advancements in artificial intelligence (AI) and machine learning (ML), alongside increasing demand for brain-inspired computing systems. Key players in this landscape are leveraging their technological expertise to gain competitive advantages and capture market share.
IBM Corporation and Intel Corporation lead the market, both focusing heavily on research and development (R&D) and partnerships to push the boundaries of neuromorphic chip architectures. Their neuromorphic hardware, such as IBM’s TrueNorth and Intel’s Loihi, are pivotal innovations that could dominate enterprise applications, including data centers and AI-driven industries.
Qualcomm Technologies, Inc. and Samsung Electronics Co., Ltd. are also making strides, particularly in integrating neuromorphic systems into mobile and edge computing applications. This positions them well in the growing market for autonomous devices and IoT, where power efficiency and real-time processing are critical.
Niche players such as Brain Corporation and Numenta are focused on advancing neuromorphic software frameworks and algorithms, targeting robotics and cognitive computing, further diversifying the competitive landscape.
In contrast, HRL Laboratories and Knowm Inc. are innovating at the intersection of hardware and software, emphasizing new materials and architectures that mimic biological synapses, which could disrupt the market in terms of performance and scalability.
Market Key Players
- IBM Corporation
- Brain Corporation
- CEA-Leti
- General Vision, inc
- Hewlett Packard Company
- Numenta
- HRL Laboratories
- International Business Machines Corporation
- Intel Corporation
- Knowm Inc
- Qualcomm Technologies, Inc
- Samsung Electronics Co. Ltd
- Vicarious FPC, Inc.
Recent Developments
- In 2023, SynSense: SynSense, a company specializing in neuromorphic computing, secured an additional USD 10 million in funding led by Ausvic Capital. This investment is targeted at accelerating the mass production of their smart vision sensor, Speck, which integrates a neuromorphic AI processor.
- In 2023, BrainChip Holdings Ltd and Lorser Industries Inc.: BrainChip Holdings Ltd, a global leader in neuromorphic artificial intelligence (AI) IP, and Lorser Industries Inc., a leading provider of system-level manufacturing and integration, announced they will use BrainChip’s Akida™ technology to deliver neuromorphic computing solutions for software-defined radio (SDR) devices.
- In 2023, Prophesee: Prophesee unveiled the GenX320 Event-based Metavision sensor, tailored for ultra-low-power Edge AI vision devices. This development expands Prophesee’s technology into Edge markets, such as AR/VR headsets and security systems.
- In 2023, SiLC Technologies introduced the Eyeonic Vision System, an advanced FMCW LiDAR machine vision solution. This technology enhances object detection with high-speed and accuracy, offering capabilities such as polarization intensity and 3D depth sensing with millimeter-level precision over distances exceeding 1,000 meters.
Report Scope
Report Features Description Market Value (2023) USD 5.1 Bn Forecast Revenue (2033) USD 35.7 Bn CAGR (2024-2032) 22.1% Base Year for Estimation 2023 Historic Period 2016-2023 Forecast Period 2024-2033 Report Coverage Revenue Forecast, Market Dynamics, COVID-19 Impact, Competitive Landscape, Recent Developments Segments Covered By Component (Hardware, Software, and Services), By Deployment Mode (Edge Computing, Cloud Computing), By End-Use(Consumer Electronics, Automotive, Healthcare, Military & Defense, Others), By Application(Signal Processing, Image Processing, Data Processing,Object Detection, Others) Regional Analysis North America - The US, Canada, Rest of North America, Europe - Germany, France, The UK, Spain, Italy, Russia, Netherlands, Rest of Europe, Asia-Pacific - China, Japan, South Korea, India, New Zealand, Singapore, Thailand, Vietnam, Rest of Asia Pacific, Latin America - Brazil, Mexico, Rest of Latin America, Middle East & Africa - South Africa, Saudi Arabia, UAE, Rest of Middle East & Africa Competitive Landscape IBM Corporation, Brain Corporation, CEA-Leti, General Vision, inc, Hewlett Packard Company, Numenta, HRL Laboratories, International Business Machines Corporation, Intel Corporation, Knowm Inc, Qualcomm Technologies, Inc, Samsung Electronics Co., Ltd, Vicarious FPC, Inc. Customization Scope Customization for segments, region/country-level will be provided. Moreover, additional customization can be done based on the requirements. Purchase Options We have three licenses to opt for Single User License, Multi-User License (Up to 5 Users), Corporate Use License (Unlimited User and Printable PDF) -
- 1. Executive Summary
- 1.1. Definition
- 1.2. Taxonomy
- 1.3. Research Scope
- 1.4. Key Analysis
- 1.5. Key Findings by Major Segments
- 1.6. Top strategies by Major Players
- 2. Global Neuromorphic Computing Market Overview
- 2.1. Neuromorphic Computing Market Dynamics
- 2.1.1. Drivers
- 2.1.2. Opportunities
- 2.1.3. Restraints
- 2.1.4. Challenges
- 2.2. Macro-economic Factors
- 2.3. Regulatory Framework
- 2.4. Market Investment Feasibility Index
- 2.5. PEST Analysis
- 2.6. PORTER’S Five Force Analysis
- 2.7. Drivers & Restraints Impact Analysis
- 2.8. Industry Chain Analysis
- 2.9. Cost Structure Analysis
- 2.10. Marketing Strategy
- 2.11. Russia-Ukraine War Impact Analysis
- 2.12. Opportunity Map Analysis
- 2.13. Market Competition Scenario Analysis
- 2.14. Product Life Cycle Analysis
- 2.15. Opportunity Orbits
- 2.16. Manufacturer Intensity Map
- 2.17. Major Companies sales by Value & Volume
- 2.1. Neuromorphic Computing Market Dynamics
- 3. Global Neuromorphic Computing Market Analysis, Opportunity and Forecast, 2016-2032
- 3.1. Global Neuromorphic Computing Market Analysis, 2016-2021
- 3.2. Global Neuromorphic Computing Market Opportunity and Forecast, 2023-2032
- 3.3. Global Neuromorphic Computing Market Analysis, Opportunity and Forecast, By By Component, 2016-2032
- 3.3.1. Global Neuromorphic Computing Market Analysis by By Component: Introduction
- 3.3.2. Market Size Absolute $ Opportunity Analysis and Forecast, By By Component, 2016-2032
- 3.3.3. Hardware
- 3.3.4. Software
- 3.3.5. Services
- 3.4. Global Neuromorphic Computing Market Analysis, Opportunity and Forecast, By By Deployment, 2016-2032
- 3.4.1. Global Neuromorphic Computing Market Analysis by By Deployment: Introduction
- 3.4.2. Market Size Absolute $ Opportunity Analysis and Forecast, By By Deployment, 2016-2032
- 3.4.3. Edge Computing
- 3.4.4. Cloud Computing
- 3.5. Global Neuromorphic Computing Market Analysis, Opportunity and Forecast, By By End-Use, 2016-2032
- 3.5.1. Global Neuromorphic Computing Market Analysis by By End-Use: Introduction
- 3.5.2. Market Size Absolute $ Opportunity Analysis and Forecast, By By End-Use, 2016-2032
- 3.5.3. Consumer Electronics
- 3.5.4. Automotive
- 3.5.5. Healthcare
- 3.5.6. Military & Defense
- 3.5.7. Others
- 3.6. Global Neuromorphic Computing Market Analysis, Opportunity and Forecast, By By Application, 2016-2032
- 3.6.1. Global Neuromorphic Computing Market Analysis by By Application: Introduction
- 3.6.2. Market Size Absolute $ Opportunity Analysis and Forecast, By By Application, 2016-2032
- 3.6.3. Signal Processing
- 3.6.4. Image Processing
- 3.6.5. Data Processing
- 3.6.6. Object Detection
- 3.6.7. Others
- 4. North America Neuromorphic Computing Market Analysis, Opportunity and Forecast, 2016-2032
- 4.1. North America Neuromorphic Computing Market Analysis, 2016-2021
- 4.2. North America Neuromorphic Computing Market Opportunity and Forecast, 2023-2032
- 4.3. North America Neuromorphic Computing Market Analysis, Opportunity and Forecast, By By Component, 2016-2032
- 4.3.1. North America Neuromorphic Computing Market Analysis by By Component: Introduction
- 4.3.2. Market Size Absolute $ Opportunity Analysis and Forecast, By By Component, 2016-2032
- 4.3.3. Hardware
- 4.3.4. Software
- 4.3.5. Services
- 4.4. North America Neuromorphic Computing Market Analysis, Opportunity and Forecast, By By Deployment, 2016-2032
- 4.4.1. North America Neuromorphic Computing Market Analysis by By Deployment: Introduction
- 4.4.2. Market Size Absolute $ Opportunity Analysis and Forecast, By By Deployment, 2016-2032
- 4.4.3. Edge Computing
- 4.4.4. Cloud Computing
- 4.5. North America Neuromorphic Computing Market Analysis, Opportunity and Forecast, By By End-Use, 2016-2032
- 4.5.1. North America Neuromorphic Computing Market Analysis by By End-Use: Introduction
- 4.5.2. Market Size Absolute $ Opportunity Analysis and Forecast, By By End-Use, 2016-2032
- 4.5.3. Consumer Electronics
- 4.5.4. Automotive
- 4.5.5. Healthcare
- 4.5.6. Military & Defense
- 4.5.7. Others
- 4.6. North America Neuromorphic Computing Market Analysis, Opportunity and Forecast, By By Application, 2016-2032
- 4.6.1. North America Neuromorphic Computing Market Analysis by By Application: Introduction
- 4.6.2. Market Size Absolute $ Opportunity Analysis and Forecast, By By Application, 2016-2032
- 4.6.3. Signal Processing
- 4.6.4. Image Processing
- 4.6.5. Data Processing
- 4.6.6. Object Detection
- 4.6.7. Others
- 4.7. North America Neuromorphic Computing Market Analysis, Opportunity and Forecast, By Country , 2016-2032
- 4.7.1. North America Neuromorphic Computing Market Analysis by Country : Introduction
- 4.7.2. Market Size Absolute $ Opportunity Analysis and Forecast, Country , 2016-2032
- 4.7.2.1. The US
- 4.7.2.2. Canada
- 4.7.2.3. Mexico
- 5. Western Europe Neuromorphic Computing Market Analysis, Opportunity and Forecast, 2016-2032
- 5.1. Western Europe Neuromorphic Computing Market Analysis, 2016-2021
- 5.2. Western Europe Neuromorphic Computing Market Opportunity and Forecast, 2023-2032
- 5.3. Western Europe Neuromorphic Computing Market Analysis, Opportunity and Forecast, By By Component, 2016-2032
- 5.3.1. Western Europe Neuromorphic Computing Market Analysis by By Component: Introduction
- 5.3.2. Market Size Absolute $ Opportunity Analysis and Forecast, By By Component, 2016-2032
- 5.3.3. Hardware
- 5.3.4. Software
- 5.3.5. Services
- 5.4. Western Europe Neuromorphic Computing Market Analysis, Opportunity and Forecast, By By Deployment, 2016-2032
- 5.4.1. Western Europe Neuromorphic Computing Market Analysis by By Deployment: Introduction
- 5.4.2. Market Size Absolute $ Opportunity Analysis and Forecast, By By Deployment, 2016-2032
- 5.4.3. Edge Computing
- 5.4.4. Cloud Computing
- 5.5. Western Europe Neuromorphic Computing Market Analysis, Opportunity and Forecast, By By End-Use, 2016-2032
- 5.5.1. Western Europe Neuromorphic Computing Market Analysis by By End-Use: Introduction
- 5.5.2. Market Size Absolute $ Opportunity Analysis and Forecast, By By End-Use, 2016-2032
- 5.5.3. Consumer Electronics
- 5.5.4. Automotive
- 5.5.5. Healthcare
- 5.5.6. Military & Defense
- 5.5.7. Others
- 5.6. Western Europe Neuromorphic Computing Market Analysis, Opportunity and Forecast, By By Application, 2016-2032
- 5.6.1. Western Europe Neuromorphic Computing Market Analysis by By Application: Introduction
- 5.6.2. Market Size Absolute $ Opportunity Analysis and Forecast, By By Application, 2016-2032
- 5.6.3. Signal Processing
- 5.6.4. Image Processing
- 5.6.5. Data Processing
- 5.6.6. Object Detection
- 5.6.7. Others
- 5.7. Western Europe Neuromorphic Computing Market Analysis, Opportunity and Forecast, By Country , 2016-2032
- 5.7.1. Western Europe Neuromorphic Computing Market Analysis by Country : Introduction
- 5.7.2. Market Size Absolute $ Opportunity Analysis and Forecast, Country , 2016-2032
- 5.7.2.1. Germany
- 5.7.2.2. France
- 5.7.2.3. The UK
- 5.7.2.4. Spain
- 5.7.2.5. Italy
- 5.7.2.6. Portugal
- 5.7.2.7. Ireland
- 5.7.2.8. Austria
- 5.7.2.9. Switzerland
- 5.7.2.10. Benelux
- 5.7.2.11. Nordic
- 5.7.2.12. Rest of Western Europe
- 6. Eastern Europe Neuromorphic Computing Market Analysis, Opportunity and Forecast, 2016-2032
- 6.1. Eastern Europe Neuromorphic Computing Market Analysis, 2016-2021
- 6.2. Eastern Europe Neuromorphic Computing Market Opportunity and Forecast, 2023-2032
- 6.3. Eastern Europe Neuromorphic Computing Market Analysis, Opportunity and Forecast, By By Component, 2016-2032
- 6.3.1. Eastern Europe Neuromorphic Computing Market Analysis by By Component: Introduction
- 6.3.2. Market Size Absolute $ Opportunity Analysis and Forecast, By By Component, 2016-2032
- 6.3.3. Hardware
- 6.3.4. Software
- 6.3.5. Services
- 6.4. Eastern Europe Neuromorphic Computing Market Analysis, Opportunity and Forecast, By By Deployment, 2016-2032
- 6.4.1. Eastern Europe Neuromorphic Computing Market Analysis by By Deployment: Introduction
- 6.4.2. Market Size Absolute $ Opportunity Analysis and Forecast, By By Deployment, 2016-2032
- 6.4.3. Edge Computing
- 6.4.4. Cloud Computing
- 6.5. Eastern Europe Neuromorphic Computing Market Analysis, Opportunity and Forecast, By By End-Use, 2016-2032
- 6.5.1. Eastern Europe Neuromorphic Computing Market Analysis by By End-Use: Introduction
- 6.5.2. Market Size Absolute $ Opportunity Analysis and Forecast, By By End-Use, 2016-2032
- 6.5.3. Consumer Electronics
- 6.5.4. Automotive
- 6.5.5. Healthcare
- 6.5.6. Military & Defense
- 6.5.7. Others
- 6.6. Eastern Europe Neuromorphic Computing Market Analysis, Opportunity and Forecast, By By Application, 2016-2032
- 6.6.1. Eastern Europe Neuromorphic Computing Market Analysis by By Application: Introduction
- 6.6.2. Market Size Absolute $ Opportunity Analysis and Forecast, By By Application, 2016-2032
- 6.6.3. Signal Processing
- 6.6.4. Image Processing
- 6.6.5. Data Processing
- 6.6.6. Object Detection
- 6.6.7. Others
- 6.7. Eastern Europe Neuromorphic Computing Market Analysis, Opportunity and Forecast, By Country , 2016-2032
- 6.7.1. Eastern Europe Neuromorphic Computing Market Analysis by Country : Introduction
- 6.7.2. Market Size Absolute $ Opportunity Analysis and Forecast, Country , 2016-2032
- 6.7.2.1. Russia
- 6.7.2.2. Poland
- 6.7.2.3. The Czech Republic
- 6.7.2.4. Greece
- 6.7.2.5. Rest of Eastern Europe
- 7. APAC Neuromorphic Computing Market Analysis, Opportunity and Forecast, 2016-2032
- 7.1. APAC Neuromorphic Computing Market Analysis, 2016-2021
- 7.2. APAC Neuromorphic Computing Market Opportunity and Forecast, 2023-2032
- 7.3. APAC Neuromorphic Computing Market Analysis, Opportunity and Forecast, By By Component, 2016-2032
- 7.3.1. APAC Neuromorphic Computing Market Analysis by By Component: Introduction
- 7.3.2. Market Size Absolute $ Opportunity Analysis and Forecast, By By Component, 2016-2032
- 7.3.3. Hardware
- 7.3.4. Software
- 7.3.5. Services
- 7.4. APAC Neuromorphic Computing Market Analysis, Opportunity and Forecast, By By Deployment, 2016-2032
- 7.4.1. APAC Neuromorphic Computing Market Analysis by By Deployment: Introduction
- 7.4.2. Market Size Absolute $ Opportunity Analysis and Forecast, By By Deployment, 2016-2032
- 7.4.3. Edge Computing
- 7.4.4. Cloud Computing
- 7.5. APAC Neuromorphic Computing Market Analysis, Opportunity and Forecast, By By End-Use, 2016-2032
- 7.5.1. APAC Neuromorphic Computing Market Analysis by By End-Use: Introduction
- 7.5.2. Market Size Absolute $ Opportunity Analysis and Forecast, By By End-Use, 2016-2032
- 7.5.3. Consumer Electronics
- 7.5.4. Automotive
- 7.5.5. Healthcare
- 7.5.6. Military & Defense
- 7.5.7. Others
- 7.6. APAC Neuromorphic Computing Market Analysis, Opportunity and Forecast, By By Application, 2016-2032
- 7.6.1. APAC Neuromorphic Computing Market Analysis by By Application: Introduction
- 7.6.2. Market Size Absolute $ Opportunity Analysis and Forecast, By By Application, 2016-2032
- 7.6.3. Signal Processing
- 7.6.4. Image Processing
- 7.6.5. Data Processing
- 7.6.6. Object Detection
- 7.6.7. Others
- 7.7. APAC Neuromorphic Computing Market Analysis, Opportunity and Forecast, By Country , 2016-2032
- 7.7.1. APAC Neuromorphic Computing Market Analysis by Country : Introduction
- 7.7.2. Market Size Absolute $ Opportunity Analysis and Forecast, Country , 2016-2032
- 7.7.2.1. China
- 7.7.2.2. Japan
- 7.7.2.3. South Korea
- 7.7.2.4. India
- 7.7.2.5. Australia & New Zeland
- 7.7.2.6. Indonesia
- 7.7.2.7. Malaysia
- 7.7.2.8. Philippines
- 7.7.2.9. Singapore
- 7.7.2.10. Thailand
- 7.7.2.11. Vietnam
- 7.7.2.12. Rest of APAC
- 8. Latin America Neuromorphic Computing Market Analysis, Opportunity and Forecast, 2016-2032
- 8.1. Latin America Neuromorphic Computing Market Analysis, 2016-2021
- 8.2. Latin America Neuromorphic Computing Market Opportunity and Forecast, 2023-2032
- 8.3. Latin America Neuromorphic Computing Market Analysis, Opportunity and Forecast, By By Component, 2016-2032
- 8.3.1. Latin America Neuromorphic Computing Market Analysis by By Component: Introduction
- 8.3.2. Market Size Absolute $ Opportunity Analysis and Forecast, By By Component, 2016-2032
- 8.3.3. Hardware
- 8.3.4. Software
- 8.3.5. Services
- 8.4. Latin America Neuromorphic Computing Market Analysis, Opportunity and Forecast, By By Deployment, 2016-2032
- 8.4.1. Latin America Neuromorphic Computing Market Analysis by By Deployment: Introduction
- 8.4.2. Market Size Absolute $ Opportunity Analysis and Forecast, By By Deployment, 2016-2032
- 8.4.3. Edge Computing
- 8.4.4. Cloud Computing
- 8.5. Latin America Neuromorphic Computing Market Analysis, Opportunity and Forecast, By By End-Use, 2016-2032
- 8.5.1. Latin America Neuromorphic Computing Market Analysis by By End-Use: Introduction
- 8.5.2. Market Size Absolute $ Opportunity Analysis and Forecast, By By End-Use, 2016-2032
- 8.5.3. Consumer Electronics
- 8.5.4. Automotive
- 8.5.5. Healthcare
- 8.5.6. Military & Defense
- 8.5.7. Others
- 8.6. Latin America Neuromorphic Computing Market Analysis, Opportunity and Forecast, By By Application, 2016-2032
- 8.6.1. Latin America Neuromorphic Computing Market Analysis by By Application: Introduction
- 8.6.2. Market Size Absolute $ Opportunity Analysis and Forecast, By By Application, 2016-2032
- 8.6.3. Signal Processing
- 8.6.4. Image Processing
- 8.6.5. Data Processing
- 8.6.6. Object Detection
- 8.6.7. Others
- 8.7. Latin America Neuromorphic Computing Market Analysis, Opportunity and Forecast, By Country , 2016-2032
- 8.7.1. Latin America Neuromorphic Computing Market Analysis by Country : Introduction
- 8.7.2. Market Size Absolute $ Opportunity Analysis and Forecast, Country , 2016-2032
- 8.7.2.1. Brazil
- 8.7.2.2. Colombia
- 8.7.2.3. Chile
- 8.7.2.4. Argentina
- 8.7.2.5. Costa Rica
- 8.7.2.6. Rest of Latin America
- 9. Middle East & Africa Neuromorphic Computing Market Analysis, Opportunity and Forecast, 2016-2032
- 9.1. Middle East & Africa Neuromorphic Computing Market Analysis, 2016-2021
- 9.2. Middle East & Africa Neuromorphic Computing Market Opportunity and Forecast, 2023-2032
- 9.3. Middle East & Africa Neuromorphic Computing Market Analysis, Opportunity and Forecast, By By Component, 2016-2032
- 9.3.1. Middle East & Africa Neuromorphic Computing Market Analysis by By Component: Introduction
- 9.3.2. Market Size Absolute $ Opportunity Analysis and Forecast, By By Component, 2016-2032
- 9.3.3. Hardware
- 9.3.4. Software
- 9.3.5. Services
- 9.4. Middle East & Africa Neuromorphic Computing Market Analysis, Opportunity and Forecast, By By Deployment, 2016-2032
- 9.4.1. Middle East & Africa Neuromorphic Computing Market Analysis by By Deployment: Introduction
- 9.4.2. Market Size Absolute $ Opportunity Analysis and Forecast, By By Deployment, 2016-2032
- 9.4.3. Edge Computing
- 9.4.4. Cloud Computing
- 9.5. Middle East & Africa Neuromorphic Computing Market Analysis, Opportunity and Forecast, By By End-Use, 2016-2032
- 9.5.1. Middle East & Africa Neuromorphic Computing Market Analysis by By End-Use: Introduction
- 9.5.2. Market Size Absolute $ Opportunity Analysis and Forecast, By By End-Use, 2016-2032
- 9.5.3. Consumer Electronics
- 9.5.4. Automotive
- 9.5.5. Healthcare
- 9.5.6. Military & Defense
- 9.5.7. Others
- 9.6. Middle East & Africa Neuromorphic Computing Market Analysis, Opportunity and Forecast, By By Application, 2016-2032
- 9.6.1. Middle East & Africa Neuromorphic Computing Market Analysis by By Application: Introduction
- 9.6.2. Market Size Absolute $ Opportunity Analysis and Forecast, By By Application, 2016-2032
- 9.6.3. Signal Processing
- 9.6.4. Image Processing
- 9.6.5. Data Processing
- 9.6.6. Object Detection
- 9.6.7. Others
- 9.7. Middle East & Africa Neuromorphic Computing Market Analysis, Opportunity and Forecast, By Country , 2016-2032
- 9.7.1. Middle East & Africa Neuromorphic Computing Market Analysis by Country : Introduction
- 9.7.2. Market Size Absolute $ Opportunity Analysis and Forecast, Country , 2016-2032
- 9.7.2.1. Algeria
- 9.7.2.2. Egypt
- 9.7.2.3. Israel
- 9.7.2.4. Kuwait
- 9.7.2.5. Nigeria
- 9.7.2.6. Saudi Arabia
- 9.7.2.7. South Africa
- 9.7.2.8. Turkey
- 9.7.2.9. The UAE
- 9.7.2.10. Rest of MEA
- 10. Global Neuromorphic Computing Market Analysis, Opportunity and Forecast, By Region , 2016-2032
- 10.1. Global Neuromorphic Computing Market Analysis by Region : Introduction
- 10.2. Market Size Absolute $ Opportunity Analysis and Forecast, By Region , 2016-2032
- 10.2.1. North America
- 10.2.2. Western Europe
- 10.2.3. Eastern Europe
- 10.2.4. APAC
- 10.2.5. Latin America
- 10.2.6. Middle East & Africa
- 11. Global Neuromorphic Computing Market Competitive Landscape, Market Share Analysis, and Company Profiles
- 11.1. Market Share Analysis
- 11.2. Company Profiles
- 11.3. IBM Corporation
- 11.3.1. Company Overview
- 11.3.2. Financial Highlights
- 11.3.3. Product Portfolio
- 11.3.4. SWOT Analysis
- 11.3.5. Key Strategies and Developments
- 11.4. Brain Corporation
- 11.4.1. Company Overview
- 11.4.2. Financial Highlights
- 11.4.3. Product Portfolio
- 11.4.4. SWOT Analysis
- 11.4.5. Key Strategies and Developments
- 11.5. CEA-Leti
- 11.5.1. Company Overview
- 11.5.2. Financial Highlights
- 11.5.3. Product Portfolio
- 11.5.4. SWOT Analysis
- 11.5.5. Key Strategies and Developments
- 11.6. General Vision, inc
- 11.6.1. Company Overview
- 11.6.2. Financial Highlights
- 11.6.3. Product Portfolio
- 11.6.4. SWOT Analysis
- 11.6.5. Key Strategies and Developments
- 11.7. Hewlett Packard Company
- 11.7.1. Company Overview
- 11.7.2. Financial Highlights
- 11.7.3. Product Portfolio
- 11.7.4. SWOT Analysis
- 11.7.5. Key Strategies and Developments
- 11.8. Numenta
- 11.8.1. Company Overview
- 11.8.2. Financial Highlights
- 11.8.3. Product Portfolio
- 11.8.4. SWOT Analysis
- 11.8.5. Key Strategies and Developments
- 11.9. HRL Laboratories
- 11.9.1. Company Overview
- 11.9.2. Financial Highlights
- 11.9.3. Product Portfolio
- 11.9.4. SWOT Analysis
- 11.9.5. Key Strategies and Developments
- 11.10. International Business Machines Corporation
- 11.10.1. Company Overview
- 11.10.2. Financial Highlights
- 11.10.3. Product Portfolio
- 11.10.4. SWOT Analysis
- 11.10.5. Key Strategies and Developments
- 11.11. Intel Corporation
- 11.11.1. Company Overview
- 11.11.2. Financial Highlights
- 11.11.3. Product Portfolio
- 11.11.4. SWOT Analysis
- 11.11.5. Key Strategies and Developments
- 11.12. Knowm Inc
- 11.12.1. Company Overview
- 11.12.2. Financial Highlights
- 11.12.3. Product Portfolio
- 11.12.4. SWOT Analysis
- 11.12.5. Key Strategies and Developments
- 11.13.1. Company Overview
- 11.13.2. Financial Highlights
- 11.13.3. Product Portfolio
- 11.13.4. SWOT Analysis
- 11.13.5. Key Strategies and Developments
- 11.14. Qualcomm Technologies, Inc
- 11.14.1. Company Overview
- 11.14.2. Financial Highlights
- 11.14.3. Product Portfolio
- 11.14.4. SWOT Analysis
- 11.14.5. Key Strategies and Developments
- 11.15. Vicarious FPC, Inc.
- 11.15.1. Company Overview
- 11.15.2. Financial Highlights
- 11.15.3. Product Portfolio
- 11.15.4. SWOT Analysis
- 11.15.5. Key Strategies and Developments
- 12. Assumptions and Acronyms
- 13. Research Methodology
- 14. Contact
List of Figures
-
- Figure 1: Global Neuromorphic Computing Market Revenue (US$ Mn) Market Share by By Component in 2022
- Figure 2: Global Neuromorphic Computing Market Market Attractiveness Analysis by By Component, 2016-2032
- Figure 3: Global Neuromorphic Computing Market Revenue (US$ Mn) Market Share by By Deploymentin 2022
- Figure 4: Global Neuromorphic Computing Market Market Attractiveness Analysis by By Deployment, 2016-2032
- Figure 5: Global Neuromorphic Computing Market Revenue (US$ Mn) Market Share by By End-Usein 2022
- Figure 6: Global Neuromorphic Computing Market Market Attractiveness Analysis by By End-Use, 2016-2032
- Figure 7: Global Neuromorphic Computing Market Revenue (US$ Mn) Market Share by By Applicationin 2022
- Figure 8: Global Neuromorphic Computing Market Market Attractiveness Analysis by By Application, 2016-2032
- Figure 9: Global Neuromorphic Computing Market Revenue (US$ Mn) Market Share by Region in 2022
- Figure 10: Global Neuromorphic Computing Market Market Attractiveness Analysis by Region, 2016-2032
- Figure 11: Global Neuromorphic Computing Market Market Revenue (US$ Mn) (2016-2032)
- Figure 12: Global Neuromorphic Computing Market Market Revenue (US$ Mn) Comparison by Region (2016-2032)
- Figure 13: Global Neuromorphic Computing Market Market Revenue (US$ Mn) Comparison by By Component (2016-2032)
- Figure 14: Global Neuromorphic Computing Market Market Revenue (US$ Mn) Comparison by By Deployment (2016-2032)
- Figure 15: Global Neuromorphic Computing Market Market Revenue (US$ Mn) Comparison by By End-Use (2016-2032)
- Figure 16: Global Neuromorphic Computing Market Market Revenue (US$ Mn) Comparison by By Application (2016-2032)
- Figure 17: Global Neuromorphic Computing Market Market Y-o-Y Growth Rate Comparison by Region (2016-2032)
- Figure 18: Global Neuromorphic Computing Market Market Y-o-Y Growth Rate Comparison by By Component (2016-2032)
- Figure 19: Global Neuromorphic Computing Market Market Y-o-Y Growth Rate Comparison by By Deployment (2016-2032)
- Figure 20: Global Neuromorphic Computing Market Market Y-o-Y Growth Rate Comparison by By End-Use (2016-2032)
- Figure 21: Global Neuromorphic Computing Market Market Y-o-Y Growth Rate Comparison by By Application (2016-2032)
- Figure 22: Global Neuromorphic Computing Market Market Share Comparison by Region (2016-2032)
- Figure 23: Global Neuromorphic Computing Market Market Share Comparison by By Component (2016-2032)
- Figure 24: Global Neuromorphic Computing Market Market Share Comparison by By Deployment (2016-2032)
- Figure 25: Global Neuromorphic Computing Market Market Share Comparison by By End-Use (2016-2032)
- Figure 26: Global Neuromorphic Computing Market Market Share Comparison by By Application (2016-2032)
- Figure 27: North America Neuromorphic Computing Market Revenue (US$ Mn) Market Share by By Componentin 2022
- Figure 28: North America Neuromorphic Computing Market Market Attractiveness Analysis by By Component, 2016-2032
- Figure 29: North America Neuromorphic Computing Market Revenue (US$ Mn) Market Share by By Deploymentin 2022
- Figure 30: North America Neuromorphic Computing Market Market Attractiveness Analysis by By Deployment, 2016-2032
- Figure 31: North America Neuromorphic Computing Market Revenue (US$ Mn) Market Share by By End-Usein 2022
- Figure 32: North America Neuromorphic Computing Market Market Attractiveness Analysis by By End-Use, 2016-2032
- Figure 33: North America Neuromorphic Computing Market Revenue (US$ Mn) Market Share by By Applicationin 2022
- Figure 34: North America Neuromorphic Computing Market Market Attractiveness Analysis by By Application, 2016-2032
- Figure 35: North America Neuromorphic Computing Market Revenue (US$ Mn) Market Share by Country in 2022
- Figure 36: North America Neuromorphic Computing Market Market Attractiveness Analysis by Country, 2016-2032
- Figure 37: North America Neuromorphic Computing Market Market Revenue (US$ Mn) (2016-2032)
- Figure 38: North America Neuromorphic Computing Market Market Revenue (US$ Mn) Comparison by Country (2016-2032)
- Figure 39: North America Neuromorphic Computing Market Market Revenue (US$ Mn) Comparison by By Component (2016-2032)
- Figure 40: North America Neuromorphic Computing Market Market Revenue (US$ Mn) Comparison by By Deployment (2016-2032)
- Figure 41: North America Neuromorphic Computing Market Market Revenue (US$ Mn) Comparison by By End-Use (2016-2032)
- Figure 42: North America Neuromorphic Computing Market Market Revenue (US$ Mn) Comparison by By Application (2016-2032)
- Figure 43: North America Neuromorphic Computing Market Market Y-o-Y Growth Rate Comparison by Country (2016-2032)
- Figure 44: North America Neuromorphic Computing Market Market Y-o-Y Growth Rate Comparison by By Component (2016-2032)
- Figure 45: North America Neuromorphic Computing Market Market Y-o-Y Growth Rate Comparison by By Deployment (2016-2032)
- Figure 46: North America Neuromorphic Computing Market Market Y-o-Y Growth Rate Comparison by By End-Use (2016-2032)
- Figure 47: North America Neuromorphic Computing Market Market Y-o-Y Growth Rate Comparison by By Application (2016-2032)
- Figure 48: North America Neuromorphic Computing Market Market Share Comparison by Country (2016-2032)
- Figure 49: North America Neuromorphic Computing Market Market Share Comparison by By Component (2016-2032)
- Figure 50: North America Neuromorphic Computing Market Market Share Comparison by By Deployment (2016-2032)
- Figure 51: North America Neuromorphic Computing Market Market Share Comparison by By End-Use (2016-2032)
- Figure 52: North America Neuromorphic Computing Market Market Share Comparison by By Application (2016-2032)
- Figure 53: Western Europe Neuromorphic Computing Market Revenue (US$ Mn) Market Share by By Componentin 2022
- Figure 54: Western Europe Neuromorphic Computing Market Market Attractiveness Analysis by By Component, 2016-2032
- Figure 55: Western Europe Neuromorphic Computing Market Revenue (US$ Mn) Market Share by By Deploymentin 2022
- Figure 56: Western Europe Neuromorphic Computing Market Market Attractiveness Analysis by By Deployment, 2016-2032
- Figure 57: Western Europe Neuromorphic Computing Market Revenue (US$ Mn) Market Share by By End-Usein 2022
- Figure 58: Western Europe Neuromorphic Computing Market Market Attractiveness Analysis by By End-Use, 2016-2032
- Figure 59: Western Europe Neuromorphic Computing Market Revenue (US$ Mn) Market Share by By Applicationin 2022
- Figure 60: Western Europe Neuromorphic Computing Market Market Attractiveness Analysis by By Application, 2016-2032
- Figure 61: Western Europe Neuromorphic Computing Market Revenue (US$ Mn) Market Share by Country in 2022
- Figure 62: Western Europe Neuromorphic Computing Market Market Attractiveness Analysis by Country, 2016-2032
- Figure 63: Western Europe Neuromorphic Computing Market Market Revenue (US$ Mn) (2016-2032)
- Figure 64: Western Europe Neuromorphic Computing Market Market Revenue (US$ Mn) Comparison by Country (2016-2032)
- Figure 65: Western Europe Neuromorphic Computing Market Market Revenue (US$ Mn) Comparison by By Component (2016-2032)
- Figure 66: Western Europe Neuromorphic Computing Market Market Revenue (US$ Mn) Comparison by By Deployment (2016-2032)
- Figure 67: Western Europe Neuromorphic Computing Market Market Revenue (US$ Mn) Comparison by By End-Use (2016-2032)
- Figure 68: Western Europe Neuromorphic Computing Market Market Revenue (US$ Mn) Comparison by By Application (2016-2032)
- Figure 69: Western Europe Neuromorphic Computing Market Market Y-o-Y Growth Rate Comparison by Country (2016-2032)
- Figure 70: Western Europe Neuromorphic Computing Market Market Y-o-Y Growth Rate Comparison by By Component (2016-2032)
- Figure 71: Western Europe Neuromorphic Computing Market Market Y-o-Y Growth Rate Comparison by By Deployment (2016-2032)
- Figure 72: Western Europe Neuromorphic Computing Market Market Y-o-Y Growth Rate Comparison by By End-Use (2016-2032)
- Figure 73: Western Europe Neuromorphic Computing Market Market Y-o-Y Growth Rate Comparison by By Application (2016-2032)
- Figure 74: Western Europe Neuromorphic Computing Market Market Share Comparison by Country (2016-2032)
- Figure 75: Western Europe Neuromorphic Computing Market Market Share Comparison by By Component (2016-2032)
- Figure 76: Western Europe Neuromorphic Computing Market Market Share Comparison by By Deployment (2016-2032)
- Figure 77: Western Europe Neuromorphic Computing Market Market Share Comparison by By End-Use (2016-2032)
- Figure 78: Western Europe Neuromorphic Computing Market Market Share Comparison by By Application (2016-2032)
- Figure 79: Eastern Europe Neuromorphic Computing Market Revenue (US$ Mn) Market Share by By Componentin 2022
- Figure 80: Eastern Europe Neuromorphic Computing Market Market Attractiveness Analysis by By Component, 2016-2032
- Figure 81: Eastern Europe Neuromorphic Computing Market Revenue (US$ Mn) Market Share by By Deploymentin 2022
- Figure 82: Eastern Europe Neuromorphic Computing Market Market Attractiveness Analysis by By Deployment, 2016-2032
- Figure 83: Eastern Europe Neuromorphic Computing Market Revenue (US$ Mn) Market Share by By End-Usein 2022
- Figure 84: Eastern Europe Neuromorphic Computing Market Market Attractiveness Analysis by By End-Use, 2016-2032
- Figure 85: Eastern Europe Neuromorphic Computing Market Revenue (US$ Mn) Market Share by By Applicationin 2022
- Figure 86: Eastern Europe Neuromorphic Computing Market Market Attractiveness Analysis by By Application, 2016-2032
- Figure 87: Eastern Europe Neuromorphic Computing Market Revenue (US$ Mn) Market Share by Country in 2022
- Figure 88: Eastern Europe Neuromorphic Computing Market Market Attractiveness Analysis by Country, 2016-2032
- Figure 89: Eastern Europe Neuromorphic Computing Market Market Revenue (US$ Mn) (2016-2032)
- Figure 90: Eastern Europe Neuromorphic Computing Market Market Revenue (US$ Mn) Comparison by Country (2016-2032)
- Figure 91: Eastern Europe Neuromorphic Computing Market Market Revenue (US$ Mn) Comparison by By Component (2016-2032)
- Figure 92: Eastern Europe Neuromorphic Computing Market Market Revenue (US$ Mn) Comparison by By Deployment (2016-2032)
- Figure 93: Eastern Europe Neuromorphic Computing Market Market Revenue (US$ Mn) Comparison by By End-Use (2016-2032)
- Figure 94: Eastern Europe Neuromorphic Computing Market Market Revenue (US$ Mn) Comparison by By Application (2016-2032)
- Figure 95: Eastern Europe Neuromorphic Computing Market Market Y-o-Y Growth Rate Comparison by Country (2016-2032)
- Figure 96: Eastern Europe Neuromorphic Computing Market Market Y-o-Y Growth Rate Comparison by By Component (2016-2032)
- Figure 97: Eastern Europe Neuromorphic Computing Market Market Y-o-Y Growth Rate Comparison by By Deployment (2016-2032)
- Figure 98: Eastern Europe Neuromorphic Computing Market Market Y-o-Y Growth Rate Comparison by By End-Use (2016-2032)
- Figure 99: Eastern Europe Neuromorphic Computing Market Market Y-o-Y Growth Rate Comparison by By Application (2016-2032)
- Figure 100: Eastern Europe Neuromorphic Computing Market Market Share Comparison by Country (2016-2032)
- Figure 101: Eastern Europe Neuromorphic Computing Market Market Share Comparison by By Component (2016-2032)
- Figure 102: Eastern Europe Neuromorphic Computing Market Market Share Comparison by By Deployment (2016-2032)
- Figure 103: Eastern Europe Neuromorphic Computing Market Market Share Comparison by By End-Use (2016-2032)
- Figure 104: Eastern Europe Neuromorphic Computing Market Market Share Comparison by By Application (2016-2032)
- Figure 105: APAC Neuromorphic Computing Market Revenue (US$ Mn) Market Share by By Componentin 2022
- Figure 106: APAC Neuromorphic Computing Market Market Attractiveness Analysis by By Component, 2016-2032
- Figure 107: APAC Neuromorphic Computing Market Revenue (US$ Mn) Market Share by By Deploymentin 2022
- Figure 108: APAC Neuromorphic Computing Market Market Attractiveness Analysis by By Deployment, 2016-2032
- Figure 109: APAC Neuromorphic Computing Market Revenue (US$ Mn) Market Share by By End-Usein 2022
- Figure 110: APAC Neuromorphic Computing Market Market Attractiveness Analysis by By End-Use, 2016-2032
- Figure 111: APAC Neuromorphic Computing Market Revenue (US$ Mn) Market Share by By Applicationin 2022
- Figure 112: APAC Neuromorphic Computing Market Market Attractiveness Analysis by By Application, 2016-2032
- Figure 113: APAC Neuromorphic Computing Market Revenue (US$ Mn) Market Share by Country in 2022
- Figure 114: APAC Neuromorphic Computing Market Market Attractiveness Analysis by Country, 2016-2032
- Figure 115: APAC Neuromorphic Computing Market Market Revenue (US$ Mn) (2016-2032)
- Figure 116: APAC Neuromorphic Computing Market Market Revenue (US$ Mn) Comparison by Country (2016-2032)
- Figure 117: APAC Neuromorphic Computing Market Market Revenue (US$ Mn) Comparison by By Component (2016-2032)
- Figure 118: APAC Neuromorphic Computing Market Market Revenue (US$ Mn) Comparison by By Deployment (2016-2032)
- Figure 119: APAC Neuromorphic Computing Market Market Revenue (US$ Mn) Comparison by By End-Use (2016-2032)
- Figure 120: APAC Neuromorphic Computing Market Market Revenue (US$ Mn) Comparison by By Application (2016-2032)
- Figure 121: APAC Neuromorphic Computing Market Market Y-o-Y Growth Rate Comparison by Country (2016-2032)
- Figure 122: APAC Neuromorphic Computing Market Market Y-o-Y Growth Rate Comparison by By Component (2016-2032)
- Figure 123: APAC Neuromorphic Computing Market Market Y-o-Y Growth Rate Comparison by By Deployment (2016-2032)
- Figure 124: APAC Neuromorphic Computing Market Market Y-o-Y Growth Rate Comparison by By End-Use (2016-2032)
- Figure 125: APAC Neuromorphic Computing Market Market Y-o-Y Growth Rate Comparison by By Application (2016-2032)
- Figure 126: APAC Neuromorphic Computing Market Market Share Comparison by Country (2016-2032)
- Figure 127: APAC Neuromorphic Computing Market Market Share Comparison by By Component (2016-2032)
- Figure 128: APAC Neuromorphic Computing Market Market Share Comparison by By Deployment (2016-2032)
- Figure 129: APAC Neuromorphic Computing Market Market Share Comparison by By End-Use (2016-2032)
- Figure 130: APAC Neuromorphic Computing Market Market Share Comparison by By Application (2016-2032)
- Figure 131: Latin America Neuromorphic Computing Market Revenue (US$ Mn) Market Share by By Componentin 2022
- Figure 132: Latin America Neuromorphic Computing Market Market Attractiveness Analysis by By Component, 2016-2032
- Figure 133: Latin America Neuromorphic Computing Market Revenue (US$ Mn) Market Share by By Deploymentin 2022
- Figure 134: Latin America Neuromorphic Computing Market Market Attractiveness Analysis by By Deployment, 2016-2032
- Figure 135: Latin America Neuromorphic Computing Market Revenue (US$ Mn) Market Share by By End-Usein 2022
- Figure 136: Latin America Neuromorphic Computing Market Market Attractiveness Analysis by By End-Use, 2016-2032
- Figure 137: Latin America Neuromorphic Computing Market Revenue (US$ Mn) Market Share by By Applicationin 2022
- Figure 138: Latin America Neuromorphic Computing Market Market Attractiveness Analysis by By Application, 2016-2032
- Figure 139: Latin America Neuromorphic Computing Market Revenue (US$ Mn) Market Share by Country in 2022
- Figure 140: Latin America Neuromorphic Computing Market Market Attractiveness Analysis by Country, 2016-2032
- Figure 141: Latin America Neuromorphic Computing Market Market Revenue (US$ Mn) (2016-2032)
- Figure 142: Latin America Neuromorphic Computing Market Market Revenue (US$ Mn) Comparison by Country (2016-2032)
- Figure 143: Latin America Neuromorphic Computing Market Market Revenue (US$ Mn) Comparison by By Component (2016-2032)
- Figure 144: Latin America Neuromorphic Computing Market Market Revenue (US$ Mn) Comparison by By Deployment (2016-2032)
- Figure 145: Latin America Neuromorphic Computing Market Market Revenue (US$ Mn) Comparison by By End-Use (2016-2032)
- Figure 146: Latin America Neuromorphic Computing Market Market Revenue (US$ Mn) Comparison by By Application (2016-2032)
- Figure 147: Latin America Neuromorphic Computing Market Market Y-o-Y Growth Rate Comparison by Country (2016-2032)
- Figure 148: Latin America Neuromorphic Computing Market Market Y-o-Y Growth Rate Comparison by By Component (2016-2032)
- Figure 149: Latin America Neuromorphic Computing Market Market Y-o-Y Growth Rate Comparison by By Deployment (2016-2032)
- Figure 150: Latin America Neuromorphic Computing Market Market Y-o-Y Growth Rate Comparison by By End-Use (2016-2032)
- Figure 151: Latin America Neuromorphic Computing Market Market Y-o-Y Growth Rate Comparison by By Application (2016-2032)
- Figure 152: Latin America Neuromorphic Computing Market Market Share Comparison by Country (2016-2032)
- Figure 153: Latin America Neuromorphic Computing Market Market Share Comparison by By Component (2016-2032)
- Figure 154: Latin America Neuromorphic Computing Market Market Share Comparison by By Deployment (2016-2032)
- Figure 155: Latin America Neuromorphic Computing Market Market Share Comparison by By End-Use (2016-2032)
- Figure 156: Latin America Neuromorphic Computing Market Market Share Comparison by By Application (2016-2032)
- Figure 157: Middle East & Africa Neuromorphic Computing Market Revenue (US$ Mn) Market Share by By Componentin 2022
- Figure 158: Middle East & Africa Neuromorphic Computing Market Market Attractiveness Analysis by By Component, 2016-2032
- Figure 159: Middle East & Africa Neuromorphic Computing Market Revenue (US$ Mn) Market Share by By Deploymentin 2022
- Figure 160: Middle East & Africa Neuromorphic Computing Market Market Attractiveness Analysis by By Deployment, 2016-2032
- Figure 161: Middle East & Africa Neuromorphic Computing Market Revenue (US$ Mn) Market Share by By End-Usein 2022
- Figure 162: Middle East & Africa Neuromorphic Computing Market Market Attractiveness Analysis by By End-Use, 2016-2032
- Figure 163: Middle East & Africa Neuromorphic Computing Market Revenue (US$ Mn) Market Share by By Applicationin 2022
- Figure 164: Middle East & Africa Neuromorphic Computing Market Market Attractiveness Analysis by By Application, 2016-2032
- Figure 165: Middle East & Africa Neuromorphic Computing Market Revenue (US$ Mn) Market Share by Country in 2022
- Figure 166: Middle East & Africa Neuromorphic Computing Market Market Attractiveness Analysis by Country, 2016-2032
- Figure 167: Middle East & Africa Neuromorphic Computing Market Market Revenue (US$ Mn) (2016-2032)
- Figure 168: Middle East & Africa Neuromorphic Computing Market Market Revenue (US$ Mn) Comparison by Country (2016-2032)
- Figure 169: Middle East & Africa Neuromorphic Computing Market Market Revenue (US$ Mn) Comparison by By Component (2016-2032)
- Figure 170: Middle East & Africa Neuromorphic Computing Market Market Revenue (US$ Mn) Comparison by By Deployment (2016-2032)
- Figure 171: Middle East & Africa Neuromorphic Computing Market Market Revenue (US$ Mn) Comparison by By End-Use (2016-2032)
- Figure 172: Middle East & Africa Neuromorphic Computing Market Market Revenue (US$ Mn) Comparison by By Application (2016-2032)
- Figure 173: Middle East & Africa Neuromorphic Computing Market Market Y-o-Y Growth Rate Comparison by Country (2016-2032)
- Figure 174: Middle East & Africa Neuromorphic Computing Market Market Y-o-Y Growth Rate Comparison by By Component (2016-2032)
- Figure 175: Middle East & Africa Neuromorphic Computing Market Market Y-o-Y Growth Rate Comparison by By Deployment (2016-2032)
- Figure 176: Middle East & Africa Neuromorphic Computing Market Market Y-o-Y Growth Rate Comparison by By End-Use (2016-2032)
- Figure 177: Middle East & Africa Neuromorphic Computing Market Market Y-o-Y Growth Rate Comparison by By Application (2016-2032)
- Figure 178: Middle East & Africa Neuromorphic Computing Market Market Share Comparison by Country (2016-2032)
- Figure 179: Middle East & Africa Neuromorphic Computing Market Market Share Comparison by By Component (2016-2032)
- Figure 180: Middle East & Africa Neuromorphic Computing Market Market Share Comparison by By Deployment (2016-2032)
- Figure 181: Middle East & Africa Neuromorphic Computing Market Market Share Comparison by By End-Use (2016-2032)
- Figure 182: Middle East & Africa Neuromorphic Computing Market Market Share Comparison by By Application (2016-2032)
List of Tables
-
- Table 1: Global Neuromorphic Computing Market Market Comparison by By Component (2016-2032)
- Table 2: Global Neuromorphic Computing Market Market Comparison by By Deployment (2016-2032)
- Table 3: Global Neuromorphic Computing Market Market Comparison by By End-Use (2016-2032)
- Table 4: Global Neuromorphic Computing Market Market Comparison by By Application (2016-2032)
- Table 5: Global Neuromorphic Computing Market Revenue (US$ Mn) Comparison by Region (2016-2032)
- Table 6: Global Neuromorphic Computing Market Market Revenue (US$ Mn) (2016-2032)
- Table 7: Global Neuromorphic Computing Market Market Revenue (US$ Mn) Comparison by Region (2016-2032)
- Table 8: Global Neuromorphic Computing Market Market Revenue (US$ Mn) Comparison by By Component (2016-2032)
- Table 9: Global Neuromorphic Computing Market Market Revenue (US$ Mn) Comparison by By Deployment (2016-2032)
- Table 10: Global Neuromorphic Computing Market Market Revenue (US$ Mn) Comparison by By End-Use (2016-2032)
- Table 11: Global Neuromorphic Computing Market Market Revenue (US$ Mn) Comparison by By Application (2016-2032)
- Table 12: Global Neuromorphic Computing Market Market Y-o-Y Growth Rate Comparison by Region (2016-2032)
- Table 13: Global Neuromorphic Computing Market Market Y-o-Y Growth Rate Comparison by By Component (2016-2032)
- Table 14: Global Neuromorphic Computing Market Market Y-o-Y Growth Rate Comparison by By Deployment (2016-2032)
- Table 15: Global Neuromorphic Computing Market Market Y-o-Y Growth Rate Comparison by By End-Use (2016-2032)
- Table 16: Global Neuromorphic Computing Market Market Y-o-Y Growth Rate Comparison by By Application (2016-2032)
- Table 17: Global Neuromorphic Computing Market Market Share Comparison by Region (2016-2032)
- Table 18: Global Neuromorphic Computing Market Market Share Comparison by By Component (2016-2032)
- Table 19: Global Neuromorphic Computing Market Market Share Comparison by By Deployment (2016-2032)
- Table 20: Global Neuromorphic Computing Market Market Share Comparison by By End-Use (2016-2032)
- Table 21: Global Neuromorphic Computing Market Market Share Comparison by By Application (2016-2032)
- Table 22: North America Neuromorphic Computing Market Market Comparison by By Deployment (2016-2032)
- Table 23: North America Neuromorphic Computing Market Market Comparison by By End-Use (2016-2032)
- Table 24: North America Neuromorphic Computing Market Market Comparison by By Application (2016-2032)
- Table 25: North America Neuromorphic Computing Market Revenue (US$ Mn) Comparison by Country (2016-2032)
- Table 26: North America Neuromorphic Computing Market Market Revenue (US$ Mn) (2016-2032)
- Table 27: North America Neuromorphic Computing Market Market Revenue (US$ Mn) Comparison by Country (2016-2032)
- Table 28: North America Neuromorphic Computing Market Market Revenue (US$ Mn) Comparison by By Component (2016-2032)
- Table 29: North America Neuromorphic Computing Market Market Revenue (US$ Mn) Comparison by By Deployment (2016-2032)
- Table 30: North America Neuromorphic Computing Market Market Revenue (US$ Mn) Comparison by By End-Use (2016-2032)
- Table 31: North America Neuromorphic Computing Market Market Revenue (US$ Mn) Comparison by By Application (2016-2032)
- Table 32: North America Neuromorphic Computing Market Market Y-o-Y Growth Rate Comparison by Country (2016-2032)
- Table 33: North America Neuromorphic Computing Market Market Y-o-Y Growth Rate Comparison by By Component (2016-2032)
- Table 34: North America Neuromorphic Computing Market Market Y-o-Y Growth Rate Comparison by By Deployment (2016-2032)
- Table 35: North America Neuromorphic Computing Market Market Y-o-Y Growth Rate Comparison by By End-Use (2016-2032)
- Table 36: North America Neuromorphic Computing Market Market Y-o-Y Growth Rate Comparison by By Application (2016-2032)
- Table 37: North America Neuromorphic Computing Market Market Share Comparison by Country (2016-2032)
- Table 38: North America Neuromorphic Computing Market Market Share Comparison by By Component (2016-2032)
- Table 39: North America Neuromorphic Computing Market Market Share Comparison by By Deployment (2016-2032)
- Table 40: North America Neuromorphic Computing Market Market Share Comparison by By End-Use (2016-2032)
- Table 41: North America Neuromorphic Computing Market Market Share Comparison by By Application (2016-2032)
- Table 42: Western Europe Neuromorphic Computing Market Market Comparison by By Component (2016-2032)
- Table 43: Western Europe Neuromorphic Computing Market Market Comparison by By Deployment (2016-2032)
- Table 44: Western Europe Neuromorphic Computing Market Market Comparison by By End-Use (2016-2032)
- Table 45: Western Europe Neuromorphic Computing Market Market Comparison by By Application (2016-2032)
- Table 46: Western Europe Neuromorphic Computing Market Revenue (US$ Mn) Comparison by Country (2016-2032)
- Table 47: Western Europe Neuromorphic Computing Market Market Revenue (US$ Mn) (2016-2032)
- Table 48: Western Europe Neuromorphic Computing Market Market Revenue (US$ Mn) Comparison by Country (2016-2032)
- Table 49: Western Europe Neuromorphic Computing Market Market Revenue (US$ Mn) Comparison by By Component (2016-2032)
- Table 50: Western Europe Neuromorphic Computing Market Market Revenue (US$ Mn) Comparison by By Deployment (2016-2032)
- Table 51: Western Europe Neuromorphic Computing Market Market Revenue (US$ Mn) Comparison by By End-Use (2016-2032)
- Table 52: Western Europe Neuromorphic Computing Market Market Revenue (US$ Mn) Comparison by By Application (2016-2032)
- Table 53: Western Europe Neuromorphic Computing Market Market Y-o-Y Growth Rate Comparison by Country (2016-2032)
- Table 54: Western Europe Neuromorphic Computing Market Market Y-o-Y Growth Rate Comparison by By Component (2016-2032)
- Table 55: Western Europe Neuromorphic Computing Market Market Y-o-Y Growth Rate Comparison by By Deployment (2016-2032)
- Table 56: Western Europe Neuromorphic Computing Market Market Y-o-Y Growth Rate Comparison by By End-Use (2016-2032)
- Table 57: Western Europe Neuromorphic Computing Market Market Y-o-Y Growth Rate Comparison by By Application (2016-2032)
- Table 58: Western Europe Neuromorphic Computing Market Market Share Comparison by Country (2016-2032)
- Table 59: Western Europe Neuromorphic Computing Market Market Share Comparison by By Component (2016-2032)
- Table 60: Western Europe Neuromorphic Computing Market Market Share Comparison by By Deployment (2016-2032)
- Table 61: Western Europe Neuromorphic Computing Market Market Share Comparison by By End-Use (2016-2032)
- Table 62: Western Europe Neuromorphic Computing Market Market Share Comparison by By Application (2016-2032)
- Table 63: Eastern Europe Neuromorphic Computing Market Market Comparison by By Component (2016-2032)
- Table 64: Eastern Europe Neuromorphic Computing Market Market Comparison by By Deployment (2016-2032)
- Table 65: Eastern Europe Neuromorphic Computing Market Market Comparison by By End-Use (2016-2032)
- Table 66: Eastern Europe Neuromorphic Computing Market Market Comparison by By Application (2016-2032)
- Table 67: Eastern Europe Neuromorphic Computing Market Revenue (US$ Mn) Comparison by Country (2016-2032)
- Table 68: Eastern Europe Neuromorphic Computing Market Market Revenue (US$ Mn) (2016-2032)
- Table 69: Eastern Europe Neuromorphic Computing Market Market Revenue (US$ Mn) Comparison by Country (2016-2032)
- Table 70: Eastern Europe Neuromorphic Computing Market Market Revenue (US$ Mn) Comparison by By Component (2016-2032)
- Table 71: Eastern Europe Neuromorphic Computing Market Market Revenue (US$ Mn) Comparison by By Deployment (2016-2032)
- Table 72: Eastern Europe Neuromorphic Computing Market Market Revenue (US$ Mn) Comparison by By End-Use (2016-2032)
- Table 73: Eastern Europe Neuromorphic Computing Market Market Revenue (US$ Mn) Comparison by By Application (2016-2032)
- Table 74: Eastern Europe Neuromorphic Computing Market Market Y-o-Y Growth Rate Comparison by Country (2016-2032)
- Table 75: Eastern Europe Neuromorphic Computing Market Market Y-o-Y Growth Rate Comparison by By Component (2016-2032)
- Table 76: Eastern Europe Neuromorphic Computing Market Market Y-o-Y Growth Rate Comparison by By Deployment (2016-2032)
- Table 77: Eastern Europe Neuromorphic Computing Market Market Y-o-Y Growth Rate Comparison by By End-Use (2016-2032)
- Table 78: Eastern Europe Neuromorphic Computing Market Market Y-o-Y Growth Rate Comparison by By Application (2016-2032)
- Table 79: Eastern Europe Neuromorphic Computing Market Market Share Comparison by Country (2016-2032)
- Table 80: Eastern Europe Neuromorphic Computing Market Market Share Comparison by By Component (2016-2032)
- Table 81: Eastern Europe Neuromorphic Computing Market Market Share Comparison by By Deployment (2016-2032)
- Table 82: Eastern Europe Neuromorphic Computing Market Market Share Comparison by By End-Use (2016-2032)
- Table 83: Eastern Europe Neuromorphic Computing Market Market Share Comparison by By Application (2016-2032)
- Table 84: APAC Neuromorphic Computing Market Market Comparison by By Component (2016-2032)
- Table 85: APAC Neuromorphic Computing Market Market Comparison by By Deployment (2016-2032)
- Table 86: APAC Neuromorphic Computing Market Market Comparison by By End-Use (2016-2032)
- Table 87: APAC Neuromorphic Computing Market Market Comparison by By Application (2016-2032)
- Table 88: APAC Neuromorphic Computing Market Revenue (US$ Mn) Comparison by Country (2016-2032)
- Table 89: APAC Neuromorphic Computing Market Market Revenue (US$ Mn) (2016-2032)
- Table 90: APAC Neuromorphic Computing Market Market Revenue (US$ Mn) Comparison by Country (2016-2032)
- Table 91: APAC Neuromorphic Computing Market Market Revenue (US$ Mn) Comparison by By Component (2016-2032)
- Table 92: APAC Neuromorphic Computing Market Market Revenue (US$ Mn) Comparison by By Deployment (2016-2032)
- Table 93: APAC Neuromorphic Computing Market Market Revenue (US$ Mn) Comparison by By End-Use (2016-2032)
- Table 94: APAC Neuromorphic Computing Market Market Revenue (US$ Mn) Comparison by By Application (2016-2032)
- Table 95: APAC Neuromorphic Computing Market Market Y-o-Y Growth Rate Comparison by Country (2016-2032)
- Table 96: APAC Neuromorphic Computing Market Market Y-o-Y Growth Rate Comparison by By Component (2016-2032)
- Table 97: APAC Neuromorphic Computing Market Market Y-o-Y Growth Rate Comparison by By Deployment (2016-2032)
- Table 98: APAC Neuromorphic Computing Market Market Y-o-Y Growth Rate Comparison by By End-Use (2016-2032)
- Table 99: APAC Neuromorphic Computing Market Market Y-o-Y Growth Rate Comparison by By Application (2016-2032)
- Table 100: APAC Neuromorphic Computing Market Market Share Comparison by Country (2016-2032)
- Table 101: APAC Neuromorphic Computing Market Market Share Comparison by By Component (2016-2032)
- Table 102: APAC Neuromorphic Computing Market Market Share Comparison by By Deployment (2016-2032)
- Table 103: APAC Neuromorphic Computing Market Market Share Comparison by By End-Use (2016-2032)
- Table 104: APAC Neuromorphic Computing Market Market Share Comparison by By Application (2016-2032)
- Table 105: Latin America Neuromorphic Computing Market Market Comparison by By Component (2016-2032)
- Table 106: Latin America Neuromorphic Computing Market Market Comparison by By Deployment (2016-2032)
- Table 107: Latin America Neuromorphic Computing Market Market Comparison by By End-Use (2016-2032)
- Table 108: Latin America Neuromorphic Computing Market Market Comparison by By Application (2016-2032)
- Table 109: Latin America Neuromorphic Computing Market Revenue (US$ Mn) Comparison by Country (2016-2032)
- Table 110: Latin America Neuromorphic Computing Market Market Revenue (US$ Mn) (2016-2032)
- Table 111: Latin America Neuromorphic Computing Market Market Revenue (US$ Mn) Comparison by Country (2016-2032)
- Table 112: Latin America Neuromorphic Computing Market Market Revenue (US$ Mn) Comparison by By Component (2016-2032)
- Table 113: Latin America Neuromorphic Computing Market Market Revenue (US$ Mn) Comparison by By Deployment (2016-2032)
- Table 114: Latin America Neuromorphic Computing Market Market Revenue (US$ Mn) Comparison by By End-Use (2016-2032)
- Table 115: Latin America Neuromorphic Computing Market Market Revenue (US$ Mn) Comparison by By Application (2016-2032)
- Table 116: Latin America Neuromorphic Computing Market Market Y-o-Y Growth Rate Comparison by Country (2016-2032)
- Table 117: Latin America Neuromorphic Computing Market Market Y-o-Y Growth Rate Comparison by By Component (2016-2032)
- Table 118: Latin America Neuromorphic Computing Market Market Y-o-Y Growth Rate Comparison by By Deployment (2016-2032)
- Table 119: Latin America Neuromorphic Computing Market Market Y-o-Y Growth Rate Comparison by By End-Use (2016-2032)
- Table 120: Latin America Neuromorphic Computing Market Market Y-o-Y Growth Rate Comparison by By Application (2016-2032)
- Table 121: Latin America Neuromorphic Computing Market Market Share Comparison by Country (2016-2032)
- Table 122: Latin America Neuromorphic Computing Market Market Share Comparison by By Component (2016-2032)
- Table 123: Latin America Neuromorphic Computing Market Market Share Comparison by By Deployment (2016-2032)
- Table 124: Latin America Neuromorphic Computing Market Market Share Comparison by By End-Use (2016-2032)
- Table 125: Latin America Neuromorphic Computing Market Market Share Comparison by By Application (2016-2032)
- Table 126: Middle East & Africa Neuromorphic Computing Market Market Comparison by By Component (2016-2032)
- Table 127: Middle East & Africa Neuromorphic Computing Market Market Comparison by By Deployment (2016-2032)
- Table 128: Middle East & Africa Neuromorphic Computing Market Market Comparison by By End-Use (2016-2032)
- Table 129: Middle East & Africa Neuromorphic Computing Market Market Comparison by By Application (2016-2032)
- Table 130: Middle East & Africa Neuromorphic Computing Market Revenue (US$ Mn) Comparison by Country (2016-2032)
- Table 131: Middle East & Africa Neuromorphic Computing Market Market Revenue (US$ Mn) (2016-2032)
- Table 132: Middle East & Africa Neuromorphic Computing Market Market Revenue (US$ Mn) Comparison by Country (2016-2032)
- Table 133: Middle East & Africa Neuromorphic Computing Market Market Revenue (US$ Mn) Comparison by By Component (2016-2032)
- Table 134: Middle East & Africa Neuromorphic Computing Market Market Revenue (US$ Mn) Comparison by By Deployment (2016-2032)
- Table 135: Middle East & Africa Neuromorphic Computing Market Market Revenue (US$ Mn) Comparison by By End-Use (2016-2032)
- Table 136: Middle East & Africa Neuromorphic Computing Market Market Revenue (US$ Mn) Comparison by By Application (2016-2032)
- Table 137: Middle East & Africa Neuromorphic Computing Market Market Y-o-Y Growth Rate Comparison by Country (2016-2032)
- Table 138: Middle East & Africa Neuromorphic Computing Market Market Y-o-Y Growth Rate Comparison by By Component (2016-2032)
- Table 139: Middle East & Africa Neuromorphic Computing Market Market Y-o-Y Growth Rate Comparison by By Deployment (2016-2032)
- Table 140: Middle East & Africa Neuromorphic Computing Market Market Y-o-Y Growth Rate Comparison by By End-Use (2016-2032)
- Table 141: Middle East & Africa Neuromorphic Computing Market Market Y-o-Y Growth Rate Comparison by By Application (2016-2032)
- Table 142: Middle East & Africa Neuromorphic Computing Market Market Share Comparison by Country (2016-2032)
- Table 143: Middle East & Africa Neuromorphic Computing Market Market Share Comparison by By Component (2016-2032)
- Table 144: Middle East & Africa Neuromorphic Computing Market Market Share Comparison by By Deployment (2016-2032)
- Table 145: Middle East & Africa Neuromorphic Computing Market Market Share Comparison by By End-Use (2016-2032)
- Table 146: Middle East & Africa Neuromorphic Computing Market Market Share Comparison by By Application (2016-2032)
- 1. Executive Summary
-
Our Clients


View Our Licence Options
