
Nanotechnology Market By Type (Nano Composites, Nano Materials, Nano Tools, Nano Devices, Others), By Application (Healthcare, Environment, Energy, Food and Agriculture, Information and Technology, Others), By End User (Electronics, Cosmetics, Pharmaceutical, Biotechnology, Others), By Region And Companies - Industry Segment Outlook, Market Assessment, Competition Scenario, Trends, And Forecast 2024-2033
-
51006
-
September 2024
-
300
-


-
This report was compiled by Vishwa Gaul Vishwa is an experienced market research and consulting professional with over 8 years of expertise in the ICT industry, contributing to over 700 reports across telecommunications, software, hardware, and digital solutions. Correspondence Team Lead- ICT Linkedin | Detailed Market research Methodology Our methodology involves a mix of primary research, including interviews with leading mental health experts, and secondary research from reputable medical journals and databases. View Detailed Methodology Page
-
Quick Navigation
Report Overview
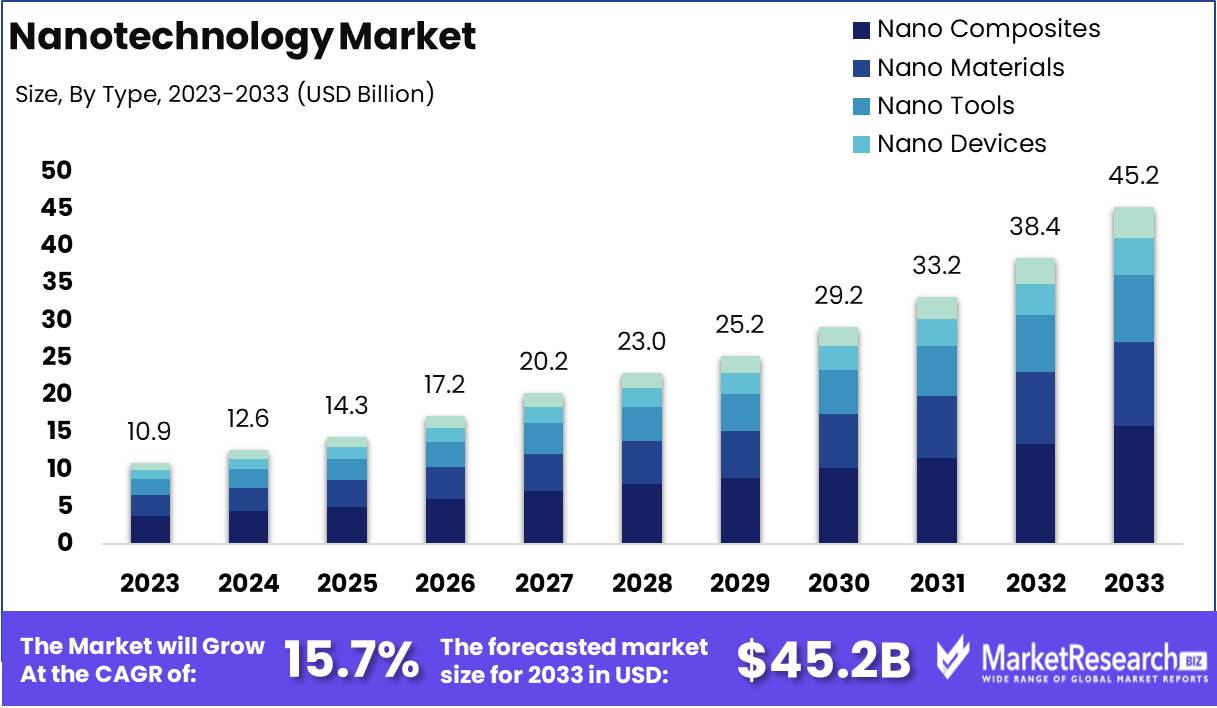
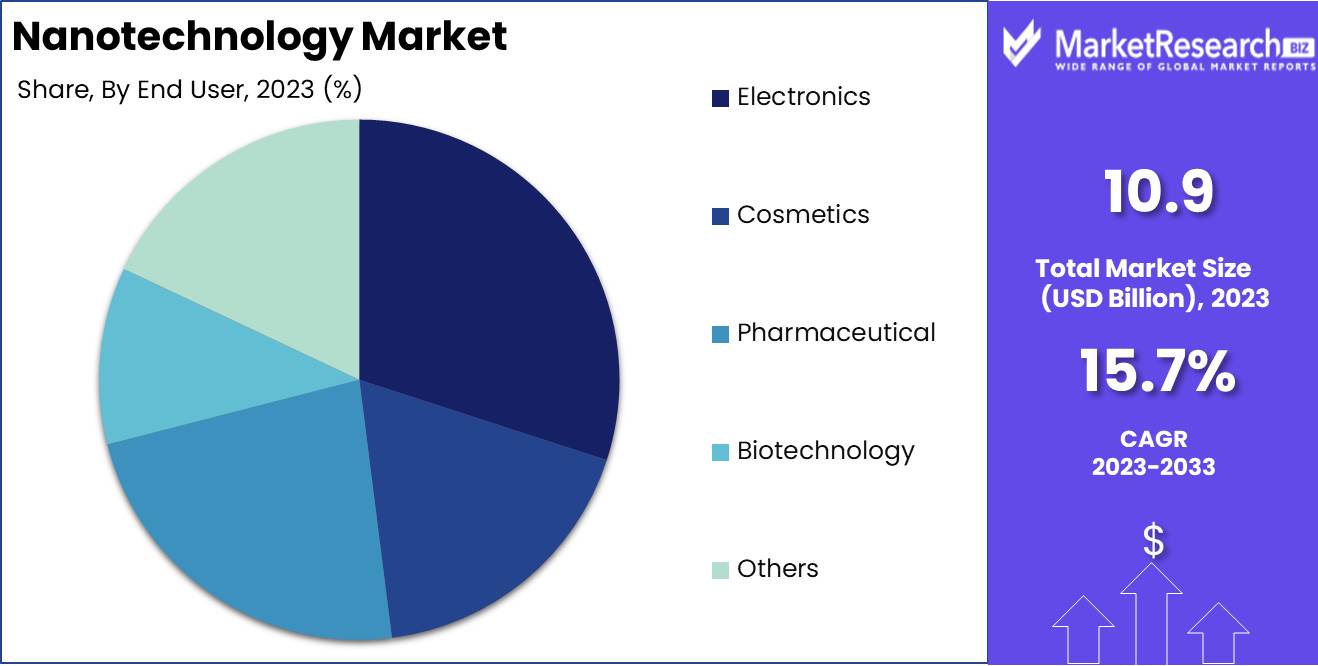
The Nanotechnology Market was valued at USD 10.9 billion in 2023. It is expected to reach USD 45.2 billion by 2033, with a CAGR of 15.7% during the forecast period from 2024 to 2033.
The nanotechnology market encompasses the development, production, and application of materials and devices on a nanoscale, typically between 1 and 100 nanometers. This interdisciplinary field integrates principles from physics, chemistry, biology, and engineering to manipulate matter at the atomic and molecular levels. Key applications include advanced materials, electronics, pharmaceuticals, and energy solutions, which offer enhanced performance and novel functionalities.
The nanotechnology market is positioned for substantial growth driven by ongoing technological advancements and rising demand for advanced materials across various sectors. Innovations in nanomaterials, including nanoparticles and nanostructures, are enhancing the functionality and performance of products in industries such as electronics, healthcare, and energy. This technological progression is anticipated to spur increased applications, fostering the expansion of the nanotechnology market. The demand for advanced materials, characterized by their superior properties such as strength, flexibility, and conductivity, is accelerating due to their critical role in modern manufacturing and product development.
However, the market's trajectory is not without challenges. Regulatory and safety concerns surrounding nanotechnology necessitate stringent guidelines and comprehensive risk assessments to ensure the safe use of nanomaterials. Despite these hurdles, the market exhibits a positive growth trajectory, bolstered by a global emphasis on sustainable development. The integration of nanotechnology in sustainable practices, such as energy-efficient materials and environmentally friendly manufacturing processes, underscores its potential to contribute to long-term sustainability goals. Overall, while regulatory and safety concerns must be meticulously managed, the ongoing advancements and increasing demand for high-performance materials are set to drive robust growth in the nanotechnology market.
Key Takeaways
- Market Growth: The Nanotechnology Market was valued at USD 10.9 billion in 2023. It is expected to reach USD 45.2 billion by 2033, with a CAGR of 15.7% during the forecast period from 2024 to 2033.
- By Type: Nano Composites dominated the Nano Materials segment, driving growth.
- By Application: Healthcare dominated the Nanotechnology Market, driving substantial growth.
- By End User: Electronics led the Nanotechnology Market with dominant innovations.
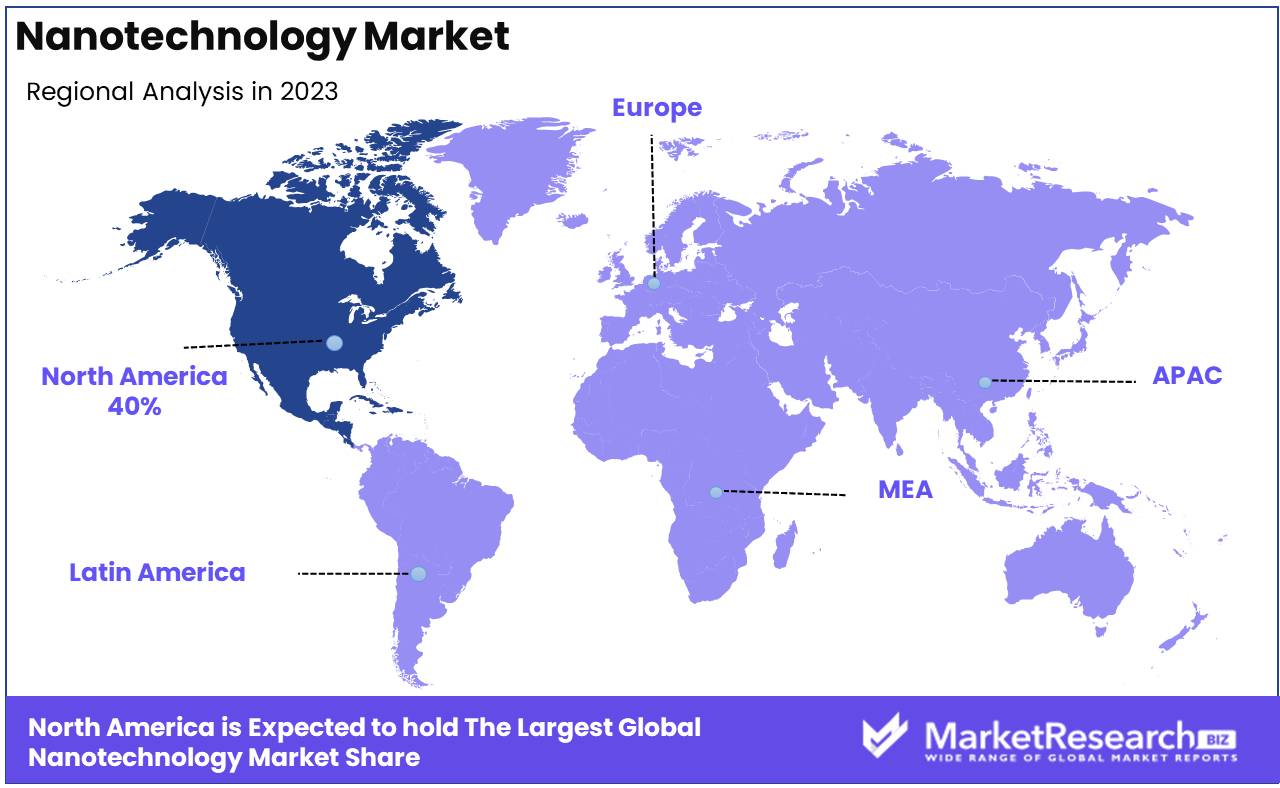
- Regional Dominance: North America dominates the nanotechnology market with a 40% largest share.
- Growth Opportunity: Nanotechnology offers significant growth opportunities through advancements in medical diagnostics and aerospace materials, enhancing performance and precision.
Driving factors
Rising Investments Fuel Nanotechnology Market Expansion
The rapid growth of the nanotechnology market is significantly driven by increasing investments from both public and private sectors. According to recent reports, global investments in nanotechnology have surpassed $30 billion annually, reflecting a robust commitment to advancing this field. This financial influx is directed toward research and development (R&D) activities, technology commercialization, and scaling up production capabilities. The substantial capital investment is pivotal in accelerating innovation, enhancing product development, and expanding application areas, thereby propelling the market's expansion.
Investment in nanotechnology is also facilitated by venture capitalists and government grants, which aim to support high-risk, high-reward projects. These investments are crucial for overcoming the technical and commercial challenges associated with nanotechnology, such as high production costs and complex regulatory requirements. As a result, increased funding is translating into a growing number of startups and established companies entering the nanotechnology space, which further stimulates market growth.
Healthcare Advancements Drive Nanotechnology Utilization
The healthcare sector represents one of the most promising application areas for nanotechnology, contributing significantly to market growth. Nanotechnology is revolutionizing healthcare by enabling advanced diagnostics, targeted drug delivery, and personalized medicine. For instance, the development of nanoscale drug delivery systems allows for more precise targeting of therapeutics, improving efficacy and reducing side effects.
Additionally, nanosensors and imaging technologies are enhancing diagnostic capabilities by enabling earlier and more accurate disease detection. The global market for nanotechnology in healthcare is projected to grow at a compound annual growth rate (CAGR) of 11% over the next five years, driven by these advancements. The integration of nanotechnology into healthcare is expected to address various unmet medical needs and improve patient outcomes, thereby expanding its market share and fostering further research and development in this domain.
Supportive Regulatory Framework Enhances Market Confidence
A supportive regulatory framework plays a crucial role in the growth of the nanotechnology market by providing clear guidelines and standards that facilitate the development and commercialization of nanotechnology products. Regulatory bodies, such as the U.S. Food and Drug Administration (FDA) and the European Medicines Agency (EMA), have established specific regulations for nanotechnology applications in medicine, ensuring that products are safe and effective. The implementation of comprehensive regulatory policies helps in mitigating risks associated with nanotechnology, such as potential environmental and health impacts. It also fosters public trust and encourages investment by reducing uncertainty. As regulatory frameworks become more standardized and streamlined, they facilitate market entry and innovation, contributing to overall market growth.
Restraining Factors
Issues and Concerns in Nanotech Product Development
The development of nanotechnology products faces several significant challenges that impact the overall growth of the market. Primarily, issues related to the complexity of manufacturing processes and the need for precise control at the nanoscale contribute to delays and increased costs. Nanotechnology involves manipulating matter at an atomic or molecular scale, which necessitates advanced equipment and specialized knowledge. The high cost of research and development (R&D) and the difficulty in scaling up production from laboratory settings to commercial applications further exacerbate these challenges.
Moreover, there are concerns regarding the safety and environmental impact of nanomaterials. Potential risks, including toxicity and the unknown long-term effects of nanoscale substances on human health and the environment, can lead to stringent regulatory requirements. As a result, manufacturers may face additional hurdles in proving the safety and efficacy of their products, which can delay market entry and increase development costs.
Lack of Standard Evaluation Methods and Bureaucratic Delays
The absence of standardized evaluation methods for nanotechnology poses a significant barrier to market growth. The field of nanotechnology is still relatively new, and there is a lack of universally accepted protocols for testing and assessing nanomaterials. This inconsistency in evaluation methods can lead to variability in product quality and performance, which in turn affects consumer confidence and market acceptance. Bureaucratic delays also play a crucial role in restraining market growth. Regulatory agencies are often cautious in their approach to new technologies, and the process of obtaining approvals for nanotechnology products can be lengthy and complex. Delays in regulatory approvals can postpone the commercial release of new products and deter investment in the sector. According to the National Nanotechnology Initiative, the time required for regulatory approval can range from several months to several years, depending on the complexity of the product and the regulatory framework in place.
By Type Analysis
In 2023, Nano Composites dominated the Nano Materials segment, driving growth.
In 2023, Nano Composites held a dominant market position in the Nano Materials segment of the Nanotechnology Market. The proliferation of nanocomposites can be attributed to their superior mechanical properties and versatility, which have led to their extensive application across various industries including automotive, aerospace, and electronics. These composites offer enhanced strength, durability, and lightweight characteristics, which are highly valued in manufacturing advanced materials.
Nano Materials also witnessed significant growth, driven by their broad utilization in sectors such as healthcare, energy, and electronics due to their unique properties at the nanoscale. Nano Tools, which include scanning probe microscopes and nanoparticle synthesis equipment, maintained a crucial role by enabling precise manipulation and analysis of nanoscale materials.
The Nano Devices sector, encompassing nanosensors and nanoelectronics, experienced increased adoption as advancements in miniaturization and performance continue to push the boundaries of technology. Other segments, incorporating emerging and niche technologies, showed incremental growth as innovation in nanotechnology evolved. The combined growth across these segments underscores the robust expansion and diversification within the nanotechnology market.
By Application Analysis
In 2023, Healthcare dominated the Nanotechnology Market, driving substantial growth.
In 2023, The Healthcare sector held a dominant market position in the Nanotechnology Market by application segment. The substantial growth in this sector can be attributed to the increasing adoption of nanotechnology in drug delivery systems, diagnostics, and therapeutic interventions. Advances in nanomedicine, such as nanoparticle-based targeted drug delivery and imaging agents, have significantly enhanced the effectiveness of treatments while minimizing side effects.
The Environment segment of the Nanotechnology Market is characterized by the application of nanotechnology in pollution control, waste treatment, and environmental monitoring. Nanomaterials are employed in water purification processes to remove contaminants and in air filtration systems to address particulate matter. The Energy segment benefits from nanotechnology through advancements in energy storage, such as enhanced battery performance and more efficient solar cells.
In Food and Agriculture, nanotechnology is utilized to improve food safety and enhance crop yield through better pest management. The Information and Technology segment leverages nanotechnology to develop smaller, faster, and more efficient electronic components. Other applications include advancements in textiles, cosmetics, and construction materials. The diverse applications of nanotechnology across these sectors underscore its transformative potential and drive for innovation.
By End User Analysis
In 2023, Electronics led the Nanotechnology Market with dominant innovations.
In 2023, The Electronics segment held a dominant market position in the Nanotechnology Market, accounting for a substantial share of the overall market. This prominence is attributed to the extensive integration of nanotechnology into electronic components and devices, driven by the demand for enhanced performance and miniaturization. Nanotechnology applications in electronics encompass the development of advanced semiconductors, flexible displays, and high-efficiency batteries, which have revolutionized consumer electronics and industrial applications. The push towards smaller, more powerful, and energy-efficient electronic devices has significantly fueled the growth of this segment.
The Cosmetics segment of the Nanotechnology Market also witnessed notable advancements in 2023, owing to the increasing adoption of nanotechnology in cosmetic formulations. Nanotechnology's role in this sector primarily involves the use of nanoparticles for improved delivery and efficacy of active ingredients. Enhanced skin penetration and controlled release mechanisms have led to the development of innovative skincare and anti-aging products. The cosmetic industry's shift towards incorporating nanotechnology-driven products reflects consumer demand for more effective and technologically advanced beauty solutions.
In the Pharmaceutical segment, nanotechnology has been instrumental in revolutionizing drug delivery systems and therapeutic applications. The ability to engineer nanoparticles for targeted drug delivery and controlled release has significantly advanced treatment efficacy and reduced side effects. This segment's growth is supported by increasing research and development activities aimed at leveraging nanotechnology to address complex medical conditions.
The Biotechnology sector has also benefited from nanotechnology, with applications ranging from diagnostic tools to therapeutic interventions. Nanotechnology's ability to enhance biological imaging and facilitate novel therapeutic approaches has spurred innovation in biotech research and development.
Finally, the Others segment encompasses various niche applications of nanotechnology, including environmental and energy sectors, contributing to overall market diversification and growth.
Key Market Segments
By Type
- Nano Composites
- Nano Materials
- Nano Tools
- Nano Devices
- Others
By Application
- Healthcare
- Environment
- Energy
- Food and Agriculture
- Information and Technology
- Others
By End User
- Electronics
- Cosmetics
- Pharmaceutical
- Biotechnology
- Others
Growth Opportunity
Expansion in Medical Diagnostics and Imaging
The global nanotechnology market is poised for significant growth, driven by advancements in medical diagnostics and imaging. The integration of nanotechnology into medical diagnostics has emerged as a pivotal trend, offering innovative solutions for early disease detection and enhanced imaging techniques. Nanoparticles and nanoscale sensors are increasingly utilized for their ability to provide high-resolution images and targeted diagnostic capabilities. This technology enables more precise detection of biomarkers and disease markers, leading to earlier and more accurate diagnoses. As the healthcare sector continues to prioritize personalized medicine and early intervention, the demand for nanotechnology-based diagnostic tools is expected to rise substantially.
Demand for Advanced Materials in Aerospace
Another critical growth opportunity within the nanotechnology sector is the rising demand for lightweight and high-performance materials in the aerospace industry. Nanotechnology facilitates the development of advanced materials with superior strength-to-weight ratios, thermal stability, and enhanced durability. These materials are crucial for the aerospace sector, where reducing weight while maintaining performance is essential for improving fuel efficiency and overall operational efficacy. The application of nanomaterials in aerospace components such as composites and coatings enhances their mechanical properties and resistance to environmental factors. This trend aligns with the aerospace industry's ongoing efforts to innovate and improve performance, positioning nanotechnology as a key enabler of future advancements.
Latest Trends
Integration of Advanced Technologies in the Nanotechnology Market
The nanotechnology market is poised for substantial growth, driven by the integration of advanced technologies that are enhancing the functionality and application scope of nanomaterials. Notably, the convergence of nanotechnology with artificial intelligence (AI) and machine learning (ML) is transforming the sector by enabling more precise design, development, and deployment of nanomaterials. AI-driven algorithms are facilitating the discovery of novel nanomaterials with tailored properties, while ML models are optimizing the manufacturing processes and predicting the performance of nanomaterials in various applications. This integration not only accelerates innovation but also reduces the time-to-market for advanced nanotechnology products.
Additionally, the synergy between nanotechnology and biotechnology is fostering the development of sophisticated biomedical applications, including targeted drug delivery systems and diagnostic tools, thereby expanding the market’s potential across diverse sectors.
Nanoencapsulation: Enhancing Stability and Efficacy of Nanomaterials
Another significant trend in the nanotechnology market is the advancement of nanoencapsulation techniques, which enhance the stability, bioavailability, and efficacy of nanomaterials. Nanoencapsulation involves enclosing active substances within nanometer-sized carriers, thereby improving their solubility and stability in various environments. This technology is particularly transformative in pharmaceuticals, where it is used to protect sensitive drugs from degradation and to achieve controlled release profiles, leading to improved therapeutic outcomes. In the food and beverage industry, nanoencapsulation is being employed to enhance flavor, preserve nutrients, and extend shelf life.
Furthermore, advancements in encapsulation materials and methods are driving innovations in agriculture and cosmetics, where they are utilized to deliver active ingredients more effectively. The growing adoption of nanoencapsulation across these diverse applications underscores its pivotal role in advancing the capabilities and market potential of nanotechnology.
Regional Analysis
North America dominates the nanotechnology market with a 40% largest share.
The nanotechnology market exhibits notable regional disparities, with North America emerging as the leading region due to its advanced research infrastructure and significant investment in nanotechnology innovations. In 2023, North America commanded approximately 40% of the global nanotechnology market, driven by substantial funding from government agencies, such as the National Science Foundation, and a robust presence of major industry players. The region's dominance is further supported by a high concentration of research institutions and an established ecosystem for technology commercialization.
In Europe, the nanotechnology market is also expanding, though at a slightly slower pace compared to North America. The region accounted for approximately 30% of the global market share in 2023. Europe's growth is supported by various funding initiatives from the European Union, such as Horizon Europe, and a focus on integrating nanotechnology across multiple industries, including healthcare and energy.
Asia Pacific is experiencing rapid growth in the nanotechnology sector, with the region holding a market share of around 25% in 2023. This growth is fueled by increasing industrial applications and government-supported research programs, particularly in countries like China and Japan, which are investing heavily in nanotechnology R&D and manufacturing.
The Middle East & Africa and Latin America represent smaller segments of the market, collectively accounting for about 5% of the global share. These regions are gradually developing their nanotechnology capabilities, supported by strategic investments and collaborations with international research institutions.
Key Regions and Countries
North America
- The US
- Canada
- Rest of North America
Europe
- Germany
- France
- The UK
- Spain
- Netherlands
- Russia
- Italy
- Rest of Europe
Asia-Pacific
- China
- Japan
- Singapore
- Thailand
- South Korea
- Vietnam
- India
- New Zealand
- Rest of Asia Pacific
Latin America
- Mexico
- Brazil
- Rest of Latin America
Middle East & Africa
- Saudi Arabia
- South Africa
- UAE
- Rest of the Middle East & Africa
Key Players Analysis
The global nanotechnology market is characterized by significant contributions from several key players, each advancing the industry through specialized technologies and applications.
Showa Denko KK is notable for its expertise in manufacturing advanced nanomaterials, particularly in the production of carbon nanotubes and other high-performance materials. The company's ongoing investments in research and development underscore its commitment to enhancing the capabilities and applications of nanotechnology across various industries. BASF SE leverages its extensive chemical expertise to drive innovations in nanotechnology, focusing on applications ranging from catalysts to materials science. Its strong emphasis on integrating nanotechnology into its core business units positions BASF as a leader in commercializing nanomaterials for industrial and consumer products.
Pen Inc. is recognized for its advancements in nanotechnology applications within the electronics sector, including nano-enabled components that enhance performance and miniaturization. The company's focus on high-tech applications and intellectual property development underlines its strategic positioning in the market. Nanosys Inc. and QD Vision are pivotal in the field of quantum dot technology, which has applications in display technologies, lighting, and medical diagnostics. Their proprietary technologies in quantum dot manufacturing are critical in driving innovations and expanding market opportunities.
Arkema and ApNano Materials are key players in developing and commercializing nanomaterials with diverse applications, including energy storage and environmental solutions. Their contributions to the field reflect a strong emphasis on sustainability and performance enhancement. 3rd Tech Inc., ELITechGroup, Bruker Nano GmbH, and QuantumSphere Inc. provide specialized solutions in nanotechnology, ranging from advanced analytical instruments to innovative nanomaterial applications. Their role in advancing research and commercialization is instrumental in shaping the future landscape of the global nanotechnology market.
Market Key Players
- Showa Denko KK
- BASF SE
- Pen Inc.
- Nanosys Inc.
- QD vision
- Arkema
- 3rd Tech Inc.
- ApNano Materials
- ELITechGroup
- Bruker Nano GmbH
- QuantumSphere Inc.
Recent Development
- In July 2024, IBM announced a significant breakthrough in nanotechnology with the development of a new class of nanomaterials designed for use in quantum computing. This advancement is based on the integration of carbon nanotubes with advanced semiconductor processes. The technology promises to enhance the performance and stability of quantum bits, potentially accelerating the commercialization of quantum computers. This development reflects IBM's ongoing commitment to advancing nanotechnology for next-generation computing applications.
- In June 2024, Taiwan Semiconductor Manufacturing Company (TSMC) unveiled plans to invest $5 billion into a new research and development facility focused on nanoelectronics. The facility, set to be operational by the end of 2024, will concentrate on advancing 2nm and 1nm semiconductor nodes. TSMC's investment underscores the importance of nanotechnology in the future of semiconductor manufacturing, aiming to drive forward the miniaturization of electronic components and improve device performance.
- In March 2024, Researchers at the University of Cambridge launched a new initiative aimed at developing nanomedicine solutions for targeted cancer therapy. This project involves the use of nanocarriers to deliver chemotherapy drugs directly to cancer cells, minimizing side effects and enhancing treatment efficacy. The initiative, funded by a $10 million grant from the Wellcome Trust, represents a significant step forward in the application of nanotechnology in personalized medicine and cancer treatment.
Report Scope
Report Features Description Market Value (2023) USD 10.9 Billion Forecast Revenue (2033) USD 45.2 Billion CAGR (2024-2032) 15.7% Base Year for Estimation 2023 Historic Period 2016-2023 Forecast Period 2024-2033 Report Coverage Revenue Forecast, Market Dynamics, COVID-19 Impact, Competitive Landscape, Recent Developments Segments Covered By Type (Nano Composites, Nano Materials, Nano Tools, Nano Devices, Others), By Application (Healthcare, Environment, Energy, Food and Agriculture, Information and Technology, Others), By End User (Electronics, Cosmetics, Pharmaceutical, Biotechnology, Others) Regional Analysis North America - The US, Canada, Rest of North America, Europe - Germany, France, The UK, Spain, Italy, Russia, Netherlands, Rest of Europe, Asia-Pacific - China, Japan, South Korea, India, New Zealand, Singapore, Thailand, Vietnam, Rest of Asia Pacific, Latin America - Brazil, Mexico, Rest of Latin America, Middle East & Africa - South Africa, Saudi Arabia, UAE, Rest of Middle East & Africa Competitive Landscape Showa Denko KK, BASF SE, Pen Inc., Nanosys Inc., QD vision, Arkema, 3rd Tech Inc., ApNano Materials, ELITechGroup, Bruker Nano GmbH, QuantumSphere Inc. Customization Scope Customization for segments, region/country-level will be provided. Moreover, additional customization can be done based on the requirements. Purchase Options We have three licenses to opt for Single User License, Multi-User License (Up to 5 Users), Corporate Use License (Unlimited User and Printable PDF) -
- 1. Executive Summary
- 1.1. Definition
- 1.2. Taxonomy
- 1.3. Research Scope
- 1.4. Key Analysis
- 1.5. Key Findings by Major Segments
- 1.6. Top strategies by Major Players
- 2. Global Nanotechnology Market Overview
- 2.1. Nanotechnology Market Dynamics
- 2.1.1. Drivers
- 2.1.2. Opportunities
- 2.1.3. Restraints
- 2.1.4. Challenges
- 2.2. Macro-economic Factors
- 2.3. Regulatory Framework
- 2.4. Market Investment Feasibility Index
- 2.5. PEST Analysis
- 2.6. PORTER’S Five Force Analysis
- 2.7. Drivers & Restraints Impact Analysis
- 2.8. Industry Chain Analysis
- 2.9. Cost Structure Analysis
- 2.10. Marketing Strategy
- 2.11. Russia-Ukraine War Impact Analysis
- 2.12. Opportunity Map Analysis
- 2.13. Market Competition Scenario Analysis
- 2.14. Product Life Cycle Analysis
- 2.15. Opportunity Orbits
- 2.16. Manufacturer Intensity Map
- 2.17. Major Companies sales by Value & Volume
- 2.1. Nanotechnology Market Dynamics
- 3. Global Nanotechnology Market Analysis, Opportunity and Forecast, 2016-2032
- 3.1. Global Nanotechnology Market Analysis, 2016-2021
- 3.2. Global Nanotechnology Market Opportunity and Forecast, 2023-2032
- 3.3. Global Nanotechnology Market Analysis, Opportunity and Forecast, By Type, 2016-2032
- 3.3.1. Global Nanotechnology Market Analysis by Type: Introduction
- 3.3.2. Market Size Absolute $ Opportunity Analysis and Forecast, By Type, 2016-2032
- 3.3.3. Nano Composites
- 3.3.4. Nano Materials
- 3.3.5. Nano Tools
- 3.3.6. Nano Devices
- 3.3.7. Others
- 3.4. Global Nanotechnology Market Analysis, Opportunity and Forecast, By Application, 2016-2032
- 3.4.1. Global Nanotechnology Market Analysis by Application: Introduction
- 3.4.2. Market Size Absolute $ Opportunity Analysis and Forecast, By Application, 2016-2032
- 3.4.3. Healthcare
- 3.4.4. Environment
- 3.4.5. Energy
- 3.4.6. Food and Agriculture
- 3.4.7. Information and Technology
- 3.4.8. Others
- 3.5. Global Nanotechnology Market Analysis, Opportunity and Forecast, By End User, 2016-2032
- 3.5.1. Global Nanotechnology Market Analysis by End User: Introduction
- 3.5.2. Market Size Absolute $ Opportunity Analysis and Forecast, By End User, 2016-2032
- 3.5.3. Electronics
- 3.5.4. Cosmetics
- 3.5.5. Pharmaceutical
- 3.5.6. Biotechnology
- 3.5.7. Others
- 4. North America Nanotechnology Market Analysis, Opportunity and Forecast, 2016-2032
- 4.1. North America Nanotechnology Market Analysis, 2016-2021
- 4.2. North America Nanotechnology Market Opportunity and Forecast, 2023-2032
- 4.3. North America Nanotechnology Market Analysis, Opportunity and Forecast, By Type, 2016-2032
- 4.3.1. North America Nanotechnology Market Analysis by Type: Introduction
- 4.3.2. Market Size Absolute $ Opportunity Analysis and Forecast, By Type, 2016-2032
- 4.3.3. Nano Composites
- 4.3.4. Nano Materials
- 4.3.5. Nano Tools
- 4.3.6. Nano Devices
- 4.3.7. Others
- 4.4. North America Nanotechnology Market Analysis, Opportunity and Forecast, By Application, 2016-2032
- 4.4.1. North America Nanotechnology Market Analysis by Application: Introduction
- 4.4.2. Market Size Absolute $ Opportunity Analysis and Forecast, By Application, 2016-2032
- 4.4.3. Healthcare
- 4.4.4. Environment
- 4.4.5. Energy
- 4.4.6. Food and Agriculture
- 4.4.7. Information and Technology
- 4.4.8. Others
- 4.5. North America Nanotechnology Market Analysis, Opportunity and Forecast, By End User, 2016-2032
- 4.5.1. North America Nanotechnology Market Analysis by End User: Introduction
- 4.5.2. Market Size Absolute $ Opportunity Analysis and Forecast, By End User, 2016-2032
- 4.5.3. Electronics
- 4.5.4. Cosmetics
- 4.5.5. Pharmaceutical
- 4.5.6. Biotechnology
- 4.5.7. Others
- 4.6. North America Nanotechnology Market Analysis, Opportunity and Forecast, By Country , 2016-2032
- 4.6.1. North America Nanotechnology Market Analysis by Country : Introduction
- 4.6.2. Market Size Absolute $ Opportunity Analysis and Forecast, Country , 2016-2032
- 4.6.2.1. The US
- 4.6.2.2. Canada
- 4.6.2.3. Mexico
- 5. Western Europe Nanotechnology Market Analysis, Opportunity and Forecast, 2016-2032
- 5.1. Western Europe Nanotechnology Market Analysis, 2016-2021
- 5.2. Western Europe Nanotechnology Market Opportunity and Forecast, 2023-2032
- 5.3. Western Europe Nanotechnology Market Analysis, Opportunity and Forecast, By Type, 2016-2032
- 5.3.1. Western Europe Nanotechnology Market Analysis by Type: Introduction
- 5.3.2. Market Size Absolute $ Opportunity Analysis and Forecast, By Type, 2016-2032
- 5.3.3. Nano Composites
- 5.3.4. Nano Materials
- 5.3.5. Nano Tools
- 5.3.6. Nano Devices
- 5.3.7. Others
- 5.4. Western Europe Nanotechnology Market Analysis, Opportunity and Forecast, By Application, 2016-2032
- 5.4.1. Western Europe Nanotechnology Market Analysis by Application: Introduction
- 5.4.2. Market Size Absolute $ Opportunity Analysis and Forecast, By Application, 2016-2032
- 5.4.3. Healthcare
- 5.4.4. Environment
- 5.4.5. Energy
- 5.4.6. Food and Agriculture
- 5.4.7. Information and Technology
- 5.4.8. Others
- 5.5. Western Europe Nanotechnology Market Analysis, Opportunity and Forecast, By End User, 2016-2032
- 5.5.1. Western Europe Nanotechnology Market Analysis by End User: Introduction
- 5.5.2. Market Size Absolute $ Opportunity Analysis and Forecast, By End User, 2016-2032
- 5.5.3. Electronics
- 5.5.4. Cosmetics
- 5.5.5. Pharmaceutical
- 5.5.6. Biotechnology
- 5.5.7. Others
- 5.6. Western Europe Nanotechnology Market Analysis, Opportunity and Forecast, By Country , 2016-2032
- 5.6.1. Western Europe Nanotechnology Market Analysis by Country : Introduction
- 5.6.2. Market Size Absolute $ Opportunity Analysis and Forecast, Country , 2016-2032
- 5.6.2.1. Germany
- 5.6.2.2. France
- 5.6.2.3. The UK
- 5.6.2.4. Spain
- 5.6.2.5. Italy
- 5.6.2.6. Portugal
- 5.6.2.7. Ireland
- 5.6.2.8. Austria
- 5.6.2.9. Switzerland
- 5.6.2.10. Benelux
- 5.6.2.11. Nordic
- 5.6.2.12. Rest of Western Europe
- 6. Eastern Europe Nanotechnology Market Analysis, Opportunity and Forecast, 2016-2032
- 6.1. Eastern Europe Nanotechnology Market Analysis, 2016-2021
- 6.2. Eastern Europe Nanotechnology Market Opportunity and Forecast, 2023-2032
- 6.3. Eastern Europe Nanotechnology Market Analysis, Opportunity and Forecast, By Type, 2016-2032
- 6.3.1. Eastern Europe Nanotechnology Market Analysis by Type: Introduction
- 6.3.2. Market Size Absolute $ Opportunity Analysis and Forecast, By Type, 2016-2032
- 6.3.3. Nano Composites
- 6.3.4. Nano Materials
- 6.3.5. Nano Tools
- 6.3.6. Nano Devices
- 6.3.7. Others
- 6.4. Eastern Europe Nanotechnology Market Analysis, Opportunity and Forecast, By Application, 2016-2032
- 6.4.1. Eastern Europe Nanotechnology Market Analysis by Application: Introduction
- 6.4.2. Market Size Absolute $ Opportunity Analysis and Forecast, By Application, 2016-2032
- 6.4.3. Healthcare
- 6.4.4. Environment
- 6.4.5. Energy
- 6.4.6. Food and Agriculture
- 6.4.7. Information and Technology
- 6.4.8. Others
- 6.5. Eastern Europe Nanotechnology Market Analysis, Opportunity and Forecast, By End User, 2016-2032
- 6.5.1. Eastern Europe Nanotechnology Market Analysis by End User: Introduction
- 6.5.2. Market Size Absolute $ Opportunity Analysis and Forecast, By End User, 2016-2032
- 6.5.3. Electronics
- 6.5.4. Cosmetics
- 6.5.5. Pharmaceutical
- 6.5.6. Biotechnology
- 6.5.7. Others
- 6.6. Eastern Europe Nanotechnology Market Analysis, Opportunity and Forecast, By Country , 2016-2032
- 6.6.1. Eastern Europe Nanotechnology Market Analysis by Country : Introduction
- 6.6.2. Market Size Absolute $ Opportunity Analysis and Forecast, Country , 2016-2032
- 6.6.2.1. Russia
- 6.6.2.2. Poland
- 6.6.2.3. The Czech Republic
- 6.6.2.4. Greece
- 6.6.2.5. Rest of Eastern Europe
- 7. APAC Nanotechnology Market Analysis, Opportunity and Forecast, 2016-2032
- 7.1. APAC Nanotechnology Market Analysis, 2016-2021
- 7.2. APAC Nanotechnology Market Opportunity and Forecast, 2023-2032
- 7.3. APAC Nanotechnology Market Analysis, Opportunity and Forecast, By Type, 2016-2032
- 7.3.1. APAC Nanotechnology Market Analysis by Type: Introduction
- 7.3.2. Market Size Absolute $ Opportunity Analysis and Forecast, By Type, 2016-2032
- 7.3.3. Nano Composites
- 7.3.4. Nano Materials
- 7.3.5. Nano Tools
- 7.3.6. Nano Devices
- 7.3.7. Others
- 7.4. APAC Nanotechnology Market Analysis, Opportunity and Forecast, By Application, 2016-2032
- 7.4.1. APAC Nanotechnology Market Analysis by Application: Introduction
- 7.4.2. Market Size Absolute $ Opportunity Analysis and Forecast, By Application, 2016-2032
- 7.4.3. Healthcare
- 7.4.4. Environment
- 7.4.5. Energy
- 7.4.6. Food and Agriculture
- 7.4.7. Information and Technology
- 7.4.8. Others
- 7.5. APAC Nanotechnology Market Analysis, Opportunity and Forecast, By End User, 2016-2032
- 7.5.1. APAC Nanotechnology Market Analysis by End User: Introduction
- 7.5.2. Market Size Absolute $ Opportunity Analysis and Forecast, By End User, 2016-2032
- 7.5.3. Electronics
- 7.5.4. Cosmetics
- 7.5.5. Pharmaceutical
- 7.5.6. Biotechnology
- 7.5.7. Others
- 7.6. APAC Nanotechnology Market Analysis, Opportunity and Forecast, By Country , 2016-2032
- 7.6.1. APAC Nanotechnology Market Analysis by Country : Introduction
- 7.6.2. Market Size Absolute $ Opportunity Analysis and Forecast, Country , 2016-2032
- 7.6.2.1. China
- 7.6.2.2. Japan
- 7.6.2.3. South Korea
- 7.6.2.4. India
- 7.6.2.5. Australia & New Zeland
- 7.6.2.6. Indonesia
- 7.6.2.7. Malaysia
- 7.6.2.8. Philippines
- 7.6.2.9. Singapore
- 7.6.2.10. Thailand
- 7.6.2.11. Vietnam
- 7.6.2.12. Rest of APAC
- 8. Latin America Nanotechnology Market Analysis, Opportunity and Forecast, 2016-2032
- 8.1. Latin America Nanotechnology Market Analysis, 2016-2021
- 8.2. Latin America Nanotechnology Market Opportunity and Forecast, 2023-2032
- 8.3. Latin America Nanotechnology Market Analysis, Opportunity and Forecast, By Type, 2016-2032
- 8.3.1. Latin America Nanotechnology Market Analysis by Type: Introduction
- 8.3.2. Market Size Absolute $ Opportunity Analysis and Forecast, By Type, 2016-2032
- 8.3.3. Nano Composites
- 8.3.4. Nano Materials
- 8.3.5. Nano Tools
- 8.3.6. Nano Devices
- 8.3.7. Others
- 8.4. Latin America Nanotechnology Market Analysis, Opportunity and Forecast, By Application, 2016-2032
- 8.4.1. Latin America Nanotechnology Market Analysis by Application: Introduction
- 8.4.2. Market Size Absolute $ Opportunity Analysis and Forecast, By Application, 2016-2032
- 8.4.3. Healthcare
- 8.4.4. Environment
- 8.4.5. Energy
- 8.4.6. Food and Agriculture
- 8.4.7. Information and Technology
- 8.4.8. Others
- 8.5. Latin America Nanotechnology Market Analysis, Opportunity and Forecast, By End User, 2016-2032
- 8.5.1. Latin America Nanotechnology Market Analysis by End User: Introduction
- 8.5.2. Market Size Absolute $ Opportunity Analysis and Forecast, By End User, 2016-2032
- 8.5.3. Electronics
- 8.5.4. Cosmetics
- 8.5.5. Pharmaceutical
- 8.5.6. Biotechnology
- 8.5.7. Others
- 8.6. Latin America Nanotechnology Market Analysis, Opportunity and Forecast, By Country , 2016-2032
- 8.6.1. Latin America Nanotechnology Market Analysis by Country : Introduction
- 8.6.2. Market Size Absolute $ Opportunity Analysis and Forecast, Country , 2016-2032
- 8.6.2.1. Brazil
- 8.6.2.2. Colombia
- 8.6.2.3. Chile
- 8.6.2.4. Argentina
- 8.6.2.5. Costa Rica
- 8.6.2.6. Rest of Latin America
- 9. Middle East & Africa Nanotechnology Market Analysis, Opportunity and Forecast, 2016-2032
- 9.1. Middle East & Africa Nanotechnology Market Analysis, 2016-2021
- 9.2. Middle East & Africa Nanotechnology Market Opportunity and Forecast, 2023-2032
- 9.3. Middle East & Africa Nanotechnology Market Analysis, Opportunity and Forecast, By Type, 2016-2032
- 9.3.1. Middle East & Africa Nanotechnology Market Analysis by Type: Introduction
- 9.3.2. Market Size Absolute $ Opportunity Analysis and Forecast, By Type, 2016-2032
- 9.3.3. Nano Composites
- 9.3.4. Nano Materials
- 9.3.5. Nano Tools
- 9.3.6. Nano Devices
- 9.3.7. Others
- 9.4. Middle East & Africa Nanotechnology Market Analysis, Opportunity and Forecast, By Application, 2016-2032
- 9.4.1. Middle East & Africa Nanotechnology Market Analysis by Application: Introduction
- 9.4.2. Market Size Absolute $ Opportunity Analysis and Forecast, By Application, 2016-2032
- 9.4.3. Healthcare
- 9.4.4. Environment
- 9.4.5. Energy
- 9.4.6. Food and Agriculture
- 9.4.7. Information and Technology
- 9.4.8. Others
- 9.5. Middle East & Africa Nanotechnology Market Analysis, Opportunity and Forecast, By End User, 2016-2032
- 9.5.1. Middle East & Africa Nanotechnology Market Analysis by End User: Introduction
- 9.5.2. Market Size Absolute $ Opportunity Analysis and Forecast, By End User, 2016-2032
- 9.5.3. Electronics
- 9.5.4. Cosmetics
- 9.5.5. Pharmaceutical
- 9.5.6. Biotechnology
- 9.5.7. Others
- 9.6. Middle East & Africa Nanotechnology Market Analysis, Opportunity and Forecast, By Country , 2016-2032
- 9.6.1. Middle East & Africa Nanotechnology Market Analysis by Country : Introduction
- 9.6.2. Market Size Absolute $ Opportunity Analysis and Forecast, Country , 2016-2032
- 9.6.2.1. Algeria
- 9.6.2.2. Egypt
- 9.6.2.3. Israel
- 9.6.2.4. Kuwait
- 9.6.2.5. Nigeria
- 9.6.2.6. Saudi Arabia
- 9.6.2.7. South Africa
- 9.6.2.8. Turkey
- 9.6.2.9. The UAE
- 9.6.2.10. Rest of MEA
- 10. Global Nanotechnology Market Analysis, Opportunity and Forecast, By Region , 2016-2032
- 10.1. Global Nanotechnology Market Analysis by Region : Introduction
- 10.2. Market Size Absolute $ Opportunity Analysis and Forecast, By Region , 2016-2032
- 10.2.1. North America
- 10.2.2. Western Europe
- 10.2.3. Eastern Europe
- 10.2.4. APAC
- 10.2.5. Latin America
- 10.2.6. Middle East & Africa
- 11. Global Nanotechnology Market Competitive Landscape, Market Share Analysis, and Company Profiles
- 11.1. Market Share Analysis
- 11.2. Company Profiles
- 11.3. Showa Denko KK
- 11.3.1. Company Overview
- 11.3.2. Financial Highlights
- 11.3.3. Product Portfolio
- 11.3.4. SWOT Analysis
- 11.3.5. Key Strategies and Developments
- 11.4. BASF SE
- 11.4.1. Company Overview
- 11.4.2. Financial Highlights
- 11.4.3. Product Portfolio
- 11.4.4. SWOT Analysis
- 11.4.5. Key Strategies and Developments
- 11.5. Pen Inc.
- 11.5.1. Company Overview
- 11.5.2. Financial Highlights
- 11.5.3. Product Portfolio
- 11.5.4. SWOT Analysis
- 11.5.5. Key Strategies and Developments
- 11.6. Nanosys Inc.
- 11.6.1. Company Overview
- 11.6.2. Financial Highlights
- 11.6.3. Product Portfolio
- 11.6.4. SWOT Analysis
- 11.6.5. Key Strategies and Developments
- 11.7. QD vision
- 11.7.1. Company Overview
- 11.7.2. Financial Highlights
- 11.7.3. Product Portfolio
- 11.7.4. SWOT Analysis
- 11.7.5. Key Strategies and Developments
- 11.8. Arkema
- 11.8.1. Company Overview
- 11.8.2. Financial Highlights
- 11.8.3. Product Portfolio
- 11.8.4. SWOT Analysis
- 11.8.5. Key Strategies and Developments
- 11.9. 3rd Tech Inc.
- 11.9.1. Company Overview
- 11.9.2. Financial Highlights
- 11.9.3. Product Portfolio
- 11.9.4. SWOT Analysis
- 11.9.5. Key Strategies and Developments
- 11.10. ApNano Materials
- 11.10.1. Company Overview
- 11.10.2. Financial Highlights
- 11.10.3. Product Portfolio
- 11.10.4. SWOT Analysis
- 11.10.5. Key Strategies and Developments
- 11.11. ELITechGroup
- 11.11.1. Company Overview
- 11.11.2. Financial Highlights
- 11.11.3. Product Portfolio
- 11.11.4. SWOT Analysis
- 11.11.5. Key Strategies and Developments
- 11.12. Bruker Nano GmbH
- 11.12.1. Company Overview
- 11.12.2. Financial Highlights
- 11.12.3. Product Portfolio
- 11.12.4. SWOT Analysis
- 11.12.5. Key Strategies and Developments
- 11.13.1. Company Overview
- 11.13.2. Financial Highlights
- 11.13.3. Product Portfolio
- 11.13.4. SWOT Analysis
- 11.13.5. Key Strategies and Developments
- 11.14. QuantumSphere Inc.
- 11.14.1. Company Overview
- 11.14.2. Financial Highlights
- 11.14.3. Product Portfolio
- 11.14.4. SWOT Analysis
- 11.14.5. Key Strategies and Developments
- 12. Assumptions and Acronyms
- 13. Research Methodology
- 14. Contact
"
- List of Figures
- "
- Figure 1: Global Nanotechnology Market Revenue (US$ Mn) Market Share by Type in 2022
- Figure 2: Global Nanotechnology Market Market Attractiveness Analysis by Type, 2016-2032
- Figure 3: Global Nanotechnology Market Revenue (US$ Mn) Market Share by Applicationin 2022
- Figure 4: Global Nanotechnology Market Market Attractiveness Analysis by Application, 2016-2032
- Figure 5: Global Nanotechnology Market Revenue (US$ Mn) Market Share by End Userin 2022
- Figure 6: Global Nanotechnology Market Market Attractiveness Analysis by End User, 2016-2032
- Figure 7: Global Nanotechnology Market Revenue (US$ Mn) Market Share by Region in 2022
- Figure 8: Global Nanotechnology Market Market Attractiveness Analysis by Region, 2016-2032
- Figure 9: Global Nanotechnology Market Market Revenue (US$ Mn) (2016-2032)
- Figure 10: Global Nanotechnology Market Market Revenue (US$ Mn) Comparison by Region (2016-2032)
- Figure 11: Global Nanotechnology Market Market Revenue (US$ Mn) Comparison by Type (2016-2032)
- Figure 12: Global Nanotechnology Market Market Revenue (US$ Mn) Comparison by Application (2016-2032)
- Figure 13: Global Nanotechnology Market Market Revenue (US$ Mn) Comparison by End User (2016-2032)
- Figure 14: Global Nanotechnology Market Market Y-o-Y Growth Rate Comparison by Region (2016-2032)
- Figure 15: Global Nanotechnology Market Market Y-o-Y Growth Rate Comparison by Type (2016-2032)
- Figure 16: Global Nanotechnology Market Market Y-o-Y Growth Rate Comparison by Application (2016-2032)
- Figure 17: Global Nanotechnology Market Market Y-o-Y Growth Rate Comparison by End User (2016-2032)
- Figure 18: Global Nanotechnology Market Market Share Comparison by Region (2016-2032)
- Figure 19: Global Nanotechnology Market Market Share Comparison by Type (2016-2032)
- Figure 20: Global Nanotechnology Market Market Share Comparison by Application (2016-2032)
- Figure 21: Global Nanotechnology Market Market Share Comparison by End User (2016-2032)
- Figure 22: North America Nanotechnology Market Revenue (US$ Mn) Market Share by Typein 2022
- Figure 23: North America Nanotechnology Market Market Attractiveness Analysis by Type, 2016-2032
- Figure 24: North America Nanotechnology Market Revenue (US$ Mn) Market Share by Applicationin 2022
- Figure 25: North America Nanotechnology Market Market Attractiveness Analysis by Application, 2016-2032
- Figure 26: North America Nanotechnology Market Revenue (US$ Mn) Market Share by End Userin 2022
- Figure 27: North America Nanotechnology Market Market Attractiveness Analysis by End User, 2016-2032
- Figure 28: North America Nanotechnology Market Revenue (US$ Mn) Market Share by Country in 2022
- Figure 29: North America Nanotechnology Market Market Attractiveness Analysis by Country, 2016-2032
- Figure 30: North America Nanotechnology Market Market Revenue (US$ Mn) (2016-2032)
- Figure 31: North America Nanotechnology Market Market Revenue (US$ Mn) Comparison by Country (2016-2032)
- Figure 32: North America Nanotechnology Market Market Revenue (US$ Mn) Comparison by Type (2016-2032)
- Figure 33: North America Nanotechnology Market Market Revenue (US$ Mn) Comparison by Application (2016-2032)
- Figure 34: North America Nanotechnology Market Market Revenue (US$ Mn) Comparison by End User (2016-2032)
- Figure 35: North America Nanotechnology Market Market Y-o-Y Growth Rate Comparison by Country (2016-2032)
- Figure 36: North America Nanotechnology Market Market Y-o-Y Growth Rate Comparison by Type (2016-2032)
- Figure 37: North America Nanotechnology Market Market Y-o-Y Growth Rate Comparison by Application (2016-2032)
- Figure 38: North America Nanotechnology Market Market Y-o-Y Growth Rate Comparison by End User (2016-2032)
- Figure 39: North America Nanotechnology Market Market Share Comparison by Country (2016-2032)
- Figure 40: North America Nanotechnology Market Market Share Comparison by Type (2016-2032)
- Figure 41: North America Nanotechnology Market Market Share Comparison by Application (2016-2032)
- Figure 42: North America Nanotechnology Market Market Share Comparison by End User (2016-2032)
- Figure 43: Western Europe Nanotechnology Market Revenue (US$ Mn) Market Share by Typein 2022
- Figure 44: Western Europe Nanotechnology Market Market Attractiveness Analysis by Type, 2016-2032
- Figure 45: Western Europe Nanotechnology Market Revenue (US$ Mn) Market Share by Applicationin 2022
- Figure 46: Western Europe Nanotechnology Market Market Attractiveness Analysis by Application, 2016-2032
- Figure 47: Western Europe Nanotechnology Market Revenue (US$ Mn) Market Share by End Userin 2022
- Figure 48: Western Europe Nanotechnology Market Market Attractiveness Analysis by End User, 2016-2032
- Figure 49: Western Europe Nanotechnology Market Revenue (US$ Mn) Market Share by Country in 2022
- Figure 50: Western Europe Nanotechnology Market Market Attractiveness Analysis by Country, 2016-2032
- Figure 51: Western Europe Nanotechnology Market Market Revenue (US$ Mn) (2016-2032)
- Figure 52: Western Europe Nanotechnology Market Market Revenue (US$ Mn) Comparison by Country (2016-2032)
- Figure 53: Western Europe Nanotechnology Market Market Revenue (US$ Mn) Comparison by Type (2016-2032)
- Figure 54: Western Europe Nanotechnology Market Market Revenue (US$ Mn) Comparison by Application (2016-2032)
- Figure 55: Western Europe Nanotechnology Market Market Revenue (US$ Mn) Comparison by End User (2016-2032)
- Figure 56: Western Europe Nanotechnology Market Market Y-o-Y Growth Rate Comparison by Country (2016-2032)
- Figure 57: Western Europe Nanotechnology Market Market Y-o-Y Growth Rate Comparison by Type (2016-2032)
- Figure 58: Western Europe Nanotechnology Market Market Y-o-Y Growth Rate Comparison by Application (2016-2032)
- Figure 59: Western Europe Nanotechnology Market Market Y-o-Y Growth Rate Comparison by End User (2016-2032)
- Figure 60: Western Europe Nanotechnology Market Market Share Comparison by Country (2016-2032)
- Figure 61: Western Europe Nanotechnology Market Market Share Comparison by Type (2016-2032)
- Figure 62: Western Europe Nanotechnology Market Market Share Comparison by Application (2016-2032)
- Figure 63: Western Europe Nanotechnology Market Market Share Comparison by End User (2016-2032)
- Figure 64: Eastern Europe Nanotechnology Market Revenue (US$ Mn) Market Share by Typein 2022
- Figure 65: Eastern Europe Nanotechnology Market Market Attractiveness Analysis by Type, 2016-2032
- Figure 66: Eastern Europe Nanotechnology Market Revenue (US$ Mn) Market Share by Applicationin 2022
- Figure 67: Eastern Europe Nanotechnology Market Market Attractiveness Analysis by Application, 2016-2032
- Figure 68: Eastern Europe Nanotechnology Market Revenue (US$ Mn) Market Share by End Userin 2022
- Figure 69: Eastern Europe Nanotechnology Market Market Attractiveness Analysis by End User, 2016-2032
- Figure 70: Eastern Europe Nanotechnology Market Revenue (US$ Mn) Market Share by Country in 2022
- Figure 71: Eastern Europe Nanotechnology Market Market Attractiveness Analysis by Country, 2016-2032
- Figure 72: Eastern Europe Nanotechnology Market Market Revenue (US$ Mn) (2016-2032)
- Figure 73: Eastern Europe Nanotechnology Market Market Revenue (US$ Mn) Comparison by Country (2016-2032)
- Figure 74: Eastern Europe Nanotechnology Market Market Revenue (US$ Mn) Comparison by Type (2016-2032)
- Figure 75: Eastern Europe Nanotechnology Market Market Revenue (US$ Mn) Comparison by Application (2016-2032)
- Figure 76: Eastern Europe Nanotechnology Market Market Revenue (US$ Mn) Comparison by End User (2016-2032)
- Figure 77: Eastern Europe Nanotechnology Market Market Y-o-Y Growth Rate Comparison by Country (2016-2032)
- Figure 78: Eastern Europe Nanotechnology Market Market Y-o-Y Growth Rate Comparison by Type (2016-2032)
- Figure 79: Eastern Europe Nanotechnology Market Market Y-o-Y Growth Rate Comparison by Application (2016-2032)
- Figure 80: Eastern Europe Nanotechnology Market Market Y-o-Y Growth Rate Comparison by End User (2016-2032)
- Figure 81: Eastern Europe Nanotechnology Market Market Share Comparison by Country (2016-2032)
- Figure 82: Eastern Europe Nanotechnology Market Market Share Comparison by Type (2016-2032)
- Figure 83: Eastern Europe Nanotechnology Market Market Share Comparison by Application (2016-2032)
- Figure 84: Eastern Europe Nanotechnology Market Market Share Comparison by End User (2016-2032)
- Figure 85: APAC Nanotechnology Market Revenue (US$ Mn) Market Share by Typein 2022
- Figure 86: APAC Nanotechnology Market Market Attractiveness Analysis by Type, 2016-2032
- Figure 87: APAC Nanotechnology Market Revenue (US$ Mn) Market Share by Applicationin 2022
- Figure 88: APAC Nanotechnology Market Market Attractiveness Analysis by Application, 2016-2032
- Figure 89: APAC Nanotechnology Market Revenue (US$ Mn) Market Share by End Userin 2022
- Figure 90: APAC Nanotechnology Market Market Attractiveness Analysis by End User, 2016-2032
- Figure 91: APAC Nanotechnology Market Revenue (US$ Mn) Market Share by Country in 2022
- Figure 92: APAC Nanotechnology Market Market Attractiveness Analysis by Country, 2016-2032
- Figure 93: APAC Nanotechnology Market Market Revenue (US$ Mn) (2016-2032)
- Figure 94: APAC Nanotechnology Market Market Revenue (US$ Mn) Comparison by Country (2016-2032)
- Figure 95: APAC Nanotechnology Market Market Revenue (US$ Mn) Comparison by Type (2016-2032)
- Figure 96: APAC Nanotechnology Market Market Revenue (US$ Mn) Comparison by Application (2016-2032)
- Figure 97: APAC Nanotechnology Market Market Revenue (US$ Mn) Comparison by End User (2016-2032)
- Figure 98: APAC Nanotechnology Market Market Y-o-Y Growth Rate Comparison by Country (2016-2032)
- Figure 99: APAC Nanotechnology Market Market Y-o-Y Growth Rate Comparison by Type (2016-2032)
- Figure 100: APAC Nanotechnology Market Market Y-o-Y Growth Rate Comparison by Application (2016-2032)
- Figure 101: APAC Nanotechnology Market Market Y-o-Y Growth Rate Comparison by End User (2016-2032)
- Figure 102: APAC Nanotechnology Market Market Share Comparison by Country (2016-2032)
- Figure 103: APAC Nanotechnology Market Market Share Comparison by Type (2016-2032)
- Figure 104: APAC Nanotechnology Market Market Share Comparison by Application (2016-2032)
- Figure 105: APAC Nanotechnology Market Market Share Comparison by End User (2016-2032)
- Figure 106: Latin America Nanotechnology Market Revenue (US$ Mn) Market Share by Typein 2022
- Figure 107: Latin America Nanotechnology Market Market Attractiveness Analysis by Type, 2016-2032
- Figure 108: Latin America Nanotechnology Market Revenue (US$ Mn) Market Share by Applicationin 2022
- Figure 109: Latin America Nanotechnology Market Market Attractiveness Analysis by Application, 2016-2032
- Figure 110: Latin America Nanotechnology Market Revenue (US$ Mn) Market Share by End Userin 2022
- Figure 111: Latin America Nanotechnology Market Market Attractiveness Analysis by End User, 2016-2032
- Figure 112: Latin America Nanotechnology Market Revenue (US$ Mn) Market Share by Country in 2022
- Figure 113: Latin America Nanotechnology Market Market Attractiveness Analysis by Country, 2016-2032
- Figure 114: Latin America Nanotechnology Market Market Revenue (US$ Mn) (2016-2032)
- Figure 115: Latin America Nanotechnology Market Market Revenue (US$ Mn) Comparison by Country (2016-2032)
- Figure 116: Latin America Nanotechnology Market Market Revenue (US$ Mn) Comparison by Type (2016-2032)
- Figure 117: Latin America Nanotechnology Market Market Revenue (US$ Mn) Comparison by Application (2016-2032)
- Figure 118: Latin America Nanotechnology Market Market Revenue (US$ Mn) Comparison by End User (2016-2032)
- Figure 119: Latin America Nanotechnology Market Market Y-o-Y Growth Rate Comparison by Country (2016-2032)
- Figure 120: Latin America Nanotechnology Market Market Y-o-Y Growth Rate Comparison by Type (2016-2032)
- Figure 121: Latin America Nanotechnology Market Market Y-o-Y Growth Rate Comparison by Application (2016-2032)
- Figure 122: Latin America Nanotechnology Market Market Y-o-Y Growth Rate Comparison by End User (2016-2032)
- Figure 123: Latin America Nanotechnology Market Market Share Comparison by Country (2016-2032)
- Figure 124: Latin America Nanotechnology Market Market Share Comparison by Type (2016-2032)
- Figure 125: Latin America Nanotechnology Market Market Share Comparison by Application (2016-2032)
- Figure 126: Latin America Nanotechnology Market Market Share Comparison by End User (2016-2032)
- Figure 127: Middle East & Africa Nanotechnology Market Revenue (US$ Mn) Market Share by Typein 2022
- Figure 128: Middle East & Africa Nanotechnology Market Market Attractiveness Analysis by Type, 2016-2032
- Figure 129: Middle East & Africa Nanotechnology Market Revenue (US$ Mn) Market Share by Applicationin 2022
- Figure 130: Middle East & Africa Nanotechnology Market Market Attractiveness Analysis by Application, 2016-2032
- Figure 131: Middle East & Africa Nanotechnology Market Revenue (US$ Mn) Market Share by End Userin 2022
- Figure 132: Middle East & Africa Nanotechnology Market Market Attractiveness Analysis by End User, 2016-2032
- Figure 133: Middle East & Africa Nanotechnology Market Revenue (US$ Mn) Market Share by Country in 2022
- Figure 134: Middle East & Africa Nanotechnology Market Market Attractiveness Analysis by Country, 2016-2032
- Figure 135: Middle East & Africa Nanotechnology Market Market Revenue (US$ Mn) (2016-2032)
- Figure 136: Middle East & Africa Nanotechnology Market Market Revenue (US$ Mn) Comparison by Country (2016-2032)
- Figure 137: Middle East & Africa Nanotechnology Market Market Revenue (US$ Mn) Comparison by Type (2016-2032)
- Figure 138: Middle East & Africa Nanotechnology Market Market Revenue (US$ Mn) Comparison by Application (2016-2032)
- Figure 139: Middle East & Africa Nanotechnology Market Market Revenue (US$ Mn) Comparison by End User (2016-2032)
- Figure 140: Middle East & Africa Nanotechnology Market Market Y-o-Y Growth Rate Comparison by Country (2016-2032)
- Figure 141: Middle East & Africa Nanotechnology Market Market Y-o-Y Growth Rate Comparison by Type (2016-2032)
- Figure 142: Middle East & Africa Nanotechnology Market Market Y-o-Y Growth Rate Comparison by Application (2016-2032)
- Figure 143: Middle East & Africa Nanotechnology Market Market Y-o-Y Growth Rate Comparison by End User (2016-2032)
- Figure 144: Middle East & Africa Nanotechnology Market Market Share Comparison by Country (2016-2032)
- Figure 145: Middle East & Africa Nanotechnology Market Market Share Comparison by Type (2016-2032)
- Figure 146: Middle East & Africa Nanotechnology Market Market Share Comparison by Application (2016-2032)
- Figure 147: Middle East & Africa Nanotechnology Market Market Share Comparison by End User (2016-2032)
"
- List of Tables
- "
- Table 1: Global Nanotechnology Market Market Comparison by Type (2016-2032)
- Table 2: Global Nanotechnology Market Market Comparison by Application (2016-2032)
- Table 3: Global Nanotechnology Market Market Comparison by End User (2016-2032)
- Table 4: Global Nanotechnology Market Revenue (US$ Mn) Comparison by Region (2016-2032)
- Table 5: Global Nanotechnology Market Market Revenue (US$ Mn) (2016-2032)
- Table 6: Global Nanotechnology Market Market Revenue (US$ Mn) Comparison by Region (2016-2032)
- Table 7: Global Nanotechnology Market Market Revenue (US$ Mn) Comparison by Type (2016-2032)
- Table 8: Global Nanotechnology Market Market Revenue (US$ Mn) Comparison by Application (2016-2032)
- Table 9: Global Nanotechnology Market Market Revenue (US$ Mn) Comparison by End User (2016-2032)
- Table 10: Global Nanotechnology Market Market Y-o-Y Growth Rate Comparison by Region (2016-2032)
- Table 11: Global Nanotechnology Market Market Y-o-Y Growth Rate Comparison by Type (2016-2032)
- Table 12: Global Nanotechnology Market Market Y-o-Y Growth Rate Comparison by Application (2016-2032)
- Table 13: Global Nanotechnology Market Market Y-o-Y Growth Rate Comparison by End User (2016-2032)
- Table 14: Global Nanotechnology Market Market Share Comparison by Region (2016-2032)
- Table 15: Global Nanotechnology Market Market Share Comparison by Type (2016-2032)
- Table 16: Global Nanotechnology Market Market Share Comparison by Application (2016-2032)
- Table 17: Global Nanotechnology Market Market Share Comparison by End User (2016-2032)
- Table 18: North America Nanotechnology Market Market Comparison by Application (2016-2032)
- Table 19: North America Nanotechnology Market Market Comparison by End User (2016-2032)
- Table 20: North America Nanotechnology Market Revenue (US$ Mn) Comparison by Country (2016-2032)
- Table 21: North America Nanotechnology Market Market Revenue (US$ Mn) (2016-2032)
- Table 22: North America Nanotechnology Market Market Revenue (US$ Mn) Comparison by Country (2016-2032)
- Table 23: North America Nanotechnology Market Market Revenue (US$ Mn) Comparison by Type (2016-2032)
- Table 24: North America Nanotechnology Market Market Revenue (US$ Mn) Comparison by Application (2016-2032)
- Table 25: North America Nanotechnology Market Market Revenue (US$ Mn) Comparison by End User (2016-2032)
- Table 26: North America Nanotechnology Market Market Y-o-Y Growth Rate Comparison by Country (2016-2032)
- Table 27: North America Nanotechnology Market Market Y-o-Y Growth Rate Comparison by Type (2016-2032)
- Table 28: North America Nanotechnology Market Market Y-o-Y Growth Rate Comparison by Application (2016-2032)
- Table 29: North America Nanotechnology Market Market Y-o-Y Growth Rate Comparison by End User (2016-2032)
- Table 30: North America Nanotechnology Market Market Share Comparison by Country (2016-2032)
- Table 31: North America Nanotechnology Market Market Share Comparison by Type (2016-2032)
- Table 32: North America Nanotechnology Market Market Share Comparison by Application (2016-2032)
- Table 33: North America Nanotechnology Market Market Share Comparison by End User (2016-2032)
- Table 34: Western Europe Nanotechnology Market Market Comparison by Type (2016-2032)
- Table 35: Western Europe Nanotechnology Market Market Comparison by Application (2016-2032)
- Table 36: Western Europe Nanotechnology Market Market Comparison by End User (2016-2032)
- Table 37: Western Europe Nanotechnology Market Revenue (US$ Mn) Comparison by Country (2016-2032)
- Table 38: Western Europe Nanotechnology Market Market Revenue (US$ Mn) (2016-2032)
- Table 39: Western Europe Nanotechnology Market Market Revenue (US$ Mn) Comparison by Country (2016-2032)
- Table 40: Western Europe Nanotechnology Market Market Revenue (US$ Mn) Comparison by Type (2016-2032)
- Table 41: Western Europe Nanotechnology Market Market Revenue (US$ Mn) Comparison by Application (2016-2032)
- Table 42: Western Europe Nanotechnology Market Market Revenue (US$ Mn) Comparison by End User (2016-2032)
- Table 43: Western Europe Nanotechnology Market Market Y-o-Y Growth Rate Comparison by Country (2016-2032)
- Table 44: Western Europe Nanotechnology Market Market Y-o-Y Growth Rate Comparison by Type (2016-2032)
- Table 45: Western Europe Nanotechnology Market Market Y-o-Y Growth Rate Comparison by Application (2016-2032)
- Table 46: Western Europe Nanotechnology Market Market Y-o-Y Growth Rate Comparison by End User (2016-2032)
- Table 47: Western Europe Nanotechnology Market Market Share Comparison by Country (2016-2032)
- Table 48: Western Europe Nanotechnology Market Market Share Comparison by Type (2016-2032)
- Table 49: Western Europe Nanotechnology Market Market Share Comparison by Application (2016-2032)
- Table 50: Western Europe Nanotechnology Market Market Share Comparison by End User (2016-2032)
- Table 51: Eastern Europe Nanotechnology Market Market Comparison by Type (2016-2032)
- Table 52: Eastern Europe Nanotechnology Market Market Comparison by Application (2016-2032)
- Table 53: Eastern Europe Nanotechnology Market Market Comparison by End User (2016-2032)
- Table 54: Eastern Europe Nanotechnology Market Revenue (US$ Mn) Comparison by Country (2016-2032)
- Table 55: Eastern Europe Nanotechnology Market Market Revenue (US$ Mn) (2016-2032)
- Table 56: Eastern Europe Nanotechnology Market Market Revenue (US$ Mn) Comparison by Country (2016-2032)
- Table 57: Eastern Europe Nanotechnology Market Market Revenue (US$ Mn) Comparison by Type (2016-2032)
- Table 58: Eastern Europe Nanotechnology Market Market Revenue (US$ Mn) Comparison by Application (2016-2032)
- Table 59: Eastern Europe Nanotechnology Market Market Revenue (US$ Mn) Comparison by End User (2016-2032)
- Table 60: Eastern Europe Nanotechnology Market Market Y-o-Y Growth Rate Comparison by Country (2016-2032)
- Table 61: Eastern Europe Nanotechnology Market Market Y-o-Y Growth Rate Comparison by Type (2016-2032)
- Table 62: Eastern Europe Nanotechnology Market Market Y-o-Y Growth Rate Comparison by Application (2016-2032)
- Table 63: Eastern Europe Nanotechnology Market Market Y-o-Y Growth Rate Comparison by End User (2016-2032)
- Table 64: Eastern Europe Nanotechnology Market Market Share Comparison by Country (2016-2032)
- Table 65: Eastern Europe Nanotechnology Market Market Share Comparison by Type (2016-2032)
- Table 66: Eastern Europe Nanotechnology Market Market Share Comparison by Application (2016-2032)
- Table 67: Eastern Europe Nanotechnology Market Market Share Comparison by End User (2016-2032)
- Table 68: APAC Nanotechnology Market Market Comparison by Type (2016-2032)
- Table 69: APAC Nanotechnology Market Market Comparison by Application (2016-2032)
- Table 70: APAC Nanotechnology Market Market Comparison by End User (2016-2032)
- Table 71: APAC Nanotechnology Market Revenue (US$ Mn) Comparison by Country (2016-2032)
- Table 72: APAC Nanotechnology Market Market Revenue (US$ Mn) (2016-2032)
- Table 73: APAC Nanotechnology Market Market Revenue (US$ Mn) Comparison by Country (2016-2032)
- Table 74: APAC Nanotechnology Market Market Revenue (US$ Mn) Comparison by Type (2016-2032)
- Table 75: APAC Nanotechnology Market Market Revenue (US$ Mn) Comparison by Application (2016-2032)
- Table 76: APAC Nanotechnology Market Market Revenue (US$ Mn) Comparison by End User (2016-2032)
- Table 77: APAC Nanotechnology Market Market Y-o-Y Growth Rate Comparison by Country (2016-2032)
- Table 78: APAC Nanotechnology Market Market Y-o-Y Growth Rate Comparison by Type (2016-2032)
- Table 79: APAC Nanotechnology Market Market Y-o-Y Growth Rate Comparison by Application (2016-2032)
- Table 80: APAC Nanotechnology Market Market Y-o-Y Growth Rate Comparison by End User (2016-2032)
- Table 81: APAC Nanotechnology Market Market Share Comparison by Country (2016-2032)
- Table 82: APAC Nanotechnology Market Market Share Comparison by Type (2016-2032)
- Table 83: APAC Nanotechnology Market Market Share Comparison by Application (2016-2032)
- Table 84: APAC Nanotechnology Market Market Share Comparison by End User (2016-2032)
- Table 85: Latin America Nanotechnology Market Market Comparison by Type (2016-2032)
- Table 86: Latin America Nanotechnology Market Market Comparison by Application (2016-2032)
- Table 87: Latin America Nanotechnology Market Market Comparison by End User (2016-2032)
- Table 88: Latin America Nanotechnology Market Revenue (US$ Mn) Comparison by Country (2016-2032)
- Table 89: Latin America Nanotechnology Market Market Revenue (US$ Mn) (2016-2032)
- Table 90: Latin America Nanotechnology Market Market Revenue (US$ Mn) Comparison by Country (2016-2032)
- Table 91: Latin America Nanotechnology Market Market Revenue (US$ Mn) Comparison by Type (2016-2032)
- Table 92: Latin America Nanotechnology Market Market Revenue (US$ Mn) Comparison by Application (2016-2032)
- Table 93: Latin America Nanotechnology Market Market Revenue (US$ Mn) Comparison by End User (2016-2032)
- Table 94: Latin America Nanotechnology Market Market Y-o-Y Growth Rate Comparison by Country (2016-2032)
- Table 95: Latin America Nanotechnology Market Market Y-o-Y Growth Rate Comparison by Type (2016-2032)
- Table 96: Latin America Nanotechnology Market Market Y-o-Y Growth Rate Comparison by Application (2016-2032)
- Table 97: Latin America Nanotechnology Market Market Y-o-Y Growth Rate Comparison by End User (2016-2032)
- Table 98: Latin America Nanotechnology Market Market Share Comparison by Country (2016-2032)
- Table 99: Latin America Nanotechnology Market Market Share Comparison by Type (2016-2032)
- Table 100: Latin America Nanotechnology Market Market Share Comparison by Application (2016-2032)
- Table 101: Latin America Nanotechnology Market Market Share Comparison by End User (2016-2032)
- Table 102: Middle East & Africa Nanotechnology Market Market Comparison by Type (2016-2032)
- Table 103: Middle East & Africa Nanotechnology Market Market Comparison by Application (2016-2032)
- Table 104: Middle East & Africa Nanotechnology Market Market Comparison by End User (2016-2032)
- Table 105: Middle East & Africa Nanotechnology Market Revenue (US$ Mn) Comparison by Country (2016-2032)
- Table 106: Middle East & Africa Nanotechnology Market Market Revenue (US$ Mn) (2016-2032)
- Table 107: Middle East & Africa Nanotechnology Market Market Revenue (US$ Mn) Comparison by Country (2016-2032)
- Table 108: Middle East & Africa Nanotechnology Market Market Revenue (US$ Mn) Comparison by Type (2016-2032)
- Table 109: Middle East & Africa Nanotechnology Market Market Revenue (US$ Mn) Comparison by Application (2016-2032)
- Table 110: Middle East & Africa Nanotechnology Market Market Revenue (US$ Mn) Comparison by End User (2016-2032)
- Table 111: Middle East & Africa Nanotechnology Market Market Y-o-Y Growth Rate Comparison by Country (2016-2032)
- Table 112: Middle East & Africa Nanotechnology Market Market Y-o-Y Growth Rate Comparison by Type (2016-2032)
- Table 113: Middle East & Africa Nanotechnology Market Market Y-o-Y Growth Rate Comparison by Application (2016-2032)
- Table 114: Middle East & Africa Nanotechnology Market Market Y-o-Y Growth Rate Comparison by End User (2016-2032)
- Table 115: Middle East & Africa Nanotechnology Market Market Share Comparison by Country (2016-2032)
- Table 116: Middle East & Africa Nanotechnology Market Market Share Comparison by Type (2016-2032)
- Table 117: Middle East & Africa Nanotechnology Market Market Share Comparison by Application (2016-2032)
- Table 118: Middle East & Africa Nanotechnology Market Market Share Comparison by End User (2016-2032)
- 1. Executive Summary
-
- Showa Denko KK
- BASF SE
- Pen Inc.
- Nanosys Inc.
- QD vision
- Arkema
- 3rd Tech Inc.
- ApNano Materials
- ELITechGroup
- Bruker Nano GmbH
- QuantumSphere Inc.
Our Clients


View Our Licence Options
