
Multilayer Transparent Conductors Market By Type (Carbon nanotubes films, Metal grids, Indium tin oxide thin films, Nano-silver based transparent conductors, Conductive polymers), By Application (Organic light-emitting diodes, Flat panel displays, Solar cells, Smart windows, Liquid-crystal displays, Touchscreen sensors, Photovoltaics, Flexible electronics, Optical coatings), By Material (Carbon nanotubes, Metal mesh, ITO on glass, Silver nanowires), By Region And Companies - Industry Segment Outlook, Market Assessment, Competition Scenario, Trends,
-
25957
-
May 2024
-
300
-


-
This report was compiled by Vishwa Gaul Vishwa is an experienced market research and consulting professional with over 8 years of expertise in the ICT industry, contributing to over 700 reports across telecommunications, software, hardware, and digital solutions. Correspondence Team Lead- ICT Linkedin | Detailed Market research Methodology Our methodology involves a mix of primary research, including interviews with leading mental health experts, and secondary research from reputable medical journals and databases. View Detailed Methodology Page
-
Quick Navigation
Report Overview
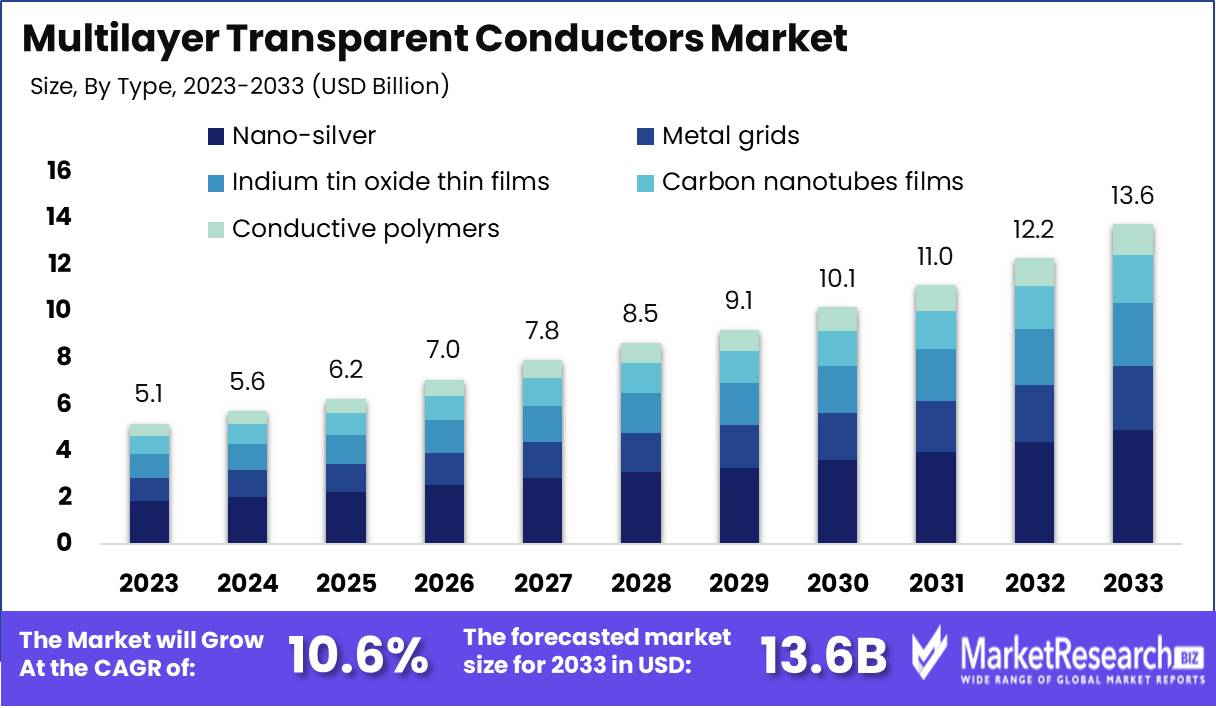
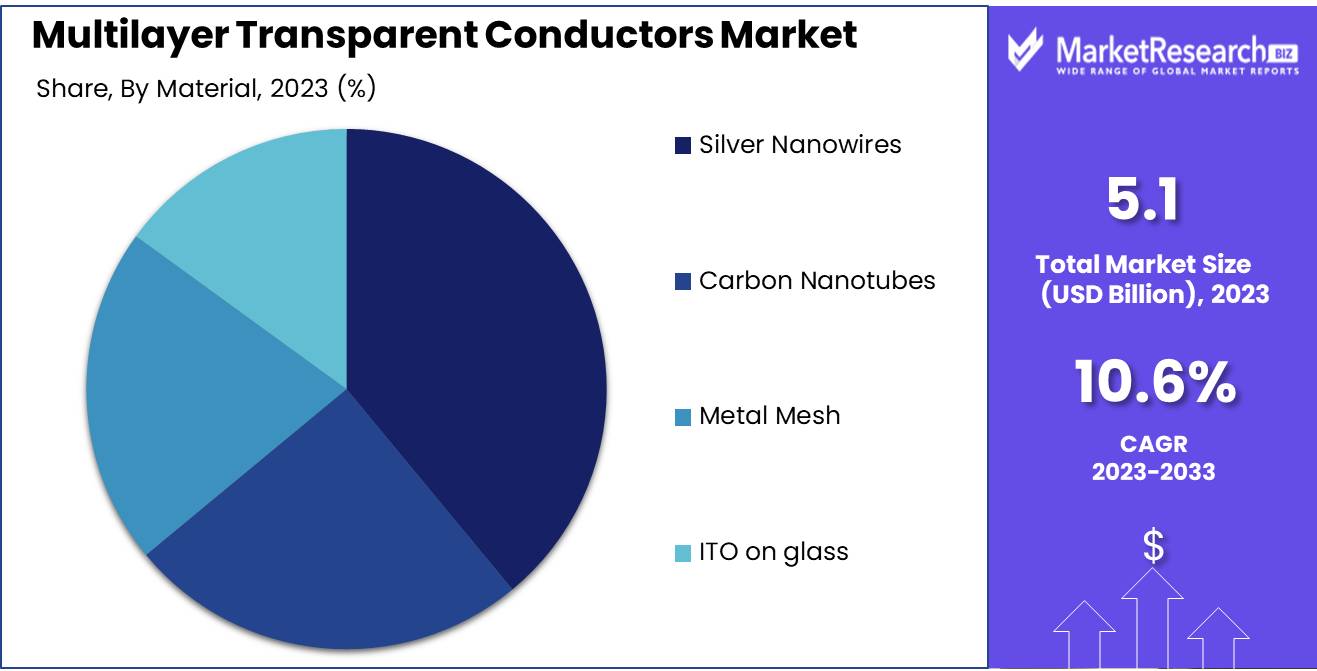
The Multilayer Transparent Conductors Market size is expected to be worth around USD 13.6 Bn by 2033 from USD 5.1 Bn in 2023, growing at a CAGR of 10.6% during the forecast period from 2024 to 2033.
The Multilayer Transparent Conductors Market encompasses advanced materials used primarily in electronic and optoelectronic applications. These conductors are characterized by their multiple layers, which enhance performance through improved conductivity and transparency. Essential for the development of touchscreens, LCDs, OLEDs, and solar cells, multilayer transparent conductors are critical in driving innovation in consumer electronics, automotive displays, and renewable energy technologies. As industries continue to demand higher efficiency and integrated functionality, this market is poised for significant growth, driven by technological advancements and the increasing prevalence of smart devices and sustainable energy solutions.
The Multilayer Transparent Conductors market is positioned to experience substantial growth over the next several years, underscored by an emergent demand across key verticals such as consumer electronics, solar panels, and smart windows. This growth trajectory is fundamentally supported by the pivotal role these conductors play in modern applications like touchscreen interfaces and LED lighting where advancements in maintaining high conductivity alongside transparency are continually sought. Notably, the push towards miniaturization and increased energy efficiency in electronic devices propels further market expansion.
Amidst these growth enablers, the market faces hurdles related to the high costs of materials and complexities associated with layer deposition techniques. Competitive forces within the market are shaped by a mix of established firms and innovative newcomers, all striving to meld performance enhancements with cost efficiency through vigorous research and development efforts.
Adding depth to our understanding of the market dynamics, projections indicate a compound annual growth rate (CAGR) of approximately 11.5% over the ensuing five years. This robust growth is buoyed by a significant uptick in the adoption of advanced touchscreen technology, now representing nearly 40% of the application share within the consumer electronics sector. Additionally, the drive towards sustainable technologies in the automotive and architectural sectors fuels demand, particularly highlighted by a 30% rise in investments in solar energy initiatives, which are increasingly reliant on these conductors. The convergence of technological innovation, market demand, and environmental imperatives thus paints a promising yet challenging landscape for stakeholders in the Multilayer Transparent Conductors market.
Key Takeaways
- Market Growth: The Multilayer Transparent Conductors Market size is expected to be worth around USD 13.6 Bn by 2033 from USD 5.1 Bn in 2023, growing at a CAGR of 10.6% during the forecast period from 2024 to 2033.
- By Type: Nano-silver dominates the Multilayer Transparent Conductors Market with superior flexibility.
- By Application: Flexible electronics dominate 2023's Multilayer Transparent Conductors Market.
- By Material: Silver nanowires lead in flexibility and cost, overtaking ITO on glass.
- Regional Dominance: North America leads the global multilayer transparent conductors market at 35%.
- Growth Opportunity: The multilayer transparent conductors market thrives on high-tech electronics and solar energy advancements.
Driving factors
Increasing Demand for Flexible Displays: Catalyzing Growth in Multilayer Transparent Conductors Market
The burgeoning demand for flexible displays is a primary driver propelling the growth of the multilayer transparent conductors market. This demand stems from the escalating adoption of flexible and foldable screens in consumer electronics, particularly in smartphones, tablets, and wearable devices.
The multilayer transparent conductors are crucial in enhancing the durability and efficiency of flexible displays. Their ability to maintain conductivity while being stretched or bent makes them ideal for the next generation of electronic devices. This compatibility is driving manufacturers to increasingly adopt these materials, thereby significantly boosting market demand.
Advancements in Technology: Driving Innovation and Market Expansion
Technological advancements are pivotal in accelerating the growth of the multilayer transparent conductors market. Innovations in nanotechnology, material science, and manufacturing processes are enhancing the performance characteristics of transparent conductors. The development of advanced materials such as graphene, silver nanowires, and carbon nanotubes has revolutionized the market, offering superior electrical conductivity, flexibility, and optical transparency compared to traditional materials like indium tin oxide (ITO).
According to industry reports, the incorporation of these advanced materials is expected to reduce production costs and enhance the scalability of multilayer transparent conductors, making them more accessible for a wider range of applications. Furthermore, improvements in deposition techniques and coating processes are enhancing the quality and performance consistency of these conductors, thereby expanding their application scope in various industries including consumer electronics, automotive, and solar energy.
Rise of Internet of Things (IoT): Expanding Application Horizons for Transparent Conductors
The proliferation of the Internet of Things (IoT) is significantly expanding the application horizons for multilayer transparent conductors. IoT devices often require compact, lightweight, and flexible components, making multilayer transparent conductors an ideal choice due to their superior flexibility, transparency, and conductivity. The IoT market is expected to grow at a CAGR of 10.53% from 2021 to 2028, with the number of connected devices projected to reach 30.9 billion by 2025.
This rapid expansion is driving the demand for advanced transparent conductive materials that can seamlessly integrate into a variety of IoT devices, including smart home appliances, wearable technology, and industrial sensors. The versatility and adaptability of multilayer transparent conductors make them indispensable in the design and functionality of these devices, thereby fueling market growth.
Restraining Factors
Material Limitations: A Bottleneck in Innovation and Application
Material limitations are a significant restraining factor for the growth of the multilayer transparent conductors market. The primary materials used in these conductors, such as indium tin oxide (ITO), face inherent challenges. ITO, while widely used due to its excellent conductivity and transparency, is brittle, limiting its application in flexible and wearable electronics segments that are expected to drive future market expansion. Furthermore, the scarcity and high cost of indium are substantial concerns, leading to supply chain vulnerabilities and price volatility. According to industry reports, indium prices have experienced fluctuations, making long-term cost planning difficult for manufacturers.
Efforts to develop alternative materials, such as conductive polymers, graphene, and metal nanowires, are ongoing, but these alternatives often fall short in terms of either conductivity, transparency, or scalability. This gap in material performance constrains the market's ability to innovate and meet the evolving demands of advanced electronics, thereby slowing overall market growth.
Manufacturing Challenges: Impediments to Scalability and Cost Efficiency
Manufacturing challenges also significantly impact the growth trajectory of the multilayer transparent conductors market. The production processes for these conductors, particularly those involving ITO, require precise conditions and sophisticated technology, which can be cost-prohibitive. High vacuum deposition techniques, essential for creating uniform and high-quality transparent conductive layers, demand substantial capital investment and operational costs. This complexity restricts the scalability of production and limits the entry of new players into the market.
Moreover, maintaining consistent quality and performance standards across large-scale production is challenging. Variability in layer thickness and uniformity can lead to defects, reducing the yield and increasing the cost per unit. These manufacturing hurdles not only elevate the final product cost but also deter potential adoption in price-sensitive applications such as consumer electronics.
By Type Analysis
Nano-silver dominates the Multilayer Transparent Conductors Market with superior flexibility.
In 2023, Nano-silver-based transparent conductors held a dominant market position in the "By Type" segment of the Multilayer Transparent Conductors Market. This dominance is attributed to their superior conductivity and flexibility, which are critical for applications in touch screens, OLEDs, and solar panels. Nano-silver-based conductors offer a high degree of transparency and lower resistivity compared to traditional materials, making them highly sought after in high-performance electronic devices.
Following closely, Metal grids are favored for their robustness and cost-effectiveness, primarily used in large-area touch panels and electromagnetic interference (EMI) shielding applications. Indium tin oxide (ITO) thin films, once the industry standard, continue to be utilized due to their proven performance in optical and electrical properties, although concerns about indium scarcity affect their market share.
Carbon nanotube films are emerging as a viable alternative, prized for their unique combination of transparency, conductivity, and flexibility. Their application in flexible displays and wearable devices is increasing. Lastly, Conductive polymers are gaining traction due to their ease of processing and environmental stability, marking their significant potential in organic electronic devices and smart textiles. These materials together define the competitive landscape of the Multilayer Transparent Conductors Market, each offering distinct advantages tailored to specific industrial needs.
By Application Analysis
Flexible electronics dominate 2023's Multilayer Transparent Conductors Market.
In 2023, Flexible electronics held a dominant market position in the "By Application" segment of the Multilayer Transparent Conductors Market. This category encompasses several key applications, starting with Organic Light-Emitting Diodes (OLEDs), which are crucial for high-quality display and lighting solutions due to their enhanced brightness and efficiency. Flat Panel Displays, integral to smartphones and televisions, benefit from transparent conductors for their slim profile and clear visuals. Solar Cells also rely on these conductors to improve light absorption and electricity conversion efficiency.
Smart Windows and Liquid-Crystal Displays (LCDs) utilize transparent conductors to regulate light transmission and display dynamic images, respectively, enhancing user interfaces and energy efficiency. Touchscreen Sensors, which are pervasive in mobile devices and interactive systems, require transparent conductors for their responsive surfaces. Photovoltaics benefit similarly by using transparent conductors to increase the efficiency of light-to-electricity conversion.
Flexible Electronics, as the leading application, leverages the adaptability of transparent conductors to develop bendable, lightweight electronic devices that maintain high conductivity and durability under stress. Finally, Optical Coatings use these materials to enhance reflectivity and filter light across various devices, improving performance and user experience. Each of these applications demonstrates the critical role of transparent conductors in advancing current technology and driving market growth.
By Material Analysis
Silver nanowires lead in flexibility and cost, overtaking ITO on glass.
In 2023, Silver nanowires held a dominant market position in the "By Material" segment of the Multilayer Transparent Conductors Market, standing out for their exceptional electrical conductivity and flexibility, which are crucial in applications such as flexible displays and solar panels. This material's prominence is bolstered by its cost-effectiveness and superior performance compared to alternatives. Metal mesh, another significant material, is celebrated for its robustness and excellent transparency, making it ideal for large-scale touchscreens and outdoor displays. Its ability to maintain functionality over large areas without losing conductivity is a key market driver.
Carbon nanotubes are noted for their unique combination of strength, conductivity, and transparency. They are increasingly used in applications requiring ultra-thin layers, such as wearable electronics, due to their flexibility and high aspect ratio. Lastly, ITO on glass continues to be widely used due to its proven track record in optical and electrical properties. However, its market share is gradually being encroached upon by more flexible and cost-efficient materials like silver nanowires and metal mesh, which offer better durability and similar performance at a reduced cost.
Key Market Segments
By Type
- Carbon nanotubes films
- Metal grids
- Indium tin oxide thin films
- Nano-silver-based transparent conductors
- Conductive polymers
By Application
- Organic light-emitting diodes
- Flat panel displays
- Solar cells
- Smart windows
- Liquid-crystal displays
- Touchscreen sensors
- Photovoltaics
- Flexible electronics
- Optical coatings
By Material
- Carbon nanotubes
- Metal mesh
- ITO on glass
- Silver nanowires
Growth Opportunity
Adapting to Technological Advancements in Consumer Electronics
The global market for multilayer transparent conductors is poised for significant growth, driven by the increasing demand for advanced, flexible, and wearable electronics. These conductors, crucial for touchscreens, displays, and lighting applications, are now integral to the burgeoning sectors of foldable smartphones, smart wearables, and other IoT devices.
The flexibility and high conductivity offered by multilayer structures are pivotal, catering to the needs of sophisticated electronic designs and enhancing functionality without compromising on performance. This trend indicates a substantial growth trajectory as manufacturers continue to innovate in consumer electronics, thereby expanding the applicability and demand for multilayer transparent conductors.
Capitalizing on Renewable Energy Trends
Additionally, the expansion of the solar energy sector represents a significant opportunity for the multilayer transparent conductor market. As global investment in renewable energies escalates in response to increasing environmental concerns and policy support, the need for efficient, cost-effective solar panels is more crucial than ever.
Multilayer transparent conductors play a vital role in improving the light absorption and efficiency of photovoltaic cells, directly contributing to more competitive and effective solar technologies. The growth in solar energy installations worldwide not only boosts the demand for advanced materials but also opens new avenues for market players to innovate and scale solutions tailored for the energy sector.
Latest Trends
Emergence of Nanostructured Materials: Elevating Performance and Expanding Applications
In 2024, the global multilayer transparent conductors market is witnessing a significant transformation driven by advancements in nanostructured materials. These materials are crucial for enhancing the electrical conductivity and transparency of conductors, pivotal attributes for applications in touchscreens, OLEDs, and solar cells. Innovations such as ultra-thin metal films and doped nano-compounds are not only pushing the boundaries of conductivity and flexibility but also enabling lighter, more efficient devices. This trend is likely to accelerate market growth by broadening the scope of potential applications and increasing the adoption rate of advanced transparent conductors in high-tech industries.
Sustainability: A Core Focus Influencing Material Choice and Manufacturing Processes
Sustainability has emerged as a central theme in the development of multilayer transparent conductors. Market players are increasingly prioritizing environmentally friendly materials and processes, driven by regulatory pressures and a growing consumer demand for sustainable products. Efforts are focused on reducing the use of rare and toxic materials like indium, which is commonly used in the production of indium tin oxide (ITO), a popular transparent conductor. Alternatives such as carbon nanotubes and graphene are gaining traction, not only for their reduced environmental impact but also for their superior performance characteristics. This shift is expected to forge new pathways for the adoption of green technologies within the industry, positioning sustainability as both a market imperative and a competitive differentiator in 2024.
Regional Analysis
North America leads the global multilayer transparent conductors market at 35%.
North America is a dominating region in the multilayer transparent conductors market, contributing approximately 35% to the global market share. This dominance is bolstered by advanced technological infrastructure and substantial investments in research and development, particularly in the United States and Canada. The region's leadership in flexible electronics and renewable energy applications, notably solar panels, drives significant demand for transparent conductors.
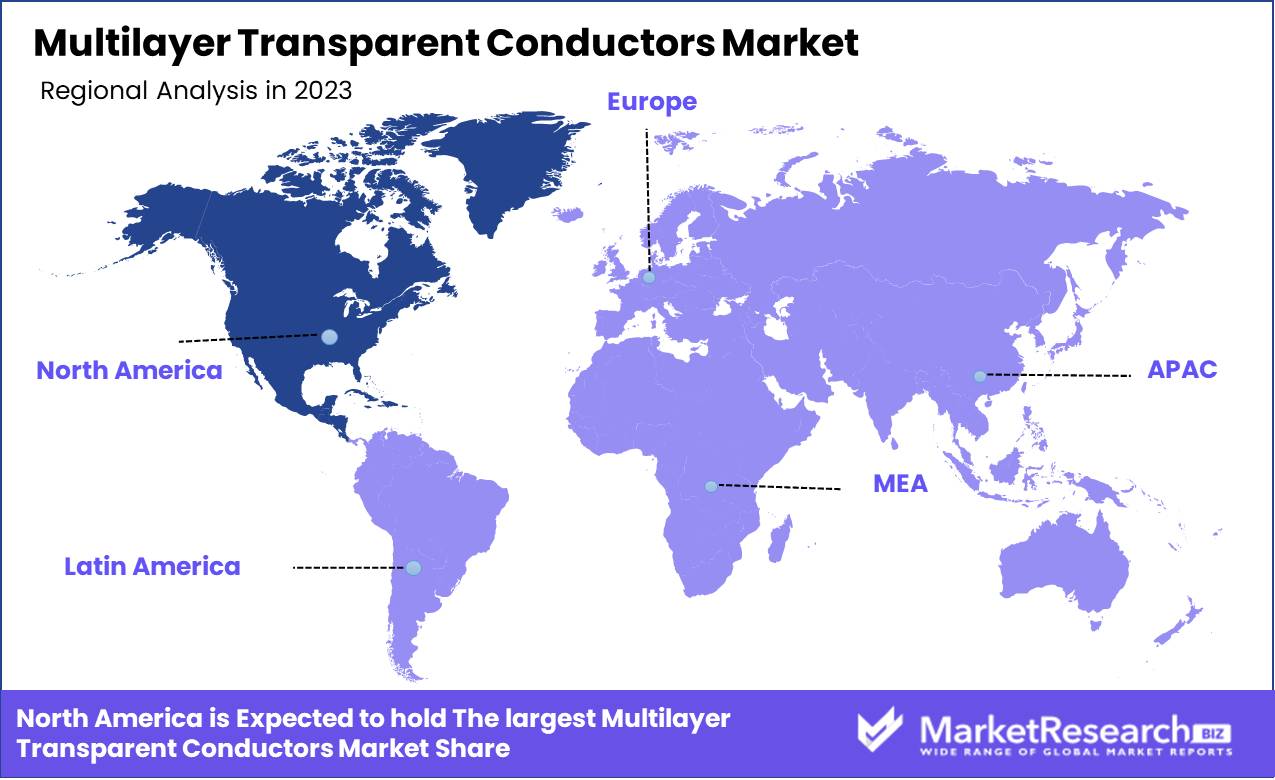
Europe follows, with robust growth driven by stringent regulations on energy efficiency and high adoption rates of energy-saving technologies. The automotive sector, especially in Germany and France, extensively integrates these conductors in touch screen interfaces and heads-up displays, contributing to market expansion.
Asia-Pacific region is the fastest-growing region, led by China, Japan, and South Korea. The region benefits from expanding electronic manufacturing capacities and a surge in demand for consumer electronics, where transparent conductors are crucial for smartphones and wearable devices. Middle East & Africa and Latin America are emerging markets with growing potential, driven by urbanization and digital transformation initiatives. These regions are witnessing gradual increases in technology penetration, although they currently hold smaller shares of the global market.
Key Regions and Countries
North America
- The US
- Canada
- Rest of North America
Europe
- Germany
- France
- The UK
- Spain
- Netherlands
- Russia
- Italy
- Rest of Europe
Asia-Pacific
- China
- Japan
- Singapore
- Thailand
- South Korea
- Vietnam
- India
- New Zealand
- Rest of Asia Pacific
Latin America
- Mexico
- Brazil
- Rest of Latin America
Middle East & Africa
- Saudi Arabia
- South Africa
- UAE
- Rest of the Middle East & Africa
Key Players Analysis
In the global multilayer transparent conductors market, the landscape in 2024 is shaped by significant innovation and competitive differentiation among key players. Companies like Canatu Oy and Cima Nanotech are leading with advancements in carbon nanotube and silver nanowire technologies, respectively, driving the performance envelope in touchscreens and flexible displays. Fujifilm Holdings Corporation and DuPont Teijin Films leverage their robust material science capabilities to enhance film quality and integration ease, catering to the evolving demands of both automotive and consumer electronics industries.
3M Company and Nitto Denko Corporation, with their extensive expertise in adhesive and film technologies, are pivotal in developing products that offer not only high transparency and conductivity but also durability essential for high-usage applications. Meanwhile, Apple Inc. remains a crucial end-user and innovator, frequently setting market trends that require quick adaptation from material suppliers and technology developers.
Emerging players like Abrisa Technologies and Acree Technologies Inc. are focusing on niche applications and specialized markets, offering tailored solutions that meet specific customer needs, thus enhancing their foothold in the market. This dynamic competitive environment encourages continuous technological advancements, ensuring that the multilayer transparent conductors market remains both innovative and responsive to the rapidly changing technology landscape.
Market Key Players
- Canatu Oy
- DuPont Teijin Films
- Fujifilm Holdings Corporation
- Dontech Inc.
- Eastman Kodak
- Cambrios Technologies Corporation
- Quantum Coating Inc.
- 3M Company
- Nitto Denko Corporation
- Toyobo Corporation
- Thin Film Devices Inc.
- Abrisa Technologies
- Acree Technologies Inc.
- Apple Inc.
- Cima Nanotech.
Recent Development
- In November 2023, Fujifilm Holdings Corporation: Fujifilm announced a breakthrough in developing a new transparent conductive film that enhances the brightness and clarity of displays by achieving high transmittance and low haze.
- In October 2023, Dontech Inc.: Dontech partnered with a university to research and develop novel transparent conductive materials using nanotechnology.
- In September 2023, 3M Company: 3M launched a new line of conductive inks designed for flexible printed electronics, which are applicable in wearable devices and touch sensors.
- In August 2023, Korea Institute of Materials Science Development: researchers at this institute developed a transparent thin-film solar cell that displays various reflective colors without significantly reducing efficiency. This innovation may facilitate the integration of solar power generation into building facades, windows, and other architectural elements.
Report Scope
Report Features Description Market Value (2023) USD 5.1 Billion Forecast Revenue (2033) USD 13.6 Billion CAGR (2024-2032) 10.6% Base Year for Estimation 2023 Historic Period 2016-2023 Forecast Period 2024-2033 Report Coverage Revenue Forecast, Market Dynamics, COVID-19 Impact, Competitive Landscape, Recent Developments Segments Covered By Type (Carbon nanotubes films, Metal grids, Indium tin oxide thin films, Nano-silver based transparent conductors, Conductive polymers), By Application (Organic light-emitting diodes, Flat panel displays, Solar cells, Smart windows, Liquid-crystal displays, Touchscreen sensors, Photovoltaics, Flexible electronics, Optical coatings), By Material (Carbon nanotubes, Metal mesh, ITO on glass, Silver nanowires) Regional Analysis North America - The US, Canada, Rest of North America, Europe - Germany, France, The UK, Spain, Italy, Russia, Netherlands, Rest of Europe, Asia-Pacific - China, Japan, South Korea, India, New Zealand, Singapore, Thailand, Vietnam, Rest of Asia Pacific, Latin America - Brazil, Mexico, Rest of Latin America, Middle East & Africa - South Africa, Saudi Arabia, UAE, Rest of Middle East & Africa Competitive Landscape Canatu Oy, DuPont Teijin Films, Fujifilm Holdings Corporation, Dontech Inc., Eastman Kodak, Cambrios Technologies Corporation, Quantum Coating Inc., 3M Company, Nitto Denko Corporation, Toyobo Corporation, Thin Film Devices Inc., Abrisa Technologies, Acree Technologies Inc., Apple Inc., Cima Nanotech. Customization Scope Customization for segments, region/country-level will be provided. Moreover, additional customization can be done based on the requirements. Purchase Options We have three licenses to opt for Single User License, Multi-User License (Up to 5 Users), Corporate Use License (Unlimited User and Printable PDF) -
- 1. Executive Summary
- 1.1. Definition
- 1.2. Taxonomy
- 1.3. Research Scope
- 1.4. Key Analysis
- 1.5. Key Findings by Major Segments
- 1.6. Top strategies by Major Players
- 2. Global Multilayer Transparent Conductors Market Overview
- 2.1. Multilayer Transparent Conductors Market Dynamics
- 2.1.1. Drivers
- 2.1.2. Opportunities
- 2.1.3. Restraints
- 2.1.4. Challenges
- 2.2. Macro-economic Factors
- 2.3. Regulatory Framework
- 2.4. Market Investment Feasibility Index
- 2.5. PEST Analysis
- 2.6. PORTER’S Five Force Analysis
- 2.7. Drivers & Restraints Impact Analysis
- 2.8. Industry Chain Analysis
- 2.9. Cost Structure Analysis
- 2.10. Marketing Strategy
- 2.11. Russia-Ukraine War Impact Analysis
- 2.12. Opportunity Map Analysis
- 2.13. Market Competition Scenario Analysis
- 2.14. Product Life Cycle Analysis
- 2.15. Opportunity Orbits
- 2.16. Manufacturer Intensity Map
- 2.17. Major Companies sales by Value & Volume
- 2.1. Multilayer Transparent Conductors Market Dynamics
- 3. Global Multilayer Transparent Conductors Market Analysis, Opportunity and Forecast, 2016-2032
- 3.1. Global Multilayer Transparent Conductors Market Analysis, 2016-2021
- 3.2. Global Multilayer Transparent Conductors Market Opportunity and Forecast, 2023-2032
- 3.3. Global Multilayer Transparent Conductors Market Analysis, Opportunity and Forecast, By Type, 2016-2032
- 3.3.1. Global Multilayer Transparent Conductors Market Analysis by Type: Introduction
- 3.3.2. Market Size Absolute $ Opportunity Analysis and Forecast, By Type, 2016-2032
- 3.3.3. Carbon nanotubes films
- 3.3.4. Metal grids
- 3.3.5. Indium tin oxide thin films
- 3.3.6. Nano-silver based transparent conductors
- 3.3.7. Conductive polymers
- 3.4. Global Multilayer Transparent Conductors Market Analysis, Opportunity and Forecast, By Application, 2016-2032
- 3.4.1. Global Multilayer Transparent Conductors Market Analysis by Application: Introduction
- 3.4.2. Market Size Absolute $ Opportunity Analysis and Forecast, By Application, 2016-2032
- 3.4.3. Organic light-emitting diodes
- 3.4.4. Flat panel displays
- 3.4.5. Solar cells
- 3.4.6. Smart windows
- 3.4.7. Liquid-crystal displays
- 3.4.8. Touchscreen sensors
- 3.4.9. Photovoltaics
- 3.4.10. Flexible electronics
- 3.4.11. Optical coatings
- 3.5. Global Multilayer Transparent Conductors Market Analysis, Opportunity and Forecast, By Material, 2016-2032
- 3.5.1. Global Multilayer Transparent Conductors Market Analysis by Material: Introduction
- 3.5.2. Market Size Absolute $ Opportunity Analysis and Forecast, By Material, 2016-2032
- 3.5.3. Carbon Nanotubes
- 3.5.4. Metal Mesh
- 3.5.5. ITO on glass
- 3.5.6. Silver Nanowires
- 4. North America Multilayer Transparent Conductors Market Analysis, Opportunity and Forecast, 2016-2032
- 4.1. North America Multilayer Transparent Conductors Market Analysis, 2016-2021
- 4.2. North America Multilayer Transparent Conductors Market Opportunity and Forecast, 2023-2032
- 4.3. North America Multilayer Transparent Conductors Market Analysis, Opportunity and Forecast, By Type, 2016-2032
- 4.3.1. North America Multilayer Transparent Conductors Market Analysis by Type: Introduction
- 4.3.2. Market Size Absolute $ Opportunity Analysis and Forecast, By Type, 2016-2032
- 4.3.3. Carbon nanotubes films
- 4.3.4. Metal grids
- 4.3.5. Indium tin oxide thin films
- 4.3.6. Nano-silver based transparent conductors
- 4.3.7. Conductive polymers
- 4.4. North America Multilayer Transparent Conductors Market Analysis, Opportunity and Forecast, By Application, 2016-2032
- 4.4.1. North America Multilayer Transparent Conductors Market Analysis by Application: Introduction
- 4.4.2. Market Size Absolute $ Opportunity Analysis and Forecast, By Application, 2016-2032
- 4.4.3. Organic light-emitting diodes
- 4.4.4. Flat panel displays
- 4.4.5. Solar cells
- 4.4.6. Smart windows
- 4.4.7. Liquid-crystal displays
- 4.4.8. Touchscreen sensors
- 4.4.9. Photovoltaics
- 4.4.10. Flexible electronics
- 4.4.11. Optical coatings
- 4.5. North America Multilayer Transparent Conductors Market Analysis, Opportunity and Forecast, By Material, 2016-2032
- 4.5.1. North America Multilayer Transparent Conductors Market Analysis by Material: Introduction
- 4.5.2. Market Size Absolute $ Opportunity Analysis and Forecast, By Material, 2016-2032
- 4.5.3. Carbon Nanotubes
- 4.5.4. Metal Mesh
- 4.5.5. ITO on glass
- 4.5.6. Silver Nanowires
- 4.6. North America Multilayer Transparent Conductors Market Analysis, Opportunity and Forecast, By Country , 2016-2032
- 4.6.1. North America Multilayer Transparent Conductors Market Analysis by Country : Introduction
- 4.6.2. Market Size Absolute $ Opportunity Analysis and Forecast, Country , 2016-2032
- 4.6.2.1. The US
- 4.6.2.2. Canada
- 4.6.2.3. Mexico
- 5. Western Europe Multilayer Transparent Conductors Market Analysis, Opportunity and Forecast, 2016-2032
- 5.1. Western Europe Multilayer Transparent Conductors Market Analysis, 2016-2021
- 5.2. Western Europe Multilayer Transparent Conductors Market Opportunity and Forecast, 2023-2032
- 5.3. Western Europe Multilayer Transparent Conductors Market Analysis, Opportunity and Forecast, By Type, 2016-2032
- 5.3.1. Western Europe Multilayer Transparent Conductors Market Analysis by Type: Introduction
- 5.3.2. Market Size Absolute $ Opportunity Analysis and Forecast, By Type, 2016-2032
- 5.3.3. Carbon nanotubes films
- 5.3.4. Metal grids
- 5.3.5. Indium tin oxide thin films
- 5.3.6. Nano-silver based transparent conductors
- 5.3.7. Conductive polymers
- 5.4. Western Europe Multilayer Transparent Conductors Market Analysis, Opportunity and Forecast, By Application, 2016-2032
- 5.4.1. Western Europe Multilayer Transparent Conductors Market Analysis by Application: Introduction
- 5.4.2. Market Size Absolute $ Opportunity Analysis and Forecast, By Application, 2016-2032
- 5.4.3. Organic light-emitting diodes
- 5.4.4. Flat panel displays
- 5.4.5. Solar cells
- 5.4.6. Smart windows
- 5.4.7. Liquid-crystal displays
- 5.4.8. Touchscreen sensors
- 5.4.9. Photovoltaics
- 5.4.10. Flexible electronics
- 5.4.11. Optical coatings
- 5.5. Western Europe Multilayer Transparent Conductors Market Analysis, Opportunity and Forecast, By Material, 2016-2032
- 5.5.1. Western Europe Multilayer Transparent Conductors Market Analysis by Material: Introduction
- 5.5.2. Market Size Absolute $ Opportunity Analysis and Forecast, By Material, 2016-2032
- 5.5.3. Carbon Nanotubes
- 5.5.4. Metal Mesh
- 5.5.5. ITO on glass
- 5.5.6. Silver Nanowires
- 5.6. Western Europe Multilayer Transparent Conductors Market Analysis, Opportunity and Forecast, By Country , 2016-2032
- 5.6.1. Western Europe Multilayer Transparent Conductors Market Analysis by Country : Introduction
- 5.6.2. Market Size Absolute $ Opportunity Analysis and Forecast, Country , 2016-2032
- 5.6.2.1. Germany
- 5.6.2.2. France
- 5.6.2.3. The UK
- 5.6.2.4. Spain
- 5.6.2.5. Italy
- 5.6.2.6. Portugal
- 5.6.2.7. Ireland
- 5.6.2.8. Austria
- 5.6.2.9. Switzerland
- 5.6.2.10. Benelux
- 5.6.2.11. Nordic
- 5.6.2.12. Rest of Western Europe
- 6. Eastern Europe Multilayer Transparent Conductors Market Analysis, Opportunity and Forecast, 2016-2032
- 6.1. Eastern Europe Multilayer Transparent Conductors Market Analysis, 2016-2021
- 6.2. Eastern Europe Multilayer Transparent Conductors Market Opportunity and Forecast, 2023-2032
- 6.3. Eastern Europe Multilayer Transparent Conductors Market Analysis, Opportunity and Forecast, By Type, 2016-2032
- 6.3.1. Eastern Europe Multilayer Transparent Conductors Market Analysis by Type: Introduction
- 6.3.2. Market Size Absolute $ Opportunity Analysis and Forecast, By Type, 2016-2032
- 6.3.3. Carbon nanotubes films
- 6.3.4. Metal grids
- 6.3.5. Indium tin oxide thin films
- 6.3.6. Nano-silver based transparent conductors
- 6.3.7. Conductive polymers
- 6.4. Eastern Europe Multilayer Transparent Conductors Market Analysis, Opportunity and Forecast, By Application, 2016-2032
- 6.4.1. Eastern Europe Multilayer Transparent Conductors Market Analysis by Application: Introduction
- 6.4.2. Market Size Absolute $ Opportunity Analysis and Forecast, By Application, 2016-2032
- 6.4.3. Organic light-emitting diodes
- 6.4.4. Flat panel displays
- 6.4.5. Solar cells
- 6.4.6. Smart windows
- 6.4.7. Liquid-crystal displays
- 6.4.8. Touchscreen sensors
- 6.4.9. Photovoltaics
- 6.4.10. Flexible electronics
- 6.4.11. Optical coatings
- 6.5. Eastern Europe Multilayer Transparent Conductors Market Analysis, Opportunity and Forecast, By Material, 2016-2032
- 6.5.1. Eastern Europe Multilayer Transparent Conductors Market Analysis by Material: Introduction
- 6.5.2. Market Size Absolute $ Opportunity Analysis and Forecast, By Material, 2016-2032
- 6.5.3. Carbon Nanotubes
- 6.5.4. Metal Mesh
- 6.5.5. ITO on glass
- 6.5.6. Silver Nanowires
- 6.6. Eastern Europe Multilayer Transparent Conductors Market Analysis, Opportunity and Forecast, By Country , 2016-2032
- 6.6.1. Eastern Europe Multilayer Transparent Conductors Market Analysis by Country : Introduction
- 6.6.2. Market Size Absolute $ Opportunity Analysis and Forecast, Country , 2016-2032
- 6.6.2.1. Russia
- 6.6.2.2. Poland
- 6.6.2.3. The Czech Republic
- 6.6.2.4. Greece
- 6.6.2.5. Rest of Eastern Europe
- 7. APAC Multilayer Transparent Conductors Market Analysis, Opportunity and Forecast, 2016-2032
- 7.1. APAC Multilayer Transparent Conductors Market Analysis, 2016-2021
- 7.2. APAC Multilayer Transparent Conductors Market Opportunity and Forecast, 2023-2032
- 7.3. APAC Multilayer Transparent Conductors Market Analysis, Opportunity and Forecast, By Type, 2016-2032
- 7.3.1. APAC Multilayer Transparent Conductors Market Analysis by Type: Introduction
- 7.3.2. Market Size Absolute $ Opportunity Analysis and Forecast, By Type, 2016-2032
- 7.3.3. Carbon nanotubes films
- 7.3.4. Metal grids
- 7.3.5. Indium tin oxide thin films
- 7.3.6. Nano-silver based transparent conductors
- 7.3.7. Conductive polymers
- 7.4. APAC Multilayer Transparent Conductors Market Analysis, Opportunity and Forecast, By Application, 2016-2032
- 7.4.1. APAC Multilayer Transparent Conductors Market Analysis by Application: Introduction
- 7.4.2. Market Size Absolute $ Opportunity Analysis and Forecast, By Application, 2016-2032
- 7.4.3. Organic light-emitting diodes
- 7.4.4. Flat panel displays
- 7.4.5. Solar cells
- 7.4.6. Smart windows
- 7.4.7. Liquid-crystal displays
- 7.4.8. Touchscreen sensors
- 7.4.9. Photovoltaics
- 7.4.10. Flexible electronics
- 7.4.11. Optical coatings
- 7.5. APAC Multilayer Transparent Conductors Market Analysis, Opportunity and Forecast, By Material, 2016-2032
- 7.5.1. APAC Multilayer Transparent Conductors Market Analysis by Material: Introduction
- 7.5.2. Market Size Absolute $ Opportunity Analysis and Forecast, By Material, 2016-2032
- 7.5.3. Carbon Nanotubes
- 7.5.4. Metal Mesh
- 7.5.5. ITO on glass
- 7.5.6. Silver Nanowires
- 7.6. APAC Multilayer Transparent Conductors Market Analysis, Opportunity and Forecast, By Country , 2016-2032
- 7.6.1. APAC Multilayer Transparent Conductors Market Analysis by Country : Introduction
- 7.6.2. Market Size Absolute $ Opportunity Analysis and Forecast, Country , 2016-2032
- 7.6.2.1. China
- 7.6.2.2. Japan
- 7.6.2.3. South Korea
- 7.6.2.4. India
- 7.6.2.5. Australia & New Zeland
- 7.6.2.6. Indonesia
- 7.6.2.7. Malaysia
- 7.6.2.8. Philippines
- 7.6.2.9. Singapore
- 7.6.2.10. Thailand
- 7.6.2.11. Vietnam
- 7.6.2.12. Rest of APAC
- 8. Latin America Multilayer Transparent Conductors Market Analysis, Opportunity and Forecast, 2016-2032
- 8.1. Latin America Multilayer Transparent Conductors Market Analysis, 2016-2021
- 8.2. Latin America Multilayer Transparent Conductors Market Opportunity and Forecast, 2023-2032
- 8.3. Latin America Multilayer Transparent Conductors Market Analysis, Opportunity and Forecast, By Type, 2016-2032
- 8.3.1. Latin America Multilayer Transparent Conductors Market Analysis by Type: Introduction
- 8.3.2. Market Size Absolute $ Opportunity Analysis and Forecast, By Type, 2016-2032
- 8.3.3. Carbon nanotubes films
- 8.3.4. Metal grids
- 8.3.5. Indium tin oxide thin films
- 8.3.6. Nano-silver based transparent conductors
- 8.3.7. Conductive polymers
- 8.4. Latin America Multilayer Transparent Conductors Market Analysis, Opportunity and Forecast, By Application, 2016-2032
- 8.4.1. Latin America Multilayer Transparent Conductors Market Analysis by Application: Introduction
- 8.4.2. Market Size Absolute $ Opportunity Analysis and Forecast, By Application, 2016-2032
- 8.4.3. Organic light-emitting diodes
- 8.4.4. Flat panel displays
- 8.4.5. Solar cells
- 8.4.6. Smart windows
- 8.4.7. Liquid-crystal displays
- 8.4.8. Touchscreen sensors
- 8.4.9. Photovoltaics
- 8.4.10. Flexible electronics
- 8.4.11. Optical coatings
- 8.5. Latin America Multilayer Transparent Conductors Market Analysis, Opportunity and Forecast, By Material, 2016-2032
- 8.5.1. Latin America Multilayer Transparent Conductors Market Analysis by Material: Introduction
- 8.5.2. Market Size Absolute $ Opportunity Analysis and Forecast, By Material, 2016-2032
- 8.5.3. Carbon Nanotubes
- 8.5.4. Metal Mesh
- 8.5.5. ITO on glass
- 8.5.6. Silver Nanowires
- 8.6. Latin America Multilayer Transparent Conductors Market Analysis, Opportunity and Forecast, By Country , 2016-2032
- 8.6.1. Latin America Multilayer Transparent Conductors Market Analysis by Country : Introduction
- 8.6.2. Market Size Absolute $ Opportunity Analysis and Forecast, Country , 2016-2032
- 8.6.2.1. Brazil
- 8.6.2.2. Colombia
- 8.6.2.3. Chile
- 8.6.2.4. Argentina
- 8.6.2.5. Costa Rica
- 8.6.2.6. Rest of Latin America
- 9. Middle East & Africa Multilayer Transparent Conductors Market Analysis, Opportunity and Forecast, 2016-2032
- 9.1. Middle East & Africa Multilayer Transparent Conductors Market Analysis, 2016-2021
- 9.2. Middle East & Africa Multilayer Transparent Conductors Market Opportunity and Forecast, 2023-2032
- 9.3. Middle East & Africa Multilayer Transparent Conductors Market Analysis, Opportunity and Forecast, By Type, 2016-2032
- 9.3.1. Middle East & Africa Multilayer Transparent Conductors Market Analysis by Type: Introduction
- 9.3.2. Market Size Absolute $ Opportunity Analysis and Forecast, By Type, 2016-2032
- 9.3.3. Carbon nanotubes films
- 9.3.4. Metal grids
- 9.3.5. Indium tin oxide thin films
- 9.3.6. Nano-silver based transparent conductors
- 9.3.7. Conductive polymers
- 9.4. Middle East & Africa Multilayer Transparent Conductors Market Analysis, Opportunity and Forecast, By Application, 2016-2032
- 9.4.1. Middle East & Africa Multilayer Transparent Conductors Market Analysis by Application: Introduction
- 9.4.2. Market Size Absolute $ Opportunity Analysis and Forecast, By Application, 2016-2032
- 9.4.3. Organic light-emitting diodes
- 9.4.4. Flat panel displays
- 9.4.5. Solar cells
- 9.4.6. Smart windows
- 9.4.7. Liquid-crystal displays
- 9.4.8. Touchscreen sensors
- 9.4.9. Photovoltaics
- 9.4.10. Flexible electronics
- 9.4.11. Optical coatings
- 9.5. Middle East & Africa Multilayer Transparent Conductors Market Analysis, Opportunity and Forecast, By Material, 2016-2032
- 9.5.1. Middle East & Africa Multilayer Transparent Conductors Market Analysis by Material: Introduction
- 9.5.2. Market Size Absolute $ Opportunity Analysis and Forecast, By Material, 2016-2032
- 9.5.3. Carbon Nanotubes
- 9.5.4. Metal Mesh
- 9.5.5. ITO on glass
- 9.5.6. Silver Nanowires
- 9.6. Middle East & Africa Multilayer Transparent Conductors Market Analysis, Opportunity and Forecast, By Country , 2016-2032
- 9.6.1. Middle East & Africa Multilayer Transparent Conductors Market Analysis by Country : Introduction
- 9.6.2. Market Size Absolute $ Opportunity Analysis and Forecast, Country , 2016-2032
- 9.6.2.1. Algeria
- 9.6.2.2. Egypt
- 9.6.2.3. Israel
- 9.6.2.4. Kuwait
- 9.6.2.5. Nigeria
- 9.6.2.6. Saudi Arabia
- 9.6.2.7. South Africa
- 9.6.2.8. Turkey
- 9.6.2.9. The UAE
- 9.6.2.10. Rest of MEA
- 10. Global Multilayer Transparent Conductors Market Analysis, Opportunity and Forecast, By Region , 2016-2032
- 10.1. Global Multilayer Transparent Conductors Market Analysis by Region : Introduction
- 10.2. Market Size Absolute $ Opportunity Analysis and Forecast, By Region , 2016-2032
- 10.2.1. North America
- 10.2.2. Western Europe
- 10.2.3. Eastern Europe
- 10.2.4. APAC
- 10.2.5. Latin America
- 10.2.6. Middle East & Africa
- 11. Global Multilayer Transparent Conductors Market Competitive Landscape, Market Share Analysis, and Company Profiles
- 11.1. Market Share Analysis
- 11.2. Company Profiles
- 11.3. Canatu Oy
- 11.3.1. Company Overview
- 11.3.2. Financial Highlights
- 11.3.3. Product Portfolio
- 11.3.4. SWOT Analysis
- 11.3.5. Key Strategies and Developments
- 11.4. DuPont Teijin Films
- 11.4.1. Company Overview
- 11.4.2. Financial Highlights
- 11.4.3. Product Portfolio
- 11.4.4. SWOT Analysis
- 11.4.5. Key Strategies and Developments
- 11.5. Fujifilm Holdings Corporation
- 11.5.1. Company Overview
- 11.5.2. Financial Highlights
- 11.5.3. Product Portfolio
- 11.5.4. SWOT Analysis
- 11.5.5. Key Strategies and Developments
- 11.6. Dontech Inc.
- 11.6.1. Company Overview
- 11.6.2. Financial Highlights
- 11.6.3. Product Portfolio
- 11.6.4. SWOT Analysis
- 11.6.5. Key Strategies and Developments
- 11.7. Eastman Kodak
- 11.7.1. Company Overview
- 11.7.2. Financial Highlights
- 11.7.3. Product Portfolio
- 11.7.4. SWOT Analysis
- 11.7.5. Key Strategies and Developments
- 11.8. Cambrios Technologies Corporation
- 11.8.1. Company Overview
- 11.8.2. Financial Highlights
- 11.8.3. Product Portfolio
- 11.8.4. SWOT Analysis
- 11.8.5. Key Strategies and Developments
- 11.9. Quantum Coating Inc.
- 11.9.1. Company Overview
- 11.9.2. Financial Highlights
- 11.9.3. Product Portfolio
- 11.9.4. SWOT Analysis
- 11.9.5. Key Strategies and Developments
- 11.10. 3M Company
- 11.10.1. Company Overview
- 11.10.2. Financial Highlights
- 11.10.3. Product Portfolio
- 11.10.4. SWOT Analysis
- 11.10.5. Key Strategies and Developments
- 11.11. Nitto Denko Corporation
- 11.11.1. Company Overview
- 11.11.2. Financial Highlights
- 11.11.3. Product Portfolio
- 11.11.4. SWOT Analysis
- 11.11.5. Key Strategies and Developments
- 11.12. Toyobo Corporation
- 11.12.1. Company Overview
- 11.12.2. Financial Highlights
- 11.12.3. Product Portfolio
- 11.12.4. SWOT Analysis
- 11.12.5. Key Strategies and Developments
- 11.13.1. Company Overview
- 11.13.2. Financial Highlights
- 11.13.3. Product Portfolio
- 11.13.4. SWOT Analysis
- 11.13.5. Key Strategies and Developments
- 11.14. Thin Film Devices Inc.
- 11.14.1. Company Overview
- 11.14.2. Financial Highlights
- 11.14.3. Product Portfolio
- 11.14.4. SWOT Analysis
- 11.14.5. Key Strategies and Developments
- 11.15. Acree Technologies Inc.
- 11.15.1. Company Overview
- 11.15.2. Financial Highlights
- 11.15.3. Product Portfolio
- 11.15.4. SWOT Analysis
- 11.15.5. Key Strategies and Developments
- 11.16. Apple Inc.
- 11.16.1. Company Overview
- 11.16.2. Financial Highlights
- 11.16.3. Product Portfolio
- 11.16.4. SWOT Analysis
- 11.16.5. Key Strategies and Developments
- 11.17. Cima Nanotech.
- 11.17.1. Company Overview
- 11.17.2. Financial Highlights
- 11.17.3. Product Portfolio
- 11.17.4. SWOT Analysis
- 11.17.5. Key Strategies and Developments
- 12. Assumptions and Acronyms
- 13. Research Methodology
- 14. Contact
"
- List of Figures
- "
- Figure 1: Global Multilayer Transparent Conductors Market Revenue (US$ Mn) Market Share by Type in 2022
- Figure 2: Global Multilayer Transparent Conductors Market Market Attractiveness Analysis by Type, 2016-2032
- Figure 3: Global Multilayer Transparent Conductors Market Revenue (US$ Mn) Market Share by Applicationin 2022
- Figure 4: Global Multilayer Transparent Conductors Market Market Attractiveness Analysis by Application, 2016-2032
- Figure 5: Global Multilayer Transparent Conductors Market Revenue (US$ Mn) Market Share by Materialin 2022
- Figure 6: Global Multilayer Transparent Conductors Market Market Attractiveness Analysis by Material, 2016-2032
- Figure 7: Global Multilayer Transparent Conductors Market Revenue (US$ Mn) Market Share by Region in 2022
- Figure 8: Global Multilayer Transparent Conductors Market Market Attractiveness Analysis by Region, 2016-2032
- Figure 9: Global Multilayer Transparent Conductors Market Market Revenue (US$ Mn) (2016-2032)
- Figure 10: Global Multilayer Transparent Conductors Market Market Revenue (US$ Mn) Comparison by Region (2016-2032)
- Figure 11: Global Multilayer Transparent Conductors Market Market Revenue (US$ Mn) Comparison by Type (2016-2032)
- Figure 12: Global Multilayer Transparent Conductors Market Market Revenue (US$ Mn) Comparison by Application (2016-2032)
- Figure 13: Global Multilayer Transparent Conductors Market Market Revenue (US$ Mn) Comparison by Material (2016-2032)
- Figure 14: Global Multilayer Transparent Conductors Market Market Y-o-Y Growth Rate Comparison by Region (2016-2032)
- Figure 15: Global Multilayer Transparent Conductors Market Market Y-o-Y Growth Rate Comparison by Type (2016-2032)
- Figure 16: Global Multilayer Transparent Conductors Market Market Y-o-Y Growth Rate Comparison by Application (2016-2032)
- Figure 17: Global Multilayer Transparent Conductors Market Market Y-o-Y Growth Rate Comparison by Material (2016-2032)
- Figure 18: Global Multilayer Transparent Conductors Market Market Share Comparison by Region (2016-2032)
- Figure 19: Global Multilayer Transparent Conductors Market Market Share Comparison by Type (2016-2032)
- Figure 20: Global Multilayer Transparent Conductors Market Market Share Comparison by Application (2016-2032)
- Figure 21: Global Multilayer Transparent Conductors Market Market Share Comparison by Material (2016-2032)
- Figure 22: North America Multilayer Transparent Conductors Market Revenue (US$ Mn) Market Share by Typein 2022
- Figure 23: North America Multilayer Transparent Conductors Market Market Attractiveness Analysis by Type, 2016-2032
- Figure 24: North America Multilayer Transparent Conductors Market Revenue (US$ Mn) Market Share by Applicationin 2022
- Figure 25: North America Multilayer Transparent Conductors Market Market Attractiveness Analysis by Application, 2016-2032
- Figure 26: North America Multilayer Transparent Conductors Market Revenue (US$ Mn) Market Share by Materialin 2022
- Figure 27: North America Multilayer Transparent Conductors Market Market Attractiveness Analysis by Material, 2016-2032
- Figure 28: North America Multilayer Transparent Conductors Market Revenue (US$ Mn) Market Share by Country in 2022
- Figure 29: North America Multilayer Transparent Conductors Market Market Attractiveness Analysis by Country, 2016-2032
- Figure 30: North America Multilayer Transparent Conductors Market Market Revenue (US$ Mn) (2016-2032)
- Figure 31: North America Multilayer Transparent Conductors Market Market Revenue (US$ Mn) Comparison by Country (2016-2032)
- Figure 32: North America Multilayer Transparent Conductors Market Market Revenue (US$ Mn) Comparison by Type (2016-2032)
- Figure 33: North America Multilayer Transparent Conductors Market Market Revenue (US$ Mn) Comparison by Application (2016-2032)
- Figure 34: North America Multilayer Transparent Conductors Market Market Revenue (US$ Mn) Comparison by Material (2016-2032)
- Figure 35: North America Multilayer Transparent Conductors Market Market Y-o-Y Growth Rate Comparison by Country (2016-2032)
- Figure 36: North America Multilayer Transparent Conductors Market Market Y-o-Y Growth Rate Comparison by Type (2016-2032)
- Figure 37: North America Multilayer Transparent Conductors Market Market Y-o-Y Growth Rate Comparison by Application (2016-2032)
- Figure 38: North America Multilayer Transparent Conductors Market Market Y-o-Y Growth Rate Comparison by Material (2016-2032)
- Figure 39: North America Multilayer Transparent Conductors Market Market Share Comparison by Country (2016-2032)
- Figure 40: North America Multilayer Transparent Conductors Market Market Share Comparison by Type (2016-2032)
- Figure 41: North America Multilayer Transparent Conductors Market Market Share Comparison by Application (2016-2032)
- Figure 42: North America Multilayer Transparent Conductors Market Market Share Comparison by Material (2016-2032)
- Figure 43: Western Europe Multilayer Transparent Conductors Market Revenue (US$ Mn) Market Share by Typein 2022
- Figure 44: Western Europe Multilayer Transparent Conductors Market Market Attractiveness Analysis by Type, 2016-2032
- Figure 45: Western Europe Multilayer Transparent Conductors Market Revenue (US$ Mn) Market Share by Applicationin 2022
- Figure 46: Western Europe Multilayer Transparent Conductors Market Market Attractiveness Analysis by Application, 2016-2032
- Figure 47: Western Europe Multilayer Transparent Conductors Market Revenue (US$ Mn) Market Share by Materialin 2022
- Figure 48: Western Europe Multilayer Transparent Conductors Market Market Attractiveness Analysis by Material, 2016-2032
- Figure 49: Western Europe Multilayer Transparent Conductors Market Revenue (US$ Mn) Market Share by Country in 2022
- Figure 50: Western Europe Multilayer Transparent Conductors Market Market Attractiveness Analysis by Country, 2016-2032
- Figure 51: Western Europe Multilayer Transparent Conductors Market Market Revenue (US$ Mn) (2016-2032)
- Figure 52: Western Europe Multilayer Transparent Conductors Market Market Revenue (US$ Mn) Comparison by Country (2016-2032)
- Figure 53: Western Europe Multilayer Transparent Conductors Market Market Revenue (US$ Mn) Comparison by Type (2016-2032)
- Figure 54: Western Europe Multilayer Transparent Conductors Market Market Revenue (US$ Mn) Comparison by Application (2016-2032)
- Figure 55: Western Europe Multilayer Transparent Conductors Market Market Revenue (US$ Mn) Comparison by Material (2016-2032)
- Figure 56: Western Europe Multilayer Transparent Conductors Market Market Y-o-Y Growth Rate Comparison by Country (2016-2032)
- Figure 57: Western Europe Multilayer Transparent Conductors Market Market Y-o-Y Growth Rate Comparison by Type (2016-2032)
- Figure 58: Western Europe Multilayer Transparent Conductors Market Market Y-o-Y Growth Rate Comparison by Application (2016-2032)
- Figure 59: Western Europe Multilayer Transparent Conductors Market Market Y-o-Y Growth Rate Comparison by Material (2016-2032)
- Figure 60: Western Europe Multilayer Transparent Conductors Market Market Share Comparison by Country (2016-2032)
- Figure 61: Western Europe Multilayer Transparent Conductors Market Market Share Comparison by Type (2016-2032)
- Figure 62: Western Europe Multilayer Transparent Conductors Market Market Share Comparison by Application (2016-2032)
- Figure 63: Western Europe Multilayer Transparent Conductors Market Market Share Comparison by Material (2016-2032)
- Figure 64: Eastern Europe Multilayer Transparent Conductors Market Revenue (US$ Mn) Market Share by Typein 2022
- Figure 65: Eastern Europe Multilayer Transparent Conductors Market Market Attractiveness Analysis by Type, 2016-2032
- Figure 66: Eastern Europe Multilayer Transparent Conductors Market Revenue (US$ Mn) Market Share by Applicationin 2022
- Figure 67: Eastern Europe Multilayer Transparent Conductors Market Market Attractiveness Analysis by Application, 2016-2032
- Figure 68: Eastern Europe Multilayer Transparent Conductors Market Revenue (US$ Mn) Market Share by Materialin 2022
- Figure 69: Eastern Europe Multilayer Transparent Conductors Market Market Attractiveness Analysis by Material, 2016-2032
- Figure 70: Eastern Europe Multilayer Transparent Conductors Market Revenue (US$ Mn) Market Share by Country in 2022
- Figure 71: Eastern Europe Multilayer Transparent Conductors Market Market Attractiveness Analysis by Country, 2016-2032
- Figure 72: Eastern Europe Multilayer Transparent Conductors Market Market Revenue (US$ Mn) (2016-2032)
- Figure 73: Eastern Europe Multilayer Transparent Conductors Market Market Revenue (US$ Mn) Comparison by Country (2016-2032)
- Figure 74: Eastern Europe Multilayer Transparent Conductors Market Market Revenue (US$ Mn) Comparison by Type (2016-2032)
- Figure 75: Eastern Europe Multilayer Transparent Conductors Market Market Revenue (US$ Mn) Comparison by Application (2016-2032)
- Figure 76: Eastern Europe Multilayer Transparent Conductors Market Market Revenue (US$ Mn) Comparison by Material (2016-2032)
- Figure 77: Eastern Europe Multilayer Transparent Conductors Market Market Y-o-Y Growth Rate Comparison by Country (2016-2032)
- Figure 78: Eastern Europe Multilayer Transparent Conductors Market Market Y-o-Y Growth Rate Comparison by Type (2016-2032)
- Figure 79: Eastern Europe Multilayer Transparent Conductors Market Market Y-o-Y Growth Rate Comparison by Application (2016-2032)
- Figure 80: Eastern Europe Multilayer Transparent Conductors Market Market Y-o-Y Growth Rate Comparison by Material (2016-2032)
- Figure 81: Eastern Europe Multilayer Transparent Conductors Market Market Share Comparison by Country (2016-2032)
- Figure 82: Eastern Europe Multilayer Transparent Conductors Market Market Share Comparison by Type (2016-2032)
- Figure 83: Eastern Europe Multilayer Transparent Conductors Market Market Share Comparison by Application (2016-2032)
- Figure 84: Eastern Europe Multilayer Transparent Conductors Market Market Share Comparison by Material (2016-2032)
- Figure 85: APAC Multilayer Transparent Conductors Market Revenue (US$ Mn) Market Share by Typein 2022
- Figure 86: APAC Multilayer Transparent Conductors Market Market Attractiveness Analysis by Type, 2016-2032
- Figure 87: APAC Multilayer Transparent Conductors Market Revenue (US$ Mn) Market Share by Applicationin 2022
- Figure 88: APAC Multilayer Transparent Conductors Market Market Attractiveness Analysis by Application, 2016-2032
- Figure 89: APAC Multilayer Transparent Conductors Market Revenue (US$ Mn) Market Share by Materialin 2022
- Figure 90: APAC Multilayer Transparent Conductors Market Market Attractiveness Analysis by Material, 2016-2032
- Figure 91: APAC Multilayer Transparent Conductors Market Revenue (US$ Mn) Market Share by Country in 2022
- Figure 92: APAC Multilayer Transparent Conductors Market Market Attractiveness Analysis by Country, 2016-2032
- Figure 93: APAC Multilayer Transparent Conductors Market Market Revenue (US$ Mn) (2016-2032)
- Figure 94: APAC Multilayer Transparent Conductors Market Market Revenue (US$ Mn) Comparison by Country (2016-2032)
- Figure 95: APAC Multilayer Transparent Conductors Market Market Revenue (US$ Mn) Comparison by Type (2016-2032)
- Figure 96: APAC Multilayer Transparent Conductors Market Market Revenue (US$ Mn) Comparison by Application (2016-2032)
- Figure 97: APAC Multilayer Transparent Conductors Market Market Revenue (US$ Mn) Comparison by Material (2016-2032)
- Figure 98: APAC Multilayer Transparent Conductors Market Market Y-o-Y Growth Rate Comparison by Country (2016-2032)
- Figure 99: APAC Multilayer Transparent Conductors Market Market Y-o-Y Growth Rate Comparison by Type (2016-2032)
- Figure 100: APAC Multilayer Transparent Conductors Market Market Y-o-Y Growth Rate Comparison by Application (2016-2032)
- Figure 101: APAC Multilayer Transparent Conductors Market Market Y-o-Y Growth Rate Comparison by Material (2016-2032)
- Figure 102: APAC Multilayer Transparent Conductors Market Market Share Comparison by Country (2016-2032)
- Figure 103: APAC Multilayer Transparent Conductors Market Market Share Comparison by Type (2016-2032)
- Figure 104: APAC Multilayer Transparent Conductors Market Market Share Comparison by Application (2016-2032)
- Figure 105: APAC Multilayer Transparent Conductors Market Market Share Comparison by Material (2016-2032)
- Figure 106: Latin America Multilayer Transparent Conductors Market Revenue (US$ Mn) Market Share by Typein 2022
- Figure 107: Latin America Multilayer Transparent Conductors Market Market Attractiveness Analysis by Type, 2016-2032
- Figure 108: Latin America Multilayer Transparent Conductors Market Revenue (US$ Mn) Market Share by Applicationin 2022
- Figure 109: Latin America Multilayer Transparent Conductors Market Market Attractiveness Analysis by Application, 2016-2032
- Figure 110: Latin America Multilayer Transparent Conductors Market Revenue (US$ Mn) Market Share by Materialin 2022
- Figure 111: Latin America Multilayer Transparent Conductors Market Market Attractiveness Analysis by Material, 2016-2032
- Figure 112: Latin America Multilayer Transparent Conductors Market Revenue (US$ Mn) Market Share by Country in 2022
- Figure 113: Latin America Multilayer Transparent Conductors Market Market Attractiveness Analysis by Country, 2016-2032
- Figure 114: Latin America Multilayer Transparent Conductors Market Market Revenue (US$ Mn) (2016-2032)
- Figure 115: Latin America Multilayer Transparent Conductors Market Market Revenue (US$ Mn) Comparison by Country (2016-2032)
- Figure 116: Latin America Multilayer Transparent Conductors Market Market Revenue (US$ Mn) Comparison by Type (2016-2032)
- Figure 117: Latin America Multilayer Transparent Conductors Market Market Revenue (US$ Mn) Comparison by Application (2016-2032)
- Figure 118: Latin America Multilayer Transparent Conductors Market Market Revenue (US$ Mn) Comparison by Material (2016-2032)
- Figure 119: Latin America Multilayer Transparent Conductors Market Market Y-o-Y Growth Rate Comparison by Country (2016-2032)
- Figure 120: Latin America Multilayer Transparent Conductors Market Market Y-o-Y Growth Rate Comparison by Type (2016-2032)
- Figure 121: Latin America Multilayer Transparent Conductors Market Market Y-o-Y Growth Rate Comparison by Application (2016-2032)
- Figure 122: Latin America Multilayer Transparent Conductors Market Market Y-o-Y Growth Rate Comparison by Material (2016-2032)
- Figure 123: Latin America Multilayer Transparent Conductors Market Market Share Comparison by Country (2016-2032)
- Figure 124: Latin America Multilayer Transparent Conductors Market Market Share Comparison by Type (2016-2032)
- Figure 125: Latin America Multilayer Transparent Conductors Market Market Share Comparison by Application (2016-2032)
- Figure 126: Latin America Multilayer Transparent Conductors Market Market Share Comparison by Material (2016-2032)
- Figure 127: Middle East & Africa Multilayer Transparent Conductors Market Revenue (US$ Mn) Market Share by Typein 2022
- Figure 128: Middle East & Africa Multilayer Transparent Conductors Market Market Attractiveness Analysis by Type, 2016-2032
- Figure 129: Middle East & Africa Multilayer Transparent Conductors Market Revenue (US$ Mn) Market Share by Applicationin 2022
- Figure 130: Middle East & Africa Multilayer Transparent Conductors Market Market Attractiveness Analysis by Application, 2016-2032
- Figure 131: Middle East & Africa Multilayer Transparent Conductors Market Revenue (US$ Mn) Market Share by Materialin 2022
- Figure 132: Middle East & Africa Multilayer Transparent Conductors Market Market Attractiveness Analysis by Material, 2016-2032
- Figure 133: Middle East & Africa Multilayer Transparent Conductors Market Revenue (US$ Mn) Market Share by Country in 2022
- Figure 134: Middle East & Africa Multilayer Transparent Conductors Market Market Attractiveness Analysis by Country, 2016-2032
- Figure 135: Middle East & Africa Multilayer Transparent Conductors Market Market Revenue (US$ Mn) (2016-2032)
- Figure 136: Middle East & Africa Multilayer Transparent Conductors Market Market Revenue (US$ Mn) Comparison by Country (2016-2032)
- Figure 137: Middle East & Africa Multilayer Transparent Conductors Market Market Revenue (US$ Mn) Comparison by Type (2016-2032)
- Figure 138: Middle East & Africa Multilayer Transparent Conductors Market Market Revenue (US$ Mn) Comparison by Application (2016-2032)
- Figure 139: Middle East & Africa Multilayer Transparent Conductors Market Market Revenue (US$ Mn) Comparison by Material (2016-2032)
- Figure 140: Middle East & Africa Multilayer Transparent Conductors Market Market Y-o-Y Growth Rate Comparison by Country (2016-2032)
- Figure 141: Middle East & Africa Multilayer Transparent Conductors Market Market Y-o-Y Growth Rate Comparison by Type (2016-2032)
- Figure 142: Middle East & Africa Multilayer Transparent Conductors Market Market Y-o-Y Growth Rate Comparison by Application (2016-2032)
- Figure 143: Middle East & Africa Multilayer Transparent Conductors Market Market Y-o-Y Growth Rate Comparison by Material (2016-2032)
- Figure 144: Middle East & Africa Multilayer Transparent Conductors Market Market Share Comparison by Country (2016-2032)
- Figure 145: Middle East & Africa Multilayer Transparent Conductors Market Market Share Comparison by Type (2016-2032)
- Figure 146: Middle East & Africa Multilayer Transparent Conductors Market Market Share Comparison by Application (2016-2032)
- Figure 147: Middle East & Africa Multilayer Transparent Conductors Market Market Share Comparison by Material (2016-2032)
"
- List of Tables
- "
- Table 1: Global Multilayer Transparent Conductors Market Market Comparison by Type (2016-2032)
- Table 2: Global Multilayer Transparent Conductors Market Market Comparison by Application (2016-2032)
- Table 3: Global Multilayer Transparent Conductors Market Market Comparison by Material (2016-2032)
- Table 4: Global Multilayer Transparent Conductors Market Revenue (US$ Mn) Comparison by Region (2016-2032)
- Table 5: Global Multilayer Transparent Conductors Market Market Revenue (US$ Mn) (2016-2032)
- Table 6: Global Multilayer Transparent Conductors Market Market Revenue (US$ Mn) Comparison by Region (2016-2032)
- Table 7: Global Multilayer Transparent Conductors Market Market Revenue (US$ Mn) Comparison by Type (2016-2032)
- Table 8: Global Multilayer Transparent Conductors Market Market Revenue (US$ Mn) Comparison by Application (2016-2032)
- Table 9: Global Multilayer Transparent Conductors Market Market Revenue (US$ Mn) Comparison by Material (2016-2032)
- Table 10: Global Multilayer Transparent Conductors Market Market Y-o-Y Growth Rate Comparison by Region (2016-2032)
- Table 11: Global Multilayer Transparent Conductors Market Market Y-o-Y Growth Rate Comparison by Type (2016-2032)
- Table 12: Global Multilayer Transparent Conductors Market Market Y-o-Y Growth Rate Comparison by Application (2016-2032)
- Table 13: Global Multilayer Transparent Conductors Market Market Y-o-Y Growth Rate Comparison by Material (2016-2032)
- Table 14: Global Multilayer Transparent Conductors Market Market Share Comparison by Region (2016-2032)
- Table 15: Global Multilayer Transparent Conductors Market Market Share Comparison by Type (2016-2032)
- Table 16: Global Multilayer Transparent Conductors Market Market Share Comparison by Application (2016-2032)
- Table 17: Global Multilayer Transparent Conductors Market Market Share Comparison by Material (2016-2032)
- Table 18: North America Multilayer Transparent Conductors Market Market Comparison by Application (2016-2032)
- Table 19: North America Multilayer Transparent Conductors Market Market Comparison by Material (2016-2032)
- Table 20: North America Multilayer Transparent Conductors Market Revenue (US$ Mn) Comparison by Country (2016-2032)
- Table 21: North America Multilayer Transparent Conductors Market Market Revenue (US$ Mn) (2016-2032)
- Table 22: North America Multilayer Transparent Conductors Market Market Revenue (US$ Mn) Comparison by Country (2016-2032)
- Table 23: North America Multilayer Transparent Conductors Market Market Revenue (US$ Mn) Comparison by Type (2016-2032)
- Table 24: North America Multilayer Transparent Conductors Market Market Revenue (US$ Mn) Comparison by Application (2016-2032)
- Table 25: North America Multilayer Transparent Conductors Market Market Revenue (US$ Mn) Comparison by Material (2016-2032)
- Table 26: North America Multilayer Transparent Conductors Market Market Y-o-Y Growth Rate Comparison by Country (2016-2032)
- Table 27: North America Multilayer Transparent Conductors Market Market Y-o-Y Growth Rate Comparison by Type (2016-2032)
- Table 28: North America Multilayer Transparent Conductors Market Market Y-o-Y Growth Rate Comparison by Application (2016-2032)
- Table 29: North America Multilayer Transparent Conductors Market Market Y-o-Y Growth Rate Comparison by Material (2016-2032)
- Table 30: North America Multilayer Transparent Conductors Market Market Share Comparison by Country (2016-2032)
- Table 31: North America Multilayer Transparent Conductors Market Market Share Comparison by Type (2016-2032)
- Table 32: North America Multilayer Transparent Conductors Market Market Share Comparison by Application (2016-2032)
- Table 33: North America Multilayer Transparent Conductors Market Market Share Comparison by Material (2016-2032)
- Table 34: Western Europe Multilayer Transparent Conductors Market Market Comparison by Type (2016-2032)
- Table 35: Western Europe Multilayer Transparent Conductors Market Market Comparison by Application (2016-2032)
- Table 36: Western Europe Multilayer Transparent Conductors Market Market Comparison by Material (2016-2032)
- Table 37: Western Europe Multilayer Transparent Conductors Market Revenue (US$ Mn) Comparison by Country (2016-2032)
- Table 38: Western Europe Multilayer Transparent Conductors Market Market Revenue (US$ Mn) (2016-2032)
- Table 39: Western Europe Multilayer Transparent Conductors Market Market Revenue (US$ Mn) Comparison by Country (2016-2032)
- Table 40: Western Europe Multilayer Transparent Conductors Market Market Revenue (US$ Mn) Comparison by Type (2016-2032)
- Table 41: Western Europe Multilayer Transparent Conductors Market Market Revenue (US$ Mn) Comparison by Application (2016-2032)
- Table 42: Western Europe Multilayer Transparent Conductors Market Market Revenue (US$ Mn) Comparison by Material (2016-2032)
- Table 43: Western Europe Multilayer Transparent Conductors Market Market Y-o-Y Growth Rate Comparison by Country (2016-2032)
- Table 44: Western Europe Multilayer Transparent Conductors Market Market Y-o-Y Growth Rate Comparison by Type (2016-2032)
- Table 45: Western Europe Multilayer Transparent Conductors Market Market Y-o-Y Growth Rate Comparison by Application (2016-2032)
- Table 46: Western Europe Multilayer Transparent Conductors Market Market Y-o-Y Growth Rate Comparison by Material (2016-2032)
- Table 47: Western Europe Multilayer Transparent Conductors Market Market Share Comparison by Country (2016-2032)
- Table 48: Western Europe Multilayer Transparent Conductors Market Market Share Comparison by Type (2016-2032)
- Table 49: Western Europe Multilayer Transparent Conductors Market Market Share Comparison by Application (2016-2032)
- Table 50: Western Europe Multilayer Transparent Conductors Market Market Share Comparison by Material (2016-2032)
- Table 51: Eastern Europe Multilayer Transparent Conductors Market Market Comparison by Type (2016-2032)
- Table 52: Eastern Europe Multilayer Transparent Conductors Market Market Comparison by Application (2016-2032)
- Table 53: Eastern Europe Multilayer Transparent Conductors Market Market Comparison by Material (2016-2032)
- Table 54: Eastern Europe Multilayer Transparent Conductors Market Revenue (US$ Mn) Comparison by Country (2016-2032)
- Table 55: Eastern Europe Multilayer Transparent Conductors Market Market Revenue (US$ Mn) (2016-2032)
- Table 56: Eastern Europe Multilayer Transparent Conductors Market Market Revenue (US$ Mn) Comparison by Country (2016-2032)
- Table 57: Eastern Europe Multilayer Transparent Conductors Market Market Revenue (US$ Mn) Comparison by Type (2016-2032)
- Table 58: Eastern Europe Multilayer Transparent Conductors Market Market Revenue (US$ Mn) Comparison by Application (2016-2032)
- Table 59: Eastern Europe Multilayer Transparent Conductors Market Market Revenue (US$ Mn) Comparison by Material (2016-2032)
- Table 60: Eastern Europe Multilayer Transparent Conductors Market Market Y-o-Y Growth Rate Comparison by Country (2016-2032)
- Table 61: Eastern Europe Multilayer Transparent Conductors Market Market Y-o-Y Growth Rate Comparison by Type (2016-2032)
- Table 62: Eastern Europe Multilayer Transparent Conductors Market Market Y-o-Y Growth Rate Comparison by Application (2016-2032)
- Table 63: Eastern Europe Multilayer Transparent Conductors Market Market Y-o-Y Growth Rate Comparison by Material (2016-2032)
- Table 64: Eastern Europe Multilayer Transparent Conductors Market Market Share Comparison by Country (2016-2032)
- Table 65: Eastern Europe Multilayer Transparent Conductors Market Market Share Comparison by Type (2016-2032)
- Table 66: Eastern Europe Multilayer Transparent Conductors Market Market Share Comparison by Application (2016-2032)
- Table 67: Eastern Europe Multilayer Transparent Conductors Market Market Share Comparison by Material (2016-2032)
- Table 68: APAC Multilayer Transparent Conductors Market Market Comparison by Type (2016-2032)
- Table 69: APAC Multilayer Transparent Conductors Market Market Comparison by Application (2016-2032)
- Table 70: APAC Multilayer Transparent Conductors Market Market Comparison by Material (2016-2032)
- Table 71: APAC Multilayer Transparent Conductors Market Revenue (US$ Mn) Comparison by Country (2016-2032)
- Table 72: APAC Multilayer Transparent Conductors Market Market Revenue (US$ Mn) (2016-2032)
- Table 73: APAC Multilayer Transparent Conductors Market Market Revenue (US$ Mn) Comparison by Country (2016-2032)
- Table 74: APAC Multilayer Transparent Conductors Market Market Revenue (US$ Mn) Comparison by Type (2016-2032)
- Table 75: APAC Multilayer Transparent Conductors Market Market Revenue (US$ Mn) Comparison by Application (2016-2032)
- Table 76: APAC Multilayer Transparent Conductors Market Market Revenue (US$ Mn) Comparison by Material (2016-2032)
- Table 77: APAC Multilayer Transparent Conductors Market Market Y-o-Y Growth Rate Comparison by Country (2016-2032)
- Table 78: APAC Multilayer Transparent Conductors Market Market Y-o-Y Growth Rate Comparison by Type (2016-2032)
- Table 79: APAC Multilayer Transparent Conductors Market Market Y-o-Y Growth Rate Comparison by Application (2016-2032)
- Table 80: APAC Multilayer Transparent Conductors Market Market Y-o-Y Growth Rate Comparison by Material (2016-2032)
- Table 81: APAC Multilayer Transparent Conductors Market Market Share Comparison by Country (2016-2032)
- Table 82: APAC Multilayer Transparent Conductors Market Market Share Comparison by Type (2016-2032)
- Table 83: APAC Multilayer Transparent Conductors Market Market Share Comparison by Application (2016-2032)
- Table 84: APAC Multilayer Transparent Conductors Market Market Share Comparison by Material (2016-2032)
- Table 85: Latin America Multilayer Transparent Conductors Market Market Comparison by Type (2016-2032)
- Table 86: Latin America Multilayer Transparent Conductors Market Market Comparison by Application (2016-2032)
- Table 87: Latin America Multilayer Transparent Conductors Market Market Comparison by Material (2016-2032)
- Table 88: Latin America Multilayer Transparent Conductors Market Revenue (US$ Mn) Comparison by Country (2016-2032)
- Table 89: Latin America Multilayer Transparent Conductors Market Market Revenue (US$ Mn) (2016-2032)
- Table 90: Latin America Multilayer Transparent Conductors Market Market Revenue (US$ Mn) Comparison by Country (2016-2032)
- Table 91: Latin America Multilayer Transparent Conductors Market Market Revenue (US$ Mn) Comparison by Type (2016-2032)
- Table 92: Latin America Multilayer Transparent Conductors Market Market Revenue (US$ Mn) Comparison by Application (2016-2032)
- Table 93: Latin America Multilayer Transparent Conductors Market Market Revenue (US$ Mn) Comparison by Material (2016-2032)
- Table 94: Latin America Multilayer Transparent Conductors Market Market Y-o-Y Growth Rate Comparison by Country (2016-2032)
- Table 95: Latin America Multilayer Transparent Conductors Market Market Y-o-Y Growth Rate Comparison by Type (2016-2032)
- Table 96: Latin America Multilayer Transparent Conductors Market Market Y-o-Y Growth Rate Comparison by Application (2016-2032)
- Table 97: Latin America Multilayer Transparent Conductors Market Market Y-o-Y Growth Rate Comparison by Material (2016-2032)
- Table 98: Latin America Multilayer Transparent Conductors Market Market Share Comparison by Country (2016-2032)
- Table 99: Latin America Multilayer Transparent Conductors Market Market Share Comparison by Type (2016-2032)
- Table 100: Latin America Multilayer Transparent Conductors Market Market Share Comparison by Application (2016-2032)
- Table 101: Latin America Multilayer Transparent Conductors Market Market Share Comparison by Material (2016-2032)
- Table 102: Middle East & Africa Multilayer Transparent Conductors Market Market Comparison by Type (2016-2032)
- Table 103: Middle East & Africa Multilayer Transparent Conductors Market Market Comparison by Application (2016-2032)
- Table 104: Middle East & Africa Multilayer Transparent Conductors Market Market Comparison by Material (2016-2032)
- Table 105: Middle East & Africa Multilayer Transparent Conductors Market Revenue (US$ Mn) Comparison by Country (2016-2032)
- Table 106: Middle East & Africa Multilayer Transparent Conductors Market Market Revenue (US$ Mn) (2016-2032)
- Table 107: Middle East & Africa Multilayer Transparent Conductors Market Market Revenue (US$ Mn) Comparison by Country (2016-2032)
- Table 108: Middle East & Africa Multilayer Transparent Conductors Market Market Revenue (US$ Mn) Comparison by Type (2016-2032)
- Table 109: Middle East & Africa Multilayer Transparent Conductors Market Market Revenue (US$ Mn) Comparison by Application (2016-2032)
- Table 110: Middle East & Africa Multilayer Transparent Conductors Market Market Revenue (US$ Mn) Comparison by Material (2016-2032)
- Table 111: Middle East & Africa Multilayer Transparent Conductors Market Market Y-o-Y Growth Rate Comparison by Country (2016-2032)
- Table 112: Middle East & Africa Multilayer Transparent Conductors Market Market Y-o-Y Growth Rate Comparison by Type (2016-2032)
- Table 113: Middle East & Africa Multilayer Transparent Conductors Market Market Y-o-Y Growth Rate Comparison by Application (2016-2032)
- Table 114: Middle East & Africa Multilayer Transparent Conductors Market Market Y-o-Y Growth Rate Comparison by Material (2016-2032)
- Table 115: Middle East & Africa Multilayer Transparent Conductors Market Market Share Comparison by Country (2016-2032)
- Table 116: Middle East & Africa Multilayer Transparent Conductors Market Market Share Comparison by Type (2016-2032)
- Table 117: Middle East & Africa Multilayer Transparent Conductors Market Market Share Comparison by Application (2016-2032)
- Table 118: Middle East & Africa Multilayer Transparent Conductors Market Market Share Comparison by Material (2016-2032)
- 1. Executive Summary
-
- Canatu Oy
- DuPont Teijin Films
- Fujifilm Holdings Corporation
- Dontech Inc.
- Eastman Kodak
- Cambrios Technologies Corporation
- Quantum Coating Inc.
- 3M Company
- Nitto Denko Corporation
- Toyobo Corporation
- Thin Film Devices Inc.
- Abrisa Technologies
- Acree Technologies Inc.
- Apple Inc.
- Cima Nanotech.
Our Clients


View Our Licence Options
