Moringa Products Market By Product (Leaf Powder, Tea, Oil, Seeds), By Application (Food and Beverages, Cosmetic and Skincare Products, Bakery and Confectionery, Pharmaceutical Industry), By Distribution Channel (Supermarkets/Hypermarkets, Convenience Stores, Specialty Stores, Online Retail), By Region And Companies - Industry Segment Outlook, Market Assessment, Competition Scenario, Trends, And Forecast 2024-2033
-
9967
-
July 2024
-
300
-


-
This report was compiled by Shreyas Rokade Shreyas Rokade is a seasoned Research Analyst with CMFE, bringing extensive expertise in market research and consulting, with a strong background in Chemical Engineering. Correspondence Team Lead-CMFE Linkedin | Detailed Market research Methodology Our methodology involves a mix of primary research, including interviews with leading mental health experts, and secondary research from reputable medical journals and databases. View Detailed Methodology Page
-
Quick Navigation
Report Overview
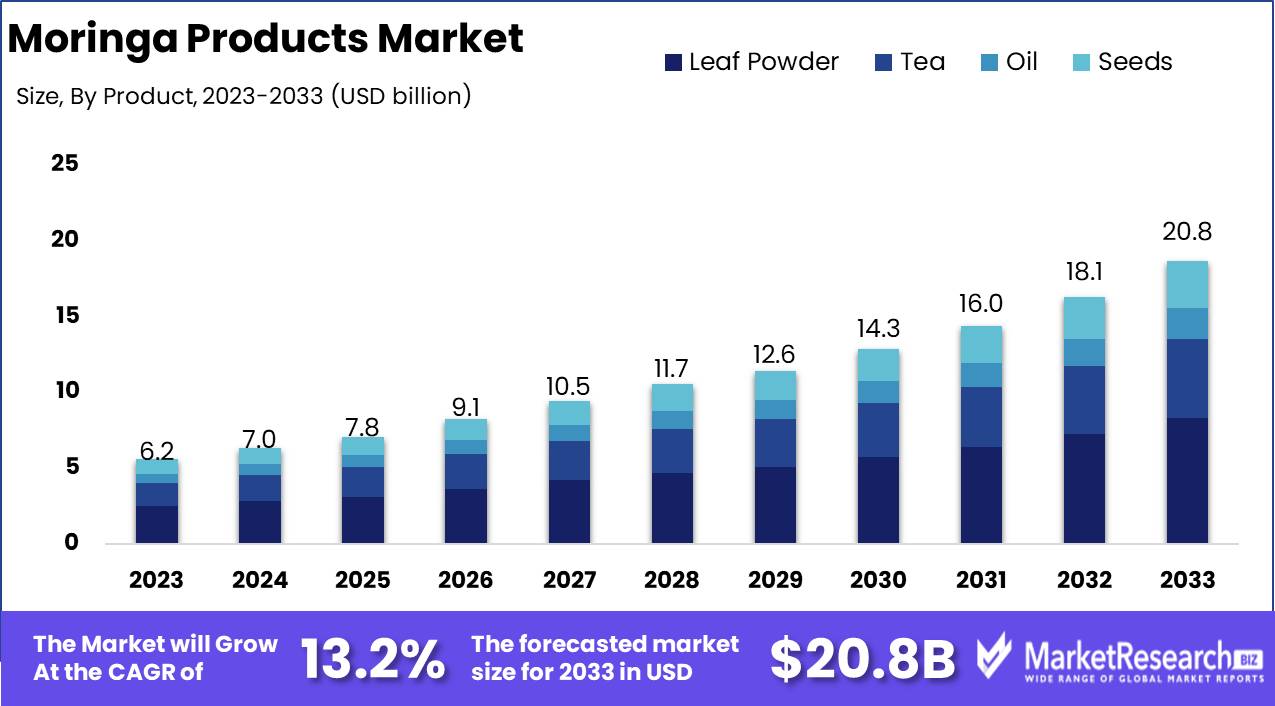
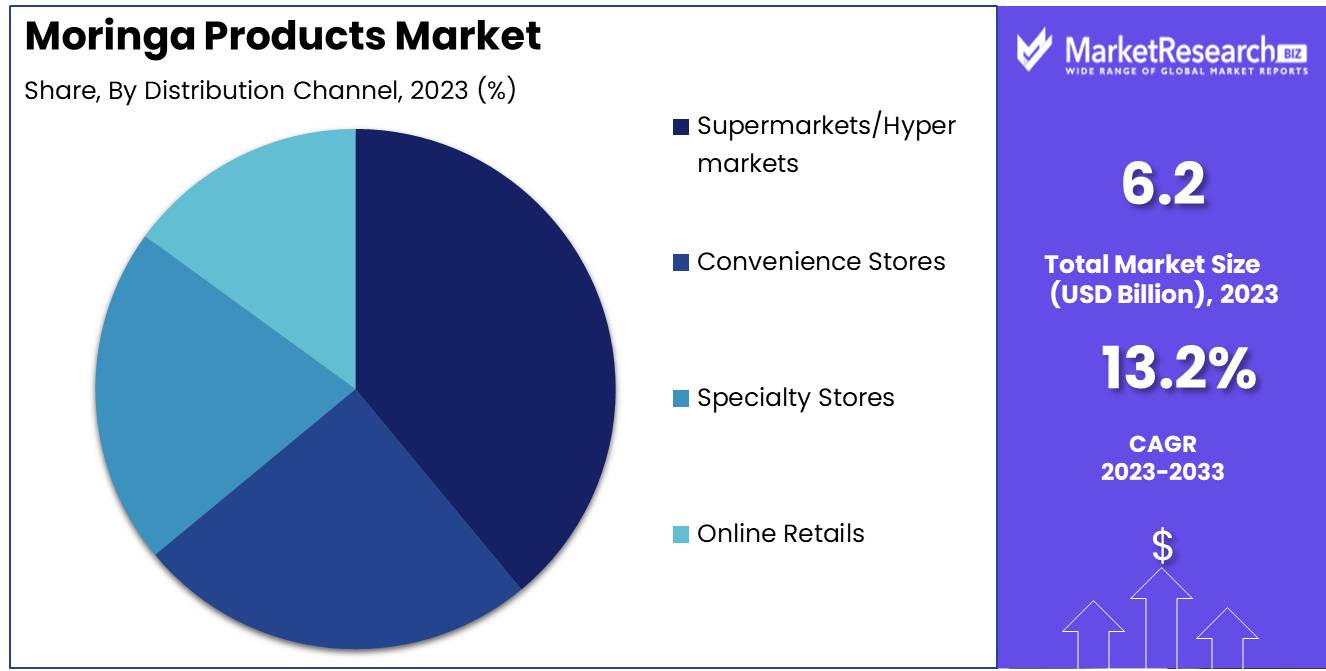
The Moringa Products Market was valued at USD 6.2 billion in 2023. It is expected to reach USD 20.8 billion by 2033, with a CAGR of 13.2% during the forecast period from 2024 to 2033.
The Moringa Products Market encompasses a diverse range of goods derived from the Moringa oleifera tree, known for its nutritional, therapeutic, and industrial benefits. This market includes dietary supplements, pharmaceuticals, cosmetics, and water purification products. Driven by growing consumer awareness of health and wellness, as well as the natural composition of moringa-based products, the market has seen significant growth.
The Moringa Products Market is emerging as a significant sector in the health and wellness industry, driven by a growing recognition of its nutritional and environmental benefits. Primarily utilized in dietary supplements, Moringa stands out for its high nutritional profile, offering substantial health advantages such as anti-inflammatory properties, enhanced immune system support, and a rich array of vitamins and minerals. This pivotal role in nutritional supplements underscores its appeal among health-conscious consumers, who are increasingly seeking natural and efficacious solutions for health management.
Furthermore, Moringa's adaptability to arid and semi-arid environments, coupled with its minimal water requirements, positions it as a sustainable agricultural choice. This sustainability is a critical factor in its adoption across less fertile regions, making it an attractive crop for areas vulnerable to climate change and soil degradation. The market is also witnessing a surge in investments as major health and wellness brands are keen to capitalize on Moringa's benefits. These companies are not only integrating Moringa into their existing product portfolios but are also expanding their market reach, particularly in North America and Europe, where there is a robust demand for natural and sustainable products. This strategic expansion is poised to propel market growth, as Moringa products continue to gain traction among new demographics and geographies, reflecting a broader trend towards plant-based health and wellness solutions.
Key Takeaways
- Market Growth: The Moringa Products Market was valued at USD 6.2 billion in 2023. It is expected to reach USD 20.8 billion by 2033, with a CAGR of 13.2% during the forecast period from 2024 to 2033.
- By Product: Leaf Powder dominates the Moringa Products Market, excelling in health benefits.
- By Application: Cosmetic and Skincare Products dominate the Moringa Market with natural appeal.
- By Distribution Channel: Supermarkets/Hypermarkets dominate the diverse Moringa Products Market distribution channels.
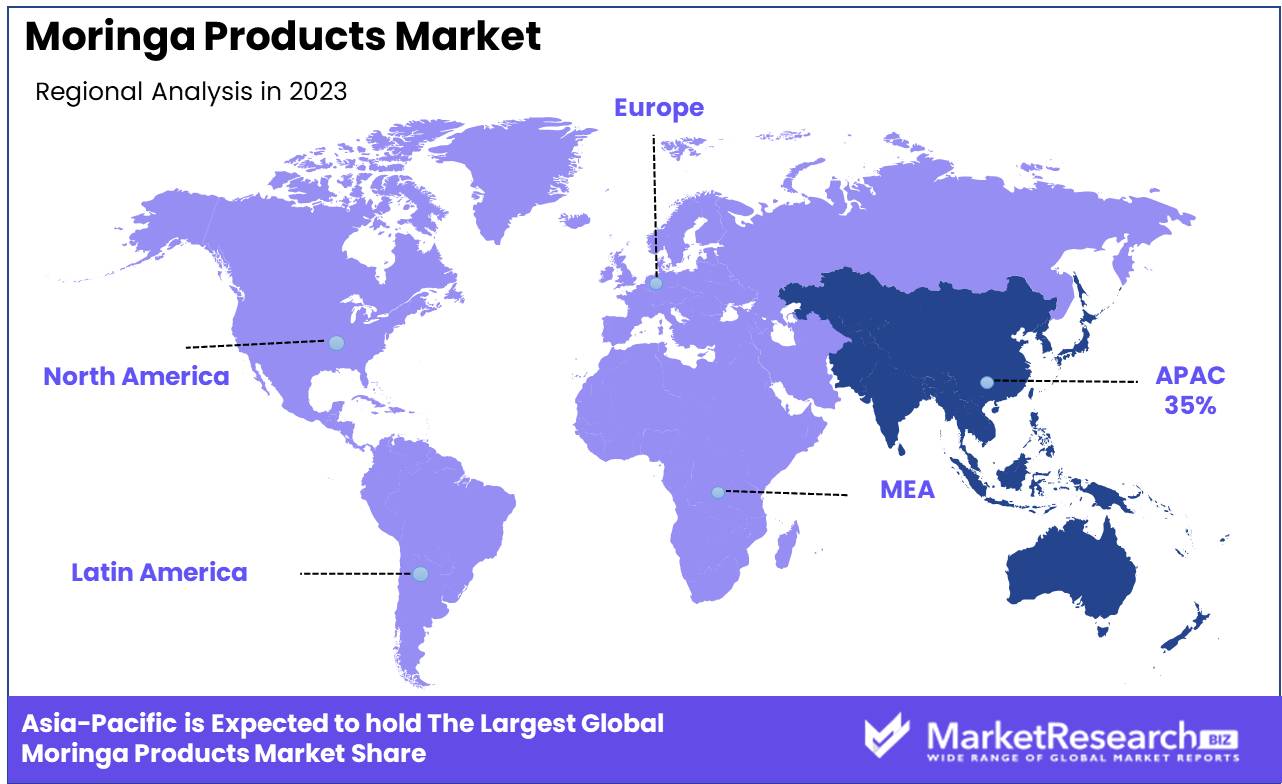
- Regional Dominance: Asia Pacific dominates the global Moringa Products Market with a 35% share.
- Growth Opportunity: The increasing demand for organic products and rising health consciousness presents a substantial growth opportunity for the Moringa products market.
Driving factors
Increasing Demand for Plant-Based Supplements and Natural Ingredients
The Moringa Products Market is significantly driven by the surging consumer interest in plant-based supplements and natural ingredients. As awareness of health and wellness continues to rise, more individuals are turning towards natural supplements to bolster their health. Moringa, often touted as a 'superfood' due to its high vitamin, mineral, and antioxidant content, stands out as a preferred choice. This shift is underscored by the growing aversion to synthetic additives, with consumers increasingly scrutinizing product labels for natural components. Statistics indicate robust growth in the plant-based herbal supplement sector, which has seen a compound annual growth rate (CAGR) of approximately 6.5% over recent years, suggesting a positive trajectory for the demand for products like moringa.
Growing Demand for Moringa-Based Food and Beverage Products
Parallel to the rise in supplements, there is an expanding market for moringa-based food and beverage products. This growth is fueled by the plant's versatility, allowing it to be used in a variety of forms such as powders, teas, and bars. The health benefits associated with moringa, including its potential to improve energy levels and aid in digestion, make it an attractive addition to the health food sector. The incorporation of moringa into daily diets is not just a trend among health enthusiasts but is becoming mainstream, evidenced by the inclusion of moringa in menu items at health-focused cafes and restaurants. The food and beverage sector's embrace of moringa is not only enhancing its visibility but also its accessibility, thus broadening the consumer base and driving market growth.
Expanding Applications of Moringa in Personal Care and Cosmetic Products
The utilization of moringa in personal care and cosmetic products represents another pivotal growth avenue for the market. The natural anti-inflammatory and nourishing properties of moringa make it an excellent ingredient for skin care formulations. From moisturizers and serums to shampoos and conditioners, the range of moringa-infused products is expanding. This trend is aligned with the broader consumer shift towards organic and natural beauty products, which has been growing at a CAGR of about 9.5% globally. The cosmetic industry's increasing reliance on sustainable and ethically sourced ingredients further complements this growth, positioning moringa as a key component in the natural beauty movement.
Restraining Factors
Supply-Demand Gap: Constraining Market Expansion and Prices
The moringa products market is uniquely positioned at the nexus of growing global health trends and the agricultural capacities of primarily developing nations. The supply-demand gap emerges as a primary restraining factor largely due to the limited cultivation areas and the fluctuating yield of moringa plants. These cultivation challenges are compounded by increasing global demand fueled by rising awareness of moringa's health benefits, such as its high vitamin, mineral, and protein content, which positions it as a superfood.
This gap directly influences market dynamics by driving up prices and limiting the availability of moringa products to end consumers, thereby constraining market growth. Furthermore, the uneven supply capabilities can lead to potential revenue loss and missed opportunities in both established and emerging markets. For example, the inability to meet demand consistently affects the reliability of supply chains, which in turn impacts consumer trust and long-term customer retention.
Changes in Consumer Preferences: A Dual-Edged Sword for Market Adaptability
Changes in consumer preferences represent a dynamic and pivotal restraining factor for the moringa products market. On one hand, the shift towards natural and organic health products has bolstered the demand for moringa-based items. On the other hand, this factor demands rapid adaptability from producers and marketers of moringa products to cater to evolving tastes and preferences, such as the demand for product diversification (e.g., moringa in powders, pills, and teas).
The trend towards veganism and plant-based diets can increase the consumer base for moringa products, as people seek out new and nutritious plant-based sources of nutrients. However, the challenge lies in keeping pace with these trends and ensuring product offerings remain aligned with consumer expectations, which are increasingly leaning towards sustainably sourced and ethically produced goods. If consumer preferences shift faster than the producers can adapt (for example, towards other superfoods or different health and wellness products), the market could see a deceleration in growth.
By Product Analysis
Leaf Powder segment dominates the Moringa Products Market, excelling in health benefits.
In 2023, Leaf Powder held a dominant market position in the by-product segment of the Moringa Products Market. This segment's strength can be attributed to the increasing consumer awareness of the health benefits associated with moringa leaf powder, including its high nutrient content and antioxidant properties. The market has also seen substantial growth due to the versatility of leaf powder, which is easily incorporated into various dietary supplements and health foods.
Following Leaf Powder, Moringa Tea has gained traction, particularly among health-conscious consumers looking for natural and wellness-promoting beverages. The appeal of moringa tea lies in its purported benefits for weight management and metabolic health, making it a popular choice in health and wellness circles.
Moringa Oil, extracted from the seeds of the moringa plant, has carved out a significant niche in the cosmetics and skincare industry. Its hydrating and antioxidative properties make it a valuable ingredient in formulations aimed at improving skin health and appearance.
Lastly, Moringa Seeds are increasingly recognized for their use in water purification processes in addition to their nutritional benefits, further diversifying the applications of moringa products in both health and environmental sectors.
By Application Analysis
Cosmetic and Skincare Products dominate the 2023 Moringa Market with natural appeal.
In 2023, Cosmetic and Skincare Products held a dominant market position in the By Application segment of the Moringa Products Market. This segment's ascendancy can be attributed to the escalating consumer demand for natural and organic skincare products, which has significantly driven the incorporation of moringa extracts in various cosmetic formulations. Moringa, known for its antioxidant, anti-inflammatory, and skin rejuvenating properties, has been increasingly favored by skincare brands aiming to meet the clean beauty trends.
Moreover, the Food and Beverages sector also exhibited substantial growth, utilizing moringa's nutritional benefits to fortify drinks and health supplements. Bakery and Confectionery applications have integrated moringa as a functional ingredient to enhance nutritional content in foods, catering to the rising health-conscious consumer base.
Lastly, the Pharmaceutical Industry continues to leverage moringa’s medicinal properties, particularly in developing regions, to formulate supplements and drugs that address malnutrition and support immune health, thereby sustaining a robust growth trajectory within this market segment.
By Distribution Channel Analysis
Supermarkets/Hypermarkets dominate the diverse Moringa Products Market distribution channels.
In 2023, Supermarkets/Hypermarkets held a dominant market position in the "By Distribution Channel" segment of the Moringa Products Market. This channel's prominence can be attributed to its extensive reach and the ability to offer a diverse range of moringa-based products under one roof, which significantly enhances consumer accessibility and convenience. Supermarkets/Hypermarkets effectively cater to a broad customer base, providing visibility and trial opportunities for new moringa products, which is essential for market penetration and consumer adoption.
Following Supermarkets/Hypermarkets, Convenience Stores serve as another critical distribution channel. These stores are favored for their strategic locations and extended operating hours, offering quick purchase options for customers seeking health and wellness products like those derived from moringa.
Specialty Stores also play a significant role, particularly for consumers prioritizing quality and variety. These stores often provide a curated selection of premium moringa products, alongside expert advice and a more personalized shopping experience.
Online Retail has seen exponential growth, driven by the shift towards e-commerce. This channel offers consumers the convenience of home delivery and easy access to a wide array of product reviews, enabling informed purchasing decisions. As digital platforms continue to evolve, the online sales of moringa products are expected to increase, further shaping the market dynamics.
Key Market Segments
By Product
- Leaf Powder
- Tea
- Oil
- Seeds
By Application
- Food and Beverages
- Cosmetic and Skincare Products
- Bakery and Confectionery
- Pharmaceutical Industry
By Distribution Channel
- Supermarkets/Hypermarkets
- Convenience Stores
- Specialty Stores
- Online Retail
Growth Opportunity
Increasing Demand for Organic and Natural Products
The global Moringa products market is positioned for significant growth, primarily driven by escalating consumer preference for organic and natural products. As awareness of the benefits associated with organic ingredients surges, Moringa, known for its exceptional health benefits, is gaining prominence. This trend is supported by a shift in consumer buying behaviors, with more individuals opting for products that are not only beneficial to health but also environmentally sustainable. The demand for organic Moringa products such as teas, supplements, and powders is expected to rise, as consumers increasingly seek transparency in sourcing and production practices.
Rising Health Consciousness
Parallel to the trend toward natural products, there is an observable rise in health consciousness among consumers globally. This shift is catalyzing the demand for Moringa products known for their nutritional benefits, including anti-inflammatory properties, essential amino acids, and high antioxidant content. As health awareness grows, so does the exploration of superfoods, with Moringa emerging as a front-runner due to its comprehensive health benefits. The market is witnessing an expansion in the application of Moringa in various health and wellness products, which is anticipated to further drive market growth.
Latest Trends
Increasing Use of Moringa in the Pharmaceutical Industry
The Moringa products market is poised for substantial growth, largely driven by its increasing incorporation into the pharmaceutical industry. Moringa, known for its exceptional health benefits, including anti-inflammatory and antioxidant properties, is being extensively utilized in the formulation of new drugs and health supplements. This trend is catalyzed by growing health awareness and the shift towards natural and organic remedies, especially in the context of preventive healthcare. Pharmaceutical companies are capitalizing on this trend by expanding their product lines to include moringa-based capsules, powders, and teas, which are becoming integral to health maintenance regimens worldwide.
Adoption of Moringa in the Agricultural Sector
Parallel to its pharmaceutical uses, moringa is gaining momentum in the agricultural sector. Its application as an organic biofertilizer and biopesticide is enhancing crop yields and providing an eco-friendly alternative to chemical inputs. Moringa's rich nutrient profile supports plant growth and enriches the soil, making it a valuable addition to sustainable farming practices. This adoption is particularly significant in regions facing harsh agricultural conditions, where moringa's resilience to arid climates can be leveraged to improve food security. The trend towards sustainable agriculture is expected to further boost the demand for moringa products, as farmers and agribusinesses seek to reduce environmental impact and enhance crop productivity sustainably.
Regional Analysis
Asia Pacific dominates the global Moringa Products Market with a 35% largest share.
The Moringa Products Market exhibits significant regional diversity in terms of market size, growth drivers, and consumer preferences. In North America, the market is driven by a growing awareness of health and wellness, with the U.S. witnessing an increasing demand for moringa-based dietary supplements and organic health foods. Europe follows a similar pattern, with an emphasis on sustainable and organic farming practices enhancing the growth of the moringa products sector, particularly in countries like Germany and the UK.
Asia Pacific region stands as the dominant region in the global moringa products market, holding approximately 35% of the largest market share. This region benefits from the indigenous presence of moringa plants and their traditional usage in local diets, especially in countries like India and Thailand. The market is supported by both domestic consumption and significant export activities.
In the Middle East & Africa, the market is expanding, driven by the increasing use of moringa in traditional medicines and natural cosmetics, with countries like South Africa leading the regional market development. Latin America, though smaller in comparison, is witnessing growth in the adoption of moringa products, particularly in Brazil, where there is rising awareness about the nutritional benefits of moringa.
Key Regions and Countries
North America
- The US
- Canada
- Rest of North America
Europe
- Germany
- France
- The UK
- Spain
- Netherlands
- Russia
- Italy
- Rest of Europe
Asia-Pacific
- China
- Japan
- Singapore
- Thailand
- South Korea
- Vietnam
- India
- New Zealand
- Rest of Asia Pacific
Latin America
- Mexico
- Brazil
- Rest of Latin America
Middle East & Africa
- Saudi Arabia
- South Africa
- UAE
- Rest of the Middle East & Africa
Key Players Analysis
In the global Moringa Products Market a diverse array of key players is shaping the industry landscape, each contributing unique strategies and innovations. Companies like Himalaya Wellness and Ancient GreenFields Pvt. Ltd. are prominent for their extensive product ranges and robust market presence. They leverage their established brand reputations to expand into new geographical markets and product segments.
Moringa Agro and Aayuritz Phytonutrients Pvt. Ltd is noteworthy for its focus on sustainable and organic farming practices, which resonate well with the growing consumer preference for eco-friendly products. These companies are also pivotal in driving research and development to enhance the efficacy and application range of moringa-based products.
Santan India and Green Virgin Products stand out for their commitment to purity and quality, often marketing their offerings as premium products. This strategy effectively taps into the high-end consumer segment that prioritizes product quality over price.
Kuli Kuli Inc. and Sattva Veda have successfully utilized innovative marketing strategies and strong online presence to boost consumer awareness and engagement, which is crucial in the competitive wellness products market.
Moringa Oleifera GmbH, Organic Veda, Veg India Exports, and Botanica Natural Products are leveraging global networks and partnerships to expand their reach. These companies focus on continuous innovation in product formulation and packaging to enhance consumer appeal and practicality.
Overall, the diversity in strategies and strengths among these companies underscores a dynamic and competitive environment in the Moringa Products Market, with each player contributing to the market growth through distinct pathways.
Market Key Players
- Himalaya Wellness Company
- Ancient GreenFields Pvt. Ltd.
- Moringa Agro
- Aayuritz Phytonutrients Pvt.Ltd
- Santan India
- Green Virgin Products
- Kuli Kuli Inc.
- Sattva Veda
- Moringa Oleifera GmbH
- Organic Veda
- Veg India Exports
- Botanica Natural products
Recent Development
- In June 2024, EarthRoots HealthHub launched a sustainability initiative to promote environmentally friendly farming practices among its moringa suppliers, enhancing biodiversity and reducing chemical use in cultivation.
- In April 2024, Greenleaf Naturals introduced a new line of skincare products infused with moringa oil, aimed at leveraging the antioxidant properties of moringa to cater to the growing market for organic skincare solutions.
- In March 2024, MoringaPowers Inc. announced its expansion into Southeast Asian markets, focusing on increasing the accessibility of its moringa-based health supplements in response to rising demand for natural wellness products in the region.
Report Scope
Report Features Description Market Value (2023) USD 6.2 Billion Forecast Revenue (2033) USD 20.8 Billion CAGR (2024-2032) 13.2% Base Year for Estimation 2023 Historic Period 2016-2023 Forecast Period 2024-2033 Report Coverage Revenue Forecast, Market Dynamics, COVID-19 Impact, Competitive Landscape, Recent Developments Segments Covered By Product (Leaf Powder, Tea, Oil, Seeds), By Application (Food and Beverages, Cosmetic and Skincare Products, Bakery and Confectionery, Pharmaceutical Industry), By Distribution Channel (Supermarkets/Hypermarkets, Convenience Stores, Specialty Stores, Online Retail) Regional Analysis North America - The US, Canada, Rest of North America, Europe - Germany, France, The UK, Spain, Italy, Russia, Netherlands, Rest of Europe, Asia-Pacific - China, Japan, South Korea, India, New Zealand, Singapore, Thailand, Vietnam, Rest of Asia Pacific, Latin America - Brazil, Mexico, Rest of Latin America, Middle East & Africa - South Africa, Saudi Arabia, UAE, Rest of Middle East & Africa Competitive Landscape Himalaya Wellness Company, Ancient GreenFields Pvt. Ltd., Moringa Agro, Aayuritz Phytonutrients Pvt.Ltd, Santan India, Green Virgin Products, Kuli Kuli Inc., Sattva Veda, Moringa Oleifera GmbH, Organic Veda, Veg India Exports, Botanica Natural products Customization Scope Customization for segments, region/country-level will be provided. Moreover, additional customization can be done based on the requirements. Purchase Options We have three licenses to opt for Single User License, Multi-User License (Up to 5 Users), Corporate Use License (Unlimited User and Printable PDF) -
- 1. Executive Summary
- 1.1. Definition
- 1.2. Taxonomy
- 1.3. Research Scope
- 1.4. Key Analysis
- 1.5. Key Findings by Major Segments
- 1.6. Top strategies by Major Players
- 2. Global Moringa Products Market Overview
- 2.1. Moringa Products Market Dynamics
- 2.1.1. Drivers
- 2.1.2. Opportunities
- 2.1.3. Restraints
- 2.1.4. Challenges
- 2.2. Macro-economic Factors
- 2.3. Regulatory Framework
- 2.4. Market Investment Feasibility Index
- 2.5. PEST Analysis
- 2.6. PORTER’S Five Force Analysis
- 2.7. Drivers & Restraints Impact Analysis
- 2.8. Industry Chain Analysis
- 2.9. Cost Structure Analysis
- 2.10. Marketing Strategy
- 2.11. Russia-Ukraine War Impact Analysis
- 2.12. Opportunity Map Analysis
- 2.13. Market Competition Scenario Analysis
- 2.14. Product Life Cycle Analysis
- 2.15. Opportunity Orbits
- 2.16. Manufacturer Intensity Map
- 2.17. Major Companies sales by Value & Volume
- 2.1. Moringa Products Market Dynamics
- 3. Global Moringa Products Market Analysis, Opportunity and Forecast, 2016-2032
- 3.1. Global Moringa Products Market Analysis, 2016-2021
- 3.2. Global Moringa Products Market Opportunity and Forecast, 2023-2032
- 3.3. Global Moringa Products Market Analysis, Opportunity and Forecast, By Product, 2016-2032
- 3.3.1. Global Moringa Products Market Analysis by Product: Introduction
- 3.3.2. Market Size Absolute $ Opportunity Analysis and Forecast, By Product, 2016-2032
- 3.3.3. Leaf Powder
- 3.3.4. Tea
- 3.3.5. Oil
- 3.3.6. Seeds
- 3.4. Global Moringa Products Market Analysis, Opportunity and Forecast, By Application, 2016-2032
- 3.4.1. Global Moringa Products Market Analysis by Application: Introduction
- 3.4.2. Market Size Absolute $ Opportunity Analysis and Forecast, By Application, 2016-2032
- 3.4.3. Food and Beverages
- 3.4.4. Cosmetic and Skincare Products
- 3.4.5. Bakery and Confectionery
- 3.4.6. Pharmaceutical Industry
- 3.5. Global Moringa Products Market Analysis, Opportunity and Forecast, By Distribution Channel, 2016-2032
- 3.5.1. Global Moringa Products Market Analysis by Distribution Channel: Introduction
- 3.5.2. Market Size Absolute $ Opportunity Analysis and Forecast, By Distribution Channel, 2016-2032
- 3.5.3. Supermarkets/Hypermarkets
- 3.5.4. Convenience Stores
- 3.5.5. Specialty Stores
- 3.5.6. Online Retail
- 4. North America Moringa Products Market Analysis, Opportunity and Forecast, 2016-2032
- 4.1. North America Moringa Products Market Analysis, 2016-2021
- 4.2. North America Moringa Products Market Opportunity and Forecast, 2023-2032
- 4.3. North America Moringa Products Market Analysis, Opportunity and Forecast, By Product, 2016-2032
- 4.3.1. North America Moringa Products Market Analysis by Product: Introduction
- 4.3.2. Market Size Absolute $ Opportunity Analysis and Forecast, By Product, 2016-2032
- 4.3.3. Leaf Powder
- 4.3.4. Tea
- 4.3.5. Oil
- 4.3.6. Seeds
- 4.4. North America Moringa Products Market Analysis, Opportunity and Forecast, By Application, 2016-2032
- 4.4.1. North America Moringa Products Market Analysis by Application: Introduction
- 4.4.2. Market Size Absolute $ Opportunity Analysis and Forecast, By Application, 2016-2032
- 4.4.3. Food and Beverages
- 4.4.4. Cosmetic and Skincare Products
- 4.4.5. Bakery and Confectionery
- 4.4.6. Pharmaceutical Industry
- 4.5. North America Moringa Products Market Analysis, Opportunity and Forecast, By Distribution Channel, 2016-2032
- 4.5.1. North America Moringa Products Market Analysis by Distribution Channel: Introduction
- 4.5.2. Market Size Absolute $ Opportunity Analysis and Forecast, By Distribution Channel, 2016-2032
- 4.5.3. Supermarkets/Hypermarkets
- 4.5.4. Convenience Stores
- 4.5.5. Specialty Stores
- 4.5.6. Online Retail
- 4.6. North America Moringa Products Market Analysis, Opportunity and Forecast, By Country , 2016-2032
- 4.6.1. North America Moringa Products Market Analysis by Country : Introduction
- 4.6.2. Market Size Absolute $ Opportunity Analysis and Forecast, Country , 2016-2032
- 4.6.2.1. The US
- 4.6.2.2. Canada
- 4.6.2.3. Mexico
- 5. Western Europe Moringa Products Market Analysis, Opportunity and Forecast, 2016-2032
- 5.1. Western Europe Moringa Products Market Analysis, 2016-2021
- 5.2. Western Europe Moringa Products Market Opportunity and Forecast, 2023-2032
- 5.3. Western Europe Moringa Products Market Analysis, Opportunity and Forecast, By Product, 2016-2032
- 5.3.1. Western Europe Moringa Products Market Analysis by Product: Introduction
- 5.3.2. Market Size Absolute $ Opportunity Analysis and Forecast, By Product, 2016-2032
- 5.3.3. Leaf Powder
- 5.3.4. Tea
- 5.3.5. Oil
- 5.3.6. Seeds
- 5.4. Western Europe Moringa Products Market Analysis, Opportunity and Forecast, By Application, 2016-2032
- 5.4.1. Western Europe Moringa Products Market Analysis by Application: Introduction
- 5.4.2. Market Size Absolute $ Opportunity Analysis and Forecast, By Application, 2016-2032
- 5.4.3. Food and Beverages
- 5.4.4. Cosmetic and Skincare Products
- 5.4.5. Bakery and Confectionery
- 5.4.6. Pharmaceutical Industry
- 5.5. Western Europe Moringa Products Market Analysis, Opportunity and Forecast, By Distribution Channel, 2016-2032
- 5.5.1. Western Europe Moringa Products Market Analysis by Distribution Channel: Introduction
- 5.5.2. Market Size Absolute $ Opportunity Analysis and Forecast, By Distribution Channel, 2016-2032
- 5.5.3. Supermarkets/Hypermarkets
- 5.5.4. Convenience Stores
- 5.5.5. Specialty Stores
- 5.5.6. Online Retail
- 5.6. Western Europe Moringa Products Market Analysis, Opportunity and Forecast, By Country , 2016-2032
- 5.6.1. Western Europe Moringa Products Market Analysis by Country : Introduction
- 5.6.2. Market Size Absolute $ Opportunity Analysis and Forecast, Country , 2016-2032
- 5.6.2.1. Germany
- 5.6.2.2. France
- 5.6.2.3. The UK
- 5.6.2.4. Spain
- 5.6.2.5. Italy
- 5.6.2.6. Portugal
- 5.6.2.7. Ireland
- 5.6.2.8. Austria
- 5.6.2.9. Switzerland
- 5.6.2.10. Benelux
- 5.6.2.11. Nordic
- 5.6.2.12. Rest of Western Europe
- 6. Eastern Europe Moringa Products Market Analysis, Opportunity and Forecast, 2016-2032
- 6.1. Eastern Europe Moringa Products Market Analysis, 2016-2021
- 6.2. Eastern Europe Moringa Products Market Opportunity and Forecast, 2023-2032
- 6.3. Eastern Europe Moringa Products Market Analysis, Opportunity and Forecast, By Product, 2016-2032
- 6.3.1. Eastern Europe Moringa Products Market Analysis by Product: Introduction
- 6.3.2. Market Size Absolute $ Opportunity Analysis and Forecast, By Product, 2016-2032
- 6.3.3. Leaf Powder
- 6.3.4. Tea
- 6.3.5. Oil
- 6.3.6. Seeds
- 6.4. Eastern Europe Moringa Products Market Analysis, Opportunity and Forecast, By Application, 2016-2032
- 6.4.1. Eastern Europe Moringa Products Market Analysis by Application: Introduction
- 6.4.2. Market Size Absolute $ Opportunity Analysis and Forecast, By Application, 2016-2032
- 6.4.3. Food and Beverages
- 6.4.4. Cosmetic and Skincare Products
- 6.4.5. Bakery and Confectionery
- 6.4.6. Pharmaceutical Industry
- 6.5. Eastern Europe Moringa Products Market Analysis, Opportunity and Forecast, By Distribution Channel, 2016-2032
- 6.5.1. Eastern Europe Moringa Products Market Analysis by Distribution Channel: Introduction
- 6.5.2. Market Size Absolute $ Opportunity Analysis and Forecast, By Distribution Channel, 2016-2032
- 6.5.3. Supermarkets/Hypermarkets
- 6.5.4. Convenience Stores
- 6.5.5. Specialty Stores
- 6.5.6. Online Retail
- 6.6. Eastern Europe Moringa Products Market Analysis, Opportunity and Forecast, By Country , 2016-2032
- 6.6.1. Eastern Europe Moringa Products Market Analysis by Country : Introduction
- 6.6.2. Market Size Absolute $ Opportunity Analysis and Forecast, Country , 2016-2032
- 6.6.2.1. Russia
- 6.6.2.2. Poland
- 6.6.2.3. The Czech Republic
- 6.6.2.4. Greece
- 6.6.2.5. Rest of Eastern Europe
- 7. APAC Moringa Products Market Analysis, Opportunity and Forecast, 2016-2032
- 7.1. APAC Moringa Products Market Analysis, 2016-2021
- 7.2. APAC Moringa Products Market Opportunity and Forecast, 2023-2032
- 7.3. APAC Moringa Products Market Analysis, Opportunity and Forecast, By Product, 2016-2032
- 7.3.1. APAC Moringa Products Market Analysis by Product: Introduction
- 7.3.2. Market Size Absolute $ Opportunity Analysis and Forecast, By Product, 2016-2032
- 7.3.3. Leaf Powder
- 7.3.4. Tea
- 7.3.5. Oil
- 7.3.6. Seeds
- 7.4. APAC Moringa Products Market Analysis, Opportunity and Forecast, By Application, 2016-2032
- 7.4.1. APAC Moringa Products Market Analysis by Application: Introduction
- 7.4.2. Market Size Absolute $ Opportunity Analysis and Forecast, By Application, 2016-2032
- 7.4.3. Food and Beverages
- 7.4.4. Cosmetic and Skincare Products
- 7.4.5. Bakery and Confectionery
- 7.4.6. Pharmaceutical Industry
- 7.5. APAC Moringa Products Market Analysis, Opportunity and Forecast, By Distribution Channel, 2016-2032
- 7.5.1. APAC Moringa Products Market Analysis by Distribution Channel: Introduction
- 7.5.2. Market Size Absolute $ Opportunity Analysis and Forecast, By Distribution Channel, 2016-2032
- 7.5.3. Supermarkets/Hypermarkets
- 7.5.4. Convenience Stores
- 7.5.5. Specialty Stores
- 7.5.6. Online Retail
- 7.6. APAC Moringa Products Market Analysis, Opportunity and Forecast, By Country , 2016-2032
- 7.6.1. APAC Moringa Products Market Analysis by Country : Introduction
- 7.6.2. Market Size Absolute $ Opportunity Analysis and Forecast, Country , 2016-2032
- 7.6.2.1. China
- 7.6.2.2. Japan
- 7.6.2.3. South Korea
- 7.6.2.4. India
- 7.6.2.5. Australia & New Zeland
- 7.6.2.6. Indonesia
- 7.6.2.7. Malaysia
- 7.6.2.8. Philippines
- 7.6.2.9. Singapore
- 7.6.2.10. Thailand
- 7.6.2.11. Vietnam
- 7.6.2.12. Rest of APAC
- 8. Latin America Moringa Products Market Analysis, Opportunity and Forecast, 2016-2032
- 8.1. Latin America Moringa Products Market Analysis, 2016-2021
- 8.2. Latin America Moringa Products Market Opportunity and Forecast, 2023-2032
- 8.3. Latin America Moringa Products Market Analysis, Opportunity and Forecast, By Product, 2016-2032
- 8.3.1. Latin America Moringa Products Market Analysis by Product: Introduction
- 8.3.2. Market Size Absolute $ Opportunity Analysis and Forecast, By Product, 2016-2032
- 8.3.3. Leaf Powder
- 8.3.4. Tea
- 8.3.5. Oil
- 8.3.6. Seeds
- 8.4. Latin America Moringa Products Market Analysis, Opportunity and Forecast, By Application, 2016-2032
- 8.4.1. Latin America Moringa Products Market Analysis by Application: Introduction
- 8.4.2. Market Size Absolute $ Opportunity Analysis and Forecast, By Application, 2016-2032
- 8.4.3. Food and Beverages
- 8.4.4. Cosmetic and Skincare Products
- 8.4.5. Bakery and Confectionery
- 8.4.6. Pharmaceutical Industry
- 8.5. Latin America Moringa Products Market Analysis, Opportunity and Forecast, By Distribution Channel, 2016-2032
- 8.5.1. Latin America Moringa Products Market Analysis by Distribution Channel: Introduction
- 8.5.2. Market Size Absolute $ Opportunity Analysis and Forecast, By Distribution Channel, 2016-2032
- 8.5.3. Supermarkets/Hypermarkets
- 8.5.4. Convenience Stores
- 8.5.5. Specialty Stores
- 8.5.6. Online Retail
- 8.6. Latin America Moringa Products Market Analysis, Opportunity and Forecast, By Country , 2016-2032
- 8.6.1. Latin America Moringa Products Market Analysis by Country : Introduction
- 8.6.2. Market Size Absolute $ Opportunity Analysis and Forecast, Country , 2016-2032
- 8.6.2.1. Brazil
- 8.6.2.2. Colombia
- 8.6.2.3. Chile
- 8.6.2.4. Argentina
- 8.6.2.5. Costa Rica
- 8.6.2.6. Rest of Latin America
- 9. Middle East & Africa Moringa Products Market Analysis, Opportunity and Forecast, 2016-2032
- 9.1. Middle East & Africa Moringa Products Market Analysis, 2016-2021
- 9.2. Middle East & Africa Moringa Products Market Opportunity and Forecast, 2023-2032
- 9.3. Middle East & Africa Moringa Products Market Analysis, Opportunity and Forecast, By Product, 2016-2032
- 9.3.1. Middle East & Africa Moringa Products Market Analysis by Product: Introduction
- 9.3.2. Market Size Absolute $ Opportunity Analysis and Forecast, By Product, 2016-2032
- 9.3.3. Leaf Powder
- 9.3.4. Tea
- 9.3.5. Oil
- 9.3.6. Seeds
- 9.4. Middle East & Africa Moringa Products Market Analysis, Opportunity and Forecast, By Application, 2016-2032
- 9.4.1. Middle East & Africa Moringa Products Market Analysis by Application: Introduction
- 9.4.2. Market Size Absolute $ Opportunity Analysis and Forecast, By Application, 2016-2032
- 9.4.3. Food and Beverages
- 9.4.4. Cosmetic and Skincare Products
- 9.4.5. Bakery and Confectionery
- 9.4.6. Pharmaceutical Industry
- 9.5. Middle East & Africa Moringa Products Market Analysis, Opportunity and Forecast, By Distribution Channel, 2016-2032
- 9.5.1. Middle East & Africa Moringa Products Market Analysis by Distribution Channel: Introduction
- 9.5.2. Market Size Absolute $ Opportunity Analysis and Forecast, By Distribution Channel, 2016-2032
- 9.5.3. Supermarkets/Hypermarkets
- 9.5.4. Convenience Stores
- 9.5.5. Specialty Stores
- 9.5.6. Online Retail
- 9.6. Middle East & Africa Moringa Products Market Analysis, Opportunity and Forecast, By Country , 2016-2032
- 9.6.1. Middle East & Africa Moringa Products Market Analysis by Country : Introduction
- 9.6.2. Market Size Absolute $ Opportunity Analysis and Forecast, Country , 2016-2032
- 9.6.2.1. Algeria
- 9.6.2.2. Egypt
- 9.6.2.3. Israel
- 9.6.2.4. Kuwait
- 9.6.2.5. Nigeria
- 9.6.2.6. Saudi Arabia
- 9.6.2.7. South Africa
- 9.6.2.8. Turkey
- 9.6.2.9. The UAE
- 9.6.2.10. Rest of MEA
- 10. Global Moringa Products Market Analysis, Opportunity and Forecast, By Region , 2016-2032
- 10.1. Global Moringa Products Market Analysis by Region : Introduction
- 10.2. Market Size Absolute $ Opportunity Analysis and Forecast, By Region , 2016-2032
- 10.2.1. North America
- 10.2.2. Western Europe
- 10.2.3. Eastern Europe
- 10.2.4. APAC
- 10.2.5. Latin America
- 10.2.6. Middle East & Africa
- 11. Global Moringa Products Market Competitive Landscape, Market Share Analysis, and Company Profiles
- 11.1. Market Share Analysis
- 11.2. Company Profiles
- 11.3. Himalaya Wellness Company
- 11.3.1. Company Overview
- 11.3.2. Financial Highlights
- 11.3.3. Product Portfolio
- 11.3.4. SWOT Analysis
- 11.3.5. Key Strategies and Developments
- 11.4. Ancient GreenFields Pvt. Ltd.
- 11.4.1. Company Overview
- 11.4.2. Financial Highlights
- 11.4.3. Product Portfolio
- 11.4.4. SWOT Analysis
- 11.4.5. Key Strategies and Developments
- 11.5. Moringa Agro
- 11.5.1. Company Overview
- 11.5.2. Financial Highlights
- 11.5.3. Product Portfolio
- 11.5.4. SWOT Analysis
- 11.5.5. Key Strategies and Developments
- 11.6. Aayuritz Phytonutrients Pvt.Ltd
- 11.6.1. Company Overview
- 11.6.2. Financial Highlights
- 11.6.3. Product Portfolio
- 11.6.4. SWOT Analysis
- 11.6.5. Key Strategies and Developments
- 11.7. Santan India
- 11.7.1. Company Overview
- 11.7.2. Financial Highlights
- 11.7.3. Product Portfolio
- 11.7.4. SWOT Analysis
- 11.7.5. Key Strategies and Developments
- 11.8. Green Virgin Products
- 11.8.1. Company Overview
- 11.8.2. Financial Highlights
- 11.8.3. Product Portfolio
- 11.8.4. SWOT Analysis
- 11.8.5. Key Strategies and Developments
- 11.9. Kuli Kuli Inc.
- 11.9.1. Company Overview
- 11.9.2. Financial Highlights
- 11.9.3. Product Portfolio
- 11.9.4. SWOT Analysis
- 11.9.5. Key Strategies and Developments
- 11.10. Sattva Veda
- 11.10.1. Company Overview
- 11.10.2. Financial Highlights
- 11.10.3. Product Portfolio
- 11.10.4. SWOT Analysis
- 11.10.5. Key Strategies and Developments
- 11.11. Moringa Oleifera GmbH
- 11.11.1. Company Overview
- 11.11.2. Financial Highlights
- 11.11.3. Product Portfolio
- 11.11.4. SWOT Analysis
- 11.11.5. Key Strategies and Developments
- 11.12. Organic Veda
- 11.12.1. Company Overview
- 11.12.2. Financial Highlights
- 11.12.3. Product Portfolio
- 11.12.4. SWOT Analysis
- 11.12.5. Key Strategies and Developments
- 11.13.1. Company Overview
- 11.13.2. Financial Highlights
- 11.13.3. Product Portfolio
- 11.13.4. SWOT Analysis
- 11.13.5. Key Strategies and Developments
- 11.14. Veg India Exports
- 11.14.1. Company Overview
- 11.14.2. Financial Highlights
- 11.14.3. Product Portfolio
- 11.14.4. SWOT Analysis
- 11.14.5. Key Strategies and Developments
- 12. Assumptions and Acronyms
- 13. Research Methodology
- 14. Contact
"
- List of Figures
- "
- Figure 1: Global Moringa Products Market Revenue (US$ Mn) Market Share by Product in 2022
- Figure 2: Global Moringa Products Market Market Attractiveness Analysis by Product, 2016-2032
- Figure 3: Global Moringa Products Market Revenue (US$ Mn) Market Share by Applicationin 2022
- Figure 4: Global Moringa Products Market Market Attractiveness Analysis by Application, 2016-2032
- Figure 5: Global Moringa Products Market Revenue (US$ Mn) Market Share by Distribution Channelin 2022
- Figure 6: Global Moringa Products Market Market Attractiveness Analysis by Distribution Channel, 2016-2032
- Figure 7: Global Moringa Products Market Revenue (US$ Mn) Market Share by Region in 2022
- Figure 8: Global Moringa Products Market Market Attractiveness Analysis by Region, 2016-2032
- Figure 9: Global Moringa Products Market Market Revenue (US$ Mn) (2016-2032)
- Figure 10: Global Moringa Products Market Market Revenue (US$ Mn) Comparison by Region (2016-2032)
- Figure 11: Global Moringa Products Market Market Revenue (US$ Mn) Comparison by Product (2016-2032)
- Figure 12: Global Moringa Products Market Market Revenue (US$ Mn) Comparison by Application (2016-2032)
- Figure 13: Global Moringa Products Market Market Revenue (US$ Mn) Comparison by Distribution Channel (2016-2032)
- Figure 14: Global Moringa Products Market Market Y-o-Y Growth Rate Comparison by Region (2016-2032)
- Figure 15: Global Moringa Products Market Market Y-o-Y Growth Rate Comparison by Product (2016-2032)
- Figure 16: Global Moringa Products Market Market Y-o-Y Growth Rate Comparison by Application (2016-2032)
- Figure 17: Global Moringa Products Market Market Y-o-Y Growth Rate Comparison by Distribution Channel (2016-2032)
- Figure 18: Global Moringa Products Market Market Share Comparison by Region (2016-2032)
- Figure 19: Global Moringa Products Market Market Share Comparison by Product (2016-2032)
- Figure 20: Global Moringa Products Market Market Share Comparison by Application (2016-2032)
- Figure 21: Global Moringa Products Market Market Share Comparison by Distribution Channel (2016-2032)
- Figure 22: North America Moringa Products Market Revenue (US$ Mn) Market Share by Productin 2022
- Figure 23: North America Moringa Products Market Market Attractiveness Analysis by Product, 2016-2032
- Figure 24: North America Moringa Products Market Revenue (US$ Mn) Market Share by Applicationin 2022
- Figure 25: North America Moringa Products Market Market Attractiveness Analysis by Application, 2016-2032
- Figure 26: North America Moringa Products Market Revenue (US$ Mn) Market Share by Distribution Channelin 2022
- Figure 27: North America Moringa Products Market Market Attractiveness Analysis by Distribution Channel, 2016-2032
- Figure 28: North America Moringa Products Market Revenue (US$ Mn) Market Share by Country in 2022
- Figure 29: North America Moringa Products Market Market Attractiveness Analysis by Country, 2016-2032
- Figure 30: North America Moringa Products Market Market Revenue (US$ Mn) (2016-2032)
- Figure 31: North America Moringa Products Market Market Revenue (US$ Mn) Comparison by Country (2016-2032)
- Figure 32: North America Moringa Products Market Market Revenue (US$ Mn) Comparison by Product (2016-2032)
- Figure 33: North America Moringa Products Market Market Revenue (US$ Mn) Comparison by Application (2016-2032)
- Figure 34: North America Moringa Products Market Market Revenue (US$ Mn) Comparison by Distribution Channel (2016-2032)
- Figure 35: North America Moringa Products Market Market Y-o-Y Growth Rate Comparison by Country (2016-2032)
- Figure 36: North America Moringa Products Market Market Y-o-Y Growth Rate Comparison by Product (2016-2032)
- Figure 37: North America Moringa Products Market Market Y-o-Y Growth Rate Comparison by Application (2016-2032)
- Figure 38: North America Moringa Products Market Market Y-o-Y Growth Rate Comparison by Distribution Channel (2016-2032)
- Figure 39: North America Moringa Products Market Market Share Comparison by Country (2016-2032)
- Figure 40: North America Moringa Products Market Market Share Comparison by Product (2016-2032)
- Figure 41: North America Moringa Products Market Market Share Comparison by Application (2016-2032)
- Figure 42: North America Moringa Products Market Market Share Comparison by Distribution Channel (2016-2032)
- Figure 43: Western Europe Moringa Products Market Revenue (US$ Mn) Market Share by Productin 2022
- Figure 44: Western Europe Moringa Products Market Market Attractiveness Analysis by Product, 2016-2032
- Figure 45: Western Europe Moringa Products Market Revenue (US$ Mn) Market Share by Applicationin 2022
- Figure 46: Western Europe Moringa Products Market Market Attractiveness Analysis by Application, 2016-2032
- Figure 47: Western Europe Moringa Products Market Revenue (US$ Mn) Market Share by Distribution Channelin 2022
- Figure 48: Western Europe Moringa Products Market Market Attractiveness Analysis by Distribution Channel, 2016-2032
- Figure 49: Western Europe Moringa Products Market Revenue (US$ Mn) Market Share by Country in 2022
- Figure 50: Western Europe Moringa Products Market Market Attractiveness Analysis by Country, 2016-2032
- Figure 51: Western Europe Moringa Products Market Market Revenue (US$ Mn) (2016-2032)
- Figure 52: Western Europe Moringa Products Market Market Revenue (US$ Mn) Comparison by Country (2016-2032)
- Figure 53: Western Europe Moringa Products Market Market Revenue (US$ Mn) Comparison by Product (2016-2032)
- Figure 54: Western Europe Moringa Products Market Market Revenue (US$ Mn) Comparison by Application (2016-2032)
- Figure 55: Western Europe Moringa Products Market Market Revenue (US$ Mn) Comparison by Distribution Channel (2016-2032)
- Figure 56: Western Europe Moringa Products Market Market Y-o-Y Growth Rate Comparison by Country (2016-2032)
- Figure 57: Western Europe Moringa Products Market Market Y-o-Y Growth Rate Comparison by Product (2016-2032)
- Figure 58: Western Europe Moringa Products Market Market Y-o-Y Growth Rate Comparison by Application (2016-2032)
- Figure 59: Western Europe Moringa Products Market Market Y-o-Y Growth Rate Comparison by Distribution Channel (2016-2032)
- Figure 60: Western Europe Moringa Products Market Market Share Comparison by Country (2016-2032)
- Figure 61: Western Europe Moringa Products Market Market Share Comparison by Product (2016-2032)
- Figure 62: Western Europe Moringa Products Market Market Share Comparison by Application (2016-2032)
- Figure 63: Western Europe Moringa Products Market Market Share Comparison by Distribution Channel (2016-2032)
- Figure 64: Eastern Europe Moringa Products Market Revenue (US$ Mn) Market Share by Productin 2022
- Figure 65: Eastern Europe Moringa Products Market Market Attractiveness Analysis by Product, 2016-2032
- Figure 66: Eastern Europe Moringa Products Market Revenue (US$ Mn) Market Share by Applicationin 2022
- Figure 67: Eastern Europe Moringa Products Market Market Attractiveness Analysis by Application, 2016-2032
- Figure 68: Eastern Europe Moringa Products Market Revenue (US$ Mn) Market Share by Distribution Channelin 2022
- Figure 69: Eastern Europe Moringa Products Market Market Attractiveness Analysis by Distribution Channel, 2016-2032
- Figure 70: Eastern Europe Moringa Products Market Revenue (US$ Mn) Market Share by Country in 2022
- Figure 71: Eastern Europe Moringa Products Market Market Attractiveness Analysis by Country, 2016-2032
- Figure 72: Eastern Europe Moringa Products Market Market Revenue (US$ Mn) (2016-2032)
- Figure 73: Eastern Europe Moringa Products Market Market Revenue (US$ Mn) Comparison by Country (2016-2032)
- Figure 74: Eastern Europe Moringa Products Market Market Revenue (US$ Mn) Comparison by Product (2016-2032)
- Figure 75: Eastern Europe Moringa Products Market Market Revenue (US$ Mn) Comparison by Application (2016-2032)
- Figure 76: Eastern Europe Moringa Products Market Market Revenue (US$ Mn) Comparison by Distribution Channel (2016-2032)
- Figure 77: Eastern Europe Moringa Products Market Market Y-o-Y Growth Rate Comparison by Country (2016-2032)
- Figure 78: Eastern Europe Moringa Products Market Market Y-o-Y Growth Rate Comparison by Product (2016-2032)
- Figure 79: Eastern Europe Moringa Products Market Market Y-o-Y Growth Rate Comparison by Application (2016-2032)
- Figure 80: Eastern Europe Moringa Products Market Market Y-o-Y Growth Rate Comparison by Distribution Channel (2016-2032)
- Figure 81: Eastern Europe Moringa Products Market Market Share Comparison by Country (2016-2032)
- Figure 82: Eastern Europe Moringa Products Market Market Share Comparison by Product (2016-2032)
- Figure 83: Eastern Europe Moringa Products Market Market Share Comparison by Application (2016-2032)
- Figure 84: Eastern Europe Moringa Products Market Market Share Comparison by Distribution Channel (2016-2032)
- Figure 85: APAC Moringa Products Market Revenue (US$ Mn) Market Share by Productin 2022
- Figure 86: APAC Moringa Products Market Market Attractiveness Analysis by Product, 2016-2032
- Figure 87: APAC Moringa Products Market Revenue (US$ Mn) Market Share by Applicationin 2022
- Figure 88: APAC Moringa Products Market Market Attractiveness Analysis by Application, 2016-2032
- Figure 89: APAC Moringa Products Market Revenue (US$ Mn) Market Share by Distribution Channelin 2022
- Figure 90: APAC Moringa Products Market Market Attractiveness Analysis by Distribution Channel, 2016-2032
- Figure 91: APAC Moringa Products Market Revenue (US$ Mn) Market Share by Country in 2022
- Figure 92: APAC Moringa Products Market Market Attractiveness Analysis by Country, 2016-2032
- Figure 93: APAC Moringa Products Market Market Revenue (US$ Mn) (2016-2032)
- Figure 94: APAC Moringa Products Market Market Revenue (US$ Mn) Comparison by Country (2016-2032)
- Figure 95: APAC Moringa Products Market Market Revenue (US$ Mn) Comparison by Product (2016-2032)
- Figure 96: APAC Moringa Products Market Market Revenue (US$ Mn) Comparison by Application (2016-2032)
- Figure 97: APAC Moringa Products Market Market Revenue (US$ Mn) Comparison by Distribution Channel (2016-2032)
- Figure 98: APAC Moringa Products Market Market Y-o-Y Growth Rate Comparison by Country (2016-2032)
- Figure 99: APAC Moringa Products Market Market Y-o-Y Growth Rate Comparison by Product (2016-2032)
- Figure 100: APAC Moringa Products Market Market Y-o-Y Growth Rate Comparison by Application (2016-2032)
- Figure 101: APAC Moringa Products Market Market Y-o-Y Growth Rate Comparison by Distribution Channel (2016-2032)
- Figure 102: APAC Moringa Products Market Market Share Comparison by Country (2016-2032)
- Figure 103: APAC Moringa Products Market Market Share Comparison by Product (2016-2032)
- Figure 104: APAC Moringa Products Market Market Share Comparison by Application (2016-2032)
- Figure 105: APAC Moringa Products Market Market Share Comparison by Distribution Channel (2016-2032)
- Figure 106: Latin America Moringa Products Market Revenue (US$ Mn) Market Share by Productin 2022
- Figure 107: Latin America Moringa Products Market Market Attractiveness Analysis by Product, 2016-2032
- Figure 108: Latin America Moringa Products Market Revenue (US$ Mn) Market Share by Applicationin 2022
- Figure 109: Latin America Moringa Products Market Market Attractiveness Analysis by Application, 2016-2032
- Figure 110: Latin America Moringa Products Market Revenue (US$ Mn) Market Share by Distribution Channelin 2022
- Figure 111: Latin America Moringa Products Market Market Attractiveness Analysis by Distribution Channel, 2016-2032
- Figure 112: Latin America Moringa Products Market Revenue (US$ Mn) Market Share by Country in 2022
- Figure 113: Latin America Moringa Products Market Market Attractiveness Analysis by Country, 2016-2032
- Figure 114: Latin America Moringa Products Market Market Revenue (US$ Mn) (2016-2032)
- Figure 115: Latin America Moringa Products Market Market Revenue (US$ Mn) Comparison by Country (2016-2032)
- Figure 116: Latin America Moringa Products Market Market Revenue (US$ Mn) Comparison by Product (2016-2032)
- Figure 117: Latin America Moringa Products Market Market Revenue (US$ Mn) Comparison by Application (2016-2032)
- Figure 118: Latin America Moringa Products Market Market Revenue (US$ Mn) Comparison by Distribution Channel (2016-2032)
- Figure 119: Latin America Moringa Products Market Market Y-o-Y Growth Rate Comparison by Country (2016-2032)
- Figure 120: Latin America Moringa Products Market Market Y-o-Y Growth Rate Comparison by Product (2016-2032)
- Figure 121: Latin America Moringa Products Market Market Y-o-Y Growth Rate Comparison by Application (2016-2032)
- Figure 122: Latin America Moringa Products Market Market Y-o-Y Growth Rate Comparison by Distribution Channel (2016-2032)
- Figure 123: Latin America Moringa Products Market Market Share Comparison by Country (2016-2032)
- Figure 124: Latin America Moringa Products Market Market Share Comparison by Product (2016-2032)
- Figure 125: Latin America Moringa Products Market Market Share Comparison by Application (2016-2032)
- Figure 126: Latin America Moringa Products Market Market Share Comparison by Distribution Channel (2016-2032)
- Figure 127: Middle East & Africa Moringa Products Market Revenue (US$ Mn) Market Share by Productin 2022
- Figure 128: Middle East & Africa Moringa Products Market Market Attractiveness Analysis by Product, 2016-2032
- Figure 129: Middle East & Africa Moringa Products Market Revenue (US$ Mn) Market Share by Applicationin 2022
- Figure 130: Middle East & Africa Moringa Products Market Market Attractiveness Analysis by Application, 2016-2032
- Figure 131: Middle East & Africa Moringa Products Market Revenue (US$ Mn) Market Share by Distribution Channelin 2022
- Figure 132: Middle East & Africa Moringa Products Market Market Attractiveness Analysis by Distribution Channel, 2016-2032
- Figure 133: Middle East & Africa Moringa Products Market Revenue (US$ Mn) Market Share by Country in 2022
- Figure 134: Middle East & Africa Moringa Products Market Market Attractiveness Analysis by Country, 2016-2032
- Figure 135: Middle East & Africa Moringa Products Market Market Revenue (US$ Mn) (2016-2032)
- Figure 136: Middle East & Africa Moringa Products Market Market Revenue (US$ Mn) Comparison by Country (2016-2032)
- Figure 137: Middle East & Africa Moringa Products Market Market Revenue (US$ Mn) Comparison by Product (2016-2032)
- Figure 138: Middle East & Africa Moringa Products Market Market Revenue (US$ Mn) Comparison by Application (2016-2032)
- Figure 139: Middle East & Africa Moringa Products Market Market Revenue (US$ Mn) Comparison by Distribution Channel (2016-2032)
- Figure 140: Middle East & Africa Moringa Products Market Market Y-o-Y Growth Rate Comparison by Country (2016-2032)
- Figure 141: Middle East & Africa Moringa Products Market Market Y-o-Y Growth Rate Comparison by Product (2016-2032)
- Figure 142: Middle East & Africa Moringa Products Market Market Y-o-Y Growth Rate Comparison by Application (2016-2032)
- Figure 143: Middle East & Africa Moringa Products Market Market Y-o-Y Growth Rate Comparison by Distribution Channel (2016-2032)
- Figure 144: Middle East & Africa Moringa Products Market Market Share Comparison by Country (2016-2032)
- Figure 145: Middle East & Africa Moringa Products Market Market Share Comparison by Product (2016-2032)
- Figure 146: Middle East & Africa Moringa Products Market Market Share Comparison by Application (2016-2032)
- Figure 147: Middle East & Africa Moringa Products Market Market Share Comparison by Distribution Channel (2016-2032)
"
- List of Tables
- "
- Table 1: Global Moringa Products Market Market Comparison by Product (2016-2032)
- Table 2: Global Moringa Products Market Market Comparison by Application (2016-2032)
- Table 3: Global Moringa Products Market Market Comparison by Distribution Channel (2016-2032)
- Table 4: Global Moringa Products Market Revenue (US$ Mn) Comparison by Region (2016-2032)
- Table 5: Global Moringa Products Market Market Revenue (US$ Mn) (2016-2032)
- Table 6: Global Moringa Products Market Market Revenue (US$ Mn) Comparison by Region (2016-2032)
- Table 7: Global Moringa Products Market Market Revenue (US$ Mn) Comparison by Product (2016-2032)
- Table 8: Global Moringa Products Market Market Revenue (US$ Mn) Comparison by Application (2016-2032)
- Table 9: Global Moringa Products Market Market Revenue (US$ Mn) Comparison by Distribution Channel (2016-2032)
- Table 10: Global Moringa Products Market Market Y-o-Y Growth Rate Comparison by Region (2016-2032)
- Table 11: Global Moringa Products Market Market Y-o-Y Growth Rate Comparison by Product (2016-2032)
- Table 12: Global Moringa Products Market Market Y-o-Y Growth Rate Comparison by Application (2016-2032)
- Table 13: Global Moringa Products Market Market Y-o-Y Growth Rate Comparison by Distribution Channel (2016-2032)
- Table 14: Global Moringa Products Market Market Share Comparison by Region (2016-2032)
- Table 15: Global Moringa Products Market Market Share Comparison by Product (2016-2032)
- Table 16: Global Moringa Products Market Market Share Comparison by Application (2016-2032)
- Table 17: Global Moringa Products Market Market Share Comparison by Distribution Channel (2016-2032)
- Table 18: North America Moringa Products Market Market Comparison by Application (2016-2032)
- Table 19: North America Moringa Products Market Market Comparison by Distribution Channel (2016-2032)
- Table 20: North America Moringa Products Market Revenue (US$ Mn) Comparison by Country (2016-2032)
- Table 21: North America Moringa Products Market Market Revenue (US$ Mn) (2016-2032)
- Table 22: North America Moringa Products Market Market Revenue (US$ Mn) Comparison by Country (2016-2032)
- Table 23: North America Moringa Products Market Market Revenue (US$ Mn) Comparison by Product (2016-2032)
- Table 24: North America Moringa Products Market Market Revenue (US$ Mn) Comparison by Application (2016-2032)
- Table 25: North America Moringa Products Market Market Revenue (US$ Mn) Comparison by Distribution Channel (2016-2032)
- Table 26: North America Moringa Products Market Market Y-o-Y Growth Rate Comparison by Country (2016-2032)
- Table 27: North America Moringa Products Market Market Y-o-Y Growth Rate Comparison by Product (2016-2032)
- Table 28: North America Moringa Products Market Market Y-o-Y Growth Rate Comparison by Application (2016-2032)
- Table 29: North America Moringa Products Market Market Y-o-Y Growth Rate Comparison by Distribution Channel (2016-2032)
- Table 30: North America Moringa Products Market Market Share Comparison by Country (2016-2032)
- Table 31: North America Moringa Products Market Market Share Comparison by Product (2016-2032)
- Table 32: North America Moringa Products Market Market Share Comparison by Application (2016-2032)
- Table 33: North America Moringa Products Market Market Share Comparison by Distribution Channel (2016-2032)
- Table 34: Western Europe Moringa Products Market Market Comparison by Product (2016-2032)
- Table 35: Western Europe Moringa Products Market Market Comparison by Application (2016-2032)
- Table 36: Western Europe Moringa Products Market Market Comparison by Distribution Channel (2016-2032)
- Table 37: Western Europe Moringa Products Market Revenue (US$ Mn) Comparison by Country (2016-2032)
- Table 38: Western Europe Moringa Products Market Market Revenue (US$ Mn) (2016-2032)
- Table 39: Western Europe Moringa Products Market Market Revenue (US$ Mn) Comparison by Country (2016-2032)
- Table 40: Western Europe Moringa Products Market Market Revenue (US$ Mn) Comparison by Product (2016-2032)
- Table 41: Western Europe Moringa Products Market Market Revenue (US$ Mn) Comparison by Application (2016-2032)
- Table 42: Western Europe Moringa Products Market Market Revenue (US$ Mn) Comparison by Distribution Channel (2016-2032)
- Table 43: Western Europe Moringa Products Market Market Y-o-Y Growth Rate Comparison by Country (2016-2032)
- Table 44: Western Europe Moringa Products Market Market Y-o-Y Growth Rate Comparison by Product (2016-2032)
- Table 45: Western Europe Moringa Products Market Market Y-o-Y Growth Rate Comparison by Application (2016-2032)
- Table 46: Western Europe Moringa Products Market Market Y-o-Y Growth Rate Comparison by Distribution Channel (2016-2032)
- Table 47: Western Europe Moringa Products Market Market Share Comparison by Country (2016-2032)
- Table 48: Western Europe Moringa Products Market Market Share Comparison by Product (2016-2032)
- Table 49: Western Europe Moringa Products Market Market Share Comparison by Application (2016-2032)
- Table 50: Western Europe Moringa Products Market Market Share Comparison by Distribution Channel (2016-2032)
- Table 51: Eastern Europe Moringa Products Market Market Comparison by Product (2016-2032)
- Table 52: Eastern Europe Moringa Products Market Market Comparison by Application (2016-2032)
- Table 53: Eastern Europe Moringa Products Market Market Comparison by Distribution Channel (2016-2032)
- Table 54: Eastern Europe Moringa Products Market Revenue (US$ Mn) Comparison by Country (2016-2032)
- Table 55: Eastern Europe Moringa Products Market Market Revenue (US$ Mn) (2016-2032)
- Table 56: Eastern Europe Moringa Products Market Market Revenue (US$ Mn) Comparison by Country (2016-2032)
- Table 57: Eastern Europe Moringa Products Market Market Revenue (US$ Mn) Comparison by Product (2016-2032)
- Table 58: Eastern Europe Moringa Products Market Market Revenue (US$ Mn) Comparison by Application (2016-2032)
- Table 59: Eastern Europe Moringa Products Market Market Revenue (US$ Mn) Comparison by Distribution Channel (2016-2032)
- Table 60: Eastern Europe Moringa Products Market Market Y-o-Y Growth Rate Comparison by Country (2016-2032)
- Table 61: Eastern Europe Moringa Products Market Market Y-o-Y Growth Rate Comparison by Product (2016-2032)
- Table 62: Eastern Europe Moringa Products Market Market Y-o-Y Growth Rate Comparison by Application (2016-2032)
- Table 63: Eastern Europe Moringa Products Market Market Y-o-Y Growth Rate Comparison by Distribution Channel (2016-2032)
- Table 64: Eastern Europe Moringa Products Market Market Share Comparison by Country (2016-2032)
- Table 65: Eastern Europe Moringa Products Market Market Share Comparison by Product (2016-2032)
- Table 66: Eastern Europe Moringa Products Market Market Share Comparison by Application (2016-2032)
- Table 67: Eastern Europe Moringa Products Market Market Share Comparison by Distribution Channel (2016-2032)
- Table 68: APAC Moringa Products Market Market Comparison by Product (2016-2032)
- Table 69: APAC Moringa Products Market Market Comparison by Application (2016-2032)
- Table 70: APAC Moringa Products Market Market Comparison by Distribution Channel (2016-2032)
- Table 71: APAC Moringa Products Market Revenue (US$ Mn) Comparison by Country (2016-2032)
- Table 72: APAC Moringa Products Market Market Revenue (US$ Mn) (2016-2032)
- Table 73: APAC Moringa Products Market Market Revenue (US$ Mn) Comparison by Country (2016-2032)
- Table 74: APAC Moringa Products Market Market Revenue (US$ Mn) Comparison by Product (2016-2032)
- Table 75: APAC Moringa Products Market Market Revenue (US$ Mn) Comparison by Application (2016-2032)
- Table 76: APAC Moringa Products Market Market Revenue (US$ Mn) Comparison by Distribution Channel (2016-2032)
- Table 77: APAC Moringa Products Market Market Y-o-Y Growth Rate Comparison by Country (2016-2032)
- Table 78: APAC Moringa Products Market Market Y-o-Y Growth Rate Comparison by Product (2016-2032)
- Table 79: APAC Moringa Products Market Market Y-o-Y Growth Rate Comparison by Application (2016-2032)
- Table 80: APAC Moringa Products Market Market Y-o-Y Growth Rate Comparison by Distribution Channel (2016-2032)
- Table 81: APAC Moringa Products Market Market Share Comparison by Country (2016-2032)
- Table 82: APAC Moringa Products Market Market Share Comparison by Product (2016-2032)
- Table 83: APAC Moringa Products Market Market Share Comparison by Application (2016-2032)
- Table 84: APAC Moringa Products Market Market Share Comparison by Distribution Channel (2016-2032)
- Table 85: Latin America Moringa Products Market Market Comparison by Product (2016-2032)
- Table 86: Latin America Moringa Products Market Market Comparison by Application (2016-2032)
- Table 87: Latin America Moringa Products Market Market Comparison by Distribution Channel (2016-2032)
- Table 88: Latin America Moringa Products Market Revenue (US$ Mn) Comparison by Country (2016-2032)
- Table 89: Latin America Moringa Products Market Market Revenue (US$ Mn) (2016-2032)
- Table 90: Latin America Moringa Products Market Market Revenue (US$ Mn) Comparison by Country (2016-2032)
- Table 91: Latin America Moringa Products Market Market Revenue (US$ Mn) Comparison by Product (2016-2032)
- Table 92: Latin America Moringa Products Market Market Revenue (US$ Mn) Comparison by Application (2016-2032)
- Table 93: Latin America Moringa Products Market Market Revenue (US$ Mn) Comparison by Distribution Channel (2016-2032)
- Table 94: Latin America Moringa Products Market Market Y-o-Y Growth Rate Comparison by Country (2016-2032)
- Table 95: Latin America Moringa Products Market Market Y-o-Y Growth Rate Comparison by Product (2016-2032)
- Table 96: Latin America Moringa Products Market Market Y-o-Y Growth Rate Comparison by Application (2016-2032)
- Table 97: Latin America Moringa Products Market Market Y-o-Y Growth Rate Comparison by Distribution Channel (2016-2032)
- Table 98: Latin America Moringa Products Market Market Share Comparison by Country (2016-2032)
- Table 99: Latin America Moringa Products Market Market Share Comparison by Product (2016-2032)
- Table 100: Latin America Moringa Products Market Market Share Comparison by Application (2016-2032)
- Table 101: Latin America Moringa Products Market Market Share Comparison by Distribution Channel (2016-2032)
- Table 102: Middle East & Africa Moringa Products Market Market Comparison by Product (2016-2032)
- Table 103: Middle East & Africa Moringa Products Market Market Comparison by Application (2016-2032)
- Table 104: Middle East & Africa Moringa Products Market Market Comparison by Distribution Channel (2016-2032)
- Table 105: Middle East & Africa Moringa Products Market Revenue (US$ Mn) Comparison by Country (2016-2032)
- Table 106: Middle East & Africa Moringa Products Market Market Revenue (US$ Mn) (2016-2032)
- Table 107: Middle East & Africa Moringa Products Market Market Revenue (US$ Mn) Comparison by Country (2016-2032)
- Table 108: Middle East & Africa Moringa Products Market Market Revenue (US$ Mn) Comparison by Product (2016-2032)
- Table 109: Middle East & Africa Moringa Products Market Market Revenue (US$ Mn) Comparison by Application (2016-2032)
- Table 110: Middle East & Africa Moringa Products Market Market Revenue (US$ Mn) Comparison by Distribution Channel (2016-2032)
- Table 111: Middle East & Africa Moringa Products Market Market Y-o-Y Growth Rate Comparison by Country (2016-2032)
- Table 112: Middle East & Africa Moringa Products Market Market Y-o-Y Growth Rate Comparison by Product (2016-2032)
- Table 113: Middle East & Africa Moringa Products Market Market Y-o-Y Growth Rate Comparison by Application (2016-2032)
- Table 114: Middle East & Africa Moringa Products Market Market Y-o-Y Growth Rate Comparison by Distribution Channel (2016-2032)
- Table 115: Middle East & Africa Moringa Products Market Market Share Comparison by Country (2016-2032)
- Table 116: Middle East & Africa Moringa Products Market Market Share Comparison by Product (2016-2032)
- Table 117: Middle East & Africa Moringa Products Market Market Share Comparison by Application (2016-2032)
- Table 118: Middle East & Africa Moringa Products Market Market Share Comparison by Distribution Channel (2016-2032)
- 1. Executive Summary
-
- Himalaya Wellness Company
- Ancient GreenFields Pvt. Ltd.
- Moringa Agro
- Aayuritz Phytonutrients Pvt.Ltd
- Santan India
- Green Virgin Products
- Kuli Kuli Inc.
- Sattva Veda
- Moringa Oleifera GmbH
- Organic Veda
- Veg India Exports
- Botanica Natural products
Our Clients


View Our Licence Options
