
Mobile Medical Apps Market By Therapeutic Area (Cardiovascular, Diabetes, Other), By Model (Subscription-Based, Free), By Application (Diagnostics, Remote Monitoring & Consultation, and Other), By End User (Healthcare Providers, Healthcare Payers), By Region And Companies - Industry Segment Outlook, Market Assessment, Competition Scenario, Trends, And Forecast 2023-2032
39620
July 2023
173
Report Overview
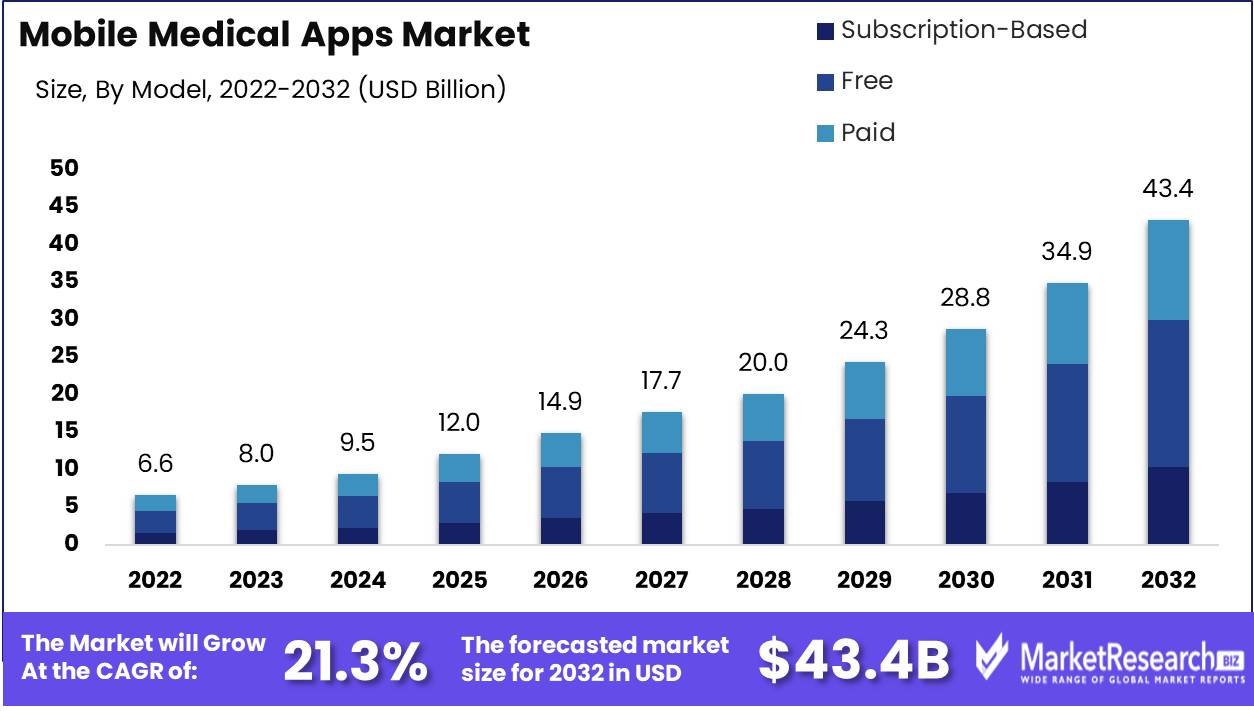
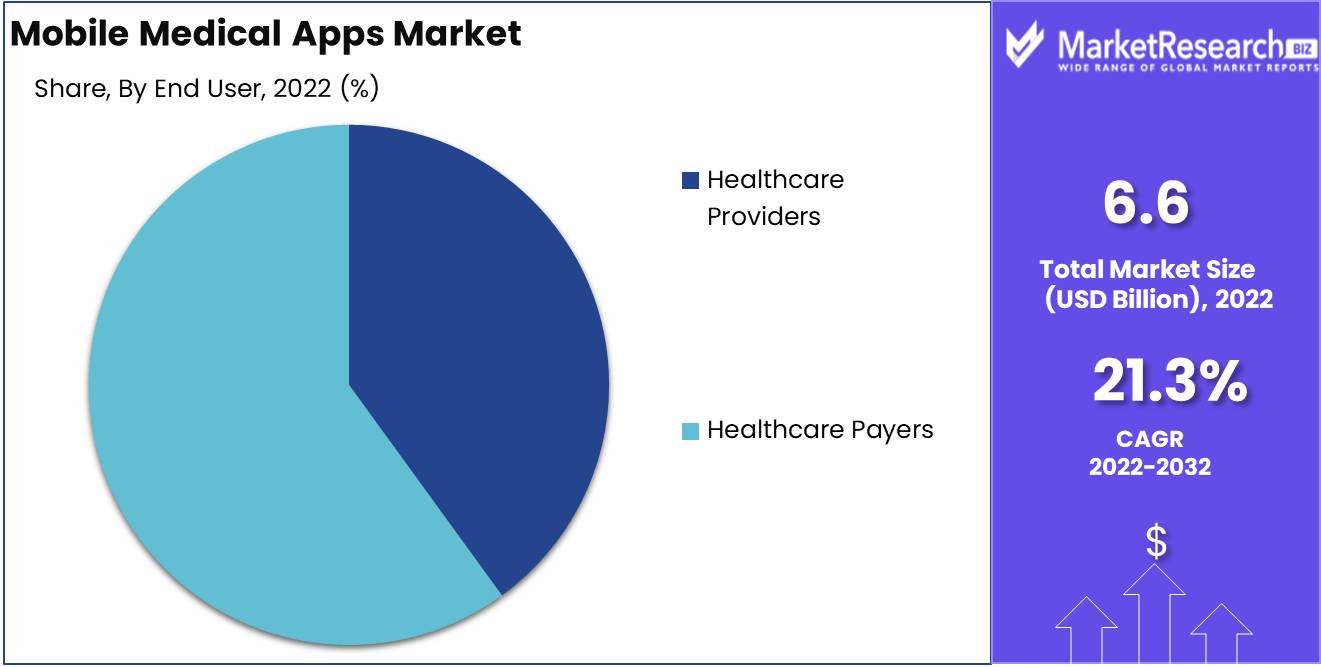
Mobile Medical Apps Market size is expected to be worth around USD 43.4 Bn by 2032 from USD 6.6 Bn in 2022, growing at a CAGR of 21.3% during the forecast period from 2023 to 2032.
The mobile medical apps market is growing, and there are many opportunities for growth. Within this context, it is possible to recognize the overarching significance and myriad benefits that these apps provide to the healthcare industry. The sector has undergone a profound transformation, heralding an era of accessibility, efficiency, and cost-effectiveness. By providing patients with unprecedented access to personalized healthcare information, these apps empower users to take charge of their health.
The integration of artificial intelligence (AI) and machine learning (ML) technologies has been one of the most notable developments in the mobile medical apps industry over the past few years. By leveraging these cutting-edge innovations, apps can now provide personalized healthcare recommendations based on an individual's health data and patterns. In addition, the integration of wearable devices with mobile medical apps has accelerated the emergence of real-time health monitoring, thereby fostering the growth of both preventative and reactive healthcare measures.
The market for mobile medical apps is exploding, and it's easy to see why. Numerous titans from the realms of technology, pharmaceuticals, and entrepreneurial endeavors have recognized the transformative potential of this domain, thereby investing substantial resources in its fertile soil. As a result, a union between mobile medical apps and medical devices, health insurance plans, and telemedicine services has occurred, amplifying the market's influence and expanding its reach beyond the confines of convention.
Indeed, the growth and applications of the mobile medical apps market are pervasive, permeating every aspect of the healthcare industry. The following are some of the most common questions we receive about our services. Individuals, healthcare providers, researchers, and even governments now employ them as indispensable instruments to overcome healthcare challenges, reduce costs, and propel medical research to uncharted heights.
Multiple industries have set their sights on the mobile medical apps market, attesting to its limitless growth potential and profound impact. Within the hallowed corridors of the healthcare industry, practitioners seek to optimize patient care, increase operational efficiency, and promote innovation. Nonetheless, the allure of this market extends beyond healthcare, luring technology companies, pharmaceutical tycoons, insurance providers, and research institutions to participate in its transformative force, thereby effectively reshaping the landscape of healthcare services.
Driving factors
Smartphone Transforms Healthcare
Smartphone adoption has surged to unprecedented levels around the world. Smartphones have replaced other devices as the primary means of accessing information and services as they have become a crucial part of our daily existence. The healthcare industry has capitalized on this trend by leveraging the capabilities of smartphones to improve patient care and doctor-patient interactions. Mobile medical apps allow patients to conveniently access healthcare services, monitor their health vitals, schedule appointments, and receive personalized healthcare recommendations.
Patient Care Is Transformed by Telemedicine
Telemedicine, a subset of telehealth, is revolutionizing healthcare by allowing remote patient consultations and diagnosis via mobile apps. Without an in-person visit, telemedicine apps connect patients with healthcare professionals, allowing them to receive medical advice and even treatment. This has proven especially advantageous for patients with limited mobility or who reside in remote areas. These apps enable patients to monitor their health parameters, such as blood glucose levels and blood pressure, and exchange the data in real-time with their healthcare providers.
App-Based Personalized Healthcare
Advances in healthcare technology have enabled providers to offer personalized healthcare via mobile apps. These apps utilize algorithms and patient data to generate individualized recommendations and treatment plans. In order to generate precise insights and recommendations, personalized healthcare apps can analyze patient health records, lifestyle habits, genetic information, and other pertinent data. Rapidly increasing demand for personalized healthcare solutions is propelling the growth of the mobile medical apps market.
Innovation in Technology Drives the Medical Applications Market
Innovation in technology is one of the primary growth drivers for the mobile medical apps market. From artificial intelligence and machine learning to virtual reality and wearables, the healthcare industry is experiencing a proliferation of innovative technologies that are revolutionizing patient care. The use of mobile devices to deliver healthcare is a growing trend. Apps that incorporate virtual reality technology, for instance, can provide immersive experiences for both patients and healthcare professionals, thereby augmenting diagnosis, treatment, and surgical planning.
Restraining Factors
Data Security and Privacy Growing Fear
In a digital landscape that is constantly evolving, the mobile medical apps market is acquiring significant traction in providing innovative healthcare solutions. These applications are revolutionizing the interaction between patients and healthcare professionals by facilitating remote monitoring, diagnosis, and treatment. Despite the enormous potential and benefits offered by mobile medical apps, the market's growth and widespread adoption continue to be hampered by a number of restraining factors.
The Clarity in Regulatory Matters Is Crucial for Market Growth
The use of a mobile medical app is a common practice, but it is also important to consider the potential for privacy and security. As these applications acquire and process sensitive patient data, it becomes imperative to safeguard patient confidentiality and prevent unauthorized access. Fear of data breaches and cyberattacks hangs over the market, discouraging patients and healthcare providers from embracing mobile medical apps fully.
Operating System Compatibility Challenges Dilemma
The absence of regulatory clarity is another significant factor restraining the mobile medical apps market. Given the rapid advancement of technology and the proliferation of new apps, it is difficult for regulatory bodies to keep up with the shifting landscape. In the absence of distinct guidelines and regulations, developers frequently experience confusion, impeding innovation and market expansion. By resolving these regulatory ambiguities and establishing comprehensive guidelines, confidence can be instilled in both developers and consumers, thereby advancing the market.
App Quality Variability Ensuring Reliability
The limited reimbursement options pose a significant barrier to the widespread adoption of mobile medical apps, despite their enormous potential for streamlining healthcare delivery. Traditional methods of care, such as in-person consultations and treatments, are reimbursed by healthcare systems, whereas the mobile medical apps market frequently falls outside the existing reimbursement framework. To encourage the integration of these apps into healthcare systems, it is necessary to establish appropriate reimbursement mechanisms that enable healthcare providers to be adequately compensated for using app-based services.
Certifying Reliable Applications Builds Credibility
The market for mobile medical apps is flooded with numerous products of varying quality and effectiveness. This variation in app quality raises concerns among healthcare professionals and patients, as they require assurance that the apps they use are accurate, dependable, and evidence-based. The safety, accuracy, and effectiveness of mobile medical apps could be certified, which would increase user confidence. Establishing explicit quality standards and a certification procedure would encourage developers to create high-quality apps, thereby creating a more robust and credible market.
Therapeutic Area Analysis
In recent years, the diabetes segment has dominated the mobile medical apps market. Due to global diabetes prevalence and increased self-management tool demand, this segment has grown significantly. Diabetes management applications provide real-time monitoring and individualized support.
Emerging economies' economic growth has driven diabetes segment adoption. Due to lifestyle changes and aging populations, diabetes rates have risen rapidly in these economies. Thus, governments and healthcare professionals in these countries have realized the need for novel diabetes management options. Mobile medical apps are a cost-effective way to reach more people with vital healthcare services.
The diabetes segment dominates the mobile medical apps market due to consumer trends and behavior. Diabetes patients are becoming more proactive and demanding convenient and individualized care. They can track food, exercise, and medication with mobile medical apps. These apps are popular with diabetics due to their convenience and flexibility, fueling segment growth.
Model Analysis
The free segment dominates the mobile medical apps market. Because they're free, free apps are popular. These applications offer basic health and well-being monitoring. Free apps are a good alternative to expensive healthcare solutions for many people, especially those on a budget.
As in the preceding section, economic development in emerging economies has driven the free segment of the mobile medical apps market. Large populations in these economies often lack healthcare. Free mobile medical apps can fill this gap and provide basic healthcare to more people. These apps are affordable for low-income users.
Consumer trends and behavior also drive the free segment of the mobile medical apps market. Many people prefer free apps before buying them. They can test the app's features and usability before buying a premium version. The large range of free therapeutic applications encourages people to try them and use their fundamental capabilities.
Application Analysis
The mobile medical apps market is dominated by the health and wellness industry, with the majority of the market's share coming from the United States. These applications track fitness, nutrition, stress, and sleep. Health and wellness management applications are popular among people trying to live a healthy lifestyle due to increased awareness of well-being.
Emerging economies have driven health and wellness management app use. As these economies mature, people are emphasizing their health and actively seeking methods to sustain a healthy lifestyle. Health and wellness management applications give customers individualized advice to make informed health decisions. These apps appeal to many people due to their price and ease.
Consumer trends and behavior help the health and wellness management segment dominate the mobile medical apps market. People are seeking strategies to control their health and prevent sickness as preventative healthcare becomes more popular. Health and wellness management applications help them improve their health by tracking and providing customized insights. Health and wellness management apps for all needs and preferences boost their appeal.
End User Analysis
The healthcare payers segment dominates the mobile medical apps market, serving insurance providers and other stakeholders. These apps help healthcare payers improve efficiency, patient experience, and operations. Healthcare payers may automate procedures like claims processing and policy management with mobile medical apps, saving money and improving service.
The healthcare payers segment has adopted mobile medical apps due to emerging economies' economic growth. Healthcare is changing along with these economies. Digital solutions are becoming increasingly important to healthcare payers in managing operations and meeting customer requests. Mobile medical apps make it easy for healthcare payers to improve their services and stay competitive.
Consumer trends and behavior help the healthcare payers segment dominate the mobile medical apps market. Patients want openness, ease, and personalization from healthcare providers. Mobile medical apps with user-friendly interfaces, real-time health information, and smooth communication channels help healthcare payers achieve these expectations.
Key Market Segments
By Therapeutic Area
- Cardiovascular
- Diabetes
- Respiratory
- Neurology
- Other Therapeutic Areas
By Model
- Subscription-Based
- Free
- Paid
By Application
- Diagnostics
- Remote Monitoring & Consultation
- Health & Wellness Management
- Chronic Disease Management
- Nutrition Apps
- Other Applications
By End User
- Healthcare Providers
- Healthcare Payers
Growth Opportunity
RPM Transforms Healthcare
The mobile medical apps market has transformed chronic disease management via remote patient monitoring (RPM). These apps empower patients to actively participate in their healthcare by monitoring their vital signs and health metrics at home. RPM gives healthcare practitioners real-time patient data for quicker interventions and enhanced decision-making.
AI-Assisted Care
The mobile medical apps market has the potential to improve chronic illness management by leveraging RPM. These apps use AI and machine learning algorithms to examine massive patient data and detect trends, abnormalities, and patterns that humans may miss. The ability to use your imagination to solve problems is a powerful tool, and it may be used to your advantage. RPM, AI, and machine learning have the potential to revolutionize personalized healthcare and improve patient outcomes.
Mobile Health Apps
Mobile medical apps have penetrated developed countries, but emerging markets have huge untapped potential. Mobile technology is booming in countries with poor healthcare infrastructure, providing a unique chance to close the gap. Mobile medical apps market can deliver important healthcare services to marginalized people, including remote consultations, diagnostics, and market information.
AI Breaking Boundaries
The integration of AI and machine learning in mobile medical apps can assist overcome language barriers and cultural variations by offering real-time translation and culturally relevant advice. This integration helps patients and healthcare practitioners communicate, assuring accurate diagnoses and personalized treatment regimens regardless of location. The mobile medical apps market can transform global healthcare by leveraging emerging markets' potential.
Latest Trends
Mental Health App Demand Rising
Global awareness of mental health issues is driving demand for creative treatments. Mental health apps provide users with a variety of tools and approaches to manage stress, anxiety, depression, and other mental health disorders. For customers looking for efficient self-help options, these apps offer adjustable features such as therapy sessions, meditation exercises, mood trackers, and personalized recommendations.
Medical App Usability Improvement
In order to succeed, you must have a good reason to do so. A pleasant user experience depends on seamless navigation, intuitive interfaces, and visually appealing designs. The use of artificial intelligence (AI) and machine learning (MLM) to create a more personalized experience for users is a growing trend. The following is a list of all the ways in which we may help you.
Mobile Medical Apps Promote Interoperability
Health data integration across healthcare systems and devices has long been a challenge. Interoperability is being promoted in the mobile medical apps market to solve this problem. Mobile health apps improve care coordination, patient empowerment, and overall healthcare efficiency by integrating EHRs and permitting safe data transmission.
VR/AR Change Healthcare Apps
The use of virtual reality (VR) and augmented reality (AR) in healthcare is becoming more and more common. The ability to use the Internet of Things (IoT) to communicate with others is a major benefit of this technology. AR helps in vein localization and guided surgeries by overlaying digital information on real-world scenes. In order to improve patient outcomes, mobile medical apps must be used.
Regional Analysis
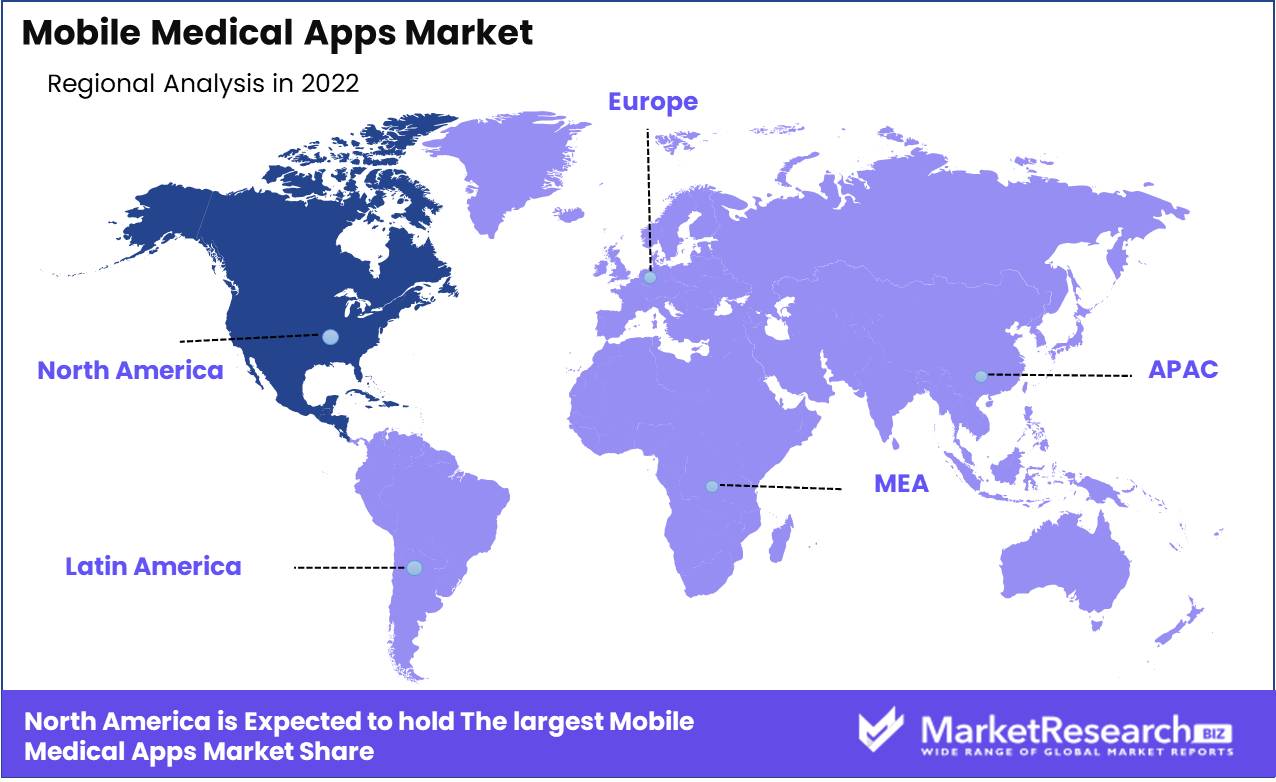
The mobile medical apps market is continuously changing healthcare technology. These apps give healthcare professionals and patients new features and information, making healthcare more accessible and efficient. North America dominates the mobile medical apps market.
Mobile medical apps have grown rapidly in North America. Personal health monitoring, remote patient monitoring, medication management, and illness management are all possible with the use of such apps. The prevalence of chronic diseases, as well as the need for a more comprehensive approach, are all factors that contribute to the success of the industry.
North America's excellent healthcare infrastructure helps it dominate the mobile medical apps market. The US has a solid healthcare system with modern medical facilities and a focus on technology. This fosters the development and adoption of mobile medical apps.
Several major technology companies in North America have helped expand the mobile medical apps market. These companies have the skills and resources to create breakthrough apps for healthcare professionals and patients. The growth of mobile medical apps is a direct result of the region's advantageous tax climate, which has led to the development of the industry.
Key Regions and Countries
North America
- US
- Canada
- Mexico
Western Europe
- Germany
- France
- The UK
- Spain
- Italy
- Portugal
- Ireland
- Austria
- Switzerland
- Benelux
- Nordic
- Rest of Western Europe
Eastern Europe
- Russia
- Poland
- The Czech Republic
- Greece
- Rest of Eastern Europe
APAC
- China
- Japan
- South Korea
- India
- Australia & New Zealand
- Indonesia
- Malaysia
- Philippines
- Singapore
- Thailand
- Vietnam
- Rest of APAC
Latin America
- Brazil
- Colombia
- Chile
- Argentina
- Costa Rica
- Rest of Latin America
Middle East & Africa
- Algeria
- Egypt
- Israel
- Kuwait
- Nigeria
- Saudi Arabia
- South Africa
- Turkey
- United Arab Emirates
- Rest of MEA
Key Players Analysis
These innovators are driving mobile medical app growth. Apple, Medtronic, Samsung, Philips, iHealth Labs, and AT&T Intellectual Property have shown their commitment to patient care, remote healthcare, and active patient participation.
Apple Inc. leads the mobile medical apps market with its robust ecosystem and seamless hardware-software integration. They created the HealthKit framework and app to let users manage and monitor their health data. Health Records lets users securely save and exchange medical records with healthcare providers.
Medtronic, a medical technology giant, has advanced mobile medical apps. The best way to learn about a company's health is to visit its website. Medtronic's innovative solutions help patients manage diabetes and heart disease.
Samsung, known for its electronics, has made significant inroads into the mobile medical apps market. Their smartwatches and fitness trackers effortlessly incorporate health monitoring features. Samsung Health, their flagship app, provides users with complete health and fitness statistics to promote an active and healthy lifestyle.
Koninklijke The Philips Group, Inc. is a global leader in healthcare innovation. The company offers a wide range of products and services, including vital sign monitoring and telehealth. Philips uses mobile technology for remote consultations, imaging, and patient management. Their commitment to scalable and effective solutions has helped bridge the gap between patients and healthcare professionals.
The iHealth Labs team's mission is to help people live healthier lives by providing them with the tools they need to succeed. Their easy mobile app syncs with their wireless blood pressure monitors, glucose meters, and activity trackers. Through precise and real-time data tracking, patients can actively participate in their health, supporting early intervention and better healthcare outcomes.
Telecom leader AT&T Intellectual Property transforms the mobile medical apps market. Their reliable network architecture and connection solutions enable remote patient monitoring and connected care. AT&T helps chronically ill patients receive home-based care by partnering with healthcare professionals and developing remote monitoring equipment.
Top Key Players in the Mobile Medical Apps Market
- Apple Inc (U.S.)
- Medtronic (Ireland)
- SAMSUNG (South Korea)
- Koninklijke Philips N.V. (Netherlands)
- iHealth Labs Inc (U.S.)
- AT&T Intellectual Property. (U.S.)
- Allscripts Healthcare, LLC (U.S.)
- Qualcomm Technologies, Inc. (U.S.)
- Cerner Corporation. (U.S.)
- Evolent Health, Inc. (U.S.)
- Oscar Insurance (U.S.)
- Zest Health (U.S.)
- athenahealth, Inc. (U.S.)
- OMRON Corporation (Japan)
- Nokia (Finland)
- Cisco Systems, Inc. (U.S.)
- AIRSTRIP TECHNOLOGIES, INC. (U.S.)
- BioTelemetry, Inc. (U.S.)
- AliveCor, Inc. (U.S.)
Recent Development
- In 2023, Babylon Health, a London-based digital health firm, shocked the healthcare industry with the launch of its much-anticipated Babylon app.
- in 2022, With its innovative KardiaMobile 6L ECG app, AliveCor, a pioneer in the digital health industry, lifted the bar again.
- In 2021, San Francisco-based healthcare company Nurx launched its breakthrough Nurx app.
- In 2020, The company's flagship, Teladoc, is a leader in the field of virtual health care.
- In 2019, The launch of the company's mobile app, which is a part of the healthcare industry, was announced by the company in a press release.
Report Scope
Report Features Description Market Value (2022) USD 6.6 Bn Forecast Revenue (2032) USD 43.4 Bn CAGR (2023-2032) 21.3% Base Year for Estimation 2022 Historic Period 2016-2022 Forecast Period 2023-2032 Report Coverage Revenue Forecast, Market Dynamics, COVID-19 Impact, Competitive Landscape, Recent Developments Segments Covered By Therapeutic Area (Cardiovascular, Diabetes, Respiratory, Neurology, Other Therapeutic Areas), By Model (Subscription-Based, Free, Paid), By Application (Diagnostics, Remote Monitoring & Consultation, Health & Wellness Management, Chronic Disease Management, Nutrition Apps, Other Applications), By End User (Healthcare Providers, Healthcare Payers) Regional Analysis North America – The US, Canada, & Mexico; Western Europe – Germany, France, The UK, Spain, Italy, Portugal, Ireland, Austria, Switzerland, Benelux, Nordic, & Rest of Western Europe; Eastern Europe – Russia, Poland, The Czech Republic, Greece, & Rest of Eastern Europe; APAC – China, Japan, South Korea, India, Australia & New Zealand, Indonesia, Malaysia, Philippines, Singapore, Thailand, Vietnam, & Rest of APAC; Latin America – Brazil, Colombia, Chile, Argentina, Costa Rica, & Rest of Latin America; Middle East & Africa – Algeria, Egypt, Israel, Kuwait, Nigeria, Saudi Arabia, South Africa, Turkey, United Arab Emirates, & Rest of MEA Competitive Landscape Apple Inc (U.S.), Medtronic (Ireland), SAMSUNG (South Korea), Koninklijke Philips N.V. (Netherlands), iHealth Labs Inc (U.S.), AT&T Intellectual Property. (U.S.), Allscripts Healthcare, LLC (U.S.), Qualcomm Technologies, Inc. (U.S.), Cerner Corporation. (U.S.), Evolent Health, Inc. (U.S.), Oscar Insurance (U.S.), Zest Health (U.S.), athenahealth, Inc. (U.S.), OMRON Corporation (Japan), Nokia (Finland), Cisco Systems, Inc. (U.S.), AIRSTRIP TECHNOLOGIES, INC. (U.S.), BioTelemetry, Inc. (U.S.), AliveCor, Inc. (U.S.) Customization Scope Customization for segments, region/country-level will be provided. Moreover, additional customization can be done based on the requirements. Purchase Options We have three licenses to opt for: Single User License, Multi-User License (Up to 5 Users), Corporate Use License (Unlimited User and Printable PDF) - Apple Inc (U.S.)
- Medtronic (Ireland)
- SAMSUNG (South Korea)
- Koninklijke Philips N.V. (Netherlands)
- iHealth Labs Inc (U.S.)
- AT&T Intellectual Property. (U.S.)
- Allscripts Healthcare, LLC (U.S.)
- Qualcomm Technologies, Inc. (U.S.)
- Cerner Corporation. (U.S.)
- Evolent Health, Inc. (U.S.)
- Oscar Insurance (U.S.)
- Zest Health (U.S.)
- athenahealth, Inc. (U.S.)
- OMRON Corporation (Japan)
- Nokia (Finland)
- Cisco Systems, Inc. (U.S.)
- AIRSTRIP TECHNOLOGIES, INC. (U.S.)
- BioTelemetry, Inc. (U.S.)
- AliveCor, Inc. (U.S.)
- 1. Executive Summary
- 1.1. Definition
- 1.2. Taxonomy
- 1.3. Research Scope
- 1.4. Key Analysis
- 1.5. Key Findings by Major Segments
- 1.6. Top strategies by Major Players
- 2. Global Mobile Medical Apps Market Overview
- 2.1. Mobile Medical Apps Market Dynamics
- 2.1.1. Drivers
- 2.1.2. Opportunities
- 2.1.3. Restraints
- 2.1.4. Challenges
- 2.2. Macro-economic Factors
- 2.3. Regulatory Framework
- 2.4. Market Investment Feasibility Index
- 2.5. PEST Analysis
- 2.6. PORTER’S Five Force Analysis
- 2.7. Drivers & Restraints Impact Analysis
- 2.8. Industry Chain Analysis
- 2.9. Cost Structure Analysis
- 2.10. Marketing Strategy
- 2.11. Russia-Ukraine War Impact Analysis
- 2.12. Opportunity Map Analysis
- 2.13. Market Competition Scenario Analysis
- 2.14. Product Life Cycle Analysis
- 2.15. Opportunity Orbits
- 2.16. Manufacturer Intensity Map
- 2.17. Major Companies sales by Value & Volume
- 2.1. Mobile Medical Apps Market Dynamics
- 3. Global Mobile Medical Apps Market Analysis, Opportunity and Forecast, 2016-2032
- 3.1. Global Mobile Medical Apps Market Analysis, 2016-2021
- 3.2. Global Mobile Medical Apps Market Opportunity and Forecast, 2023-2032
- 3.3. Global Mobile Medical Apps Market Analysis, Opportunity and Forecast, By By Therapeutic Area, 2016-2032
- 3.3.1. Global Mobile Medical Apps Market Analysis by By Therapeutic Area: Introduction
- 3.3.2. Market Size Absolute $ Opportunity Analysis and Forecast, By By Therapeutic Area, 2016-2032
- 3.3.3. Cardiovascular
- 3.3.4. Diabetes
- 3.3.5. Respiratory
- 3.3.6. Neurology
- 3.3.7. Other Therapeutic Areas
- 3.4. Global Mobile Medical Apps Market Analysis, Opportunity and Forecast, By By Model, 2016-2032
- 3.4.1. Global Mobile Medical Apps Market Analysis by By Model: Introduction
- 3.4.2. Market Size Absolute $ Opportunity Analysis and Forecast, By By Model, 2016-2032
- 3.4.3. Subscription-Based
- 3.4.4. Free
- 3.4.5. Paid
- 3.5. Global Mobile Medical Apps Market Analysis, Opportunity and Forecast, By By Application, 2016-2032
- 3.5.1. Global Mobile Medical Apps Market Analysis by By Application: Introduction
- 3.5.2. Market Size Absolute $ Opportunity Analysis and Forecast, By By Application, 2016-2032
- 3.5.3. Diagnostics
- 3.5.4. Remote Monitoring & Consultation
- 3.5.5. Health & Wellness Management
- 3.5.6. Chronic Disease Management
- 3.5.7. Nutrition Apps
- 3.5.8. Other Applications
- 3.6. Global Mobile Medical Apps Market Analysis, Opportunity and Forecast, By By End User, 2016-2032
- 3.6.1. Global Mobile Medical Apps Market Analysis by By End User: Introduction
- 3.6.2. Market Size Absolute $ Opportunity Analysis and Forecast, By By End User, 2016-2032
- 3.6.3. Healthcare Providers
- 3.6.4. Healthcare Payers
- 4. North America Mobile Medical Apps Market Analysis, Opportunity and Forecast, 2016-2032
- 4.1. North America Mobile Medical Apps Market Analysis, 2016-2021
- 4.2. North America Mobile Medical Apps Market Opportunity and Forecast, 2023-2032
- 4.3. North America Mobile Medical Apps Market Analysis, Opportunity and Forecast, By By Therapeutic Area, 2016-2032
- 4.3.1. North America Mobile Medical Apps Market Analysis by By Therapeutic Area: Introduction
- 4.3.2. Market Size Absolute $ Opportunity Analysis and Forecast, By By Therapeutic Area, 2016-2032
- 4.3.3. Cardiovascular
- 4.3.4. Diabetes
- 4.3.5. Respiratory
- 4.3.6. Neurology
- 4.3.7. Other Therapeutic Areas
- 4.4. North America Mobile Medical Apps Market Analysis, Opportunity and Forecast, By By Model, 2016-2032
- 4.4.1. North America Mobile Medical Apps Market Analysis by By Model: Introduction
- 4.4.2. Market Size Absolute $ Opportunity Analysis and Forecast, By By Model, 2016-2032
- 4.4.3. Subscription-Based
- 4.4.4. Free
- 4.4.5. Paid
- 4.5. North America Mobile Medical Apps Market Analysis, Opportunity and Forecast, By By Application, 2016-2032
- 4.5.1. North America Mobile Medical Apps Market Analysis by By Application: Introduction
- 4.5.2. Market Size Absolute $ Opportunity Analysis and Forecast, By By Application, 2016-2032
- 4.5.3. Diagnostics
- 4.5.4. Remote Monitoring & Consultation
- 4.5.5. Health & Wellness Management
- 4.5.6. Chronic Disease Management
- 4.5.7. Nutrition Apps
- 4.5.8. Other Applications
- 4.6. North America Mobile Medical Apps Market Analysis, Opportunity and Forecast, By By End User, 2016-2032
- 4.6.1. North America Mobile Medical Apps Market Analysis by By End User: Introduction
- 4.6.2. Market Size Absolute $ Opportunity Analysis and Forecast, By By End User, 2016-2032
- 4.6.3. Healthcare Providers
- 4.6.4. Healthcare Payers
- 4.7. North America Mobile Medical Apps Market Analysis, Opportunity and Forecast, By Country , 2016-2032
- 4.7.1. North America Mobile Medical Apps Market Analysis by Country : Introduction
- 4.7.2. Market Size Absolute $ Opportunity Analysis and Forecast, Country , 2016-2032
- 4.7.2.1. The US
- 4.7.2.2. Canada
- 4.7.2.3. Mexico
- 5. Western Europe Mobile Medical Apps Market Analysis, Opportunity and Forecast, 2016-2032
- 5.1. Western Europe Mobile Medical Apps Market Analysis, 2016-2021
- 5.2. Western Europe Mobile Medical Apps Market Opportunity and Forecast, 2023-2032
- 5.3. Western Europe Mobile Medical Apps Market Analysis, Opportunity and Forecast, By By Therapeutic Area, 2016-2032
- 5.3.1. Western Europe Mobile Medical Apps Market Analysis by By Therapeutic Area: Introduction
- 5.3.2. Market Size Absolute $ Opportunity Analysis and Forecast, By By Therapeutic Area, 2016-2032
- 5.3.3. Cardiovascular
- 5.3.4. Diabetes
- 5.3.5. Respiratory
- 5.3.6. Neurology
- 5.3.7. Other Therapeutic Areas
- 5.4. Western Europe Mobile Medical Apps Market Analysis, Opportunity and Forecast, By By Model, 2016-2032
- 5.4.1. Western Europe Mobile Medical Apps Market Analysis by By Model: Introduction
- 5.4.2. Market Size Absolute $ Opportunity Analysis and Forecast, By By Model, 2016-2032
- 5.4.3. Subscription-Based
- 5.4.4. Free
- 5.4.5. Paid
- 5.5. Western Europe Mobile Medical Apps Market Analysis, Opportunity and Forecast, By By Application, 2016-2032
- 5.5.1. Western Europe Mobile Medical Apps Market Analysis by By Application: Introduction
- 5.5.2. Market Size Absolute $ Opportunity Analysis and Forecast, By By Application, 2016-2032
- 5.5.3. Diagnostics
- 5.5.4. Remote Monitoring & Consultation
- 5.5.5. Health & Wellness Management
- 5.5.6. Chronic Disease Management
- 5.5.7. Nutrition Apps
- 5.5.8. Other Applications
- 5.6. Western Europe Mobile Medical Apps Market Analysis, Opportunity and Forecast, By By End User, 2016-2032
- 5.6.1. Western Europe Mobile Medical Apps Market Analysis by By End User: Introduction
- 5.6.2. Market Size Absolute $ Opportunity Analysis and Forecast, By By End User, 2016-2032
- 5.6.3. Healthcare Providers
- 5.6.4. Healthcare Payers
- 5.7. Western Europe Mobile Medical Apps Market Analysis, Opportunity and Forecast, By Country , 2016-2032
- 5.7.1. Western Europe Mobile Medical Apps Market Analysis by Country : Introduction
- 5.7.2. Market Size Absolute $ Opportunity Analysis and Forecast, Country , 2016-2032
- 5.7.2.1. Germany
- 5.7.2.2. France
- 5.7.2.3. The UK
- 5.7.2.4. Spain
- 5.7.2.5. Italy
- 5.7.2.6. Portugal
- 5.7.2.7. Ireland
- 5.7.2.8. Austria
- 5.7.2.9. Switzerland
- 5.7.2.10. Benelux
- 5.7.2.11. Nordic
- 5.7.2.12. Rest of Western Europe
- 6. Eastern Europe Mobile Medical Apps Market Analysis, Opportunity and Forecast, 2016-2032
- 6.1. Eastern Europe Mobile Medical Apps Market Analysis, 2016-2021
- 6.2. Eastern Europe Mobile Medical Apps Market Opportunity and Forecast, 2023-2032
- 6.3. Eastern Europe Mobile Medical Apps Market Analysis, Opportunity and Forecast, By By Therapeutic Area, 2016-2032
- 6.3.1. Eastern Europe Mobile Medical Apps Market Analysis by By Therapeutic Area: Introduction
- 6.3.2. Market Size Absolute $ Opportunity Analysis and Forecast, By By Therapeutic Area, 2016-2032
- 6.3.3. Cardiovascular
- 6.3.4. Diabetes
- 6.3.5. Respiratory
- 6.3.6. Neurology
- 6.3.7. Other Therapeutic Areas
- 6.4. Eastern Europe Mobile Medical Apps Market Analysis, Opportunity and Forecast, By By Model, 2016-2032
- 6.4.1. Eastern Europe Mobile Medical Apps Market Analysis by By Model: Introduction
- 6.4.2. Market Size Absolute $ Opportunity Analysis and Forecast, By By Model, 2016-2032
- 6.4.3. Subscription-Based
- 6.4.4. Free
- 6.4.5. Paid
- 6.5. Eastern Europe Mobile Medical Apps Market Analysis, Opportunity and Forecast, By By Application, 2016-2032
- 6.5.1. Eastern Europe Mobile Medical Apps Market Analysis by By Application: Introduction
- 6.5.2. Market Size Absolute $ Opportunity Analysis and Forecast, By By Application, 2016-2032
- 6.5.3. Diagnostics
- 6.5.4. Remote Monitoring & Consultation
- 6.5.5. Health & Wellness Management
- 6.5.6. Chronic Disease Management
- 6.5.7. Nutrition Apps
- 6.5.8. Other Applications
- 6.6. Eastern Europe Mobile Medical Apps Market Analysis, Opportunity and Forecast, By By End User, 2016-2032
- 6.6.1. Eastern Europe Mobile Medical Apps Market Analysis by By End User: Introduction
- 6.6.2. Market Size Absolute $ Opportunity Analysis and Forecast, By By End User, 2016-2032
- 6.6.3. Healthcare Providers
- 6.6.4. Healthcare Payers
- 6.7. Eastern Europe Mobile Medical Apps Market Analysis, Opportunity and Forecast, By Country , 2016-2032
- 6.7.1. Eastern Europe Mobile Medical Apps Market Analysis by Country : Introduction
- 6.7.2. Market Size Absolute $ Opportunity Analysis and Forecast, Country , 2016-2032
- 6.7.2.1. Russia
- 6.7.2.2. Poland
- 6.7.2.3. The Czech Republic
- 6.7.2.4. Greece
- 6.7.2.5. Rest of Eastern Europe
- 7. APAC Mobile Medical Apps Market Analysis, Opportunity and Forecast, 2016-2032
- 7.1. APAC Mobile Medical Apps Market Analysis, 2016-2021
- 7.2. APAC Mobile Medical Apps Market Opportunity and Forecast, 2023-2032
- 7.3. APAC Mobile Medical Apps Market Analysis, Opportunity and Forecast, By By Therapeutic Area, 2016-2032
- 7.3.1. APAC Mobile Medical Apps Market Analysis by By Therapeutic Area: Introduction
- 7.3.2. Market Size Absolute $ Opportunity Analysis and Forecast, By By Therapeutic Area, 2016-2032
- 7.3.3. Cardiovascular
- 7.3.4. Diabetes
- 7.3.5. Respiratory
- 7.3.6. Neurology
- 7.3.7. Other Therapeutic Areas
- 7.4. APAC Mobile Medical Apps Market Analysis, Opportunity and Forecast, By By Model, 2016-2032
- 7.4.1. APAC Mobile Medical Apps Market Analysis by By Model: Introduction
- 7.4.2. Market Size Absolute $ Opportunity Analysis and Forecast, By By Model, 2016-2032
- 7.4.3. Subscription-Based
- 7.4.4. Free
- 7.4.5. Paid
- 7.5. APAC Mobile Medical Apps Market Analysis, Opportunity and Forecast, By By Application, 2016-2032
- 7.5.1. APAC Mobile Medical Apps Market Analysis by By Application: Introduction
- 7.5.2. Market Size Absolute $ Opportunity Analysis and Forecast, By By Application, 2016-2032
- 7.5.3. Diagnostics
- 7.5.4. Remote Monitoring & Consultation
- 7.5.5. Health & Wellness Management
- 7.5.6. Chronic Disease Management
- 7.5.7. Nutrition Apps
- 7.5.8. Other Applications
- 7.6. APAC Mobile Medical Apps Market Analysis, Opportunity and Forecast, By By End User, 2016-2032
- 7.6.1. APAC Mobile Medical Apps Market Analysis by By End User: Introduction
- 7.6.2. Market Size Absolute $ Opportunity Analysis and Forecast, By By End User, 2016-2032
- 7.6.3. Healthcare Providers
- 7.6.4. Healthcare Payers
- 7.7. APAC Mobile Medical Apps Market Analysis, Opportunity and Forecast, By Country , 2016-2032
- 7.7.1. APAC Mobile Medical Apps Market Analysis by Country : Introduction
- 7.7.2. Market Size Absolute $ Opportunity Analysis and Forecast, Country , 2016-2032
- 7.7.2.1. China
- 7.7.2.2. Japan
- 7.7.2.3. South Korea
- 7.7.2.4. India
- 7.7.2.5. Australia & New Zeland
- 7.7.2.6. Indonesia
- 7.7.2.7. Malaysia
- 7.7.2.8. Philippines
- 7.7.2.9. Singapore
- 7.7.2.10. Thailand
- 7.7.2.11. Vietnam
- 7.7.2.12. Rest of APAC
- 8. Latin America Mobile Medical Apps Market Analysis, Opportunity and Forecast, 2016-2032
- 8.1. Latin America Mobile Medical Apps Market Analysis, 2016-2021
- 8.2. Latin America Mobile Medical Apps Market Opportunity and Forecast, 2023-2032
- 8.3. Latin America Mobile Medical Apps Market Analysis, Opportunity and Forecast, By By Therapeutic Area, 2016-2032
- 8.3.1. Latin America Mobile Medical Apps Market Analysis by By Therapeutic Area: Introduction
- 8.3.2. Market Size Absolute $ Opportunity Analysis and Forecast, By By Therapeutic Area, 2016-2032
- 8.3.3. Cardiovascular
- 8.3.4. Diabetes
- 8.3.5. Respiratory
- 8.3.6. Neurology
- 8.3.7. Other Therapeutic Areas
- 8.4. Latin America Mobile Medical Apps Market Analysis, Opportunity and Forecast, By By Model, 2016-2032
- 8.4.1. Latin America Mobile Medical Apps Market Analysis by By Model: Introduction
- 8.4.2. Market Size Absolute $ Opportunity Analysis and Forecast, By By Model, 2016-2032
- 8.4.3. Subscription-Based
- 8.4.4. Free
- 8.4.5. Paid
- 8.5. Latin America Mobile Medical Apps Market Analysis, Opportunity and Forecast, By By Application, 2016-2032
- 8.5.1. Latin America Mobile Medical Apps Market Analysis by By Application: Introduction
- 8.5.2. Market Size Absolute $ Opportunity Analysis and Forecast, By By Application, 2016-2032
- 8.5.3. Diagnostics
- 8.5.4. Remote Monitoring & Consultation
- 8.5.5. Health & Wellness Management
- 8.5.6. Chronic Disease Management
- 8.5.7. Nutrition Apps
- 8.5.8. Other Applications
- 8.6. Latin America Mobile Medical Apps Market Analysis, Opportunity and Forecast, By By End User, 2016-2032
- 8.6.1. Latin America Mobile Medical Apps Market Analysis by By End User: Introduction
- 8.6.2. Market Size Absolute $ Opportunity Analysis and Forecast, By By End User, 2016-2032
- 8.6.3. Healthcare Providers
- 8.6.4. Healthcare Payers
- 8.7. Latin America Mobile Medical Apps Market Analysis, Opportunity and Forecast, By Country , 2016-2032
- 8.7.1. Latin America Mobile Medical Apps Market Analysis by Country : Introduction
- 8.7.2. Market Size Absolute $ Opportunity Analysis and Forecast, Country , 2016-2032
- 8.7.2.1. Brazil
- 8.7.2.2. Colombia
- 8.7.2.3. Chile
- 8.7.2.4. Argentina
- 8.7.2.5. Costa Rica
- 8.7.2.6. Rest of Latin America
- 9. Middle East & Africa Mobile Medical Apps Market Analysis, Opportunity and Forecast, 2016-2032
- 9.1. Middle East & Africa Mobile Medical Apps Market Analysis, 2016-2021
- 9.2. Middle East & Africa Mobile Medical Apps Market Opportunity and Forecast, 2023-2032
- 9.3. Middle East & Africa Mobile Medical Apps Market Analysis, Opportunity and Forecast, By By Therapeutic Area, 2016-2032
- 9.3.1. Middle East & Africa Mobile Medical Apps Market Analysis by By Therapeutic Area: Introduction
- 9.3.2. Market Size Absolute $ Opportunity Analysis and Forecast, By By Therapeutic Area, 2016-2032
- 9.3.3. Cardiovascular
- 9.3.4. Diabetes
- 9.3.5. Respiratory
- 9.3.6. Neurology
- 9.3.7. Other Therapeutic Areas
- 9.4. Middle East & Africa Mobile Medical Apps Market Analysis, Opportunity and Forecast, By By Model, 2016-2032
- 9.4.1. Middle East & Africa Mobile Medical Apps Market Analysis by By Model: Introduction
- 9.4.2. Market Size Absolute $ Opportunity Analysis and Forecast, By By Model, 2016-2032
- 9.4.3. Subscription-Based
- 9.4.4. Free
- 9.4.5. Paid
- 9.5. Middle East & Africa Mobile Medical Apps Market Analysis, Opportunity and Forecast, By By Application, 2016-2032
- 9.5.1. Middle East & Africa Mobile Medical Apps Market Analysis by By Application: Introduction
- 9.5.2. Market Size Absolute $ Opportunity Analysis and Forecast, By By Application, 2016-2032
- 9.5.3. Diagnostics
- 9.5.4. Remote Monitoring & Consultation
- 9.5.5. Health & Wellness Management
- 9.5.6. Chronic Disease Management
- 9.5.7. Nutrition Apps
- 9.5.8. Other Applications
- 9.6. Middle East & Africa Mobile Medical Apps Market Analysis, Opportunity and Forecast, By By End User, 2016-2032
- 9.6.1. Middle East & Africa Mobile Medical Apps Market Analysis by By End User: Introduction
- 9.6.2. Market Size Absolute $ Opportunity Analysis and Forecast, By By End User, 2016-2032
- 9.6.3. Healthcare Providers
- 9.6.4. Healthcare Payers
- 9.7. Middle East & Africa Mobile Medical Apps Market Analysis, Opportunity and Forecast, By Country , 2016-2032
- 9.7.1. Middle East & Africa Mobile Medical Apps Market Analysis by Country : Introduction
- 9.7.2. Market Size Absolute $ Opportunity Analysis and Forecast, Country , 2016-2032
- 9.7.2.1. Algeria
- 9.7.2.2. Egypt
- 9.7.2.3. Israel
- 9.7.2.4. Kuwait
- 9.7.2.5. Nigeria
- 9.7.2.6. Saudi Arabia
- 9.7.2.7. South Africa
- 9.7.2.8. Turkey
- 9.7.2.9. The UAE
- 9.7.2.10. Rest of MEA
- 10. Global Mobile Medical Apps Market Analysis, Opportunity and Forecast, By Region , 2016-2032
- 10.1. Global Mobile Medical Apps Market Analysis by Region : Introduction
- 10.2. Market Size Absolute $ Opportunity Analysis and Forecast, By Region , 2016-2032
- 10.2.1. North America
- 10.2.2. Western Europe
- 10.2.3. Eastern Europe
- 10.2.4. APAC
- 10.2.5. Latin America
- 10.2.6. Middle East & Africa
- 11. Global Mobile Medical Apps Market Competitive Landscape, Market Share Analysis, and Company Profiles
- 11.1. Market Share Analysis
- 11.2. Company Profiles
- 11.3. Apple Inc (U.S.)
- 11.3.1. Company Overview
- 11.3.2. Financial Highlights
- 11.3.3. Product Portfolio
- 11.3.4. SWOT Analysis
- 11.3.5. Key Strategies and Developments
- 11.4. Medtronic (Ireland)
- 11.4.1. Company Overview
- 11.4.2. Financial Highlights
- 11.4.3. Product Portfolio
- 11.4.4. SWOT Analysis
- 11.4.5. Key Strategies and Developments
- 11.5. SAMSUNG (South Korea)
- 11.5.1. Company Overview
- 11.5.2. Financial Highlights
- 11.5.3. Product Portfolio
- 11.5.4. SWOT Analysis
- 11.5.5. Key Strategies and Developments
- 11.6. Koninklijke Philips N.V. (Netherlands)
- 11.6.1. Company Overview
- 11.6.2. Financial Highlights
- 11.6.3. Product Portfolio
- 11.6.4. SWOT Analysis
- 11.6.5. Key Strategies and Developments
- 11.7. iHealth Labs Inc (U.S.)
- 11.7.1. Company Overview
- 11.7.2. Financial Highlights
- 11.7.3. Product Portfolio
- 11.7.4. SWOT Analysis
- 11.7.5. Key Strategies and Developments
- 11.8. AT&T Intellectual Property. (U.S.)
- 11.8.1. Company Overview
- 11.8.2. Financial Highlights
- 11.8.3. Product Portfolio
- 11.8.4. SWOT Analysis
- 11.8.5. Key Strategies and Developments
- 11.9. Allscripts Healthcare, LLC (U.S.)
- 11.9.1. Company Overview
- 11.9.2. Financial Highlights
- 11.9.3. Product Portfolio
- 11.9.4. SWOT Analysis
- 11.9.5. Key Strategies and Developments
- 11.10. Qualcomm Technologies, Inc. (U.S.)
- 11.10.1. Company Overview
- 11.10.2. Financial Highlights
- 11.10.3. Product Portfolio
- 11.10.4. SWOT Analysis
- 11.10.5. Key Strategies and Developments
- 11.11. Cerner Corporation. (U.S.)
- 11.11.1. Company Overview
- 11.11.2. Financial Highlights
- 11.11.3. Product Portfolio
- 11.11.4. SWOT Analysis
- 11.11.5. Key Strategies and Developments
- 11.12. Evolent Health, Inc. (U.S.)
- 11.12.1. Company Overview
- 11.12.2. Financial Highlights
- 11.12.3. Product Portfolio
- 11.12.4. SWOT Analysis
- 11.12.5. Key Strategies and Developments
- 11.13. Oscar Insurance (U.S.)
- 11.13.1. Company Overview
- 11.13.2. Financial Highlights
- 11.13.3. Product Portfolio
- 11.13.4. SWOT Analysis
- 11.13.5. Key Strategies and Developments
- 11.14. Zest Health (U.S.)
- 11.14.1. Company Overview
- 11.14.2. Financial Highlights
- 11.14.3. Product Portfolio
- 11.14.4. SWOT Analysis
- 11.14.5. Key Strategies and Developments
- 11.15. athenahealth, Inc. (U.S.)
- 11.15.1. Company Overview
- 11.15.2. Financial Highlights
- 11.15.3. Product Portfolio
- 11.15.4. SWOT Analysis
- 11.15.5. Key Strategies and Developments
- 11.16. OMRON Corporation (Japan)
- 11.16.1. Company Overview
- 11.16.2. Financial Highlights
- 11.16.3. Product Portfolio
- 11.16.4. SWOT Analysis
- 11.16.5. Key Strategies and Developments
- 11.17. Nokia (Finland)
- 11.17.1. Company Overview
- 11.17.2. Financial Highlights
- 11.17.3. Product Portfolio
- 11.17.4. SWOT Analysis
- 11.17.5. Key Strategies and Developments
- 11.18. Cisco Systems, Inc. (U.S.)
- 11.18.1. Company Overview
- 11.18.2. Financial Highlights
- 11.18.3. Product Portfolio
- 11.18.4. SWOT Analysis
- 11.18.5. Key Strategies and Developments
- 11.19. AIRSTRIP TECHNOLOGIES, INC. (U.S.)
- 11.19.1. Company Overview
- 11.19.2. Financial Highlights
- 11.19.3. Product Portfolio
- 11.19.4. SWOT Analysis
- 11.19.5. Key Strategies and Developments
- 11.20. BioTelemetry, Inc. (U.S.)
- 11.20.1. Company Overview
- 11.20.2. Financial Highlights
- 11.20.3. Product Portfolio
- 11.20.4. SWOT Analysis
- 11.20.5. Key Strategies and Developments
- 11.21. AliveCor, Inc. (U.S.)
- 11.21.1. Company Overview
- 11.21.2. Financial Highlights
- 11.21.3. Product Portfolio
- 11.21.4. SWOT Analysis
- 11.21.5. Key Strategies and Developments
- 12. Assumptions and Acronyms
- 13. Research Methodology
- 14. Contact
- Figure 1: Global Mobile Medical Apps Market Revenue (US$ Mn) Market Share by Therapeutic Area in 2022
- Figure 2: Global Mobile Medical Apps Market Attractiveness Analysis by Therapeutic Area, 2016-2032
- Figure 3: Global Mobile Medical Apps Market Revenue (US$ Mn) Market Share by Modelin 2022
- Figure 4: Global Mobile Medical Apps Market Attractiveness Analysis by Model, 2016-2032
- Figure 5: Global Mobile Medical Apps Market Revenue (US$ Mn) Market Share by Applicationin 2022
- Figure 6: Global Mobile Medical Apps Market Attractiveness Analysis by Application, 2016-2032
- Figure 7: Global Mobile Medical Apps Market Revenue (US$ Mn) Market Share by End Userin 2022
- Figure 8: Global Mobile Medical Apps Market Attractiveness Analysis by End User, 2016-2032
- Figure 9: Global Mobile Medical Apps Market Revenue (US$ Mn) Market Share by Region in 2022
- Figure 10: Global Mobile Medical Apps Market Attractiveness Analysis by Region, 2016-2032
- Figure 11: Global Mobile Medical Apps Market Revenue (US$ Mn) (2016-2032)
- Figure 12: Global Mobile Medical Apps Market Revenue (US$ Mn) Comparison by Region (2016-2032)
- Figure 13: Global Mobile Medical Apps Market Revenue (US$ Mn) Comparison by Therapeutic Area (2016-2032)
- Figure 14: Global Mobile Medical Apps Market Revenue (US$ Mn) Comparison by Model (2016-2032)
- Figure 15: Global Mobile Medical Apps Market Revenue (US$ Mn) Comparison by Application (2016-2032)
- Figure 16: Global Mobile Medical Apps Market Revenue (US$ Mn) Comparison by End User (2016-2032)
- Figure 17: Global Mobile Medical Apps Market Y-o-Y Growth Rate Comparison by Region (2016-2032)
- Figure 18: Global Mobile Medical Apps Market Y-o-Y Growth Rate Comparison by Therapeutic Area (2016-2032)
- Figure 19: Global Mobile Medical Apps Market Y-o-Y Growth Rate Comparison by Model (2016-2032)
- Figure 20: Global Mobile Medical Apps Market Y-o-Y Growth Rate Comparison by Application (2016-2032)
- Figure 21: Global Mobile Medical Apps Market Y-o-Y Growth Rate Comparison by End User (2016-2032)
- Figure 22: Global Mobile Medical Apps Market Share Comparison by Region (2016-2032)
- Figure 23: Global Mobile Medical Apps Market Share Comparison by Therapeutic Area (2016-2032)
- Figure 24: Global Mobile Medical Apps Market Share Comparison by Model (2016-2032)
- Figure 25: Global Mobile Medical Apps Market Share Comparison by Application (2016-2032)
- Figure 26: Global Mobile Medical Apps Market Share Comparison by End User (2016-2032)
- Figure 27: North America Mobile Medical Apps Market Revenue (US$ Mn) Market Share by Therapeutic Areain 2022
- Figure 28: North America Mobile Medical Apps Market Attractiveness Analysis by Therapeutic Area, 2016-2032
- Figure 29: North America Mobile Medical Apps Market Revenue (US$ Mn) Market Share by Modelin 2022
- Figure 30: North America Mobile Medical Apps Market Attractiveness Analysis by Model, 2016-2032
- Figure 31: North America Mobile Medical Apps Market Revenue (US$ Mn) Market Share by Applicationin 2022
- Figure 32: North America Mobile Medical Apps Market Attractiveness Analysis by Application, 2016-2032
- Figure 33: North America Mobile Medical Apps Market Revenue (US$ Mn) Market Share by End Userin 2022
- Figure 34: North America Mobile Medical Apps Market Attractiveness Analysis by End User, 2016-2032
- Figure 35: North America Mobile Medical Apps Market Revenue (US$ Mn) Market Share by Country in 2022
- Figure 36: North America Mobile Medical Apps Market Attractiveness Analysis by Country, 2016-2032
- Figure 37: North America Mobile Medical Apps Market Revenue (US$ Mn) (2016-2032)
- Figure 38: North America Mobile Medical Apps Market Revenue (US$ Mn) Comparison by Country (2016-2032)
- Figure 39: North America Mobile Medical Apps Market Revenue (US$ Mn) Comparison by Therapeutic Area (2016-2032)
- Figure 40: North America Mobile Medical Apps Market Revenue (US$ Mn) Comparison by Model (2016-2032)
- Figure 41: North America Mobile Medical Apps Market Revenue (US$ Mn) Comparison by Application (2016-2032)
- Figure 42: North America Mobile Medical Apps Market Revenue (US$ Mn) Comparison by End User (2016-2032)
- Figure 43: North America Mobile Medical Apps Market Y-o-Y Growth Rate Comparison by Country (2016-2032)
- Figure 44: North America Mobile Medical Apps Market Y-o-Y Growth Rate Comparison by Therapeutic Area (2016-2032)
- Figure 45: North America Mobile Medical Apps Market Y-o-Y Growth Rate Comparison by Model (2016-2032)
- Figure 46: North America Mobile Medical Apps Market Y-o-Y Growth Rate Comparison by Application (2016-2032)
- Figure 47: North America Mobile Medical Apps Market Y-o-Y Growth Rate Comparison by End User (2016-2032)
- Figure 48: North America Mobile Medical Apps Market Share Comparison by Country (2016-2032)
- Figure 49: North America Mobile Medical Apps Market Share Comparison by Therapeutic Area (2016-2032)
- Figure 50: North America Mobile Medical Apps Market Share Comparison by Model (2016-2032)
- Figure 51: North America Mobile Medical Apps Market Share Comparison by Application (2016-2032)
- Figure 52: North America Mobile Medical Apps Market Share Comparison by End User (2016-2032)
- Figure 53: Western Europe Mobile Medical Apps Market Revenue (US$ Mn) Market Share by Therapeutic Areain 2022
- Figure 54: Western Europe Mobile Medical Apps Market Attractiveness Analysis by Therapeutic Area, 2016-2032
- Figure 55: Western Europe Mobile Medical Apps Market Revenue (US$ Mn) Market Share by Modelin 2022
- Figure 56: Western Europe Mobile Medical Apps Market Attractiveness Analysis by Model, 2016-2032
- Figure 57: Western Europe Mobile Medical Apps Market Revenue (US$ Mn) Market Share by Applicationin 2022
- Figure 58: Western Europe Mobile Medical Apps Market Attractiveness Analysis by Application, 2016-2032
- Figure 59: Western Europe Mobile Medical Apps Market Revenue (US$ Mn) Market Share by End Userin 2022
- Figure 60: Western Europe Mobile Medical Apps Market Attractiveness Analysis by End User, 2016-2032
- Figure 61: Western Europe Mobile Medical Apps Market Revenue (US$ Mn) Market Share by Country in 2022
- Figure 62: Western Europe Mobile Medical Apps Market Attractiveness Analysis by Country, 2016-2032
- Figure 63: Western Europe Mobile Medical Apps Market Revenue (US$ Mn) (2016-2032)
- Figure 64: Western Europe Mobile Medical Apps Market Revenue (US$ Mn) Comparison by Country (2016-2032)
- Figure 65: Western Europe Mobile Medical Apps Market Revenue (US$ Mn) Comparison by Therapeutic Area (2016-2032)
- Figure 66: Western Europe Mobile Medical Apps Market Revenue (US$ Mn) Comparison by Model (2016-2032)
- Figure 67: Western Europe Mobile Medical Apps Market Revenue (US$ Mn) Comparison by Application (2016-2032)
- Figure 68: Western Europe Mobile Medical Apps Market Revenue (US$ Mn) Comparison by End User (2016-2032)
- Figure 69: Western Europe Mobile Medical Apps Market Y-o-Y Growth Rate Comparison by Country (2016-2032)
- Figure 70: Western Europe Mobile Medical Apps Market Y-o-Y Growth Rate Comparison by Therapeutic Area (2016-2032)
- Figure 71: Western Europe Mobile Medical Apps Market Y-o-Y Growth Rate Comparison by Model (2016-2032)
- Figure 72: Western Europe Mobile Medical Apps Market Y-o-Y Growth Rate Comparison by Application (2016-2032)
- Figure 73: Western Europe Mobile Medical Apps Market Y-o-Y Growth Rate Comparison by End User (2016-2032)
- Figure 74: Western Europe Mobile Medical Apps Market Share Comparison by Country (2016-2032)
- Figure 75: Western Europe Mobile Medical Apps Market Share Comparison by Therapeutic Area (2016-2032)
- Figure 76: Western Europe Mobile Medical Apps Market Share Comparison by Model (2016-2032)
- Figure 77: Western Europe Mobile Medical Apps Market Share Comparison by Application (2016-2032)
- Figure 78: Western Europe Mobile Medical Apps Market Share Comparison by End User (2016-2032)
- Figure 79: Eastern Europe Mobile Medical Apps Market Revenue (US$ Mn) Market Share by Therapeutic Areain 2022
- Figure 80: Eastern Europe Mobile Medical Apps Market Attractiveness Analysis by Therapeutic Area, 2016-2032
- Figure 81: Eastern Europe Mobile Medical Apps Market Revenue (US$ Mn) Market Share by Modelin 2022
- Figure 82: Eastern Europe Mobile Medical Apps Market Attractiveness Analysis by Model, 2016-2032
- Figure 83: Eastern Europe Mobile Medical Apps Market Revenue (US$ Mn) Market Share by Applicationin 2022
- Figure 84: Eastern Europe Mobile Medical Apps Market Attractiveness Analysis by Application, 2016-2032
- Figure 85: Eastern Europe Mobile Medical Apps Market Revenue (US$ Mn) Market Share by End Userin 2022
- Figure 86: Eastern Europe Mobile Medical Apps Market Attractiveness Analysis by End User, 2016-2032
- Figure 87: Eastern Europe Mobile Medical Apps Market Revenue (US$ Mn) Market Share by Country in 2022
- Figure 88: Eastern Europe Mobile Medical Apps Market Attractiveness Analysis by Country, 2016-2032
- Figure 89: Eastern Europe Mobile Medical Apps Market Revenue (US$ Mn) (2016-2032)
- Figure 90: Eastern Europe Mobile Medical Apps Market Revenue (US$ Mn) Comparison by Country (2016-2032)
- Figure 91: Eastern Europe Mobile Medical Apps Market Revenue (US$ Mn) Comparison by Therapeutic Area (2016-2032)
- Figure 92: Eastern Europe Mobile Medical Apps Market Revenue (US$ Mn) Comparison by Model (2016-2032)
- Figure 93: Eastern Europe Mobile Medical Apps Market Revenue (US$ Mn) Comparison by Application (2016-2032)
- Figure 94: Eastern Europe Mobile Medical Apps Market Revenue (US$ Mn) Comparison by End User (2016-2032)
- Figure 95: Eastern Europe Mobile Medical Apps Market Y-o-Y Growth Rate Comparison by Country (2016-2032)
- Figure 96: Eastern Europe Mobile Medical Apps Market Y-o-Y Growth Rate Comparison by Therapeutic Area (2016-2032)
- Figure 97: Eastern Europe Mobile Medical Apps Market Y-o-Y Growth Rate Comparison by Model (2016-2032)
- Figure 98: Eastern Europe Mobile Medical Apps Market Y-o-Y Growth Rate Comparison by Application (2016-2032)
- Figure 99: Eastern Europe Mobile Medical Apps Market Y-o-Y Growth Rate Comparison by End User (2016-2032)
- Figure 100: Eastern Europe Mobile Medical Apps Market Share Comparison by Country (2016-2032)
- Figure 101: Eastern Europe Mobile Medical Apps Market Share Comparison by Therapeutic Area (2016-2032)
- Figure 102: Eastern Europe Mobile Medical Apps Market Share Comparison by Model (2016-2032)
- Figure 103: Eastern Europe Mobile Medical Apps Market Share Comparison by Application (2016-2032)
- Figure 104: Eastern Europe Mobile Medical Apps Market Share Comparison by End User (2016-2032)
- Figure 105: APAC Mobile Medical Apps Market Revenue (US$ Mn) Market Share by Therapeutic Areain 2022
- Figure 106: APAC Mobile Medical Apps Market Attractiveness Analysis by Therapeutic Area, 2016-2032
- Figure 107: APAC Mobile Medical Apps Market Revenue (US$ Mn) Market Share by Modelin 2022
- Figure 108: APAC Mobile Medical Apps Market Attractiveness Analysis by Model, 2016-2032
- Figure 109: APAC Mobile Medical Apps Market Revenue (US$ Mn) Market Share by Applicationin 2022
- Figure 110: APAC Mobile Medical Apps Market Attractiveness Analysis by Application, 2016-2032
- Figure 111: APAC Mobile Medical Apps Market Revenue (US$ Mn) Market Share by End Userin 2022
- Figure 112: APAC Mobile Medical Apps Market Attractiveness Analysis by End User, 2016-2032
- Figure 113: APAC Mobile Medical Apps Market Revenue (US$ Mn) Market Share by Country in 2022
- Figure 114: APAC Mobile Medical Apps Market Attractiveness Analysis by Country, 2016-2032
- Figure 115: APAC Mobile Medical Apps Market Revenue (US$ Mn) (2016-2032)
- Figure 116: APAC Mobile Medical Apps Market Revenue (US$ Mn) Comparison by Country (2016-2032)
- Figure 117: APAC Mobile Medical Apps Market Revenue (US$ Mn) Comparison by Therapeutic Area (2016-2032)
- Figure 118: APAC Mobile Medical Apps Market Revenue (US$ Mn) Comparison by Model (2016-2032)
- Figure 119: APAC Mobile Medical Apps Market Revenue (US$ Mn) Comparison by Application (2016-2032)
- Figure 120: APAC Mobile Medical Apps Market Revenue (US$ Mn) Comparison by End User (2016-2032)
- Figure 121: APAC Mobile Medical Apps Market Y-o-Y Growth Rate Comparison by Country (2016-2032)
- Figure 122: APAC Mobile Medical Apps Market Y-o-Y Growth Rate Comparison by Therapeutic Area (2016-2032)
- Figure 123: APAC Mobile Medical Apps Market Y-o-Y Growth Rate Comparison by Model (2016-2032)
- Figure 124: APAC Mobile Medical Apps Market Y-o-Y Growth Rate Comparison by Application (2016-2032)
- Figure 125: APAC Mobile Medical Apps Market Y-o-Y Growth Rate Comparison by End User (2016-2032)
- Figure 126: APAC Mobile Medical Apps Market Share Comparison by Country (2016-2032)
- Figure 127: APAC Mobile Medical Apps Market Share Comparison by Therapeutic Area (2016-2032)
- Figure 128: APAC Mobile Medical Apps Market Share Comparison by Model (2016-2032)
- Figure 129: APAC Mobile Medical Apps Market Share Comparison by Application (2016-2032)
- Figure 130: APAC Mobile Medical Apps Market Share Comparison by End User (2016-2032)
- Figure 131: Latin America Mobile Medical Apps Market Revenue (US$ Mn) Market Share by Therapeutic Areain 2022
- Figure 132: Latin America Mobile Medical Apps Market Attractiveness Analysis by Therapeutic Area, 2016-2032
- Figure 133: Latin America Mobile Medical Apps Market Revenue (US$ Mn) Market Share by Modelin 2022
- Figure 134: Latin America Mobile Medical Apps Market Attractiveness Analysis by Model, 2016-2032
- Figure 135: Latin America Mobile Medical Apps Market Revenue (US$ Mn) Market Share by Applicationin 2022
- Figure 136: Latin America Mobile Medical Apps Market Attractiveness Analysis by Application, 2016-2032
- Figure 137: Latin America Mobile Medical Apps Market Revenue (US$ Mn) Market Share by End Userin 2022
- Figure 138: Latin America Mobile Medical Apps Market Attractiveness Analysis by End User, 2016-2032
- Figure 139: Latin America Mobile Medical Apps Market Revenue (US$ Mn) Market Share by Country in 2022
- Figure 140: Latin America Mobile Medical Apps Market Attractiveness Analysis by Country, 2016-2032
- Figure 141: Latin America Mobile Medical Apps Market Revenue (US$ Mn) (2016-2032)
- Figure 142: Latin America Mobile Medical Apps Market Revenue (US$ Mn) Comparison by Country (2016-2032)
- Figure 143: Latin America Mobile Medical Apps Market Revenue (US$ Mn) Comparison by Therapeutic Area (2016-2032)
- Figure 144: Latin America Mobile Medical Apps Market Revenue (US$ Mn) Comparison by Model (2016-2032)
- Figure 145: Latin America Mobile Medical Apps Market Revenue (US$ Mn) Comparison by Application (2016-2032)
- Figure 146: Latin America Mobile Medical Apps Market Revenue (US$ Mn) Comparison by End User (2016-2032)
- Figure 147: Latin America Mobile Medical Apps Market Y-o-Y Growth Rate Comparison by Country (2016-2032)
- Figure 148: Latin America Mobile Medical Apps Market Y-o-Y Growth Rate Comparison by Therapeutic Area (2016-2032)
- Figure 149: Latin America Mobile Medical Apps Market Y-o-Y Growth Rate Comparison by Model (2016-2032)
- Figure 150: Latin America Mobile Medical Apps Market Y-o-Y Growth Rate Comparison by Application (2016-2032)
- Figure 151: Latin America Mobile Medical Apps Market Y-o-Y Growth Rate Comparison by End User (2016-2032)
- Figure 152: Latin America Mobile Medical Apps Market Share Comparison by Country (2016-2032)
- Figure 153: Latin America Mobile Medical Apps Market Share Comparison by Therapeutic Area (2016-2032)
- Figure 154: Latin America Mobile Medical Apps Market Share Comparison by Model (2016-2032)
- Figure 155: Latin America Mobile Medical Apps Market Share Comparison by Application (2016-2032)
- Figure 156: Latin America Mobile Medical Apps Market Share Comparison by End User (2016-2032)
- Figure 157: Middle East & Africa Mobile Medical Apps Market Revenue (US$ Mn) Market Share by Therapeutic Areain 2022
- Figure 158: Middle East & Africa Mobile Medical Apps Market Attractiveness Analysis by Therapeutic Area, 2016-2032
- Figure 159: Middle East & Africa Mobile Medical Apps Market Revenue (US$ Mn) Market Share by Modelin 2022
- Figure 160: Middle East & Africa Mobile Medical Apps Market Attractiveness Analysis by Model, 2016-2032
- Figure 161: Middle East & Africa Mobile Medical Apps Market Revenue (US$ Mn) Market Share by Applicationin 2022
- Figure 162: Middle East & Africa Mobile Medical Apps Market Attractiveness Analysis by Application, 2016-2032
- Figure 163: Middle East & Africa Mobile Medical Apps Market Revenue (US$ Mn) Market Share by End Userin 2022
- Figure 164: Middle East & Africa Mobile Medical Apps Market Attractiveness Analysis by End User, 2016-2032
- Figure 165: Middle East & Africa Mobile Medical Apps Market Revenue (US$ Mn) Market Share by Country in 2022
- Figure 166: Middle East & Africa Mobile Medical Apps Market Attractiveness Analysis by Country, 2016-2032
- Figure 167: Middle East & Africa Mobile Medical Apps Market Revenue (US$ Mn) (2016-2032)
- Figure 168: Middle East & Africa Mobile Medical Apps Market Revenue (US$ Mn) Comparison by Country (2016-2032)
- Figure 169: Middle East & Africa Mobile Medical Apps Market Revenue (US$ Mn) Comparison by Therapeutic Area (2016-2032)
- Figure 170: Middle East & Africa Mobile Medical Apps Market Revenue (US$ Mn) Comparison by Model (2016-2032)
- Figure 171: Middle East & Africa Mobile Medical Apps Market Revenue (US$ Mn) Comparison by Application (2016-2032)
- Figure 172: Middle East & Africa Mobile Medical Apps Market Revenue (US$ Mn) Comparison by End User (2016-2032)
- Figure 173: Middle East & Africa Mobile Medical Apps Market Y-o-Y Growth Rate Comparison by Country (2016-2032)
- Figure 174: Middle East & Africa Mobile Medical Apps Market Y-o-Y Growth Rate Comparison by Therapeutic Area (2016-2032)
- Figure 175: Middle East & Africa Mobile Medical Apps Market Y-o-Y Growth Rate Comparison by Model (2016-2032)
- Figure 176: Middle East & Africa Mobile Medical Apps Market Y-o-Y Growth Rate Comparison by Application (2016-2032)
- Figure 177: Middle East & Africa Mobile Medical Apps Market Y-o-Y Growth Rate Comparison by End User (2016-2032)
- Figure 178: Middle East & Africa Mobile Medical Apps Market Share Comparison by Country (2016-2032)
- Figure 179: Middle East & Africa Mobile Medical Apps Market Share Comparison by Therapeutic Area (2016-2032)
- Figure 180: Middle East & Africa Mobile Medical Apps Market Share Comparison by Model (2016-2032)
- Figure 181: Middle East & Africa Mobile Medical Apps Market Share Comparison by Application (2016-2032)
- Figure 182: Middle East & Africa Mobile Medical Apps Market Share Comparison by End User (2016-2032)
- Table 1: Global Mobile Medical Apps Market Comparison by Therapeutic Area (2016-2032)
- Table 2: Global Mobile Medical Apps Market Comparison by Model (2016-2032)
- Table 3: Global Mobile Medical Apps Market Comparison by Application (2016-2032)
- Table 4: Global Mobile Medical Apps Market Comparison by End User (2016-2032)
- Table 5: Global Mobile Medical Apps Market Revenue (US$ Mn) Comparison by Region (2016-2032)
- Table 6: Global Mobile Medical Apps Market Revenue (US$ Mn) (2016-2032)
- Table 7: Global Mobile Medical Apps Market Revenue (US$ Mn) Comparison by Region (2016-2032)
- Table 8: Global Mobile Medical Apps Market Revenue (US$ Mn) Comparison by Therapeutic Area (2016-2032)
- Table 9: Global Mobile Medical Apps Market Revenue (US$ Mn) Comparison by Model (2016-2032)
- Table 10: Global Mobile Medical Apps Market Revenue (US$ Mn) Comparison by Application (2016-2032)
- Table 11: Global Mobile Medical Apps Market Revenue (US$ Mn) Comparison by End User (2016-2032)
- Table 12: Global Mobile Medical Apps Market Y-o-Y Growth Rate Comparison by Region (2016-2032)
- Table 13: Global Mobile Medical Apps Market Y-o-Y Growth Rate Comparison by Therapeutic Area (2016-2032)
- Table 14: Global Mobile Medical Apps Market Y-o-Y Growth Rate Comparison by Model (2016-2032)
- Table 15: Global Mobile Medical Apps Market Y-o-Y Growth Rate Comparison by Application (2016-2032)
- Table 16: Global Mobile Medical Apps Market Y-o-Y Growth Rate Comparison by End User (2016-2032)
- Table 17: Global Mobile Medical Apps Market Share Comparison by Region (2016-2032)
- Table 18: Global Mobile Medical Apps Market Share Comparison by Therapeutic Area (2016-2032)
- Table 19: Global Mobile Medical Apps Market Share Comparison by Model (2016-2032)
- Table 20: Global Mobile Medical Apps Market Share Comparison by Application (2016-2032)
- Table 21: Global Mobile Medical Apps Market Share Comparison by End User (2016-2032)
- Table 22: North America Mobile Medical Apps Market Comparison by Model (2016-2032)
- Table 23: North America Mobile Medical Apps Market Comparison by Application (2016-2032)
- Table 24: North America Mobile Medical Apps Market Comparison by End User (2016-2032)
- Table 25: North America Mobile Medical Apps Market Revenue (US$ Mn) Comparison by Country (2016-2032)
- Table 26: North America Mobile Medical Apps Market Revenue (US$ Mn) (2016-2032)
- Table 27: North America Mobile Medical Apps Market Revenue (US$ Mn) Comparison by Country (2016-2032)
- Table 28: North America Mobile Medical Apps Market Revenue (US$ Mn) Comparison by Therapeutic Area (2016-2032)
- Table 29: North America Mobile Medical Apps Market Revenue (US$ Mn) Comparison by Model (2016-2032)
- Table 30: North America Mobile Medical Apps Market Revenue (US$ Mn) Comparison by Application (2016-2032)
- Table 31: North America Mobile Medical Apps Market Revenue (US$ Mn) Comparison by End User (2016-2032)
- Table 32: North America Mobile Medical Apps Market Y-o-Y Growth Rate Comparison by Country (2016-2032)
- Table 33: North America Mobile Medical Apps Market Y-o-Y Growth Rate Comparison by Therapeutic Area (2016-2032)
- Table 34: North America Mobile Medical Apps Market Y-o-Y Growth Rate Comparison by Model (2016-2032)
- Table 35: North America Mobile Medical Apps Market Y-o-Y Growth Rate Comparison by Application (2016-2032)
- Table 36: North America Mobile Medical Apps Market Y-o-Y Growth Rate Comparison by End User (2016-2032)
- Table 37: North America Mobile Medical Apps Market Share Comparison by Country (2016-2032)
- Table 38: North America Mobile Medical Apps Market Share Comparison by Therapeutic Area (2016-2032)
- Table 39: North America Mobile Medical Apps Market Share Comparison by Model (2016-2032)
- Table 40: North America Mobile Medical Apps Market Share Comparison by Application (2016-2032)
- Table 41: North America Mobile Medical Apps Market Share Comparison by End User (2016-2032)
- Table 42: Western Europe Mobile Medical Apps Market Comparison by Therapeutic Area (2016-2032)
- Table 43: Western Europe Mobile Medical Apps Market Comparison by Model (2016-2032)
- Table 44: Western Europe Mobile Medical Apps Market Comparison by Application (2016-2032)
- Table 45: Western Europe Mobile Medical Apps Market Comparison by End User (2016-2032)
- Table 46: Western Europe Mobile Medical Apps Market Revenue (US$ Mn) Comparison by Country (2016-2032)
- Table 47: Western Europe Mobile Medical Apps Market Revenue (US$ Mn) (2016-2032)
- Table 48: Western Europe Mobile Medical Apps Market Revenue (US$ Mn) Comparison by Country (2016-2032)
- Table 49: Western Europe Mobile Medical Apps Market Revenue (US$ Mn) Comparison by Therapeutic Area (2016-2032)
- Table 50: Western Europe Mobile Medical Apps Market Revenue (US$ Mn) Comparison by Model (2016-2032)
- Table 51: Western Europe Mobile Medical Apps Market Revenue (US$ Mn) Comparison by Application (2016-2032)
- Table 52: Western Europe Mobile Medical Apps Market Revenue (US$ Mn) Comparison by End User (2016-2032)
- Table 53: Western Europe Mobile Medical Apps Market Y-o-Y Growth Rate Comparison by Country (2016-2032)
- Table 54: Western Europe Mobile Medical Apps Market Y-o-Y Growth Rate Comparison by Therapeutic Area (2016-2032)
- Table 55: Western Europe Mobile Medical Apps Market Y-o-Y Growth Rate Comparison by Model (2016-2032)
- Table 56: Western Europe Mobile Medical Apps Market Y-o-Y Growth Rate Comparison by Application (2016-2032)
- Table 57: Western Europe Mobile Medical Apps Market Y-o-Y Growth Rate Comparison by End User (2016-2032)
- Table 58: Western Europe Mobile Medical Apps Market Share Comparison by Country (2016-2032)
- Table 59: Western Europe Mobile Medical Apps Market Share Comparison by Therapeutic Area (2016-2032)
- Table 60: Western Europe Mobile Medical Apps Market Share Comparison by Model (2016-2032)
- Table 61: Western Europe Mobile Medical Apps Market Share Comparison by Application (2016-2032)
- Table 62: Western Europe Mobile Medical Apps Market Share Comparison by End User (2016-2032)
- Table 63: Eastern Europe Mobile Medical Apps Market Comparison by Therapeutic Area (2016-2032)
- Table 64: Eastern Europe Mobile Medical Apps Market Comparison by Model (2016-2032)
- Table 65: Eastern Europe Mobile Medical Apps Market Comparison by Application (2016-2032)
- Table 66: Eastern Europe Mobile Medical Apps Market Comparison by End User (2016-2032)
- Table 67: Eastern Europe Mobile Medical Apps Market Revenue (US$ Mn) Comparison by Country (2016-2032)
- Table 68: Eastern Europe Mobile Medical Apps Market Revenue (US$ Mn) (2016-2032)
- Table 69: Eastern Europe Mobile Medical Apps Market Revenue (US$ Mn) Comparison by Country (2016-2032)
- Table 70: Eastern Europe Mobile Medical Apps Market Revenue (US$ Mn) Comparison by Therapeutic Area (2016-2032)
- Table 71: Eastern Europe Mobile Medical Apps Market Revenue (US$ Mn) Comparison by Model (2016-2032)
- Table 72: Eastern Europe Mobile Medical Apps Market Revenue (US$ Mn) Comparison by Application (2016-2032)
- Table 73: Eastern Europe Mobile Medical Apps Market Revenue (US$ Mn) Comparison by End User (2016-2032)
- Table 74: Eastern Europe Mobile Medical Apps Market Y-o-Y Growth Rate Comparison by Country (2016-2032)
- Table 75: Eastern Europe Mobile Medical Apps Market Y-o-Y Growth Rate Comparison by Therapeutic Area (2016-2032)
- Table 76: Eastern Europe Mobile Medical Apps Market Y-o-Y Growth Rate Comparison by Model (2016-2032)
- Table 77: Eastern Europe Mobile Medical Apps Market Y-o-Y Growth Rate Comparison by Application (2016-2032)
- Table 78: Eastern Europe Mobile Medical Apps Market Y-o-Y Growth Rate Comparison by End User (2016-2032)
- Table 79: Eastern Europe Mobile Medical Apps Market Share Comparison by Country (2016-2032)
- Table 80: Eastern Europe Mobile Medical Apps Market Share Comparison by Therapeutic Area (2016-2032)
- Table 81: Eastern Europe Mobile Medical Apps Market Share Comparison by Model (2016-2032)
- Table 82: Eastern Europe Mobile Medical Apps Market Share Comparison by Application (2016-2032)
- Table 83: Eastern Europe Mobile Medical Apps Market Share Comparison by End User (2016-2032)
- Table 84: APAC Mobile Medical Apps Market Comparison by Therapeutic Area (2016-2032)
- Table 85: APAC Mobile Medical Apps Market Comparison by Model (2016-2032)
- Table 86: APAC Mobile Medical Apps Market Comparison by Application (2016-2032)
- Table 87: APAC Mobile Medical Apps Market Comparison by End User (2016-2032)
- Table 88: APAC Mobile Medical Apps Market Revenue (US$ Mn) Comparison by Country (2016-2032)
- Table 89: APAC Mobile Medical Apps Market Revenue (US$ Mn) (2016-2032)
- Table 90: APAC Mobile Medical Apps Market Revenue (US$ Mn) Comparison by Country (2016-2032)
- Table 91: APAC Mobile Medical Apps Market Revenue (US$ Mn) Comparison by Therapeutic Area (2016-2032)
- Table 92: APAC Mobile Medical Apps Market Revenue (US$ Mn) Comparison by Model (2016-2032)
- Table 93: APAC Mobile Medical Apps Market Revenue (US$ Mn) Comparison by Application (2016-2032)
- Table 94: APAC Mobile Medical Apps Market Revenue (US$ Mn) Comparison by End User (2016-2032)
- Table 95: APAC Mobile Medical Apps Market Y-o-Y Growth Rate Comparison by Country (2016-2032)
- Table 96: APAC Mobile Medical Apps Market Y-o-Y Growth Rate Comparison by Therapeutic Area (2016-2032)
- Table 97: APAC Mobile Medical Apps Market Y-o-Y Growth Rate Comparison by Model (2016-2032)
- Table 98: APAC Mobile Medical Apps Market Y-o-Y Growth Rate Comparison by Application (2016-2032)
- Table 99: APAC Mobile Medical Apps Market Y-o-Y Growth Rate Comparison by End User (2016-2032)
- Table 100: APAC Mobile Medical Apps Market Share Comparison by Country (2016-2032)
- Table 101: APAC Mobile Medical Apps Market Share Comparison by Therapeutic Area (2016-2032)
- Table 102: APAC Mobile Medical Apps Market Share Comparison by Model (2016-2032)
- Table 103: APAC Mobile Medical Apps Market Share Comparison by Application (2016-2032)
- Table 104: APAC Mobile Medical Apps Market Share Comparison by End User (2016-2032)
- Table 105: Latin America Mobile Medical Apps Market Comparison by Therapeutic Area (2016-2032)
- Table 106: Latin America Mobile Medical Apps Market Comparison by Model (2016-2032)
- Table 107: Latin America Mobile Medical Apps Market Comparison by Application (2016-2032)
- Table 108: Latin America Mobile Medical Apps Market Comparison by End User (2016-2032)
- Table 109: Latin America Mobile Medical Apps Market Revenue (US$ Mn) Comparison by Country (2016-2032)
- Table 110: Latin America Mobile Medical Apps Market Revenue (US$ Mn) (2016-2032)
- Table 111: Latin America Mobile Medical Apps Market Revenue (US$ Mn) Comparison by Country (2016-2032)
- Table 112: Latin America Mobile Medical Apps Market Revenue (US$ Mn) Comparison by Therapeutic Area (2016-2032)
- Table 113: Latin America Mobile Medical Apps Market Revenue (US$ Mn) Comparison by Model (2016-2032)
- Table 114: Latin America Mobile Medical Apps Market Revenue (US$ Mn) Comparison by Application (2016-2032)
- Table 115: Latin America Mobile Medical Apps Market Revenue (US$ Mn) Comparison by End User (2016-2032)
- Table 116: Latin America Mobile Medical Apps Market Y-o-Y Growth Rate Comparison by Country (2016-2032)
- Table 117: Latin America Mobile Medical Apps Market Y-o-Y Growth Rate Comparison by Therapeutic Area (2016-2032)
- Table 118: Latin America Mobile Medical Apps Market Y-o-Y Growth Rate Comparison by Model (2016-2032)
- Table 119: Latin America Mobile Medical Apps Market Y-o-Y Growth Rate Comparison by Application (2016-2032)
- Table 120: Latin America Mobile Medical Apps Market Y-o-Y Growth Rate Comparison by End User (2016-2032)
- Table 121: Latin America Mobile Medical Apps Market Share Comparison by Country (2016-2032)
- Table 122: Latin America Mobile Medical Apps Market Share Comparison by Therapeutic Area (2016-2032)
- Table 123: Latin America Mobile Medical Apps Market Share Comparison by Model (2016-2032)
- Table 124: Latin America Mobile Medical Apps Market Share Comparison by Application (2016-2032)
- Table 125: Latin America Mobile Medical Apps Market Share Comparison by End User (2016-2032)
- Table 126: Middle East & Africa Mobile Medical Apps Market Comparison by Therapeutic Area (2016-2032)
- Table 127: Middle East & Africa Mobile Medical Apps Market Comparison by Model (2016-2032)
- Table 128: Middle East & Africa Mobile Medical Apps Market Comparison by Application (2016-2032)
- Table 129: Middle East & Africa Mobile Medical Apps Market Comparison by End User (2016-2032)
- Table 130: Middle East & Africa Mobile Medical Apps Market Revenue (US$ Mn) Comparison by Country (2016-2032)
- Table 131: Middle East & Africa Mobile Medical Apps Market Revenue (US$ Mn) (2016-2032)
- Table 132: Middle East & Africa Mobile Medical Apps Market Revenue (US$ Mn) Comparison by Country (2016-2032)
- Table 133: Middle East & Africa Mobile Medical Apps Market Revenue (US$ Mn) Comparison by Therapeutic Area (2016-2032)
- Table 134: Middle East & Africa Mobile Medical Apps Market Revenue (US$ Mn) Comparison by Model (2016-2032)
- Table 135: Middle East & Africa Mobile Medical Apps Market Revenue (US$ Mn) Comparison by Application (2016-2032)
- Table 136: Middle East & Africa Mobile Medical Apps Market Revenue (US$ Mn) Comparison by End User (2016-2032)
- Table 137: Middle East & Africa Mobile Medical Apps Market Y-o-Y Growth Rate Comparison by Country (2016-2032)
- Table 138: Middle East & Africa Mobile Medical Apps Market Y-o-Y Growth Rate Comparison by Therapeutic Area (2016-2032)
- Table 139: Middle East & Africa Mobile Medical Apps Market Y-o-Y Growth Rate Comparison by Model (2016-2032)
- Table 140: Middle East & Africa Mobile Medical Apps Market Y-o-Y Growth Rate Comparison by Application (2016-2032)
- Table 141: Middle East & Africa Mobile Medical Apps Market Y-o-Y Growth Rate Comparison by End User (2016-2032)
- Table 142: Middle East & Africa Mobile Medical Apps Market Share Comparison by Country (2016-2032)
- Table 143: Middle East & Africa Mobile Medical Apps Market Share Comparison by Therapeutic Area (2016-2032)
- Table 144: Middle East & Africa Mobile Medical Apps Market Share Comparison by Model (2016-2032)
- Table 145: Middle East & Africa Mobile Medical Apps Market Share Comparison by Application (2016-2032)
- Table 146: Middle East & Africa Mobile Medical Apps Market Share Comparison by End User (2016-2032)
- 1. Executive Summary
Inquiry Form
Why Choose Us
- 360 Degree Approach
- Growth Consulting
- 24/7 Research Support
- Comprehensive-Level of Customization
- Competitive Intelligence
- Single-Country/ Region Intelligence
- Post-Sale Service Assistance
- Access to Lead Analysts
- Available in PDF, Excel, Word/ PPT
Request for Customization
OUR CLIENTS
Don't just take our word. We are trusted by these great companies!