
Mobile Mapping Market By Type Analysis (Indoor Mapping, Location-Based Services (LBS), Others), By End-Use Industry(Construction, Energy & Utilities, Others), By Region And Companies - Industry Segment Outlook, Market Assessment, Competition Scenario, Trends, And Forecast 2023-2032
-
25931
-
Jul 2023
-
156
-


-
This report was compiled by Vishwa Gaul Vishwa is an experienced market research and consulting professional with over 8 years of expertise in the ICT industry, contributing to over 700 reports across telecommunications, software, hardware, and digital solutions. Correspondence Team Lead- ICT Linkedin | Detailed Market research Methodology Our methodology involves a mix of primary research, including interviews with leading mental health experts, and secondary research from reputable medical journals and databases. View Detailed Methodology Page
-
Quick Navigation
Report Overview
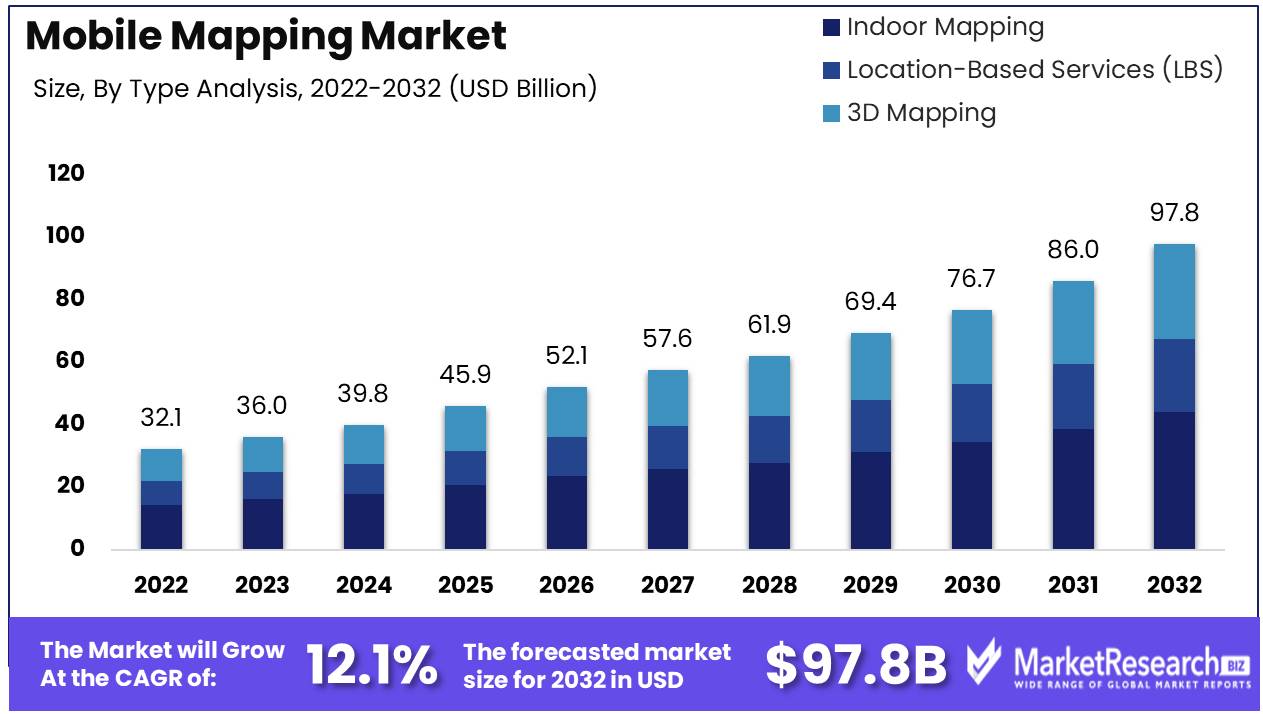
Mobile Mapping Market size is expected to be worth around USD 97.8 Bn by 2032 from USD 32.1 Bn in 2022, growing at a CAGR of 12.1% during the forecast period from 2023 to 2032.
The mobile mapping market is a captivating tapestry in which spatial data is collected and processed by mobile devices. Smartphones, tablets, and other portable marvels orchestrate this informational symphony, providing businesses with real-time data for making informed decisions.
The advent of mobile mapping technology has revolutionized data collection and analysis, liberating businesses from the limitations of conventional methods. Compared to the time-consuming and expensive methods of the past, mobile mapping gathers data quickly and effectively. Real-time data enables businesses to make prompt decisions and maintain a competitive advantage.
In this ever-changing environment, innovation thrives like stars in the night sky. LiDAR (Light Detection and Ranging) technology constitutes a significant advancement. LiDAR collects precise spatial data using laser beams, providing businesses with crucial insights. As a remarkable innovation in the mobile mapping market, drones also ascend. They provide a cost-effective alternative to manual data acquisition, reducing the need for labor. To efficiently obtain spatial data, businesses can now harness the aerial prowess of drones.
Several industries, including the automotive, transportation, construction, and healthcare sectors, have invested in the mobile mapping market. These industries recognize the importance of mobile mapping solutions for the collection and analysis of spatial data. Google, Apple, and Microsoft have made substantial investments to refine their mapping services to provide users with accurate and real-time data.
Driving factors
Demand for 3D Mapping and Modeling Is Growing
Due to the increasing demand for 3D mapping and modeling in a variety of industries, the mobile mapping market is experiencing significant growth. Particularly fueling this demand are the transportation, urban planning, and emergency management industries. As these industries continue to expand and modernize, the demand for accurate and current mapping data will increase.
Defense and Aerospace Industries
Increasing demand for intelligence in the defense and aerospace industries is also driving the growth of the mobile mapping market. This has resulted in a significant increase in the use of mapping solutions based on drones, which provide highly detailed real-time aerial imagery. As these technologies become more widely adopted, we can anticipate the emergence of numerous mobile mapping use cases in a variety of industries.
Localized Services and Advertising
The increasing prevalence of location-based services (LBS) and location-based marketing is another factor fueling the growth of the mobile mapping market. Utilizing geolocation data, businesses are gaining valuable insights into consumer behavior and preferences, enabling them to tailor their offerings and marketing messages accordingly. As this trend acquires momentum, it is anticipated that the mobile mapping market will continue its rapid expansion.
Restraining Factors
Limited Laser Range in Mobile Mapping Devices
The limited laser range of mobile mapping devices is one of the primary restraints on the mobile mapping industry. Most mobile mapping devices have limited laser range, making it difficult to map distant regions. This means that as the objective object moves away from the device, the collected data become less precise. In addition, the limited range of mobile mapping devices limits their map-making capabilities; even with high-resolution cameras, it is difficult to obtain accurate images of distant objects.
High Cost of Mobile Mapping Technology
The high cost of advanced mobile mapping technology is an additional industry constraint. The price of mobile mapping hardware and software has been decreasing, but many organizations are still unable to afford it, limiting their access to the technology. Additionally, the infrastructure required for the devices, the cost of training and employing competent professionals, and the cost of maintenance are all relatively high. This restriction restricts the number of organizations that can utilize the technology, thereby making it difficult for businesses to remain competitive.
Limited Access to Qualified Professionals
The mobile mapping industry is highly dependent on the operation and maintenance of devices by trained professionals. The problem is that there are insufficient experts in this discipline, making it difficult for organizations to locate competent professionals. This leads to intense competition for available talent, which in turn results in high labor costs. This problem is particularly prevalent in regions with low rates of education, where the limited number of trained professionals is insufficient to satisfy the growing demand. This means that the vast majority of organizations have limited access to specialized knowledge and expertise.
Type Analysis
Over the years, the mobile mapping market has experienced tremendous growth, with the indoor mapping segment dominating the industry. This expansion is fueled by the increasing use of smartphones, the demand for location-based services, and the requirement for real-time data analysis. Indoor mapping is essential for retail, hospitality, and healthcare industries. It assists them in optimizing their operations, enhancing the customer experience, and decreasing operating expenses.
Emerging economies are propelling the adoption of indoor mapping through economic growth. Governments are making substantial investments in infrastructure development and smart city initiatives, which require precise indoor mapping. The rise in discretionary income of the middle class in these nations is driving the expansion of the retail and hospitality industries, which in turn increases the demand for indoor mapping.
Trends in consumer behavior and attitudes toward indoor mapping have also played a substantial role in its adoption. Consumers progressively utilize mobile devices to access location-based services in real time. Indoor mapping enables them to navigate intricate indoor environments such as airports and retail malls, thereby enhancing their experience.
End-Use Industry Analysis
The construction industry segment dominates the mobile mapping market, holding the greatest market share. This segment's development is driven by the demand for accurate and current data on construction sites. Mobile mapping technology enables construction professionals to collect, analyze, and share location-based data, thereby enhancing project efficacy and lowering expenses.
The adoption of the construction segment is influenced by the economic growth of emerging economies. Governments in these nations are making substantial investments in infrastructure development, which necessitates precise location-based data. The increase in discretionary income of the middle class in these nations is propelling the expansion of the construction industry and boosting the demand for mobile mapping technology.
The trend and behavior of consumers toward the construction market segment also drive its adoption. Increasingly, consumers demand sustainable and energy-efficient structures. Mobile mapping technology enables construction professionals to collect information on the environmental impact of construction, thereby ensuring that buildings are constructed to meet these requirements.
Technology Analysis
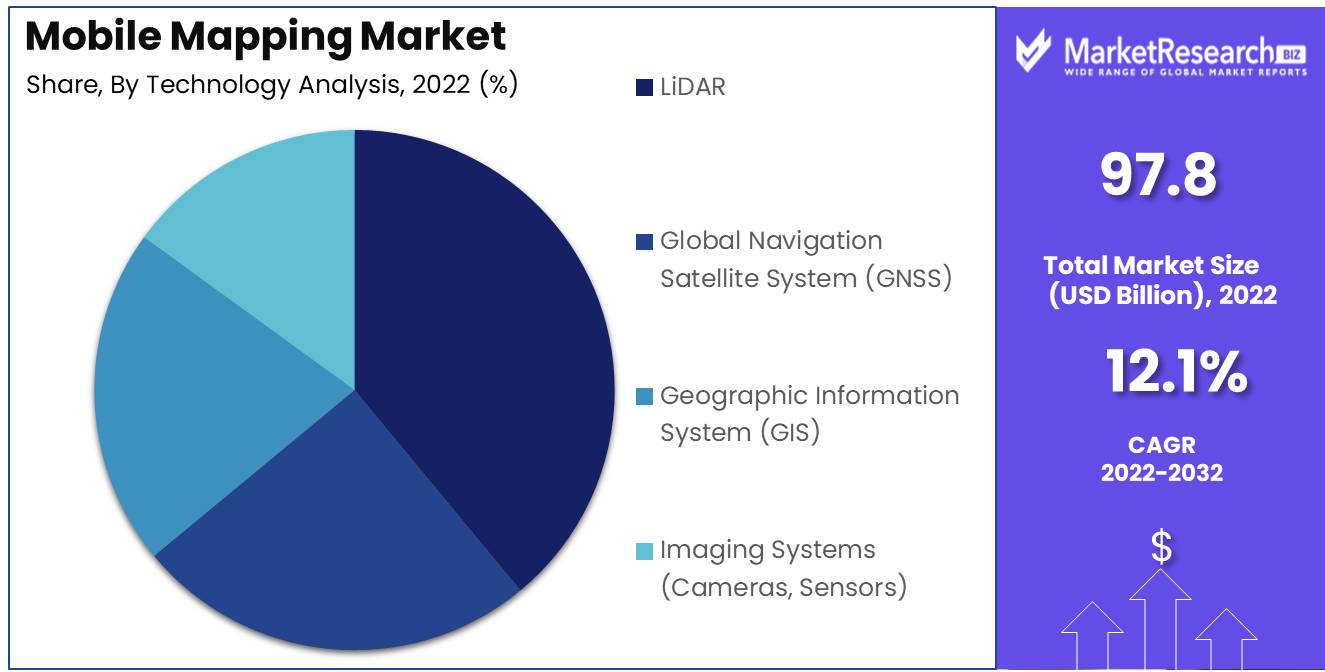
The LiDAR segment dominates the mobile mapping market with the highest market share. LiDAR (Light Detection and Ranging) is a remote sensing technology that creates highly accurate and detailed 3D maps of the environment using laser beams.
The adoption of the LiDAR segment is driven by economic growth in emerging economies. Governments in these nations are making substantial investments in infrastructure development and smart city initiatives, which require precise location-based data. The increase in discretionary income of the middle class in these nations is driving the expansion of the automotive and transportation industries, which in turn increases the demand for LiDAR technology.
The trend and behavior of consumers toward the LiDAR market segment also drive its adoption. The demand for autonomous vehicles and highly accurate location-based services is increasing among consumers. LiDAR technology enables these services by providing extremely precise and real-time location data.
Key Market Segments
By Type Analysis
- Indoor Mapping
- Location-Based Services (LBS)
- 3D Mapping
By End-Use Industry
- Construction
- Energy & Utilities
- Transportation & Logistics
- Retail
- Government & Public Sector
- Manufacturing
- Others
By Technology Analysis
- LiDAR
- Global Navigation Satellite System (GNSS)
- Geographic Information System (GIS)
- Imaging Systems (Cameras, Sensors)
Growth Opportunity
Demand for Real-Time Mapping is Growing
The real-time mapping market is expected to grow significantly as businesses across industries attempt to optimize their operations by utilizing location data. This data, which can be used to enhance logistics, fleet management, and emergency response services, can be collected cost-effectively and precisely with mobile mapping technology. Google Maps, Waze, and Uber are a few examples of how mobile mapping has evolved into an indispensable utility for consumers and businesses.
Mobile Mapping Adoption in Smart Cities
Smart cities are an emerging trend that integrates multiple technologies, such as mobile mapping, sensors, and the Internet of Things (IoT), to optimize city services and enhance the quality of life for residents. Mobile mapping is essential for the development of a smart city ecosystem, as it provides real-time traffic data and monitors public transportation routes. Mobile mapping can also improve public safety by detecting traffic accidents and monitoring emergency vehicles.
Expansion of Driverless Automobiles
The introduction of autonomous vehicles is expected to revolutionize the transportation industry, making transportation of people and products safer and more efficient. Mobile mapping technology is essential to the development of autonomous vehicles because it enables vehicles to navigate through the most complex and dynamic environments. Mobile mapping technology provides real-time location data that enables autonomous vehicles to detect and react to changes in the road environment, such as other vehicles, pedestrians, and obstacles.
Drone and Mobile Mapping Integration
Drones are gaining popularity for a variety of uses, including photography and videography as well as search and rescue missions. Mobile mapping technology is also being adopted by the drone industry, as it provides precise location data that enables drones to navigate in complex environments. Utilizing mobile mapping integration with drones, industries such as mining and agriculture are producing high-resolution 3D maps and gaining valuable insights regarding agricultural health and soil conditions.
Latest Trends
Increasing Interest in 3D Mobile Mapping Technology
In recent years, the demand for 3D mobile mapping technology has increased dramatically due to its ability to provide more accurate and detailed information about the environment than 2D mapping. This technology permits a more extensive view of buildings, roads, and other structures than was previously conceivable. With the advent of high-resolution cameras and sophisticated software, 3D mapping has become a popular tool for a variety of applications, including urban planning, construction, and engineering.
The incorporation of artificial intelligence (AI) and machine learning (ML) technologies
The mobile mapping market is being rapidly transformed by artificial intelligence (AI) and machine learning (ML) technologies. These technologies have the potential to considerably enhance the precision and efficacy of mapping procedures and enable the analysis of larger data volumes. With the incorporation of AI and ML, mobile mapping technologies can provide more accurate results in less time, making them an indispensable tool for a variety of industries.
Improved data storage
The management and storage of large volumes of data have been one of the main obstacles facing the mobile mapping industry. Recent advancements in data storage technologies and infrastructure have made data management and processing more efficient. This has enabled the production of more accurate and detailed mapping results and facilitated the sharing and analysis of data.
Unmanned aerial vehicle (UAV) emergence
UAVs have emerged as a game-changing technology in the mobile mapping market. These drones are capable of capturing high-resolution images and other data in inaccessible locations, making them an ideal mapping tool for difficult terrain, inaccessible areas, and natural disaster-affected regions. The ability to collect real-time data with UAVs has significant applications in a variety of industries, including agriculture, construction, and disaster relief.
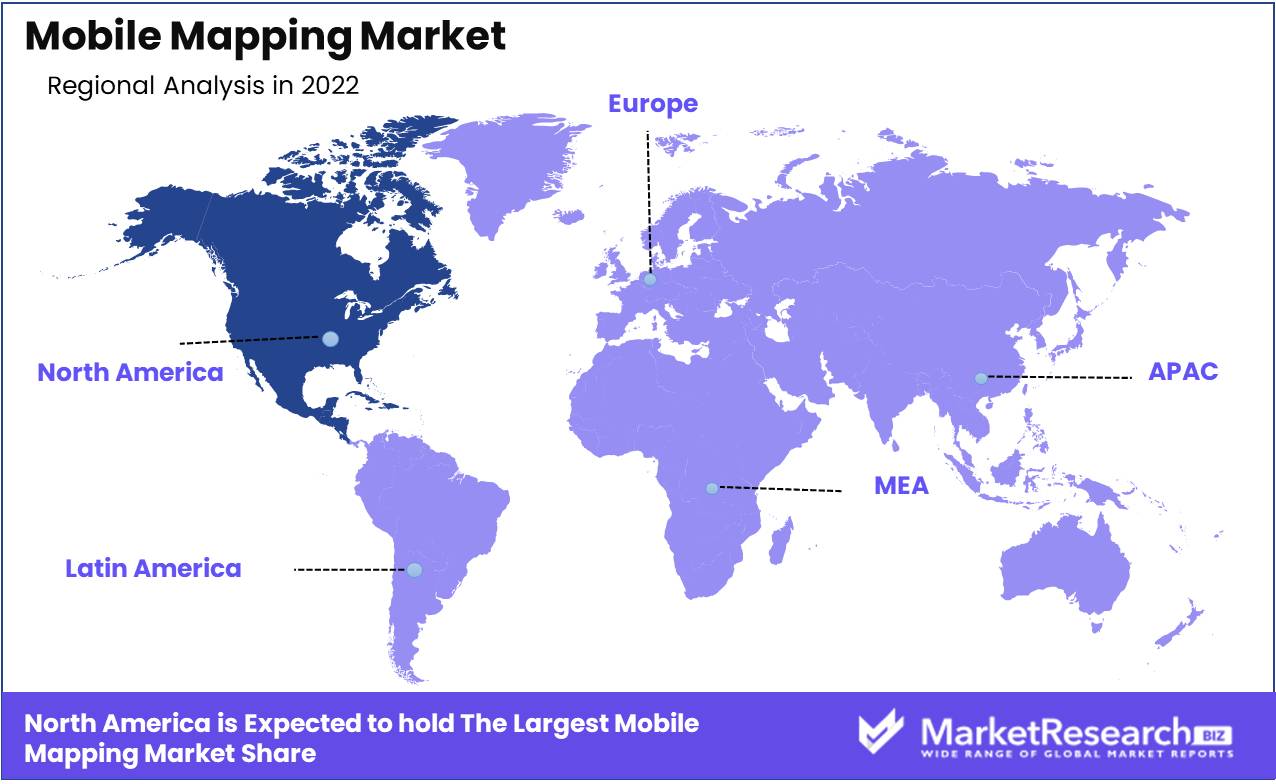
Regional Analysis
North America, and the United States in particular, is home to a large number of leading technology companies and research institutions. These organizations promote technological advancements in mobile mapping, such as the development of cutting-edge mapping technologies, algorithms, and data processing techniques. Expertise and innovation in the field provide the region with a competitive advantage, allowing it to dominate the market.
Numerous North American industries, including transportation, logistics, urban planning, and defense, have implemented mobile mapping solutions extensively. These industries have recognized the importance of accurate and current mapping data for their operations, efficiency, and decision-making. North American industries' early adoption and integration of mobile mapping technologies have contributed to the region's dominance.
North America's infrastructure networks, including roads, railroads, and utilities, are well-established. The demand for mobile mapping solutions is driven by the need for accurate mapping and monitoring of these infrastructures, as well as ongoing expansion and maintenance projects. The region's superior infrastructure and demand for efficient asset management contribute to its market dominance in mobile mapping.
Key Regions and Countries
North America
- US
- Canada
- Mexico
Western Europe
- Germany
- France
- The UK
- Spain
- Italy
- Portugal
- Ireland
- Austria
- Switzerland
- Benelux
- Nordic
- Rest of Western Europe
Eastern Europe
- Russia
- Poland
- The Czech Republic
- Greece
- Rest of Eastern Europe
APAC
- China
- Japan
- South Korea
- India
- Australia & New Zealand
- Indonesia
- Malaysia
- Philippines
- Singapore
- Thailand
- Vietnam
- Rest of APAC
Latin America
- Brazil
- Colombia
- Chile
- Argentina
- Costa Rica
- Rest of Latin America
Middle East & Africa
- Algeria
- Egypt
- Israel
- Kuwait
- Nigeria
- Saudi Arabia
- South Africa
- Turkey
- United Arab Emirates
- Rest of MEA
Key Players Analysis
Google Maps is one of the major competitors in the mobile mapping market. Google Maps is perpetually improving its accuracy and adding new features, such as real-time traffic data and Street View. Through their mobile mapping technology, they have been able to offer consumers a variety of location-based services, including directions and recommendations.
Apple Maps is another significant player in this market. Apple Maps, which is preinstalled on all Apple devices, has substantially expanded its coverage over the years and become a user favorite. Apple Maps recently introduced a feature similar to Google Street View called aoeLook Around, which allows users to view their environs in a 360-degree view.
Here Technologies, Mapbox, TomTom, and Microsoft are also important participants in the mobile mapping market. These businesses specialize in providing location-based services to numerous industries, such as transportation, logistics, and smart cities.
Top Key Players in the Mobile Mapping Market
- Apple Maps
- Google Maps
- Tomtom NV
- Microsoft Corporation
- Mapbox
- HERE Technologies
- Garmin International
- Mitsubishi Electric Corporation
- OSI Geospatial Inc.
- Telefonaktiebolaget LM Ericsson
- Leica Geosystems Inc.
- Qualcomm Inc.
Recent Development
- In 2021, Google Maps received the Live View augmented reality navigation feature. This feature employs augmented reality technology to enhance users' navigational experience. When using Live View, users can hold their smartphone cameras aloft, and the app superimposes directional arrows and location data onto the real-world view displayed on the screen. This provides users with real-time, intuitive visual direction, making it simpler to navigate unfamiliar environments, especially in urban or complex settings.
- In 2022, Apple acquired the Spanish startup Vilynx. Vilynx specializes in AI-based video analysis and mapping technologies. This acquisition demonstrates Apple's intent to enhance its mapping capabilities by leveraging Vilynx's expertise in video content processing and comprehension. Apple intends to provide more accurate and comprehensive mapping data by integrating Vilynx's technology into its mapping platform, particularly in terms of real-time mapping updates and visual representation of locations. This acquisition also demonstrates Apple's commitment to enhancing its mapping service in order to remain competitive with other industry participants.
- In 2023, HERE Technologies introduced HERE XYZ, a cloud-based geospatial data management and sharing platform. HERE XYZ provides a user-friendly environment for developers, enterprises, and mapping enthusiasts to store, visualize, and collaborate on mapping data. The platform offers robust data administration tools, such as data organization, styling, and integration with other mapping services. HERE XYZ enables users to create and share customized maps with ease, fostering collaboration and improving the accessibility and efficacy of mapping data across a variety of applications.
Report Scope
Report Features Description Market Value (2022) USD 32.1 Bn Forecast Revenue (2032) USD 97.8 Bn CAGR (2023-2032) 12.1% Base Year for Estimation 2022 Historic Period 2016-2022 Forecast Period 2023-2032 Report Coverage Revenue Forecast, Market Dynamics, COVID-19 Impact, Competitive Landscape, Recent Developments Segments Covered By Type Analysis(Indoor Mapping, Location-Based Services (LBS), 3D Mapping), By End-Use Industry(Construction, Energy & Utilities, Transportation & Logistics, Retail, Government and public Sector, Manufacturing, Others), By Technology Analysis(LiDAR, Global Navigation Satellite System (GNSS), Geographic Information System (GIS), Imaging Systems (Cameras, Sensors)) Regional Analysis North America – The US, Canada, & Mexico; Western Europe – Germany, France, The UK, Spain, Italy, Portugal, Ireland, Austria, Switzerland, Benelux, Nordic, & Rest of Western Europe; Eastern Europe – Russia, Poland, The Czech Republic, Greece, & Rest of Eastern Europe; APAC – China, Japan, South Korea, India, Australia & New Zealand, Indonesia, Malaysia, Philippines, Singapore, Thailand, Vietnam, & Rest of APAC; Latin America – Brazil, Colombia, Chile, Argentina, Costa Rica, & Rest of Latin America; Middle East & Africa – Algeria, Egypt, Israel, Kuwait, Nigeria, Saudi Arabia, South Africa, Turkey, United Arab Emirates, & Rest of MEA Competitive Landscape Apple Maps, Google Maps, Tomtom NV, Microsoft Corporation, Mapbox, HERE Technologies, Garmin International, Mitsubishi Electric Corporation, OSI Geospatial Inc., Telefonaktiebolaget LM Ericsson, Leica Geosystems Inc., Qualcomm Inc. Customization Scope Customization for segments, region/country-level will be provided. Moreover, additional customization can be done based on the requirements. Purchase Options We have three licenses to opt for: Single User License, Multi-User License (Up to 5 Users), Corporate Use License (Unlimited User and Printable PDF) -
- 1. Executive Summary
- 1.1. Definition
- 1.2. Taxonomy
- 1.3. Research Scope
- 1.4. Key Analysis
- 1.5. Key Findings by Major Segments
- 1.6. Top strategies by Major Players
- 2. Global Mobile Mapping Market Overview
- 2.1. Mobile Mapping Market Dynamics
- 2.1.1. Drivers
- 2.1.2. Opportunities
- 2.1.3. Restraints
- 2.1.4. Challenges
- 2.2. Macro-economic Factors
- 2.3. Regulatory Framework
- 2.4. Market Investment Feasibility Index
- 2.5. PEST Analysis
- 2.6. PORTER’S Five Force Analysis
- 2.7. Drivers & Restraints Impact Analysis
- 2.8. Industry Chain Analysis
- 2.9. Cost Structure Analysis
- 2.10. Marketing Strategy
- 2.11. Russia-Ukraine War Impact Analysis
- 2.12. Opportunity Map Analysis
- 2.13. Market Competition Scenario Analysis
- 2.14. Product Life Cycle Analysis
- 2.15. Opportunity Orbits
- 2.16. Manufacturer Intensity Map
- 2.17. Major Companies sales by Value & Volume
- 2.1. Mobile Mapping Market Dynamics
- 3. Global Mobile Mapping Market Analysis, Opportunity and Forecast, 2016-2032
- 3.1. Global Mobile Mapping Market Analysis, 2016-2021
- 3.2. Global Mobile Mapping Market Opportunity and Forecast, 2023-2032
- 3.3. Global Mobile Mapping Market Analysis, Opportunity and Forecast, By By Type Analysis, 2016-2032
- 3.3.1. Global Mobile Mapping Market Analysis by By Type Analysis: Introduction
- 3.3.2. Market Size Absolute $ Opportunity Analysis and Forecast, By By Type Analysis, 2016-2032
- 3.3.3. Indoor Mapping
- 3.3.4. Location-Based Services (LBS)
- 3.3.5. 3D Mapping
- 3.4. Global Mobile Mapping Market Analysis, Opportunity and Forecast, By By End-Use Industry, 2016-2032
- 3.4.1. Global Mobile Mapping Market Analysis by By End-Use Industry: Introduction
- 3.4.2. Market Size Absolute $ Opportunity Analysis and Forecast, By By End-Use Industry, 2016-2032
- 3.4.3. Construction
- 3.4.4. Energy & Utilities
- 3.4.5. Transportation & Logistics
- 3.4.6. Retail
- 3.4.7. Government & Public Sector
- 3.4.8. Manufacturing
- 3.4.9. Others
- 3.5. Global Mobile Mapping Market Analysis, Opportunity and Forecast, By By Technology Analysis, 2016-2032
- 3.5.1. Global Mobile Mapping Market Analysis by By Technology Analysis: Introduction
- 3.5.2. Market Size Absolute $ Opportunity Analysis and Forecast, By By Technology Analysis, 2016-2032
- 3.5.3. LiDAR
- 3.5.4. Global Navigation Satellite System (GNSS)
- 3.5.5. Geographic Information System (GIS)
- 3.5.6. Imaging Systems (Cameras, Sensors)
- 3.6. Global Mobile Mapping Market Analysis, Opportunity and Forecast, By , 2016-2032
- 3.6.1. Global Mobile Mapping Market Analysis by : Introduction
- 3.6.2. Market Size Absolute $ Opportunity Analysis and Forecast, By , 2016-2032
- 4. North America Mobile Mapping Market Analysis, Opportunity and Forecast, 2016-2032
- 4.1. North America Mobile Mapping Market Analysis, 2016-2021
- 4.2. North America Mobile Mapping Market Opportunity and Forecast, 2023-2032
- 4.3. North America Mobile Mapping Market Analysis, Opportunity and Forecast, By By Type Analysis, 2016-2032
- 4.3.1. North America Mobile Mapping Market Analysis by By Type Analysis: Introduction
- 4.3.2. Market Size Absolute $ Opportunity Analysis and Forecast, By By Type Analysis, 2016-2032
- 4.3.3. Indoor Mapping
- 4.3.4. Location-Based Services (LBS)
- 4.3.5. 3D Mapping
- 4.4. North America Mobile Mapping Market Analysis, Opportunity and Forecast, By By End-Use Industry, 2016-2032
- 4.4.1. North America Mobile Mapping Market Analysis by By End-Use Industry: Introduction
- 4.4.2. Market Size Absolute $ Opportunity Analysis and Forecast, By By End-Use Industry, 2016-2032
- 4.4.3. Construction
- 4.4.4. Energy & Utilities
- 4.4.5. Transportation & Logistics
- 4.4.6. Retail
- 4.4.7. Government & Public Sector
- 4.4.8. Manufacturing
- 4.4.9. Others
- 4.5. North America Mobile Mapping Market Analysis, Opportunity and Forecast, By By Technology Analysis, 2016-2032
- 4.5.1. North America Mobile Mapping Market Analysis by By Technology Analysis: Introduction
- 4.5.2. Market Size Absolute $ Opportunity Analysis and Forecast, By By Technology Analysis, 2016-2032
- 4.5.3. LiDAR
- 4.5.4. Global Navigation Satellite System (GNSS)
- 4.5.5. Geographic Information System (GIS)
- 4.5.6. Imaging Systems (Cameras, Sensors)
- 4.6. North America Mobile Mapping Market Analysis, Opportunity and Forecast, By , 2016-2032
- 4.6.1. North America Mobile Mapping Market Analysis by : Introduction
- 4.6.2. Market Size Absolute $ Opportunity Analysis and Forecast, By , 2016-2032
- 4.7. North America Mobile Mapping Market Analysis, Opportunity and Forecast, By Country , 2016-2032
- 4.7.1. North America Mobile Mapping Market Analysis by Country : Introduction
- 4.7.2. Market Size Absolute $ Opportunity Analysis and Forecast, Country , 2016-2032
- 4.7.2.1. The US
- 4.7.2.2. Canada
- 4.7.2.3. Mexico
- 5. Western Europe Mobile Mapping Market Analysis, Opportunity and Forecast, 2016-2032
- 5.1. Western Europe Mobile Mapping Market Analysis, 2016-2021
- 5.2. Western Europe Mobile Mapping Market Opportunity and Forecast, 2023-2032
- 5.3. Western Europe Mobile Mapping Market Analysis, Opportunity and Forecast, By By Type Analysis, 2016-2032
- 5.3.1. Western Europe Mobile Mapping Market Analysis by By Type Analysis: Introduction
- 5.3.2. Market Size Absolute $ Opportunity Analysis and Forecast, By By Type Analysis, 2016-2032
- 5.3.3. Indoor Mapping
- 5.3.4. Location-Based Services (LBS)
- 5.3.5. 3D Mapping
- 5.4. Western Europe Mobile Mapping Market Analysis, Opportunity and Forecast, By By End-Use Industry, 2016-2032
- 5.4.1. Western Europe Mobile Mapping Market Analysis by By End-Use Industry: Introduction
- 5.4.2. Market Size Absolute $ Opportunity Analysis and Forecast, By By End-Use Industry, 2016-2032
- 5.4.3. Construction
- 5.4.4. Energy & Utilities
- 5.4.5. Transportation & Logistics
- 5.4.6. Retail
- 5.4.7. Government & Public Sector
- 5.4.8. Manufacturing
- 5.4.9. Others
- 5.5. Western Europe Mobile Mapping Market Analysis, Opportunity and Forecast, By By Technology Analysis, 2016-2032
- 5.5.1. Western Europe Mobile Mapping Market Analysis by By Technology Analysis: Introduction
- 5.5.2. Market Size Absolute $ Opportunity Analysis and Forecast, By By Technology Analysis, 2016-2032
- 5.5.3. LiDAR
- 5.5.4. Global Navigation Satellite System (GNSS)
- 5.5.5. Geographic Information System (GIS)
- 5.5.6. Imaging Systems (Cameras, Sensors)
- 5.6. Western Europe Mobile Mapping Market Analysis, Opportunity and Forecast, By , 2016-2032
- 5.6.1. Western Europe Mobile Mapping Market Analysis by : Introduction
- 5.6.2. Market Size Absolute $ Opportunity Analysis and Forecast, By , 2016-2032
- 5.7. Western Europe Mobile Mapping Market Analysis, Opportunity and Forecast, By Country , 2016-2032
- 5.7.1. Western Europe Mobile Mapping Market Analysis by Country : Introduction
- 5.7.2. Market Size Absolute $ Opportunity Analysis and Forecast, Country , 2016-2032
- 5.7.2.1. Germany
- 5.7.2.2. France
- 5.7.2.3. The UK
- 5.7.2.4. Spain
- 5.7.2.5. Italy
- 5.7.2.6. Portugal
- 5.7.2.7. Ireland
- 5.7.2.8. Austria
- 5.7.2.9. Switzerland
- 5.7.2.10. Benelux
- 5.7.2.11. Nordic
- 5.7.2.12. Rest of Western Europe
- 6. Eastern Europe Mobile Mapping Market Analysis, Opportunity and Forecast, 2016-2032
- 6.1. Eastern Europe Mobile Mapping Market Analysis, 2016-2021
- 6.2. Eastern Europe Mobile Mapping Market Opportunity and Forecast, 2023-2032
- 6.3. Eastern Europe Mobile Mapping Market Analysis, Opportunity and Forecast, By By Type Analysis, 2016-2032
- 6.3.1. Eastern Europe Mobile Mapping Market Analysis by By Type Analysis: Introduction
- 6.3.2. Market Size Absolute $ Opportunity Analysis and Forecast, By By Type Analysis, 2016-2032
- 6.3.3. Indoor Mapping
- 6.3.4. Location-Based Services (LBS)
- 6.3.5. 3D Mapping
- 6.4. Eastern Europe Mobile Mapping Market Analysis, Opportunity and Forecast, By By End-Use Industry, 2016-2032
- 6.4.1. Eastern Europe Mobile Mapping Market Analysis by By End-Use Industry: Introduction
- 6.4.2. Market Size Absolute $ Opportunity Analysis and Forecast, By By End-Use Industry, 2016-2032
- 6.4.3. Construction
- 6.4.4. Energy & Utilities
- 6.4.5. Transportation & Logistics
- 6.4.6. Retail
- 6.4.7. Government & Public Sector
- 6.4.8. Manufacturing
- 6.4.9. Others
- 6.5. Eastern Europe Mobile Mapping Market Analysis, Opportunity and Forecast, By By Technology Analysis, 2016-2032
- 6.5.1. Eastern Europe Mobile Mapping Market Analysis by By Technology Analysis: Introduction
- 6.5.2. Market Size Absolute $ Opportunity Analysis and Forecast, By By Technology Analysis, 2016-2032
- 6.5.3. LiDAR
- 6.5.4. Global Navigation Satellite System (GNSS)
- 6.5.5. Geographic Information System (GIS)
- 6.5.6. Imaging Systems (Cameras, Sensors)
- 6.6. Eastern Europe Mobile Mapping Market Analysis, Opportunity and Forecast, By , 2016-2032
- 6.6.1. Eastern Europe Mobile Mapping Market Analysis by : Introduction
- 6.6.2. Market Size Absolute $ Opportunity Analysis and Forecast, By , 2016-2032
- 6.7. Eastern Europe Mobile Mapping Market Analysis, Opportunity and Forecast, By Country , 2016-2032
- 6.7.1. Eastern Europe Mobile Mapping Market Analysis by Country : Introduction
- 6.7.2. Market Size Absolute $ Opportunity Analysis and Forecast, Country , 2016-2032
- 6.7.2.1. Russia
- 6.7.2.2. Poland
- 6.7.2.3. The Czech Republic
- 6.7.2.4. Greece
- 6.7.2.5. Rest of Eastern Europe
- 7. APAC Mobile Mapping Market Analysis, Opportunity and Forecast, 2016-2032
- 7.1. APAC Mobile Mapping Market Analysis, 2016-2021
- 7.2. APAC Mobile Mapping Market Opportunity and Forecast, 2023-2032
- 7.3. APAC Mobile Mapping Market Analysis, Opportunity and Forecast, By By Type Analysis, 2016-2032
- 7.3.1. APAC Mobile Mapping Market Analysis by By Type Analysis: Introduction
- 7.3.2. Market Size Absolute $ Opportunity Analysis and Forecast, By By Type Analysis, 2016-2032
- 7.3.3. Indoor Mapping
- 7.3.4. Location-Based Services (LBS)
- 7.3.5. 3D Mapping
- 7.4. APAC Mobile Mapping Market Analysis, Opportunity and Forecast, By By End-Use Industry, 2016-2032
- 7.4.1. APAC Mobile Mapping Market Analysis by By End-Use Industry: Introduction
- 7.4.2. Market Size Absolute $ Opportunity Analysis and Forecast, By By End-Use Industry, 2016-2032
- 7.4.3. Construction
- 7.4.4. Energy & Utilities
- 7.4.5. Transportation & Logistics
- 7.4.6. Retail
- 7.4.7. Government & Public Sector
- 7.4.8. Manufacturing
- 7.4.9. Others
- 7.5. APAC Mobile Mapping Market Analysis, Opportunity and Forecast, By By Technology Analysis, 2016-2032
- 7.5.1. APAC Mobile Mapping Market Analysis by By Technology Analysis: Introduction
- 7.5.2. Market Size Absolute $ Opportunity Analysis and Forecast, By By Technology Analysis, 2016-2032
- 7.5.3. LiDAR
- 7.5.4. Global Navigation Satellite System (GNSS)
- 7.5.5. Geographic Information System (GIS)
- 7.5.6. Imaging Systems (Cameras, Sensors)
- 7.6. APAC Mobile Mapping Market Analysis, Opportunity and Forecast, By , 2016-2032
- 7.6.1. APAC Mobile Mapping Market Analysis by : Introduction
- 7.6.2. Market Size Absolute $ Opportunity Analysis and Forecast, By , 2016-2032
- 7.7. APAC Mobile Mapping Market Analysis, Opportunity and Forecast, By Country , 2016-2032
- 7.7.1. APAC Mobile Mapping Market Analysis by Country : Introduction
- 7.7.2. Market Size Absolute $ Opportunity Analysis and Forecast, Country , 2016-2032
- 7.7.2.1. China
- 7.7.2.2. Japan
- 7.7.2.3. South Korea
- 7.7.2.4. India
- 7.7.2.5. Australia & New Zeland
- 7.7.2.6. Indonesia
- 7.7.2.7. Malaysia
- 7.7.2.8. Philippines
- 7.7.2.9. Singapore
- 7.7.2.10. Thailand
- 7.7.2.11. Vietnam
- 7.7.2.12. Rest of APAC
- 8. Latin America Mobile Mapping Market Analysis, Opportunity and Forecast, 2016-2032
- 8.1. Latin America Mobile Mapping Market Analysis, 2016-2021
- 8.2. Latin America Mobile Mapping Market Opportunity and Forecast, 2023-2032
- 8.3. Latin America Mobile Mapping Market Analysis, Opportunity and Forecast, By By Type Analysis, 2016-2032
- 8.3.1. Latin America Mobile Mapping Market Analysis by By Type Analysis: Introduction
- 8.3.2. Market Size Absolute $ Opportunity Analysis and Forecast, By By Type Analysis, 2016-2032
- 8.3.3. Indoor Mapping
- 8.3.4. Location-Based Services (LBS)
- 8.3.5. 3D Mapping
- 8.4. Latin America Mobile Mapping Market Analysis, Opportunity and Forecast, By By End-Use Industry, 2016-2032
- 8.4.1. Latin America Mobile Mapping Market Analysis by By End-Use Industry: Introduction
- 8.4.2. Market Size Absolute $ Opportunity Analysis and Forecast, By By End-Use Industry, 2016-2032
- 8.4.3. Construction
- 8.4.4. Energy & Utilities
- 8.4.5. Transportation & Logistics
- 8.4.6. Retail
- 8.4.7. Government & Public Sector
- 8.4.8. Manufacturing
- 8.4.9. Others
- 8.5. Latin America Mobile Mapping Market Analysis, Opportunity and Forecast, By By Technology Analysis, 2016-2032
- 8.5.1. Latin America Mobile Mapping Market Analysis by By Technology Analysis: Introduction
- 8.5.2. Market Size Absolute $ Opportunity Analysis and Forecast, By By Technology Analysis, 2016-2032
- 8.5.3. LiDAR
- 8.5.4. Global Navigation Satellite System (GNSS)
- 8.5.5. Geographic Information System (GIS)
- 8.5.6. Imaging Systems (Cameras, Sensors)
- 8.6. Latin America Mobile Mapping Market Analysis, Opportunity and Forecast, By , 2016-2032
- 8.6.1. Latin America Mobile Mapping Market Analysis by : Introduction
- 8.6.2. Market Size Absolute $ Opportunity Analysis and Forecast, By , 2016-2032
- 8.7. Latin America Mobile Mapping Market Analysis, Opportunity and Forecast, By Country , 2016-2032
- 8.7.1. Latin America Mobile Mapping Market Analysis by Country : Introduction
- 8.7.2. Market Size Absolute $ Opportunity Analysis and Forecast, Country , 2016-2032
- 8.7.2.1. Brazil
- 8.7.2.2. Colombia
- 8.7.2.3. Chile
- 8.7.2.4. Argentina
- 8.7.2.5. Costa Rica
- 8.7.2.6. Rest of Latin America
- 9. Middle East & Africa Mobile Mapping Market Analysis, Opportunity and Forecast, 2016-2032
- 9.1. Middle East & Africa Mobile Mapping Market Analysis, 2016-2021
- 9.2. Middle East & Africa Mobile Mapping Market Opportunity and Forecast, 2023-2032
- 9.3. Middle East & Africa Mobile Mapping Market Analysis, Opportunity and Forecast, By By Type Analysis, 2016-2032
- 9.3.1. Middle East & Africa Mobile Mapping Market Analysis by By Type Analysis: Introduction
- 9.3.2. Market Size Absolute $ Opportunity Analysis and Forecast, By By Type Analysis, 2016-2032
- 9.3.3. Indoor Mapping
- 9.3.4. Location-Based Services (LBS)
- 9.3.5. 3D Mapping
- 9.4. Middle East & Africa Mobile Mapping Market Analysis, Opportunity and Forecast, By By End-Use Industry, 2016-2032
- 9.4.1. Middle East & Africa Mobile Mapping Market Analysis by By End-Use Industry: Introduction
- 9.4.2. Market Size Absolute $ Opportunity Analysis and Forecast, By By End-Use Industry, 2016-2032
- 9.4.3. Construction
- 9.4.4. Energy & Utilities
- 9.4.5. Transportation & Logistics
- 9.4.6. Retail
- 9.4.7. Government & Public Sector
- 9.4.8. Manufacturing
- 9.4.9. Others
- 9.5. Middle East & Africa Mobile Mapping Market Analysis, Opportunity and Forecast, By By Technology Analysis, 2016-2032
- 9.5.1. Middle East & Africa Mobile Mapping Market Analysis by By Technology Analysis: Introduction
- 9.5.2. Market Size Absolute $ Opportunity Analysis and Forecast, By By Technology Analysis, 2016-2032
- 9.5.3. LiDAR
- 9.5.4. Global Navigation Satellite System (GNSS)
- 9.5.5. Geographic Information System (GIS)
- 9.5.6. Imaging Systems (Cameras, Sensors)
- 9.6. Middle East & Africa Mobile Mapping Market Analysis, Opportunity and Forecast, By , 2016-2032
- 9.6.1. Middle East & Africa Mobile Mapping Market Analysis by : Introduction
- 9.6.2. Market Size Absolute $ Opportunity Analysis and Forecast, By , 2016-2032
- 9.7. Middle East & Africa Mobile Mapping Market Analysis, Opportunity and Forecast, By Country , 2016-2032
- 9.7.1. Middle East & Africa Mobile Mapping Market Analysis by Country : Introduction
- 9.7.2. Market Size Absolute $ Opportunity Analysis and Forecast, Country , 2016-2032
- 9.7.2.1. Algeria
- 9.7.2.2. Egypt
- 9.7.2.3. Israel
- 9.7.2.4. Kuwait
- 9.7.2.5. Nigeria
- 9.7.2.6. Saudi Arabia
- 9.7.2.7. South Africa
- 9.7.2.8. Turkey
- 9.7.2.9. The UAE
- 9.7.2.10. Rest of MEA
- 10. Global Mobile Mapping Market Analysis, Opportunity and Forecast, By Region , 2016-2032
- 10.1. Global Mobile Mapping Market Analysis by Region : Introduction
- 10.2. Market Size Absolute $ Opportunity Analysis and Forecast, By Region , 2016-2032
- 10.2.1. North America
- 10.2.2. Western Europe
- 10.2.3. Eastern Europe
- 10.2.4. APAC
- 10.2.5. Latin America
- 10.2.6. Middle East & Africa
- 11. Global Mobile Mapping Market Competitive Landscape, Market Share Analysis, and Company Profiles
- 11.1. Market Share Analysis
- 11.2. Company Profiles
- 11.3. Apple Maps
- 11.3.1. Company Overview
- 11.3.2. Financial Highlights
- 11.3.3. Product Portfolio
- 11.3.4. SWOT Analysis
- 11.3.5. Key Strategies and Developments
- 11.4. Google Maps
- 11.4.1. Company Overview
- 11.4.2. Financial Highlights
- 11.4.3. Product Portfolio
- 11.4.4. SWOT Analysis
- 11.4.5. Key Strategies and Developments
- 11.5. Tomtom NV
- 11.5.1. Company Overview
- 11.5.2. Financial Highlights
- 11.5.3. Product Portfolio
- 11.5.4. SWOT Analysis
- 11.5.5. Key Strategies and Developments
- 11.6. Microsoft Corporation
- 11.6.1. Company Overview
- 11.6.2. Financial Highlights
- 11.6.3. Product Portfolio
- 11.6.4. SWOT Analysis
- 11.6.5. Key Strategies and Developments
- 11.7. Mapbox
- 11.7.1. Company Overview
- 11.7.2. Financial Highlights
- 11.7.3. Product Portfolio
- 11.7.4. SWOT Analysis
- 11.7.5. Key Strategies and Developments
- 11.8. HERE Technologies
- 11.8.1. Company Overview
- 11.8.2. Financial Highlights
- 11.8.3. Product Portfolio
- 11.8.4. SWOT Analysis
- 11.8.5. Key Strategies and Developments
- 11.9. Garmin International
- 11.9.1. Company Overview
- 11.9.2. Financial Highlights
- 11.9.3. Product Portfolio
- 11.9.4. SWOT Analysis
- 11.9.5. Key Strategies and Developments
- 11.10. Mitsubishi Electric Corporation
- 11.10.1. Company Overview
- 11.10.2. Financial Highlights
- 11.10.3. Product Portfolio
- 11.10.4. SWOT Analysis
- 11.10.5. Key Strategies and Developments
- 11.11. OSI Geospatial Inc.
- 11.11.1. Company Overview
- 11.11.2. Financial Highlights
- 11.11.3. Product Portfolio
- 11.11.4. SWOT Analysis
- 11.11.5. Key Strategies and Developments
- 11.12. Telefonaktiebolaget LM Ericsson
- 11.12.1. Company Overview
- 11.12.2. Financial Highlights
- 11.12.3. Product Portfolio
- 11.12.4. SWOT Analysis
- 11.12.5. Key Strategies and Developments
- 11.13. Leica Geosystems Inc.
- 11.13.1. Company Overview
- 11.13.2. Financial Highlights
- 11.13.3. Product Portfolio
- 11.13.4. SWOT Analysis
- 11.13.5. Key Strategies and Developments
- 11.14. Qualcomm Inc.
- 11.14.1. Company Overview
- 11.14.2. Financial Highlights
- 11.14.3. Product Portfolio
- 11.14.4. SWOT Analysis
- 11.14.5. Key Strategies and Developments
- 12. Assumptions and Acronyms
- 13. Research Methodology
- 14. Contact
- List of Figures
- Figure 1: Global Mobile Mapping Market Revenue (US$ Mn) Market Share by Type Analysis in 2022
- Figure 2: Global Mobile Mapping Market Attractiveness Analysis by Type Analysis, 2016-2032
- Figure 3: Global Mobile Mapping Market Revenue (US$ Mn) Market Share by End-Use Industryin 2022
- Figure 4: Global Mobile Mapping Market Attractiveness Analysis by End-Use Industry, 2016-2032
- Figure 5: Global Mobile Mapping Market Revenue (US$ Mn) Market Share by Technology Analysisin 2022
- Figure 6: Global Mobile Mapping Market Attractiveness Analysis by Technology Analysis, 2016-2032
- Figure 7: Global Mobile Mapping Market Revenue (US$ Mn) Market Share by in 2022
- Figure 8: Global Mobile Mapping Market Attractiveness Analysis by , 2016-2032
- Figure 9: Global Mobile Mapping Market Revenue (US$ Mn) Market Share by Region in 2022
- Figure 10: Global Mobile Mapping Market Attractiveness Analysis by Region, 2016-2032
- Figure 11: Global Mobile Mapping Market Revenue (US$ Mn) (2016-2032)
- Figure 12: Global Mobile Mapping Market Revenue (US$ Mn) Comparison by Region (2016-2032)
- Figure 13: Global Mobile Mapping Market Revenue (US$ Mn) Comparison by Type Analysis (2016-2032)
- Figure 14: Global Mobile Mapping Market Revenue (US$ Mn) Comparison by End-Use Industry (2016-2032)
- Figure 15: Global Mobile Mapping Market Revenue (US$ Mn) Comparison by Technology Analysis (2016-2032)
- Figure 16: Global Mobile Mapping Market Revenue (US$ Mn) Comparison by (2016-2032)
- Figure 17: Global Mobile Mapping Market Y-o-Y Growth Rate Comparison by Region (2016-2032)
- Figure 18: Global Mobile Mapping Market Y-o-Y Growth Rate Comparison by Type Analysis (2016-2032)
- Figure 19: Global Mobile Mapping Market Y-o-Y Growth Rate Comparison by End-Use Industry (2016-2032)
- Figure 20: Global Mobile Mapping Market Y-o-Y Growth Rate Comparison by Technology Analysis (2016-2032)
- Figure 21: Global Mobile Mapping Market Y-o-Y Growth Rate Comparison by (2016-2032)
- Figure 22: Global Mobile Mapping Market Share Comparison by Region (2016-2032)
- Figure 23: Global Mobile Mapping Market Share Comparison by Type Analysis (2016-2032)
- Figure 24: Global Mobile Mapping Market Share Comparison by End-Use Industry (2016-2032)
- Figure 25: Global Mobile Mapping Market Share Comparison by Technology Analysis (2016-2032)
- Figure 26: Global Mobile Mapping Market Share Comparison by (2016-2032)
- Figure 27: North America Mobile Mapping Market Revenue (US$ Mn) Market Share by Type Analysisin 2022
- Figure 28: North America Mobile Mapping Market Attractiveness Analysis by Type Analysis, 2016-2032
- Figure 29: North America Mobile Mapping Market Revenue (US$ Mn) Market Share by End-Use Industryin 2022
- Figure 30: North America Mobile Mapping Market Attractiveness Analysis by End-Use Industry, 2016-2032
- Figure 31: North America Mobile Mapping Market Revenue (US$ Mn) Market Share by Technology Analysisin 2022
- Figure 32: North America Mobile Mapping Market Attractiveness Analysis by Technology Analysis, 2016-2032
- Figure 33: North America Mobile Mapping Market Revenue (US$ Mn) Market Share by in 2022
- Figure 34: North America Mobile Mapping Market Attractiveness Analysis by , 2016-2032
- Figure 35: North America Mobile Mapping Market Revenue (US$ Mn) Market Share by Country in 2022
- Figure 36: North America Mobile Mapping Market Attractiveness Analysis by Country, 2016-2032
- Figure 37: North America Mobile Mapping Market Revenue (US$ Mn) (2016-2032)
- Figure 38: North America Mobile Mapping Market Revenue (US$ Mn) Comparison by Country (2016-2032)
- Figure 39: North America Mobile Mapping Market Revenue (US$ Mn) Comparison by Type Analysis (2016-2032)
- Figure 40: North America Mobile Mapping Market Revenue (US$ Mn) Comparison by End-Use Industry (2016-2032)
- Figure 41: North America Mobile Mapping Market Revenue (US$ Mn) Comparison by Technology Analysis (2016-2032)
- Figure 42: North America Mobile Mapping Market Revenue (US$ Mn) Comparison by (2016-2032)
- Figure 43: North America Mobile Mapping Market Y-o-Y Growth Rate Comparison by Country (2016-2032)
- Figure 44: North America Mobile Mapping Market Y-o-Y Growth Rate Comparison by Type Analysis (2016-2032)
- Figure 45: North America Mobile Mapping Market Y-o-Y Growth Rate Comparison by End-Use Industry (2016-2032)
- Figure 46: North America Mobile Mapping Market Y-o-Y Growth Rate Comparison by Technology Analysis (2016-2032)
- Figure 47: North America Mobile Mapping Market Y-o-Y Growth Rate Comparison by (2016-2032)
- Figure 48: North America Mobile Mapping Market Share Comparison by Country (2016-2032)
- Figure 49: North America Mobile Mapping Market Share Comparison by Type Analysis (2016-2032)
- Figure 50: North America Mobile Mapping Market Share Comparison by End-Use Industry (2016-2032)
- Figure 51: North America Mobile Mapping Market Share Comparison by Technology Analysis (2016-2032)
- Figure 52: North America Mobile Mapping Market Share Comparison by (2016-2032)
- Figure 53: Western Europe Mobile Mapping Market Revenue (US$ Mn) Market Share by Type Analysisin 2022
- Figure 54: Western Europe Mobile Mapping Market Attractiveness Analysis by Type Analysis, 2016-2032
- Figure 55: Western Europe Mobile Mapping Market Revenue (US$ Mn) Market Share by End-Use Industryin 2022
- Figure 56: Western Europe Mobile Mapping Market Attractiveness Analysis by End-Use Industry, 2016-2032
- Figure 57: Western Europe Mobile Mapping Market Revenue (US$ Mn) Market Share by Technology Analysisin 2022
- Figure 58: Western Europe Mobile Mapping Market Attractiveness Analysis by Technology Analysis, 2016-2032
- Figure 59: Western Europe Mobile Mapping Market Revenue (US$ Mn) Market Share by in 2022
- Figure 60: Western Europe Mobile Mapping Market Attractiveness Analysis by , 2016-2032
- Figure 61: Western Europe Mobile Mapping Market Revenue (US$ Mn) Market Share by Country in 2022
- Figure 62: Western Europe Mobile Mapping Market Attractiveness Analysis by Country, 2016-2032
- Figure 63: Western Europe Mobile Mapping Market Revenue (US$ Mn) (2016-2032)
- Figure 64: Western Europe Mobile Mapping Market Revenue (US$ Mn) Comparison by Country (2016-2032)
- Figure 65: Western Europe Mobile Mapping Market Revenue (US$ Mn) Comparison by Type Analysis (2016-2032)
- Figure 66: Western Europe Mobile Mapping Market Revenue (US$ Mn) Comparison by End-Use Industry (2016-2032)
- Figure 67: Western Europe Mobile Mapping Market Revenue (US$ Mn) Comparison by Technology Analysis (2016-2032)
- Figure 68: Western Europe Mobile Mapping Market Revenue (US$ Mn) Comparison by (2016-2032)
- Figure 69: Western Europe Mobile Mapping Market Y-o-Y Growth Rate Comparison by Country (2016-2032)
- Figure 70: Western Europe Mobile Mapping Market Y-o-Y Growth Rate Comparison by Type Analysis (2016-2032)
- Figure 71: Western Europe Mobile Mapping Market Y-o-Y Growth Rate Comparison by End-Use Industry (2016-2032)
- Figure 72: Western Europe Mobile Mapping Market Y-o-Y Growth Rate Comparison by Technology Analysis (2016-2032)
- Figure 73: Western Europe Mobile Mapping Market Y-o-Y Growth Rate Comparison by (2016-2032)
- Figure 74: Western Europe Mobile Mapping Market Share Comparison by Country (2016-2032)
- Figure 75: Western Europe Mobile Mapping Market Share Comparison by Type Analysis (2016-2032)
- Figure 76: Western Europe Mobile Mapping Market Share Comparison by End-Use Industry (2016-2032)
- Figure 77: Western Europe Mobile Mapping Market Share Comparison by Technology Analysis (2016-2032)
- Figure 78: Western Europe Mobile Mapping Market Share Comparison by (2016-2032)
- Figure 79: Eastern Europe Mobile Mapping Market Revenue (US$ Mn) Market Share by Type Analysisin 2022
- Figure 80: Eastern Europe Mobile Mapping Market Attractiveness Analysis by Type Analysis, 2016-2032
- Figure 81: Eastern Europe Mobile Mapping Market Revenue (US$ Mn) Market Share by End-Use Industryin 2022
- Figure 82: Eastern Europe Mobile Mapping Market Attractiveness Analysis by End-Use Industry, 2016-2032
- Figure 83: Eastern Europe Mobile Mapping Market Revenue (US$ Mn) Market Share by Technology Analysisin 2022
- Figure 84: Eastern Europe Mobile Mapping Market Attractiveness Analysis by Technology Analysis, 2016-2032
- Figure 85: Eastern Europe Mobile Mapping Market Revenue (US$ Mn) Market Share by in 2022
- Figure 86: Eastern Europe Mobile Mapping Market Attractiveness Analysis by , 2016-2032
- Figure 87: Eastern Europe Mobile Mapping Market Revenue (US$ Mn) Market Share by Country in 2022
- Figure 88: Eastern Europe Mobile Mapping Market Attractiveness Analysis by Country, 2016-2032
- Figure 89: Eastern Europe Mobile Mapping Market Revenue (US$ Mn) (2016-2032)
- Figure 90: Eastern Europe Mobile Mapping Market Revenue (US$ Mn) Comparison by Country (2016-2032)
- Figure 91: Eastern Europe Mobile Mapping Market Revenue (US$ Mn) Comparison by Type Analysis (2016-2032)
- Figure 92: Eastern Europe Mobile Mapping Market Revenue (US$ Mn) Comparison by End-Use Industry (2016-2032)
- Figure 93: Eastern Europe Mobile Mapping Market Revenue (US$ Mn) Comparison by Technology Analysis (2016-2032)
- Figure 94: Eastern Europe Mobile Mapping Market Revenue (US$ Mn) Comparison by (2016-2032)
- Figure 95: Eastern Europe Mobile Mapping Market Y-o-Y Growth Rate Comparison by Country (2016-2032)
- Figure 96: Eastern Europe Mobile Mapping Market Y-o-Y Growth Rate Comparison by Type Analysis (2016-2032)
- Figure 97: Eastern Europe Mobile Mapping Market Y-o-Y Growth Rate Comparison by End-Use Industry (2016-2032)
- Figure 98: Eastern Europe Mobile Mapping Market Y-o-Y Growth Rate Comparison by Technology Analysis (2016-2032)
- Figure 99: Eastern Europe Mobile Mapping Market Y-o-Y Growth Rate Comparison by (2016-2032)
- Figure 100: Eastern Europe Mobile Mapping Market Share Comparison by Country (2016-2032)
- Figure 101: Eastern Europe Mobile Mapping Market Share Comparison by Type Analysis (2016-2032)
- Figure 102: Eastern Europe Mobile Mapping Market Share Comparison by End-Use Industry (2016-2032)
- Figure 103: Eastern Europe Mobile Mapping Market Share Comparison by Technology Analysis (2016-2032)
- Figure 104: Eastern Europe Mobile Mapping Market Share Comparison by (2016-2032)
- Figure 105: APAC Mobile Mapping Market Revenue (US$ Mn) Market Share by Type Analysisin 2022
- Figure 106: APAC Mobile Mapping Market Attractiveness Analysis by Type Analysis, 2016-2032
- Figure 107: APAC Mobile Mapping Market Revenue (US$ Mn) Market Share by End-Use Industryin 2022
- Figure 108: APAC Mobile Mapping Market Attractiveness Analysis by End-Use Industry, 2016-2032
- Figure 109: APAC Mobile Mapping Market Revenue (US$ Mn) Market Share by Technology Analysisin 2022
- Figure 110: APAC Mobile Mapping Market Attractiveness Analysis by Technology Analysis, 2016-2032
- Figure 111: APAC Mobile Mapping Market Revenue (US$ Mn) Market Share by in 2022
- Figure 112: APAC Mobile Mapping Market Attractiveness Analysis by , 2016-2032
- Figure 113: APAC Mobile Mapping Market Revenue (US$ Mn) Market Share by Country in 2022
- Figure 114: APAC Mobile Mapping Market Attractiveness Analysis by Country, 2016-2032
- Figure 115: APAC Mobile Mapping Market Revenue (US$ Mn) (2016-2032)
- Figure 116: APAC Mobile Mapping Market Revenue (US$ Mn) Comparison by Country (2016-2032)
- Figure 117: APAC Mobile Mapping Market Revenue (US$ Mn) Comparison by Type Analysis (2016-2032)
- Figure 118: APAC Mobile Mapping Market Revenue (US$ Mn) Comparison by End-Use Industry (2016-2032)
- Figure 119: APAC Mobile Mapping Market Revenue (US$ Mn) Comparison by Technology Analysis (2016-2032)
- Figure 120: APAC Mobile Mapping Market Revenue (US$ Mn) Comparison by (2016-2032)
- Figure 121: APAC Mobile Mapping Market Y-o-Y Growth Rate Comparison by Country (2016-2032)
- Figure 122: APAC Mobile Mapping Market Y-o-Y Growth Rate Comparison by Type Analysis (2016-2032)
- Figure 123: APAC Mobile Mapping Market Y-o-Y Growth Rate Comparison by End-Use Industry (2016-2032)
- Figure 124: APAC Mobile Mapping Market Y-o-Y Growth Rate Comparison by Technology Analysis (2016-2032)
- Figure 125: APAC Mobile Mapping Market Y-o-Y Growth Rate Comparison by (2016-2032)
- Figure 126: APAC Mobile Mapping Market Share Comparison by Country (2016-2032)
- Figure 127: APAC Mobile Mapping Market Share Comparison by Type Analysis (2016-2032)
- Figure 128: APAC Mobile Mapping Market Share Comparison by End-Use Industry (2016-2032)
- Figure 129: APAC Mobile Mapping Market Share Comparison by Technology Analysis (2016-2032)
- Figure 130: APAC Mobile Mapping Market Share Comparison by (2016-2032)
- Figure 131: Latin America Mobile Mapping Market Revenue (US$ Mn) Market Share by Type Analysisin 2022
- Figure 132: Latin America Mobile Mapping Market Attractiveness Analysis by Type Analysis, 2016-2032
- Figure 133: Latin America Mobile Mapping Market Revenue (US$ Mn) Market Share by End-Use Industryin 2022
- Figure 134: Latin America Mobile Mapping Market Attractiveness Analysis by End-Use Industry, 2016-2032
- Figure 135: Latin America Mobile Mapping Market Revenue (US$ Mn) Market Share by Technology Analysisin 2022
- Figure 136: Latin America Mobile Mapping Market Attractiveness Analysis by Technology Analysis, 2016-2032
- Figure 137: Latin America Mobile Mapping Market Revenue (US$ Mn) Market Share by in 2022
- Figure 138: Latin America Mobile Mapping Market Attractiveness Analysis by , 2016-2032
- Figure 139: Latin America Mobile Mapping Market Revenue (US$ Mn) Market Share by Country in 2022
- Figure 140: Latin America Mobile Mapping Market Attractiveness Analysis by Country, 2016-2032
- Figure 141: Latin America Mobile Mapping Market Revenue (US$ Mn) (2016-2032)
- Figure 142: Latin America Mobile Mapping Market Revenue (US$ Mn) Comparison by Country (2016-2032)
- Figure 143: Latin America Mobile Mapping Market Revenue (US$ Mn) Comparison by Type Analysis (2016-2032)
- Figure 144: Latin America Mobile Mapping Market Revenue (US$ Mn) Comparison by End-Use Industry (2016-2032)
- Figure 145: Latin America Mobile Mapping Market Revenue (US$ Mn) Comparison by Technology Analysis (2016-2032)
- Figure 146: Latin America Mobile Mapping Market Revenue (US$ Mn) Comparison by (2016-2032)
- Figure 147: Latin America Mobile Mapping Market Y-o-Y Growth Rate Comparison by Country (2016-2032)
- Figure 148: Latin America Mobile Mapping Market Y-o-Y Growth Rate Comparison by Type Analysis (2016-2032)
- Figure 149: Latin America Mobile Mapping Market Y-o-Y Growth Rate Comparison by End-Use Industry (2016-2032)
- Figure 150: Latin America Mobile Mapping Market Y-o-Y Growth Rate Comparison by Technology Analysis (2016-2032)
- Figure 151: Latin America Mobile Mapping Market Y-o-Y Growth Rate Comparison by (2016-2032)
- Figure 152: Latin America Mobile Mapping Market Share Comparison by Country (2016-2032)
- Figure 153: Latin America Mobile Mapping Market Share Comparison by Type Analysis (2016-2032)
- Figure 154: Latin America Mobile Mapping Market Share Comparison by End-Use Industry (2016-2032)
- Figure 155: Latin America Mobile Mapping Market Share Comparison by Technology Analysis (2016-2032)
- Figure 156: Latin America Mobile Mapping Market Share Comparison by (2016-2032)
- Figure 157: Middle East & Africa Mobile Mapping Market Revenue (US$ Mn) Market Share by Type Analysisin 2022
- Figure 158: Middle East & Africa Mobile Mapping Market Attractiveness Analysis by Type Analysis, 2016-2032
- Figure 159: Middle East & Africa Mobile Mapping Market Revenue (US$ Mn) Market Share by End-Use Industryin 2022
- Figure 160: Middle East & Africa Mobile Mapping Market Attractiveness Analysis by End-Use Industry, 2016-2032
- Figure 161: Middle East & Africa Mobile Mapping Market Revenue (US$ Mn) Market Share by Technology Analysisin 2022
- Figure 162: Middle East & Africa Mobile Mapping Market Attractiveness Analysis by Technology Analysis, 2016-2032
- Figure 163: Middle East & Africa Mobile Mapping Market Revenue (US$ Mn) Market Share by in 2022
- Figure 164: Middle East & Africa Mobile Mapping Market Attractiveness Analysis by , 2016-2032
- Figure 165: Middle East & Africa Mobile Mapping Market Revenue (US$ Mn) Market Share by Country in 2022
- Figure 166: Middle East & Africa Mobile Mapping Market Attractiveness Analysis by Country, 2016-2032
- Figure 167: Middle East & Africa Mobile Mapping Market Revenue (US$ Mn) (2016-2032)
- Figure 168: Middle East & Africa Mobile Mapping Market Revenue (US$ Mn) Comparison by Country (2016-2032)
- Figure 169: Middle East & Africa Mobile Mapping Market Revenue (US$ Mn) Comparison by Type Analysis (2016-2032)
- Figure 170: Middle East & Africa Mobile Mapping Market Revenue (US$ Mn) Comparison by End-Use Industry (2016-2032)
- Figure 171: Middle East & Africa Mobile Mapping Market Revenue (US$ Mn) Comparison by Technology Analysis (2016-2032)
- Figure 172: Middle East & Africa Mobile Mapping Market Revenue (US$ Mn) Comparison by (2016-2032)
- Figure 173: Middle East & Africa Mobile Mapping Market Y-o-Y Growth Rate Comparison by Country (2016-2032)
- Figure 174: Middle East & Africa Mobile Mapping Market Y-o-Y Growth Rate Comparison by Type Analysis (2016-2032)
- Figure 175: Middle East & Africa Mobile Mapping Market Y-o-Y Growth Rate Comparison by End-Use Industry (2016-2032)
- Figure 176: Middle East & Africa Mobile Mapping Market Y-o-Y Growth Rate Comparison by Technology Analysis (2016-2032)
- Figure 177: Middle East & Africa Mobile Mapping Market Y-o-Y Growth Rate Comparison by (2016-2032)
- Figure 178: Middle East & Africa Mobile Mapping Market Share Comparison by Country (2016-2032)
- Figure 179: Middle East & Africa Mobile Mapping Market Share Comparison by Type Analysis (2016-2032)
- Figure 180: Middle East & Africa Mobile Mapping Market Share Comparison by End-Use Industry (2016-2032)
- Figure 181: Middle East & Africa Mobile Mapping Market Share Comparison by Technology Analysis (2016-2032)
- Figure 182: Middle East & Africa Mobile Mapping Market Share Comparison by (2016-2032)
List of Tables
- Table 1: Global Mobile Mapping Market Comparison by Type Analysis (2016-2032)
- Table 2: Global Mobile Mapping Market Comparison by End-Use Industry (2016-2032)
- Table 3: Global Mobile Mapping Market Comparison by Technology Analysis (2016-2032)
- Table 4: Global Mobile Mapping Market Comparison by (2016-2032)
- Table 5: Global Mobile Mapping Market Revenue (US$ Mn) Comparison by Region (2016-2032)
- Table 6: Global Mobile Mapping Market Revenue (US$ Mn) (2016-2032)
- Table 7: Global Mobile Mapping Market Revenue (US$ Mn) Comparison by Region (2016-2032)
- Table 8: Global Mobile Mapping Market Revenue (US$ Mn) Comparison by Type Analysis (2016-2032)
- Table 9: Global Mobile Mapping Market Revenue (US$ Mn) Comparison by End-Use Industry (2016-2032)
- Table 10: Global Mobile Mapping Market Revenue (US$ Mn) Comparison by Technology Analysis (2016-2032)
- Table 11: Global Mobile Mapping Market Revenue (US$ Mn) Comparison by (2016-2032)
- Table 12: Global Mobile Mapping Market Y-o-Y Growth Rate Comparison by Region (2016-2032)
- Table 13: Global Mobile Mapping Market Y-o-Y Growth Rate Comparison by Type Analysis (2016-2032)
- Table 14: Global Mobile Mapping Market Y-o-Y Growth Rate Comparison by End-Use Industry (2016-2032)
- Table 15: Global Mobile Mapping Market Y-o-Y Growth Rate Comparison by Technology Analysis (2016-2032)
- Table 16: Global Mobile Mapping Market Y-o-Y Growth Rate Comparison by (2016-2032)
- Table 17: Global Mobile Mapping Market Share Comparison by Region (2016-2032)
- Table 18: Global Mobile Mapping Market Share Comparison by Type Analysis (2016-2032)
- Table 19: Global Mobile Mapping Market Share Comparison by End-Use Industry (2016-2032)
- Table 20: Global Mobile Mapping Market Share Comparison by Technology Analysis (2016-2032)
- Table 21: Global Mobile Mapping Market Share Comparison by (2016-2032)
- Table 22: North America Mobile Mapping Market Comparison by End-Use Industry (2016-2032)
- Table 23: North America Mobile Mapping Market Comparison by Technology Analysis (2016-2032)
- Table 24: North America Mobile Mapping Market Comparison by (2016-2032)
- Table 25: North America Mobile Mapping Market Revenue (US$ Mn) Comparison by Country (2016-2032)
- Table 26: North America Mobile Mapping Market Revenue (US$ Mn) (2016-2032)
- Table 27: North America Mobile Mapping Market Revenue (US$ Mn) Comparison by Country (2016-2032)
- Table 28: North America Mobile Mapping Market Revenue (US$ Mn) Comparison by Type Analysis (2016-2032)
- Table 29: North America Mobile Mapping Market Revenue (US$ Mn) Comparison by End-Use Industry (2016-2032)
- Table 30: North America Mobile Mapping Market Revenue (US$ Mn) Comparison by Technology Analysis (2016-2032)
- Table 31: North America Mobile Mapping Market Revenue (US$ Mn) Comparison by (2016-2032)
- Table 32: North America Mobile Mapping Market Y-o-Y Growth Rate Comparison by Country (2016-2032)
- Table 33: North America Mobile Mapping Market Y-o-Y Growth Rate Comparison by Type Analysis (2016-2032)
- Table 34: North America Mobile Mapping Market Y-o-Y Growth Rate Comparison by End-Use Industry (2016-2032)
- Table 35: North America Mobile Mapping Market Y-o-Y Growth Rate Comparison by Technology Analysis (2016-2032)
- Table 36: North America Mobile Mapping Market Y-o-Y Growth Rate Comparison by (2016-2032)
- Table 37: North America Mobile Mapping Market Share Comparison by Country (2016-2032)
- Table 38: North America Mobile Mapping Market Share Comparison by Type Analysis (2016-2032)
- Table 39: North America Mobile Mapping Market Share Comparison by End-Use Industry (2016-2032)
- Table 40: North America Mobile Mapping Market Share Comparison by Technology Analysis (2016-2032)
- Table 41: North America Mobile Mapping Market Share Comparison by (2016-2032)
- Table 42: Western Europe Mobile Mapping Market Comparison by Type Analysis (2016-2032)
- Table 43: Western Europe Mobile Mapping Market Comparison by End-Use Industry (2016-2032)
- Table 44: Western Europe Mobile Mapping Market Comparison by Technology Analysis (2016-2032)
- Table 45: Western Europe Mobile Mapping Market Comparison by (2016-2032)
- Table 46: Western Europe Mobile Mapping Market Revenue (US$ Mn) Comparison by Country (2016-2032)
- Table 47: Western Europe Mobile Mapping Market Revenue (US$ Mn) (2016-2032)
- Table 48: Western Europe Mobile Mapping Market Revenue (US$ Mn) Comparison by Country (2016-2032)
- Table 49: Western Europe Mobile Mapping Market Revenue (US$ Mn) Comparison by Type Analysis (2016-2032)
- Table 50: Western Europe Mobile Mapping Market Revenue (US$ Mn) Comparison by End-Use Industry (2016-2032)
- Table 51: Western Europe Mobile Mapping Market Revenue (US$ Mn) Comparison by Technology Analysis (2016-2032)
- Table 52: Western Europe Mobile Mapping Market Revenue (US$ Mn) Comparison by (2016-2032)
- Table 53: Western Europe Mobile Mapping Market Y-o-Y Growth Rate Comparison by Country (2016-2032)
- Table 54: Western Europe Mobile Mapping Market Y-o-Y Growth Rate Comparison by Type Analysis (2016-2032)
- Table 55: Western Europe Mobile Mapping Market Y-o-Y Growth Rate Comparison by End-Use Industry (2016-2032)
- Table 56: Western Europe Mobile Mapping Market Y-o-Y Growth Rate Comparison by Technology Analysis (2016-2032)
- Table 57: Western Europe Mobile Mapping Market Y-o-Y Growth Rate Comparison by (2016-2032)
- Table 58: Western Europe Mobile Mapping Market Share Comparison by Country (2016-2032)
- Table 59: Western Europe Mobile Mapping Market Share Comparison by Type Analysis (2016-2032)
- Table 60: Western Europe Mobile Mapping Market Share Comparison by End-Use Industry (2016-2032)
- Table 61: Western Europe Mobile Mapping Market Share Comparison by Technology Analysis (2016-2032)
- Table 62: Western Europe Mobile Mapping Market Share Comparison by (2016-2032)
- Table 63: Eastern Europe Mobile Mapping Market Comparison by Type Analysis (2016-2032)
- Table 64: Eastern Europe Mobile Mapping Market Comparison by End-Use Industry (2016-2032)
- Table 65: Eastern Europe Mobile Mapping Market Comparison by Technology Analysis (2016-2032)
- Table 66: Eastern Europe Mobile Mapping Market Comparison by (2016-2032)
- Table 67: Eastern Europe Mobile Mapping Market Revenue (US$ Mn) Comparison by Country (2016-2032)
- Table 68: Eastern Europe Mobile Mapping Market Revenue (US$ Mn) (2016-2032)
- Table 69: Eastern Europe Mobile Mapping Market Revenue (US$ Mn) Comparison by Country (2016-2032)
- Table 70: Eastern Europe Mobile Mapping Market Revenue (US$ Mn) Comparison by Type Analysis (2016-2032)
- Table 71: Eastern Europe Mobile Mapping Market Revenue (US$ Mn) Comparison by End-Use Industry (2016-2032)
- Table 72: Eastern Europe Mobile Mapping Market Revenue (US$ Mn) Comparison by Technology Analysis (2016-2032)
- Table 73: Eastern Europe Mobile Mapping Market Revenue (US$ Mn) Comparison by (2016-2032)
- Table 74: Eastern Europe Mobile Mapping Market Y-o-Y Growth Rate Comparison by Country (2016-2032)
- Table 75: Eastern Europe Mobile Mapping Market Y-o-Y Growth Rate Comparison by Type Analysis (2016-2032)
- Table 76: Eastern Europe Mobile Mapping Market Y-o-Y Growth Rate Comparison by End-Use Industry (2016-2032)
- Table 77: Eastern Europe Mobile Mapping Market Y-o-Y Growth Rate Comparison by Technology Analysis (2016-2032)
- Table 78: Eastern Europe Mobile Mapping Market Y-o-Y Growth Rate Comparison by (2016-2032)
- Table 79: Eastern Europe Mobile Mapping Market Share Comparison by Country (2016-2032)
- Table 80: Eastern Europe Mobile Mapping Market Share Comparison by Type Analysis (2016-2032)
- Table 81: Eastern Europe Mobile Mapping Market Share Comparison by End-Use Industry (2016-2032)
- Table 82: Eastern Europe Mobile Mapping Market Share Comparison by Technology Analysis (2016-2032)
- Table 83: Eastern Europe Mobile Mapping Market Share Comparison by (2016-2032)
- Table 84: APAC Mobile Mapping Market Comparison by Type Analysis (2016-2032)
- Table 85: APAC Mobile Mapping Market Comparison by End-Use Industry (2016-2032)
- Table 86: APAC Mobile Mapping Market Comparison by Technology Analysis (2016-2032)
- Table 87: APAC Mobile Mapping Market Comparison by (2016-2032)
- Table 88: APAC Mobile Mapping Market Revenue (US$ Mn) Comparison by Country (2016-2032)
- Table 89: APAC Mobile Mapping Market Revenue (US$ Mn) (2016-2032)
- Table 90: APAC Mobile Mapping Market Revenue (US$ Mn) Comparison by Country (2016-2032)
- Table 91: APAC Mobile Mapping Market Revenue (US$ Mn) Comparison by Type Analysis (2016-2032)
- Table 92: APAC Mobile Mapping Market Revenue (US$ Mn) Comparison by End-Use Industry (2016-2032)
- Table 93: APAC Mobile Mapping Market Revenue (US$ Mn) Comparison by Technology Analysis (2016-2032)
- Table 94: APAC Mobile Mapping Market Revenue (US$ Mn) Comparison by (2016-2032)
- Table 95: APAC Mobile Mapping Market Y-o-Y Growth Rate Comparison by Country (2016-2032)
- Table 96: APAC Mobile Mapping Market Y-o-Y Growth Rate Comparison by Type Analysis (2016-2032)
- Table 97: APAC Mobile Mapping Market Y-o-Y Growth Rate Comparison by End-Use Industry (2016-2032)
- Table 98: APAC Mobile Mapping Market Y-o-Y Growth Rate Comparison by Technology Analysis (2016-2032)
- Table 99: APAC Mobile Mapping Market Y-o-Y Growth Rate Comparison by (2016-2032)
- Table 100: APAC Mobile Mapping Market Share Comparison by Country (2016-2032)
- Table 101: APAC Mobile Mapping Market Share Comparison by Type Analysis (2016-2032)
- Table 102: APAC Mobile Mapping Market Share Comparison by End-Use Industry (2016-2032)
- Table 103: APAC Mobile Mapping Market Share Comparison by Technology Analysis (2016-2032)
- Table 104: APAC Mobile Mapping Market Share Comparison by (2016-2032)
- Table 105: Latin America Mobile Mapping Market Comparison by Type Analysis (2016-2032)
- Table 106: Latin America Mobile Mapping Market Comparison by End-Use Industry (2016-2032)
- Table 107: Latin America Mobile Mapping Market Comparison by Technology Analysis (2016-2032)
- Table 108: Latin America Mobile Mapping Market Comparison by (2016-2032)
- Table 109: Latin America Mobile Mapping Market Revenue (US$ Mn) Comparison by Country (2016-2032)
- Table 110: Latin America Mobile Mapping Market Revenue (US$ Mn) (2016-2032)
- Table 111: Latin America Mobile Mapping Market Revenue (US$ Mn) Comparison by Country (2016-2032)
- Table 112: Latin America Mobile Mapping Market Revenue (US$ Mn) Comparison by Type Analysis (2016-2032)
- Table 113: Latin America Mobile Mapping Market Revenue (US$ Mn) Comparison by End-Use Industry (2016-2032)
- Table 114: Latin America Mobile Mapping Market Revenue (US$ Mn) Comparison by Technology Analysis (2016-2032)
- Table 115: Latin America Mobile Mapping Market Revenue (US$ Mn) Comparison by (2016-2032)
- Table 116: Latin America Mobile Mapping Market Y-o-Y Growth Rate Comparison by Country (2016-2032)
- Table 117: Latin America Mobile Mapping Market Y-o-Y Growth Rate Comparison by Type Analysis (2016-2032)
- Table 118: Latin America Mobile Mapping Market Y-o-Y Growth Rate Comparison by End-Use Industry (2016-2032)
- Table 119: Latin America Mobile Mapping Market Y-o-Y Growth Rate Comparison by Technology Analysis (2016-2032)
- Table 120: Latin America Mobile Mapping Market Y-o-Y Growth Rate Comparison by (2016-2032)
- Table 121: Latin America Mobile Mapping Market Share Comparison by Country (2016-2032)
- Table 122: Latin America Mobile Mapping Market Share Comparison by Type Analysis (2016-2032)
- Table 123: Latin America Mobile Mapping Market Share Comparison by End-Use Industry (2016-2032)
- Table 124: Latin America Mobile Mapping Market Share Comparison by Technology Analysis (2016-2032)
- Table 125: Latin America Mobile Mapping Market Share Comparison by (2016-2032)
- Table 126: Middle East & Africa Mobile Mapping Market Comparison by Type Analysis (2016-2032)
- Table 127: Middle East & Africa Mobile Mapping Market Comparison by End-Use Industry (2016-2032)
- Table 128: Middle East & Africa Mobile Mapping Market Comparison by Technology Analysis (2016-2032)
- Table 129: Middle East & Africa Mobile Mapping Market Comparison by (2016-2032)
- Table 130: Middle East & Africa Mobile Mapping Market Revenue (US$ Mn) Comparison by Country (2016-2032)
- Table 131: Middle East & Africa Mobile Mapping Market Revenue (US$ Mn) (2016-2032)
- Table 132: Middle East & Africa Mobile Mapping Market Revenue (US$ Mn) Comparison by Country (2016-2032)
- Table 133: Middle East & Africa Mobile Mapping Market Revenue (US$ Mn) Comparison by Type Analysis (2016-2032)
- Table 134: Middle East & Africa Mobile Mapping Market Revenue (US$ Mn) Comparison by End-Use Industry (2016-2032)
- Table 135: Middle East & Africa Mobile Mapping Market Revenue (US$ Mn) Comparison by Technology Analysis (2016-2032)
- Table 136: Middle East & Africa Mobile Mapping Market Revenue (US$ Mn) Comparison by (2016-2032)
- Table 137: Middle East & Africa Mobile Mapping Market Y-o-Y Growth Rate Comparison by Country (2016-2032)
- Table 138: Middle East & Africa Mobile Mapping Market Y-o-Y Growth Rate Comparison by Type Analysis (2016-2032)
- Table 139: Middle East & Africa Mobile Mapping Market Y-o-Y Growth Rate Comparison by End-Use Industry (2016-2032)
- Table 140: Middle East & Africa Mobile Mapping Market Y-o-Y Growth Rate Comparison by Technology Analysis (2016-2032)
- Table 141: Middle East & Africa Mobile Mapping Market Y-o-Y Growth Rate Comparison by (2016-2032)
- Table 142: Middle East & Africa Mobile Mapping Market Share Comparison by Country (2016-2032)
- Table 143: Middle East & Africa Mobile Mapping Market Share Comparison by Type Analysis (2016-2032)
- Table 144: Middle East & Africa Mobile Mapping Market Share Comparison by End-Use Industry (2016-2032)
- Table 145: Middle East & Africa Mobile Mapping Market Share Comparison by Technology Analysis (2016-2032)
- Table 146: Middle East & Africa Mobile Mapping Market Share Comparison by (2016-2032)
- 1. Executive Summary
-
- Apple Maps
- Google Maps
- Tomtom NV
- Microsoft Corporation
- Mapbox
- HERE Technologies
- Garmin International
- Mitsubishi Electric Corporation
- OSI Geospatial Inc.
- Telefonaktiebolaget LM Ericsson
- Leica Geosystems Inc.
- Qualcomm Inc.
Our Clients


View Our Licence Options
