
Mineral Supplements Market Report By Product (Calcium, Iron, Magnesium, Potassium, Other Products), By Formulation (Tablets, Capsules, Powders, Other Formulations), By Application (General Health, Bone & Joint Health, Gastrointestinal Health, Immunity, Other Applications), By End-User, By Sales Channel, By Region and Companies - Industry Segment Outlook, Market Assessment, Competition Scenario, Trends and Forecast 2024-2033
-
45196
-
April 2024
-
290
-


-
This report was compiled by Trishita Deb Trishita Deb is an experienced market research and consulting professional with over 7 years of expertise across healthcare, consumer goods, and materials, contributing to over 400 healthcare-related reports. Correspondence Team Lead- Healthcare Linkedin | Detailed Market research Methodology Our methodology involves a mix of primary research, including interviews with leading mental health experts, and secondary research from reputable medical journals and databases. View Detailed Methodology Page
-
Quick Navigation
Report Overview
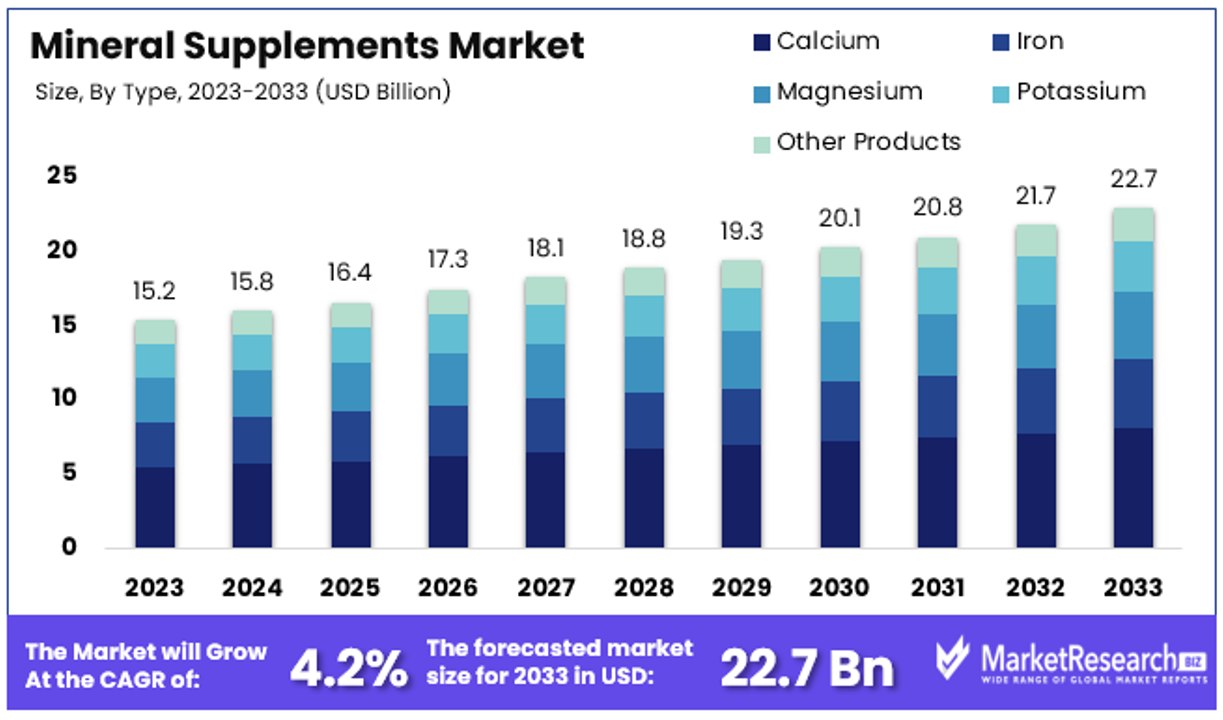
The Global Mineral Supplements Market size is expected to be worth around USD 22.7 Billion by 2033, from USD 15.2 Billion in 2023, growing at a CAGR of 4.20% during the forecast period from 2024 to 2033.
The Mineral Supplements Market encompasses the production, distribution, and sale of dietary supplements that contain essential minerals necessary for human health. This market caters to a growing consumer base that is increasingly aware of health and wellness.
Key products include supplements containing calcium, magnesium, iron, and zinc, which support various body functions such as bone health, immune system performance, and metabolic processes. The market is driven by factors such as aging populations, rising health consciousness, and preventive healthcare trends. It offers substantial growth opportunities for businesses focusing on innovative product formulations and targeted marketing strategies to reach health-conscious consumers.
The Mineral Supplements Market is poised for substantial growth, driven by key demographic and consumer trends. A significant driver is the aging population in the United States, which is projected to double by 2060, reaching nearly 100 million people aged 65 and older. This demographic shift underscores a growing market segment that typically exhibits a higher demand for mineral supplements, aiming to address age-related nutritional deficiencies and enhance overall health.
Additionally, population growth in specific regions such as Utah, which saw an increase to 3,417,734 in 2023, further bolsters the market. This growth is primarily attributed to natural increases and, to a lesser extent, net migration. Such demographic trends suggest a rising number of potential consumers within these locales, who may turn to dietary supplements as part of a proactive health management strategy.
Consumer behavior also plays a crucial role in market expansion. According to the 2023 CRN Consumer Survey on Dietary Supplements, an impressive three-quarters of Americans now use dietary supplements. This high adoption rate reflects a strong consumer consensus on the importance of supplements for maintaining health, indicating robust ongoing and future demand for mineral supplements.
The confluence of these factors—increasingly health-conscious aging populations, regional population growth, and high consumer adoption rates—creates a fertile environment for the mineral supplements market. Companies operating within this space are likely to find lucrative opportunities, particularly if they focus on innovative product development tailored to the specific health needs and preferences of these diverse consumer segments. This strategic focus will enable market players to capitalize on the prevailing trends and drive forward their market position and profitability.
Key Takeaways
- Market Value: The Global Mineral Supplements Market is projected to reach USD 22.7 billion by 2033, with significant growth from USD 15.2 billion in 2023, at a CAGR of 4.20% during the forecast period from 2024 to 2033.
- Product Analysis: Calcium leads with a dominant 33.6% market share, driven by its essential role in bone health and disease prevention.
- Formulation Analysis: Capsules dominate with a 41.2% market share, offering convenience and preferred by consumers.
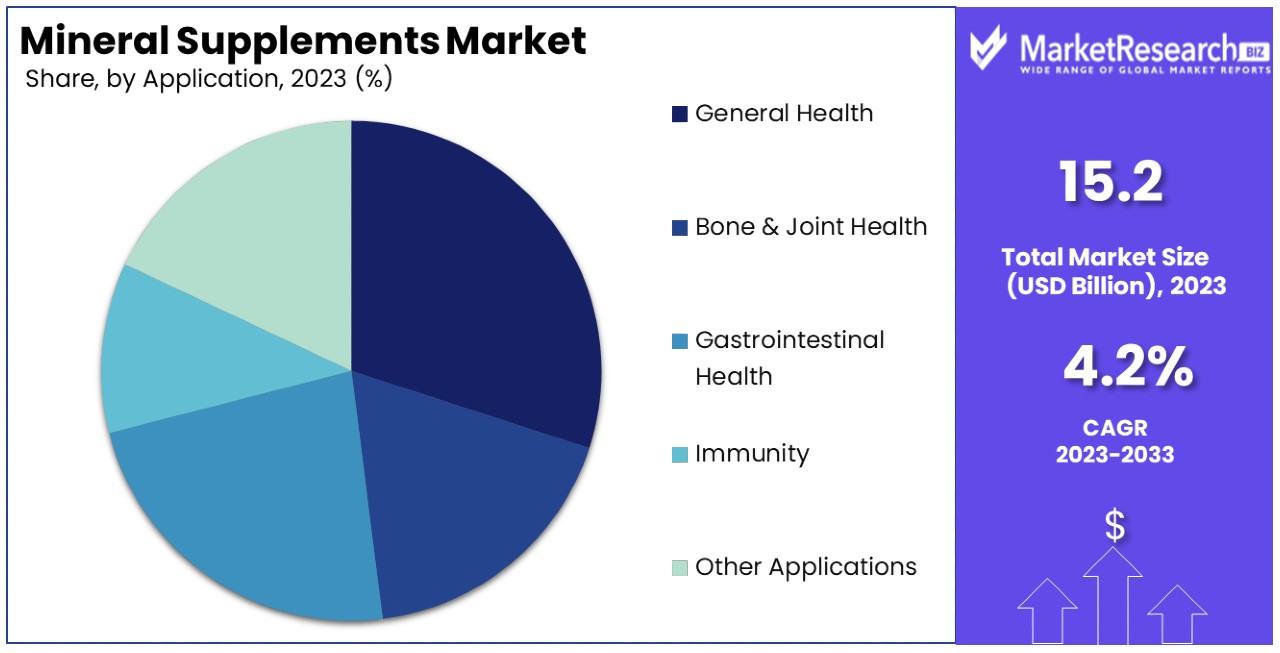
- Application Analysis: General Health holds a substantial 30.4% share, reflecting broad consumer awareness and the need for overall well-being.
- End-User Analysis: Adults represent the largest segment with a 36.8% market share, driven by high health awareness and purchasing power.
- Sales Channel Analysis: Pharmacies & Drug Stores lead with a 50.6% market share, offering trusted consumer advice and accessibility.
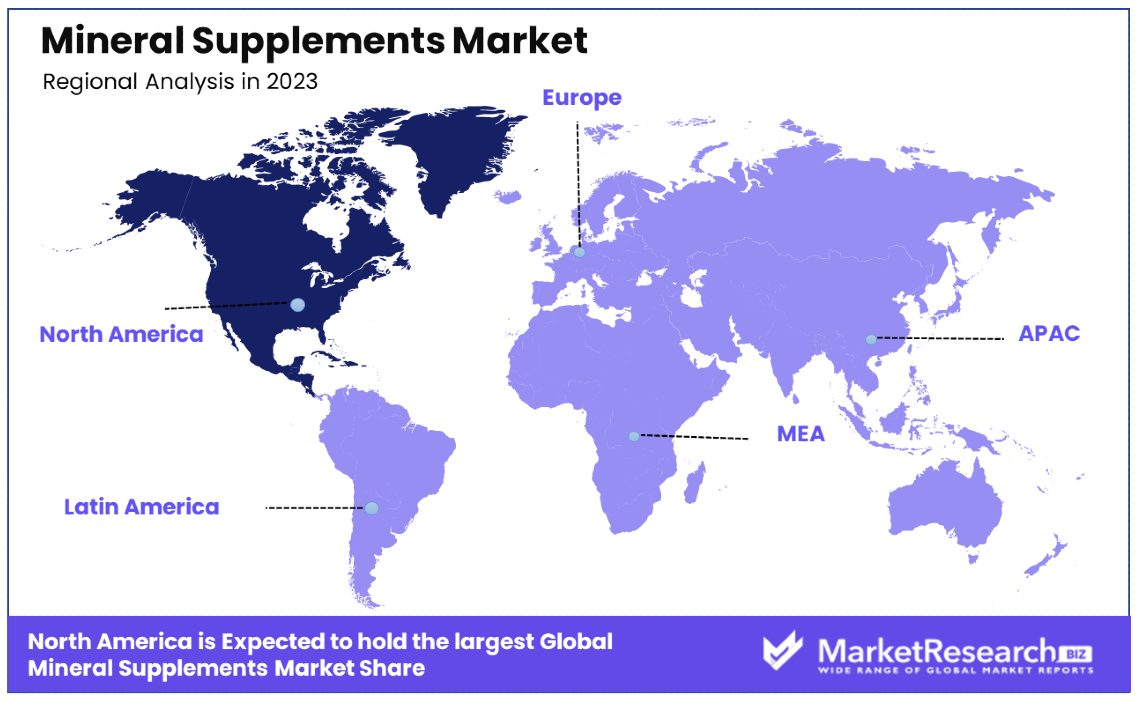
- North America: Dominates the market with a 39.6% share, driven by a focus on preventive healthcare and high consumer awareness about dietary supplements.
- Europe: Holds a 27.8% market share, with a similar emphasis on preventive healthcare and significant consumer awareness about dietary supplements.
- Analyst Viewpoint: The market is characterized by growing consumer awareness of health and wellness, driving demand for mineral supplements. Continuous product innovation, strategic marketing, and a focus on addressing specific consumer needs are key strategies for sustained growth in the market.
- Growth Opportunities: With increasing health consciousness and aging populations worldwide, the demand for mineral supplements is expected to continue growing. Opportunities exist for market players to expand their product portfolios, target niche consumer segments, and enhance distribution channels to capitalize on this growing demand.
Driving Factors
Aging Population Drives Market Growth
The aging global population significantly impacts the Mineral Supplements Market. As the number of elderly individuals increases, so does their need for specific nutrients to maintain health and vitality. The U.S. Census Bureau projects that the number of Americans aged 65 and older will double by 2060, reaching nearly 100 million.
This demographic shift boosts the demand for mineral supplements, particularly calcium and vitamin D3, which are critical in preventing age-related conditions like osteoporosis. Additionally, older adults often face challenges in nutrient absorption due to natural physiological changes, increasing their reliance on supplements to meet daily nutritional requirements. This growing demographic not only expands the customer base but also influences product development and marketing strategies within the industry, focusing on age-specific health concerns and preventive care.
Dietary Shifts and Lifestyle Changes Fuel Market Expansion
Changing dietary patterns and lifestyle shifts are crucial drivers for the Mineral Supplements Market. The rising popularity of vegetarian and vegan diets, which may lack sufficient iron, zinc, and calcium, prompts a growing segment of the population to seek out mineral supplements to fill nutritional gaps.
Furthermore, the modern fast-paced lifestyle, characterized by high stress and reliance on processed foods, often results in inadequate nutrient intake. This scenario creates a robust demand for mineral supplements as more individuals turn to these products to ensure balanced mineral consumption. The alignment of supplement offerings with these dietary trends and lifestyle needs not only meets consumer demand but also encourages the development of targeted products, enhancing market growth.
Chronic Disease Management Spurs Market Development
Mineral supplements play a pivotal role in managing and mitigating chronic diseases, which affects market dynamics significantly. For instance, chromium supplements are used to improve insulin sensitivity in individuals with diabetes, addressing a global diabetic population that continues to grow. Minerals like magnesium and potassium are integral in managing cardiovascular diseases and renal disorders, catering to a sizable patient demographic seeking non-pharmaceutical interventions.
This therapeutic use of mineral supplements underscores their importance in chronic disease strategies, leading to sustained demand as part of holistic health management practices. The integration of supplements into medical recommendations for chronic disease management not only broadens the consumer base but also enhances the credibility and perceived necessity of these products.
Sports Nutrition and Performance Enhancement Promote Market Growth
The demand for mineral supplements in the realm of sports nutrition and performance enhancement is a powerful growth driver. Athletes and fitness enthusiasts prioritize supplements to optimize muscle function, energy levels, and recovery processes. This specialized market segment is expanding as more individuals engage in regular physical activities and become aware of the nutritional requirements associated with sustained athletic performance.
The sports nutrition sector's focus on efficacy and innovation in supplement formulations further stimulates market growth, making it a lucrative niche for mineral supplement manufacturers. The synergy between sports nutrition advancements and mineral supplement development creates ongoing opportunities for market expansion and product innovation.
Restraining Factors
Potential Side Effects and Safety Concerns Restrain Market Growth
Safety concerns associated with the excessive intake of mineral supplements significantly restrict market growth. Overconsumption of supplements like iron can lead to serious health issues such as gastrointestinal distress, constipation, and potentially severe organ damage. These adverse effects create apprehension among potential consumers, who may hesitate to use these products out of fear of negative health impacts.
Moreover, the presence of such side effects can prompt negative media coverage and consumer reviews, which further dissuade new users and can lead to a decline in consumer trust and market demand. This situation underscores the need for clear communication and education regarding proper supplement usage to mitigate fear and misinformation in the market.
Regulatory Challenges Restrain Market Growth
Navigating the complex regulatory landscape presents a significant hurdle for the Mineral Supplements Market. Manufacturers must adhere to stringent regulations and guidelines concerning product labeling, marketing practices, and safety standards. These regulations, while important for ensuring consumer safety, often involve time-consuming and costly procedures for compliance and can limit the speed at which new products are introduced to the market.
The necessity of extensive safety trials and regulatory reviews can delay product launches and inhibit innovative product development, ultimately impacting the market's expansion potential. This complex regulatory environment necessitates substantial resources and strategic planning, posing a barrier to entry for new players and curbing the overall market growth.
Product Analysis
Calcium dominates with 33.6% share due to its crucial role in bone health and disease prevention.
The product segment of the Mineral Supplements Market is notably led by calcium, which holds a commanding 33.6% market share with a growth rate (CAGR) of 3.8%. This dominance is largely attributed to the widespread recognition of calcium's essential benefits in bone health, particularly in preventing osteoporosis—a concern primarily for the aging population. Additionally, calcium supplements are increasingly recommended for younger demographics, particularly women, to build bone density early in life, which further bolsters its market position.
While calcium leads this segment, other minerals like iron, magnesium, and potassium also play significant roles in market dynamics. Iron supplements are crucial for combating iron-deficiency anemia, prevalent in various demographic groups, including pregnant women and the elderly. Magnesium is gaining traction for its benefits in muscle function and sleep enhancement, while potassium is essential for cardiovascular health. The "Other Products" category, which includes zinc, chromium, and selenium, caters to a niche market focused on specific health concerns such as immune function and blood sugar regulation.
The diverse needs addressed by these various minerals contribute to a robust segment growth, as consumers increasingly turn to specific supplements to meet their personalized health requirements. This trend is further supported by growing health consciousness and a shift towards preventive healthcare, which drives the continuous expansion of the mineral supplements market beyond just the leading sub-segment.
Formulation Analysis
Capsules dominate with 41.2% share and a 4.2% CAGR due to convenience and consumer preference.
In the formulation segment of the Mineral Supplements Market, capsules stand out with a significant 41.2% market share and are projected to grow at a CAGR of 4.2%. This dominance can be attributed to the convenience capsules offer—easy to take, often odorless and tasteless, and typically perceived as more digestible compared to other forms. Capsules also allow for better dosage accuracy, which is crucial for consumers who are careful about nutrient intake.
Tablets, powders, and other formulations like gummies and liquid supplements also hold vital positions in the market. Tablets are a traditional choice for consumers and are valued for their long shelf life and cost-effectiveness. However, some consumers find tablets harder to swallow compared to capsules, which can limit their appeal to certain age groups or preferences. Powders are popular among those who prefer to mix their supplements with food or drinks, offering flexibility in how they are consumed.
Other formulations, including innovative delivery methods like gummies and effervescent tablets, cater to niche markets looking for convenience and an enjoyable consumption experience. These innovative forms are particularly appealing to younger demographics and are instrumental in expanding the user base by attracting individuals who might otherwise avoid traditional supplements.
The formulation segment's growth is driven by ongoing advancements in product development, targeting enhanced bioavailability, and consumer-friendly formats. As consumers become more particular about the type and form of supplements they consume, driven by lifestyle needs and personal preferences, the market sees a dynamic shift towards more sophisticated and tailored products. This trend underscores the importance of continuous innovation within the segment to maintain and expand market reach.
Application Analysis
General Health dominates with 30.4% share and 4.4% CAGR due to broad consumer awareness and need.
The application segment of the Mineral Supplements Market is predominantly driven by general health concerns, capturing a 30.4% market share with a growth rate of 4.4%. This segment's dominance is largely due to the universal appeal of supplements that support overall well-being, addressing a wide range of dietary deficiencies and health optimizations sought by consumers. As awareness of preventive health measures increases, more individuals turn to mineral supplements as a means to enhance general health, making this segment a primary driver of market growth.
Other significant applications such as bone and joint health, gastrointestinal health, immunity, and other specialized needs also play critical roles in segment diversification. Bone and joint health is a major concern for aging populations and those involved in physical activities, making calcium and magnesium supplements particularly popular. Gastrointestinal health is increasingly recognized, with minerals like magnesium being sought for their digestive benefits. Immunity, especially in the context of recent global health concerns, has seen a spike in demand for zinc and selenium supplements.
Each of these sub-segments contributes to the overall market by addressing specific consumer health concerns, thereby broadening the scope and reach of the market. Innovative product formulations aimed at these specific health applications continue to attract a wider audience, thereby supporting sustained growth in the mineral supplements market.
End-User Analysis
Adults dominate with 36.8% share and 4.1% CAGR due to high health awareness and purchasing power.
The end-user segment of the Mineral Supplements Market is significantly led by adults, who hold a 36.8% market share with a growth rate of 4.1%. Adults form the largest consumer base due to their higher health awareness and purchasing power. This demographic is actively engaged in health maintenance, often seeking supplements to address specific health issues or to improve overall wellness, which has propelled the segment to the forefront of the market.
Other key end-user segments include the geriatric, pregnant women, children, and infants, each with unique nutritional needs that influence product offerings. The geriatric segment is rapidly growing due to aging populations worldwide, requiring more targeted supplements for bone density, joint health, and cognitive function. Pregnant women are a crucial demographic due to the essential role of minerals in fetal development and maternal health. Children and infants' segments are expanding as parents seek to supplement their diets to support healthy growth and development.
These diversified end-user groups ensure steady demand across multiple life stages and health conditions, reinforcing the mineral supplements market's resilience and capacity for growth. Targeted marketing and product development geared toward these distinct consumer segments further enhance market penetration and expansion.
Sales Channel Analysis
Pharmacies & Drug Stores dominate with 50.6% share and 4.2% CAGR due to trusted consumer advice and accessibility.
In the sales channel segment, pharmacies and drug stores hold the largest market share at 50.6% and exhibit a growth rate of 4.2%. This dominant position is primarily due to the trust and reliability consumers place in pharmacists and the immediate product availability these outlets offer. Consumers often prefer purchasing their health supplements from pharmacies due to the professional advice available, ensuring that they select the most appropriate products for their health needs.
Supermarkets and hypermarkets, along with online channels, also contribute significantly to the market. Supermarkets and hypermarkets offer convenience and competitive pricing, which appeals to a broad consumer base, especially in urban areas. Meanwhile, online sales channels have seen exponential growth, driven by the increasing comfort with e-commerce, broader selection, and often lower prices. The convenience of home delivery and easy access to product information and reviews online enhance consumer engagement and drive sales.
The integration of these diverse sales channels enables the mineral supplements market to cater to varying consumer preferences and shopping behaviors, increasing market reach and sales volumes. Each channel offers unique advantages, from expert advice in pharmacies to the convenience and breadth of choice in online platforms, contributing to the overall growth and dynamism of the market.
Key Market Segments
By Product
- Calcium
- Iron
- Magnesium
- Potassium
- Other Products
By Formulation
- Tablets
- Capsules
- Powders
- Other Formulations
By Application
- General Health
- Bone & Joint Health
- Gastrointestinal Health
- Immunity
- Other Applications
By End-User
- Adults
- Geriatric
- Pregnant Women
- Children
- Infants
By Sales Channel
- Pharmacies & Drug Stores
- Supermarkets & Hypermarkets
- Online Channels
Growth Opportunities
Personalized Nutrition and Targeted Supplementation Offers Growth Opportunity
The move towards personalized nutrition and targeted supplementation marks a significant expansion opportunity within the Mineral Supplements Market. By focusing on individualized supplement formulations, companies can address specific needs based on demographic factors, health conditions, or even genetic dispositions. This approach not only enhances the efficacy of the products but also significantly increases consumer satisfaction and loyalty.
For instance, prenatal mineral supplements for expectant mothers or specialized blends for those with particular genetic markers demonstrate the market's potential to diversify and specialize. Such personalized products can command higher prices and foster a strong brand identity, setting the stage for sustained growth in niche but lucrative segments of the market.
Innovative Delivery Forms and Enhanced Bioavailability Offers Growth Opportunity
Innovation in delivery forms and the enhancement of bioavailability are key drivers for growth in the Mineral Supplements Market. The development of advanced delivery technologies such as liposomes, nanoparticles, or sustained-release formats can significantly improve the absorption and effectiveness of mineral supplements.
These innovative forms cater to consumer preferences for faster and more noticeable health benefits, thereby enhancing product appeal. Moreover, these advancements allow companies to differentiate their products in a crowded market, attracting health-conscious consumers looking for supplements that offer superior performance. This focus on high-efficiency delivery systems not only meets consumer demands but also opens new avenues for market expansion, particularly in segments that prioritize quick and tangible health outcomes.
Trending Factors
Clean Label and Sustainable Sourcing Are Trending Factors
Clean label and sustainable sourcing are becoming key trends in the Mineral Supplements Market. According to the International Food Information Council, 38% of consumers consider sustainability important when making purchasing decisions. This growing consumer preference for products that are transparently sourced and produced with environmental consciousness is pushing companies to adopt practices that prioritize natural and plant-based sources.
By focusing on clean labels—which detail all ingredients clearly and succinctly—and sustainable sourcing methods, companies can attract a larger segment of eco-conscious consumers. This trend not only meets current consumer demand but also positions brands as responsible and forward-thinking, potentially increasing their market share and consumer loyalty in a competitive landscape.
Condition-Specific Mineral Formulations Are Trending Factors
Condition-specific mineral formulations are significantly trending in the Mineral Supplements Market. This trend reflects a shift towards more specialized healthcare solutions, where consumers seek products tailored to specific health needs such as bone health, cognitive function, or cardiovascular support.
By developing and marketing supplements that address these precise health concerns, companies can tap into a growing segment of informed consumers who prioritize targeted health interventions. This focus on condition-specific formulations allows brands to differentiate their offerings and capture significant growth opportunities in a rapidly evolving market.
Regional Analysis
North America Dominates with 39.6% Market Share
North America's dominance in the Mineral Supplements Market, with a market share of 39.6%, is driven by several key factors. High health awareness and disposable income allow consumers to invest in health products, including mineral supplements. The region also benefits from advanced healthcare infrastructure and widespread availability of diverse supplement products. Furthermore, the aging population in countries like the United States, which is set to double by 2060, significantly contributes to the demand for mineral supplements aimed at health maintenance and disease prevention.
The market dynamics in North America are influenced by a well-established wellness culture and the prevalence of chronic diseases, which encourage proactive health management through dietary supplements. Regulatory support for health claims related to supplements also plays a critical role in driving consumer confidence and market growth. Additionally, a strong retail network and effective online distribution channels enhance product accessibility, making it easier for consumers to purchase mineral supplements.
North America is expected to maintain a strong influence in the global Mineral Supplements Market. Continued innovation in product development, coupled with strategic marketing and educational campaigns about the benefits of mineral supplementation, will likely sustain market growth. The increasing trend toward personalized nutrition could further boost the market as companies leverage new technologies to meet individual health needs.
Regional Market Shares and Growth Rates:
- Europe: Holds a 27.8% market share with a focus on preventive healthcare and high consumer awareness about dietary supplements.
- Asia Pacific: Commands a 22.3% market share, driven by increasing disposable incomes and rapid urbanization, with a high growth rate due to expanding health consciousness.
- Middle East & Africa: Accounts for 5.9% of the market, with growth potential linked to economic development and increasing health awareness.
- Latin America: Represents 4.4% of the market, where growth is stimulated by improving healthcare infrastructure and rising health awareness among the population.
Key Regions and Countries
- North America
- The US
- Canada
- Mexico
- Western Europe
- Germany
- France
- The UK
- Spain
- Italy
- Portugal
- Ireland
- Austria
- Switzerland
- Benelux
- Nordic
- Rest of Western Europe
- Eastern Europe
- Russia
- Poland
- The Czech Republic
- Greece
- Rest of Eastern Europe
- APAC
- China
- Japan
- South Korea
- India
- Australia & New Zealand
- Indonesia
- Malaysia
- Philippines
- Singapore
- Thailand
- Vietnam
- Rest of APAC
- Latin America
- Brazil
- Colombia
- Chile
- Argentina
- Costa Rica
- Rest of Latin America
- Middle East & Africa
- Algeria
- Egypt
- Israel
- Kuwait
- Nigeria
- Saudi Arabia
- South Africa
- Turkey
- United Arab Emirates
- Rest of MEA
Key Players Analysis
In the mineral supplements market, several key players significantly shape the industry dynamics. Amway India, Abbott Laboratories, and Herbalife Nutrition Ltd. lead in market penetration and consumer trust, leveraging their extensive distribution networks and well-established brands. Nestlé Health Science and Glaxosmithkline PLC excel in innovation and research, developing scientifically backed products that appeal to health-conscious consumers.
Companies like Archer Daniels Midland Company and Koninklijke DSM NV are crucial for their role in raw material supply and technological advancements in supplement production. This strategic positioning allows them to influence pricing and availability across the market. Pharmavite LLC and Webber Naturals focus on quality and affordability, making mineral supplements accessible to a broader audience.
Emerging players like Hainan Yangshengtang and Blackmores Limited are expanding their market share by capitalizing on regional growth opportunities and consumer preferences for natural products. E. I. du Pont de Nemours, with its expertise in biotechnology, plays a pivotal role in enhancing the nutritional value and efficacy of mineral supplements.
Overall, these companies' combined efforts in innovation, market expansion, and consumer engagement drive the growth and transformation of the mineral supplements market.
Market Key Players
- Amway India
- Nestlé Health Science
- Hainan Yangshengtang
- Abbott Laboratories
- Archer Daniels Midland Company
- Herbalife Nutrition Ltd.
- Webber Naturals
- Pharmavite LLC
- Glaxosmithkline PLC
- E. I. du Pont de Nemours
- Blackmores Limited
- Koninklijke DSM NV
Recent Developments
- On April 2024, SmartyPants Vitamins, a company founded in 2011, announced the launch of their Kids Fiber & Veggies Supplement. The company is known for providing high-quality vitamins and supplements that support the healthy development of families. Their supplements feature bioavailable forms of nutrients to address nutritional gaps and offer comprehensive, great-tasting solutions for daily health. All SmartyPants supplements are third-party lab tested for purity, potency, and safety.
- On Jan 2024, iHerb, one of the world's leading e-commerce retailers for vitamins, minerals, supplements, and other health and wellness products, announced a unique collaboration with former heavyweight champion Mike Tyson. Tyson, recognized as one of the greatest boxers of all time, will be sharing the daily supplement combo he takes to support athletic performance, recovery, and overall vitality through a personalized collection available exclusively at iHerb.com.
- On Sept 2023, Dr. Reddy's, a leading global pharmaceutical company, announced their plan to set up a subsidiary for nutraceuticals and supplements. This move is expected to strengthen their position in the growing market for nutritional supplements and health products.
Report Scope
Report Features Description Market Value (2023) USD 15.2 Billion Forecast Revenue (2033) USD 22.7 Billion CAGR (2024-2033) 4.20% Base Year for Estimation 2023 Historic Period 2018-2023 Forecast Period 2024-2033 Report Coverage Revenue Forecast, Market Dynamics, Competitive Landscape, Recent Developments Segments Covered By Product (Calcium, Iron, Magnesium, Potassium, Other Products), By Formulation (Tablets, Capsules, Powders, Other Formulations), By Application (General Health, Bone & Joint Health, Gastrointestinal Health, Immunity, Other Applications), By End-User (Adults, Geriatric, Pregnant Women, Children, Infants), By Sales Channel (Pharmacies & Drug Stores, Supermarkets & Hypermarkets, Online Channels) Regional Analysis North America - The US, Canada, & Mexico; Western Europe - Germany, France, The UK, Spain, Italy, Portugal, Ireland, Austria, Switzerland, Benelux, Nordic, & Rest of Western Europe; Eastern Europe - Russia, Poland, The Czech Republic, Greece, & Rest of Eastern Europe; APAC - China, Japan, South Korea, India, Australia & New Zealand, Indonesia, Malaysia, Philippines, Singapore, Thailand, Vietnam, & Rest of APAC; Latin America - Brazil, Colombia, Chile, Argentina, Costa Rica, & Rest of Latin America; Middle East & Africa - Algeria, Egypt, Israel, Kuwait, Nigeria, Saudi Arabia, South Africa, Turkey, United Arab Emirates, & Rest of MEA Competitive Landscape Amway India, Nestlé Health Science, Hainan Yangshengtang, Abbott Laboratories, Archer Daniels Midland Company, Herbalife Nutrition Ltd., Webber Naturals, Pharmavite LLC, Glaxosmithkline PLC, E. I. du Pont de Nemours, Blackmores Limited, Koninklijke DSM NV Customization Scope Customization for segments, region/country-level will be provided. Moreover, additional customization can be done based on the requirements. Purchase Options We have three licenses to opt for: Single User License, Multi-User License (Up to 5 Users), Corporate Use License (Unlimited User and Printable PDF) -
- 1. Executive Summary
- 1.1. Definition
- 1.2. Taxonomy
- 1.3. Research Scope
- 1.4. Key Analysis
- 1.5. Key Findings by Major Segments
- 1.6. Top strategies by Major Players
- 2. Global Mineral Supplements Market Overview
- 2.1. Mineral Supplements Market Dynamics
- 2.1.1. Drivers
- 2.1.2. Opportunities
- 2.1.3. Restraints
- 2.1.4. Challenges
- 2.2. Macro-economic Factors
- 2.3. Regulatory Framework
- 2.4. Market Investment Feasibility Index
- 2.5. PEST Analysis
- 2.6. PORTER’S Five Force Analysis
- 2.7. Drivers & Restraints Impact Analysis
- 2.8. Industry Chain Analysis
- 2.9. Cost Structure Analysis
- 2.10. Marketing Strategy
- 2.11. Russia-Ukraine War Impact Analysis
- 2.12. Opportunity Map Analysis
- 2.13. Market Competition Scenario Analysis
- 2.14. Product Life Cycle Analysis
- 2.15. Opportunity Orbits
- 2.16. Manufacturer Intensity Map
- 2.17. Major Companies sales by Value & Volume
- 2.1. Mineral Supplements Market Dynamics
- 3. Global Mineral Supplements Market Analysis, Opportunity and Forecast, 2016-2032
- 3.1. Global Mineral Supplements Market Analysis, 2016-2021
- 3.2. Global Mineral Supplements Market Opportunity and Forecast, 2023-2032
- 3.3. Global Mineral Supplements Market Analysis, Opportunity and Forecast, By Product, 2016-2032
- 3.3.1. Global Mineral Supplements Market Analysis by Product: Introduction
- 3.3.2. Market Size Absolute $ Opportunity Analysis and Forecast, By Product, 2016-2032
- 3.3.3. Calcium
- 3.3.4. Iron
- 3.3.5. Magnesium
- 3.3.6. Potassium
- 3.3.7. Other Products
- 3.4. Global Mineral Supplements Market Analysis, Opportunity and Forecast, By Formulation, 2016-2032
- 3.4.1. Global Mineral Supplements Market Analysis by Formulation: Introduction
- 3.4.2. Market Size Absolute $ Opportunity Analysis and Forecast, By Formulation, 2016-2032
- 3.4.3. Tablets
- 3.4.4. Capsules
- 3.4.5. Powders
- 3.4.6. Other Formulations
- 3.5. Global Mineral Supplements Market Analysis, Opportunity and Forecast, By Application, 2016-2032
- 3.5.1. Global Mineral Supplements Market Analysis by Application: Introduction
- 3.5.2. Market Size Absolute $ Opportunity Analysis and Forecast, By Application, 2016-2032
- 3.5.3. General Health
- 3.5.4. Bone & Joint Health
- 3.5.5. Gastrointestinal Health
- 3.5.6. Immunity
- 3.5.7. Other Applications
- 3.6. Global Mineral Supplements Market Analysis, Opportunity and Forecast, By End-User, 2016-2032
- 3.6.1. Global Mineral Supplements Market Analysis by End-User: Introduction
- 3.6.2. Market Size Absolute $ Opportunity Analysis and Forecast, By End-User, 2016-2032
- 3.6.3. Adults
- 3.6.4. Geriatric
- 3.6.5. Pregnant Women
- 3.6.6. Children
- 3.6.7. Infants
- 3.7. Global Mineral Supplements Market Analysis, Opportunity and Forecast, By Sales Channel, 2016-2032
- 3.7.1. Global Mineral Supplements Market Analysis by Sales Channel: Introduction
- 3.7.2. Market Size Absolute $ Opportunity Analysis and Forecast, By Sales Channel, 2016-2032
- 3.7.3. Pharmacies & Drug Stores
- 3.7.4. Supermarkets & Hypermarkets
- 3.7.5. Online Channels
- 3.7.6. Product Type
- 3.7.7. Antibiotic
- 3.7.8. Analgesics
- 3.7.9. Others
- 4. North America Mineral Supplements Market Analysis, Opportunity and Forecast, 2016-2032
- 4.1. North America Mineral Supplements Market Analysis, 2016-2021
- 4.2. North America Mineral Supplements Market Opportunity and Forecast, 2023-2032
- 4.3. North America Mineral Supplements Market Analysis, Opportunity and Forecast, By Product, 2016-2032
- 4.3.1. North America Mineral Supplements Market Analysis by Product: Introduction
- 4.3.2. Market Size Absolute $ Opportunity Analysis and Forecast, By Product, 2016-2032
- 4.3.3. Calcium
- 4.3.4. Iron
- 4.3.5. Magnesium
- 4.3.6. Potassium
- 4.3.7. Other Products
- 4.4. North America Mineral Supplements Market Analysis, Opportunity and Forecast, By Formulation, 2016-2032
- 4.4.1. North America Mineral Supplements Market Analysis by Formulation: Introduction
- 4.4.2. Market Size Absolute $ Opportunity Analysis and Forecast, By Formulation, 2016-2032
- 4.4.3. Tablets
- 4.4.4. Capsules
- 4.4.5. Powders
- 4.4.6. Other Formulations
- 4.5. North America Mineral Supplements Market Analysis, Opportunity and Forecast, By Application, 2016-2032
- 4.5.1. North America Mineral Supplements Market Analysis by Application: Introduction
- 4.5.2. Market Size Absolute $ Opportunity Analysis and Forecast, By Application, 2016-2032
- 4.5.3. General Health
- 4.5.4. Bone & Joint Health
- 4.5.5. Gastrointestinal Health
- 4.5.6. Immunity
- 4.5.7. Other Applications
- 4.6. North America Mineral Supplements Market Analysis, Opportunity and Forecast, By End-User, 2016-2032
- 4.6.1. North America Mineral Supplements Market Analysis by End-User: Introduction
- 4.6.2. Market Size Absolute $ Opportunity Analysis and Forecast, By End-User, 2016-2032
- 4.6.3. Adults
- 4.6.4. Geriatric
- 4.6.5. Pregnant Women
- 4.6.6. Children
- 4.6.7. Infants
- 4.7. North America Mineral Supplements Market Analysis, Opportunity and Forecast, By Sales Channel, 2016-2032
- 4.7.1. North America Mineral Supplements Market Analysis by Sales Channel: Introduction
- 4.7.2. Market Size Absolute $ Opportunity Analysis and Forecast, By Sales Channel, 2016-2032
- 4.7.3. Pharmacies & Drug Stores
- 4.7.4. Supermarkets & Hypermarkets
- 4.7.5. Online Channels
- 4.7.6. Product Type
- 4.7.7. Antibiotic
- 4.7.8. Analgesics
- 4.7.9. Others
- 4.8. North America Mineral Supplements Market Analysis, Opportunity and Forecast, By Country , 2016-2032
- 4.8.1. North America Mineral Supplements Market Analysis by Country : Introduction
- 4.8.2. Market Size Absolute $ Opportunity Analysis and Forecast, Country , 2016-2032
- 4.8.2.1. The US
- 4.8.2.2. Canada
- 4.8.2.3. Mexico
- 5. Western Europe Mineral Supplements Market Analysis, Opportunity and Forecast, 2016-2032
- 5.1. Western Europe Mineral Supplements Market Analysis, 2016-2021
- 5.2. Western Europe Mineral Supplements Market Opportunity and Forecast, 2023-2032
- 5.3. Western Europe Mineral Supplements Market Analysis, Opportunity and Forecast, By Product, 2016-2032
- 5.3.1. Western Europe Mineral Supplements Market Analysis by Product: Introduction
- 5.3.2. Market Size Absolute $ Opportunity Analysis and Forecast, By Product, 2016-2032
- 5.3.3. Calcium
- 5.3.4. Iron
- 5.3.5. Magnesium
- 5.3.6. Potassium
- 5.3.7. Other Products
- 5.4. Western Europe Mineral Supplements Market Analysis, Opportunity and Forecast, By Formulation, 2016-2032
- 5.4.1. Western Europe Mineral Supplements Market Analysis by Formulation: Introduction
- 5.4.2. Market Size Absolute $ Opportunity Analysis and Forecast, By Formulation, 2016-2032
- 5.4.3. Tablets
- 5.4.4. Capsules
- 5.4.5. Powders
- 5.4.6. Other Formulations
- 5.5. Western Europe Mineral Supplements Market Analysis, Opportunity and Forecast, By Application, 2016-2032
- 5.5.1. Western Europe Mineral Supplements Market Analysis by Application: Introduction
- 5.5.2. Market Size Absolute $ Opportunity Analysis and Forecast, By Application, 2016-2032
- 5.5.3. General Health
- 5.5.4. Bone & Joint Health
- 5.5.5. Gastrointestinal Health
- 5.5.6. Immunity
- 5.5.7. Other Applications
- 5.6. Western Europe Mineral Supplements Market Analysis, Opportunity and Forecast, By End-User, 2016-2032
- 5.6.1. Western Europe Mineral Supplements Market Analysis by End-User: Introduction
- 5.6.2. Market Size Absolute $ Opportunity Analysis and Forecast, By End-User, 2016-2032
- 5.6.3. Adults
- 5.6.4. Geriatric
- 5.6.5. Pregnant Women
- 5.6.6. Children
- 5.6.7. Infants
- 5.7. Western Europe Mineral Supplements Market Analysis, Opportunity and Forecast, By Sales Channel, 2016-2032
- 5.7.1. Western Europe Mineral Supplements Market Analysis by Sales Channel: Introduction
- 5.7.2. Market Size Absolute $ Opportunity Analysis and Forecast, By Sales Channel, 2016-2032
- 5.7.3. Pharmacies & Drug Stores
- 5.7.4. Supermarkets & Hypermarkets
- 5.7.5. Online Channels
- 5.7.6. Product Type
- 5.7.7. Antibiotic
- 5.7.8. Analgesics
- 5.7.9. Others
- 5.8. Western Europe Mineral Supplements Market Analysis, Opportunity and Forecast, By Country , 2016-2032
- 5.8.1. Western Europe Mineral Supplements Market Analysis by Country : Introduction
- 5.8.2. Market Size Absolute $ Opportunity Analysis and Forecast, Country , 2016-2032
- 5.8.2.1. Germany
- 5.8.2.2. France
- 5.8.2.3. The UK
- 5.8.2.4. Spain
- 5.8.2.5. Italy
- 5.8.2.6. Portugal
- 5.8.2.7. Ireland
- 5.8.2.8. Austria
- 5.8.2.9. Switzerland
- 5.8.2.10. Benelux
- 5.8.2.11. Nordic
- 5.8.2.12. Rest of Western Europe
- 6. Eastern Europe Mineral Supplements Market Analysis, Opportunity and Forecast, 2016-2032
- 6.1. Eastern Europe Mineral Supplements Market Analysis, 2016-2021
- 6.2. Eastern Europe Mineral Supplements Market Opportunity and Forecast, 2023-2032
- 6.3. Eastern Europe Mineral Supplements Market Analysis, Opportunity and Forecast, By Product, 2016-2032
- 6.3.1. Eastern Europe Mineral Supplements Market Analysis by Product: Introduction
- 6.3.2. Market Size Absolute $ Opportunity Analysis and Forecast, By Product, 2016-2032
- 6.3.3. Calcium
- 6.3.4. Iron
- 6.3.5. Magnesium
- 6.3.6. Potassium
- 6.3.7. Other Products
- 6.4. Eastern Europe Mineral Supplements Market Analysis, Opportunity and Forecast, By Formulation, 2016-2032
- 6.4.1. Eastern Europe Mineral Supplements Market Analysis by Formulation: Introduction
- 6.4.2. Market Size Absolute $ Opportunity Analysis and Forecast, By Formulation, 2016-2032
- 6.4.3. Tablets
- 6.4.4. Capsules
- 6.4.5. Powders
- 6.4.6. Other Formulations
- 6.5. Eastern Europe Mineral Supplements Market Analysis, Opportunity and Forecast, By Application, 2016-2032
- 6.5.1. Eastern Europe Mineral Supplements Market Analysis by Application: Introduction
- 6.5.2. Market Size Absolute $ Opportunity Analysis and Forecast, By Application, 2016-2032
- 6.5.3. General Health
- 6.5.4. Bone & Joint Health
- 6.5.5. Gastrointestinal Health
- 6.5.6. Immunity
- 6.5.7. Other Applications
- 6.6. Eastern Europe Mineral Supplements Market Analysis, Opportunity and Forecast, By End-User, 2016-2032
- 6.6.1. Eastern Europe Mineral Supplements Market Analysis by End-User: Introduction
- 6.6.2. Market Size Absolute $ Opportunity Analysis and Forecast, By End-User, 2016-2032
- 6.6.3. Adults
- 6.6.4. Geriatric
- 6.6.5. Pregnant Women
- 6.6.6. Children
- 6.6.7. Infants
- 6.7. Eastern Europe Mineral Supplements Market Analysis, Opportunity and Forecast, By Sales Channel, 2016-2032
- 6.7.1. Eastern Europe Mineral Supplements Market Analysis by Sales Channel: Introduction
- 6.7.2. Market Size Absolute $ Opportunity Analysis and Forecast, By Sales Channel, 2016-2032
- 6.7.3. Pharmacies & Drug Stores
- 6.7.4. Supermarkets & Hypermarkets
- 6.7.5. Online Channels
- 6.7.6. Product Type
- 6.7.7. Antibiotic
- 6.7.8. Analgesics
- 6.7.9. Others
- 6.8. Eastern Europe Mineral Supplements Market Analysis, Opportunity and Forecast, By Country , 2016-2032
- 6.8.1. Eastern Europe Mineral Supplements Market Analysis by Country : Introduction
- 6.8.2. Market Size Absolute $ Opportunity Analysis and Forecast, Country , 2016-2032
- 6.8.2.1. Russia
- 6.8.2.2. Poland
- 6.8.2.3. The Czech Republic
- 6.8.2.4. Greece
- 6.8.2.5. Rest of Eastern Europe
- 7. APAC Mineral Supplements Market Analysis, Opportunity and Forecast, 2016-2032
- 7.1. APAC Mineral Supplements Market Analysis, 2016-2021
- 7.2. APAC Mineral Supplements Market Opportunity and Forecast, 2023-2032
- 7.3. APAC Mineral Supplements Market Analysis, Opportunity and Forecast, By Product, 2016-2032
- 7.3.1. APAC Mineral Supplements Market Analysis by Product: Introduction
- 7.3.2. Market Size Absolute $ Opportunity Analysis and Forecast, By Product, 2016-2032
- 7.3.3. Calcium
- 7.3.4. Iron
- 7.3.5. Magnesium
- 7.3.6. Potassium
- 7.3.7. Other Products
- 7.4. APAC Mineral Supplements Market Analysis, Opportunity and Forecast, By Formulation, 2016-2032
- 7.4.1. APAC Mineral Supplements Market Analysis by Formulation: Introduction
- 7.4.2. Market Size Absolute $ Opportunity Analysis and Forecast, By Formulation, 2016-2032
- 7.4.3. Tablets
- 7.4.4. Capsules
- 7.4.5. Powders
- 7.4.6. Other Formulations
- 7.5. APAC Mineral Supplements Market Analysis, Opportunity and Forecast, By Application, 2016-2032
- 7.5.1. APAC Mineral Supplements Market Analysis by Application: Introduction
- 7.5.2. Market Size Absolute $ Opportunity Analysis and Forecast, By Application, 2016-2032
- 7.5.3. General Health
- 7.5.4. Bone & Joint Health
- 7.5.5. Gastrointestinal Health
- 7.5.6. Immunity
- 7.5.7. Other Applications
- 7.6. APAC Mineral Supplements Market Analysis, Opportunity and Forecast, By End-User, 2016-2032
- 7.6.1. APAC Mineral Supplements Market Analysis by End-User: Introduction
- 7.6.2. Market Size Absolute $ Opportunity Analysis and Forecast, By End-User, 2016-2032
- 7.6.3. Adults
- 7.6.4. Geriatric
- 7.6.5. Pregnant Women
- 7.6.6. Children
- 7.6.7. Infants
- 7.7. APAC Mineral Supplements Market Analysis, Opportunity and Forecast, By Sales Channel, 2016-2032
- 7.7.1. APAC Mineral Supplements Market Analysis by Sales Channel: Introduction
- 7.7.2. Market Size Absolute $ Opportunity Analysis and Forecast, By Sales Channel, 2016-2032
- 7.7.3. Pharmacies & Drug Stores
- 7.7.4. Supermarkets & Hypermarkets
- 7.7.5. Online Channels
- 7.7.6. Product Type
- 7.7.7. Antibiotic
- 7.7.8. Analgesics
- 7.7.9. Others
- 7.8. APAC Mineral Supplements Market Analysis, Opportunity and Forecast, By Country , 2016-2032
- 7.8.1. APAC Mineral Supplements Market Analysis by Country : Introduction
- 7.8.2. Market Size Absolute $ Opportunity Analysis and Forecast, Country , 2016-2032
- 7.8.2.1. China
- 7.8.2.2. Japan
- 7.8.2.3. South Korea
- 7.8.2.4. India
- 7.8.2.5. Australia & New Zeland
- 7.8.2.6. Indonesia
- 7.8.2.7. Malaysia
- 7.8.2.8. Philippines
- 7.8.2.9. Singapore
- 7.8.2.10. Thailand
- 7.8.2.11. Vietnam
- 7.8.2.12. Rest of APAC
- 8. Latin America Mineral Supplements Market Analysis, Opportunity and Forecast, 2016-2032
- 8.1. Latin America Mineral Supplements Market Analysis, 2016-2021
- 8.2. Latin America Mineral Supplements Market Opportunity and Forecast, 2023-2032
- 8.3. Latin America Mineral Supplements Market Analysis, Opportunity and Forecast, By Product, 2016-2032
- 8.3.1. Latin America Mineral Supplements Market Analysis by Product: Introduction
- 8.3.2. Market Size Absolute $ Opportunity Analysis and Forecast, By Product, 2016-2032
- 8.3.3. Calcium
- 8.3.4. Iron
- 8.3.5. Magnesium
- 8.3.6. Potassium
- 8.3.7. Other Products
- 8.4. Latin America Mineral Supplements Market Analysis, Opportunity and Forecast, By Formulation, 2016-2032
- 8.4.1. Latin America Mineral Supplements Market Analysis by Formulation: Introduction
- 8.4.2. Market Size Absolute $ Opportunity Analysis and Forecast, By Formulation, 2016-2032
- 8.4.3. Tablets
- 8.4.4. Capsules
- 8.4.5. Powders
- 8.4.6. Other Formulations
- 8.5. Latin America Mineral Supplements Market Analysis, Opportunity and Forecast, By Application, 2016-2032
- 8.5.1. Latin America Mineral Supplements Market Analysis by Application: Introduction
- 8.5.2. Market Size Absolute $ Opportunity Analysis and Forecast, By Application, 2016-2032
- 8.5.3. General Health
- 8.5.4. Bone & Joint Health
- 8.5.5. Gastrointestinal Health
- 8.5.6. Immunity
- 8.5.7. Other Applications
- 8.6. Latin America Mineral Supplements Market Analysis, Opportunity and Forecast, By End-User, 2016-2032
- 8.6.1. Latin America Mineral Supplements Market Analysis by End-User: Introduction
- 8.6.2. Market Size Absolute $ Opportunity Analysis and Forecast, By End-User, 2016-2032
- 8.6.3. Adults
- 8.6.4. Geriatric
- 8.6.5. Pregnant Women
- 8.6.6. Children
- 8.6.7. Infants
- 8.7. Latin America Mineral Supplements Market Analysis, Opportunity and Forecast, By Sales Channel, 2016-2032
- 8.7.1. Latin America Mineral Supplements Market Analysis by Sales Channel: Introduction
- 8.7.2. Market Size Absolute $ Opportunity Analysis and Forecast, By Sales Channel, 2016-2032
- 8.7.3. Pharmacies & Drug Stores
- 8.7.4. Supermarkets & Hypermarkets
- 8.7.5. Online Channels
- 8.7.6. Product Type
- 8.7.7. Antibiotic
- 8.7.8. Analgesics
- 8.7.9. Others
- 8.8. Latin America Mineral Supplements Market Analysis, Opportunity and Forecast, By Country , 2016-2032
- 8.8.1. Latin America Mineral Supplements Market Analysis by Country : Introduction
- 8.8.2. Market Size Absolute $ Opportunity Analysis and Forecast, Country , 2016-2032
- 8.8.2.1. Brazil
- 8.8.2.2. Colombia
- 8.8.2.3. Chile
- 8.8.2.4. Argentina
- 8.8.2.5. Costa Rica
- 8.8.2.6. Rest of Latin America
- 9. Middle East & Africa Mineral Supplements Market Analysis, Opportunity and Forecast, 2016-2032
- 9.1. Middle East & Africa Mineral Supplements Market Analysis, 2016-2021
- 9.2. Middle East & Africa Mineral Supplements Market Opportunity and Forecast, 2023-2032
- 9.3. Middle East & Africa Mineral Supplements Market Analysis, Opportunity and Forecast, By Product, 2016-2032
- 9.3.1. Middle East & Africa Mineral Supplements Market Analysis by Product: Introduction
- 9.3.2. Market Size Absolute $ Opportunity Analysis and Forecast, By Product, 2016-2032
- 9.3.3. Calcium
- 9.3.4. Iron
- 9.3.5. Magnesium
- 9.3.6. Potassium
- 9.3.7. Other Products
- 9.4. Middle East & Africa Mineral Supplements Market Analysis, Opportunity and Forecast, By Formulation, 2016-2032
- 9.4.1. Middle East & Africa Mineral Supplements Market Analysis by Formulation: Introduction
- 9.4.2. Market Size Absolute $ Opportunity Analysis and Forecast, By Formulation, 2016-2032
- 9.4.3. Tablets
- 9.4.4. Capsules
- 9.4.5. Powders
- 9.4.6. Other Formulations
- 9.5. Middle East & Africa Mineral Supplements Market Analysis, Opportunity and Forecast, By Application, 2016-2032
- 9.5.1. Middle East & Africa Mineral Supplements Market Analysis by Application: Introduction
- 9.5.2. Market Size Absolute $ Opportunity Analysis and Forecast, By Application, 2016-2032
- 9.5.3. General Health
- 9.5.4. Bone & Joint Health
- 9.5.5. Gastrointestinal Health
- 9.5.6. Immunity
- 9.5.7. Other Applications
- 9.6. Middle East & Africa Mineral Supplements Market Analysis, Opportunity and Forecast, By End-User, 2016-2032
- 9.6.1. Middle East & Africa Mineral Supplements Market Analysis by End-User: Introduction
- 9.6.2. Market Size Absolute $ Opportunity Analysis and Forecast, By End-User, 2016-2032
- 9.6.3. Adults
- 9.6.4. Geriatric
- 9.6.5. Pregnant Women
- 9.6.6. Children
- 9.6.7. Infants
- 9.7. Middle East & Africa Mineral Supplements Market Analysis, Opportunity and Forecast, By Sales Channel, 2016-2032
- 9.7.1. Middle East & Africa Mineral Supplements Market Analysis by Sales Channel: Introduction
- 9.7.2. Market Size Absolute $ Opportunity Analysis and Forecast, By Sales Channel, 2016-2032
- 9.7.3. Pharmacies & Drug Stores
- 9.7.4. Supermarkets & Hypermarkets
- 9.7.5. Online Channels
- 9.7.6. Product Type
- 9.7.7. Antibiotic
- 9.7.8. Analgesics
- 9.7.9. Others
- 9.8. Middle East & Africa Mineral Supplements Market Analysis, Opportunity and Forecast, By Country , 2016-2032
- 9.8.1. Middle East & Africa Mineral Supplements Market Analysis by Country : Introduction
- 9.8.2. Market Size Absolute $ Opportunity Analysis and Forecast, Country , 2016-2032
- 9.8.2.1. Algeria
- 9.8.2.2. Egypt
- 9.8.2.3. Israel
- 9.8.2.4. Kuwait
- 9.8.2.5. Nigeria
- 9.8.2.6. Saudi Arabia
- 9.8.2.7. South Africa
- 9.8.2.8. Turkey
- 9.8.2.9. The UAE
- 9.8.2.10. Rest of MEA
- 10. Global Mineral Supplements Market Analysis, Opportunity and Forecast, By Region , 2016-2032
- 10.1. Global Mineral Supplements Market Analysis by Region : Introduction
- 10.2. Market Size Absolute $ Opportunity Analysis and Forecast, By Region , 2016-2032
- 10.2.1. North America
- 10.2.2. Western Europe
- 10.2.3. Eastern Europe
- 10.2.4. APAC
- 10.2.5. Latin America
- 10.2.6. Middle East & Africa
- 11. Global Mineral Supplements Market Competitive Landscape, Market Share Analysis, and Company Profiles
- 11.1. Market Share Analysis
- 11.2. Company Profiles
- 11.3. Amway India
- 11.3.1. Company Overview
- 11.3.2. Financial Highlights
- 11.3.3. Product Portfolio
- 11.3.4. SWOT Analysis
- 11.3.5. Key Strategies and Developments
- 11.4. Nestlé Health Science
- 11.4.1. Company Overview
- 11.4.2. Financial Highlights
- 11.4.3. Product Portfolio
- 11.4.4. SWOT Analysis
- 11.4.5. Key Strategies and Developments
- 11.5. Hainan Yangshengtang
- 11.5.1. Company Overview
- 11.5.2. Financial Highlights
- 11.5.3. Product Portfolio
- 11.5.4. SWOT Analysis
- 11.5.5. Key Strategies and Developments
- 11.6. Abbott Laboratories
- 11.6.1. Company Overview
- 11.6.2. Financial Highlights
- 11.6.3. Product Portfolio
- 11.6.4. SWOT Analysis
- 11.6.5. Key Strategies and Developments
- 11.7. Archer Daniels Midland Company
- 11.7.1. Company Overview
- 11.7.2. Financial Highlights
- 11.7.3. Product Portfolio
- 11.7.4. SWOT Analysis
- 11.7.5. Key Strategies and Developments
- 11.8. Herbalife Nutrition Ltd.
- 11.8.1. Company Overview
- 11.8.2. Financial Highlights
- 11.8.3. Product Portfolio
- 11.8.4. SWOT Analysis
- 11.8.5. Key Strategies and Developments
- 11.9. Webber Naturals
- 11.9.1. Company Overview
- 11.9.2. Financial Highlights
- 11.9.3. Product Portfolio
- 11.9.4. SWOT Analysis
- 11.9.5. Key Strategies and Developments
- 11.10. Pharmavite LLC
- 11.10.1. Company Overview
- 11.10.2. Financial Highlights
- 11.10.3. Product Portfolio
- 11.10.4. SWOT Analysis
- 11.10.5. Key Strategies and Developments
- 11.11. Glaxosmithkline PLC
- 11.11.1. Company Overview
- 11.11.2. Financial Highlights
- 11.11.3. Product Portfolio
- 11.11.4. SWOT Analysis
- 11.11.5. Key Strategies and Developments
- 11.12. E. I. du Pont de Nemours
- 11.12.1. Company Overview
- 11.12.2. Financial Highlights
- 11.12.3. Product Portfolio
- 11.12.4. SWOT Analysis
- 11.12.5. Key Strategies and Developments
- 11.13.1. Company Overview
- 11.13.2. Financial Highlights
- 11.13.3. Product Portfolio
- 11.13.4. SWOT Analysis
- 11.13.5. Key Strategies and Developments
- 11.14. Blackmores Limited
- 11.14.1. Company Overview
- 11.14.2. Financial Highlights
- 11.14.3. Product Portfolio
- 11.14.4. SWOT Analysis
- 11.14.5. Key Strategies and Developments
- 12. Assumptions and Acronyms
- 13. Research Methodology
- 14. Contact
- List of Figures
- Figure 1: Global Mineral Supplements Market Revenue (US$ Mn) Market Share by Product in 2022
- Figure 2: Global Mineral Supplements Market Attractiveness Analysis by Product, 2016-2032
- Figure 3: Global Mineral Supplements Market Revenue (US$ Mn) Market Share by Formulationin 2022
- Figure 4: Global Mineral Supplements Market Attractiveness Analysis by Formulation, 2016-2032
- Figure 5: Global Mineral Supplements Market Revenue (US$ Mn) Market Share by Applicationin 2022
- Figure 6: Global Mineral Supplements Market Attractiveness Analysis by Application, 2016-2032
- Figure 7: Global Mineral Supplements Market Revenue (US$ Mn) Market Share by End-Userin 2022
- Figure 8: Global Mineral Supplements Market Attractiveness Analysis by End-User, 2016-2032
- Figure 9: Global Mineral Supplements Market Revenue (US$ Mn) Market Share by Sales Channelin 2022
- Figure 10: Global Mineral Supplements Market Attractiveness Analysis by Sales Channel, 2016-2032
- Figure 11: Global Mineral Supplements Market Revenue (US$ Mn) Market Share by Region in 2022
- Figure 12: Global Mineral Supplements Market Attractiveness Analysis by Region, 2016-2032
- Figure 13: Global Mineral Supplements Market Revenue (US$ Mn) (2016-2032)
- Figure 14: Global Mineral Supplements Market Revenue (US$ Mn) Comparison by Region (2016-2032)
- Figure 15: Global Mineral Supplements Market Revenue (US$ Mn) Comparison by Product (2016-2032)
- Figure 16: Global Mineral Supplements Market Revenue (US$ Mn) Comparison by Formulation (2016-2032)
- Figure 17: Global Mineral Supplements Market Revenue (US$ Mn) Comparison by Application (2016-2032)
- Figure 18: Global Mineral Supplements Market Revenue (US$ Mn) Comparison by End-User (2016-2032)
- Figure 19: Global Mineral Supplements Market Revenue (US$ Mn) Comparison by Sales Channel (2016-2032)
- Figure 20: Global Mineral Supplements Market Y-o-Y Growth Rate Comparison by Region (2016-2032)
- Figure 21: Global Mineral Supplements Market Y-o-Y Growth Rate Comparison by Product (2016-2032)
- Figure 22: Global Mineral Supplements Market Y-o-Y Growth Rate Comparison by Formulation (2016-2032)
- Figure 23: Global Mineral Supplements Market Y-o-Y Growth Rate Comparison by Application (2016-2032)
- Figure 24: Global Mineral Supplements Market Y-o-Y Growth Rate Comparison by End-User (2016-2032)
- Figure 25: Global Mineral Supplements Market Y-o-Y Growth Rate Comparison by Sales Channel (2016-2032)
- Figure 26: Global Mineral Supplements Market Share Comparison by Region (2016-2032)
- Figure 27: Global Mineral Supplements Market Share Comparison by Product (2016-2032)
- Figure 28: Global Mineral Supplements Market Share Comparison by Formulation (2016-2032)
- Figure 29: Global Mineral Supplements Market Share Comparison by Application (2016-2032)
- Figure 30: Global Mineral Supplements Market Share Comparison by End-User (2016-2032)
- Figure 31: Global Mineral Supplements Market Share Comparison by Sales Channel (2016-2032)
- Figure 32: North America Mineral Supplements Market Revenue (US$ Mn) Market Share by Productin 2022
- Figure 33: North America Mineral Supplements Market Attractiveness Analysis by Product, 2016-2032
- Figure 34: North America Mineral Supplements Market Revenue (US$ Mn) Market Share by Formulationin 2022
- Figure 35: North America Mineral Supplements Market Attractiveness Analysis by Formulation, 2016-2032
- Figure 36: North America Mineral Supplements Market Revenue (US$ Mn) Market Share by Applicationin 2022
- Figure 37: North America Mineral Supplements Market Attractiveness Analysis by Application, 2016-2032
- Figure 38: North America Mineral Supplements Market Revenue (US$ Mn) Market Share by End-Userin 2022
- Figure 39: North America Mineral Supplements Market Attractiveness Analysis by End-User, 2016-2032
- Figure 40: North America Mineral Supplements Market Revenue (US$ Mn) Market Share by Sales Channelin 2022
- Figure 41: North America Mineral Supplements Market Attractiveness Analysis by Sales Channel, 2016-2032
- Figure 42: North America Mineral Supplements Market Revenue (US$ Mn) Market Share by Country in 2022
- Figure 43: North America Mineral Supplements Market Attractiveness Analysis by Country, 2016-2032
- Figure 44: North America Mineral Supplements Market Revenue (US$ Mn) (2016-2032)
- Figure 45: North America Mineral Supplements Market Revenue (US$ Mn) Comparison by Country (2016-2032)
- Figure 46: North America Mineral Supplements Market Revenue (US$ Mn) Comparison by Product (2016-2032)
- Figure 47: North America Mineral Supplements Market Revenue (US$ Mn) Comparison by Formulation (2016-2032)
- Figure 48: North America Mineral Supplements Market Revenue (US$ Mn) Comparison by Application (2016-2032)
- Figure 49: North America Mineral Supplements Market Revenue (US$ Mn) Comparison by End-User (2016-2032)
- Figure 50: North America Mineral Supplements Market Revenue (US$ Mn) Comparison by Sales Channel (2016-2032)
- Figure 51: North America Mineral Supplements Market Y-o-Y Growth Rate Comparison by Country (2016-2032)
- Figure 52: North America Mineral Supplements Market Y-o-Y Growth Rate Comparison by Product (2016-2032)
- Figure 53: North America Mineral Supplements Market Y-o-Y Growth Rate Comparison by Formulation (2016-2032)
- Figure 54: North America Mineral Supplements Market Y-o-Y Growth Rate Comparison by Application (2016-2032)
- Figure 55: North America Mineral Supplements Market Y-o-Y Growth Rate Comparison by End-User (2016-2032)
- Figure 56: North America Mineral Supplements Market Y-o-Y Growth Rate Comparison by Sales Channel (2016-2032)
- Figure 57: North America Mineral Supplements Market Share Comparison by Country (2016-2032)
- Figure 58: North America Mineral Supplements Market Share Comparison by Product (2016-2032)
- Figure 59: North America Mineral Supplements Market Share Comparison by Formulation (2016-2032)
- Figure 60: North America Mineral Supplements Market Share Comparison by Application (2016-2032)
- Figure 61: North America Mineral Supplements Market Share Comparison by End-User (2016-2032)
- Figure 62: North America Mineral Supplements Market Share Comparison by Sales Channel (2016-2032)
- Figure 63: Western Europe Mineral Supplements Market Revenue (US$ Mn) Market Share by Productin 2022
- Figure 64: Western Europe Mineral Supplements Market Attractiveness Analysis by Product, 2016-2032
- Figure 65: Western Europe Mineral Supplements Market Revenue (US$ Mn) Market Share by Formulationin 2022
- Figure 66: Western Europe Mineral Supplements Market Attractiveness Analysis by Formulation, 2016-2032
- Figure 67: Western Europe Mineral Supplements Market Revenue (US$ Mn) Market Share by Applicationin 2022
- Figure 68: Western Europe Mineral Supplements Market Attractiveness Analysis by Application, 2016-2032
- Figure 69: Western Europe Mineral Supplements Market Revenue (US$ Mn) Market Share by End-Userin 2022
- Figure 70: Western Europe Mineral Supplements Market Attractiveness Analysis by End-User, 2016-2032
- Figure 71: Western Europe Mineral Supplements Market Revenue (US$ Mn) Market Share by Sales Channelin 2022
- Figure 72: Western Europe Mineral Supplements Market Attractiveness Analysis by Sales Channel, 2016-2032
- Figure 73: Western Europe Mineral Supplements Market Revenue (US$ Mn) Market Share by Country in 2022
- Figure 74: Western Europe Mineral Supplements Market Attractiveness Analysis by Country, 2016-2032
- Figure 75: Western Europe Mineral Supplements Market Revenue (US$ Mn) (2016-2032)
- Figure 76: Western Europe Mineral Supplements Market Revenue (US$ Mn) Comparison by Country (2016-2032)
- Figure 77: Western Europe Mineral Supplements Market Revenue (US$ Mn) Comparison by Product (2016-2032)
- Figure 78: Western Europe Mineral Supplements Market Revenue (US$ Mn) Comparison by Formulation (2016-2032)
- Figure 79: Western Europe Mineral Supplements Market Revenue (US$ Mn) Comparison by Application (2016-2032)
- Figure 80: Western Europe Mineral Supplements Market Revenue (US$ Mn) Comparison by End-User (2016-2032)
- Figure 81: Western Europe Mineral Supplements Market Revenue (US$ Mn) Comparison by Sales Channel (2016-2032)
- Figure 82: Western Europe Mineral Supplements Market Y-o-Y Growth Rate Comparison by Country (2016-2032)
- Figure 83: Western Europe Mineral Supplements Market Y-o-Y Growth Rate Comparison by Product (2016-2032)
- Figure 84: Western Europe Mineral Supplements Market Y-o-Y Growth Rate Comparison by Formulation (2016-2032)
- Figure 85: Western Europe Mineral Supplements Market Y-o-Y Growth Rate Comparison by Application (2016-2032)
- Figure 86: Western Europe Mineral Supplements Market Y-o-Y Growth Rate Comparison by End-User (2016-2032)
- Figure 87: Western Europe Mineral Supplements Market Y-o-Y Growth Rate Comparison by Sales Channel (2016-2032)
- Figure 88: Western Europe Mineral Supplements Market Share Comparison by Country (2016-2032)
- Figure 89: Western Europe Mineral Supplements Market Share Comparison by Product (2016-2032)
- Figure 90: Western Europe Mineral Supplements Market Share Comparison by Formulation (2016-2032)
- Figure 91: Western Europe Mineral Supplements Market Share Comparison by Application (2016-2032)
- Figure 92: Western Europe Mineral Supplements Market Share Comparison by End-User (2016-2032)
- Figure 93: Western Europe Mineral Supplements Market Share Comparison by Sales Channel (2016-2032)
- Figure 94: Eastern Europe Mineral Supplements Market Revenue (US$ Mn) Market Share by Productin 2022
- Figure 95: Eastern Europe Mineral Supplements Market Attractiveness Analysis by Product, 2016-2032
- Figure 96: Eastern Europe Mineral Supplements Market Revenue (US$ Mn) Market Share by Formulationin 2022
- Figure 97: Eastern Europe Mineral Supplements Market Attractiveness Analysis by Formulation, 2016-2032
- Figure 98: Eastern Europe Mineral Supplements Market Revenue (US$ Mn) Market Share by Applicationin 2022
- Figure 99: Eastern Europe Mineral Supplements Market Attractiveness Analysis by Application, 2016-2032
- Figure 100: Eastern Europe Mineral Supplements Market Revenue (US$ Mn) Market Share by End-Userin 2022
- Figure 101: Eastern Europe Mineral Supplements Market Attractiveness Analysis by End-User, 2016-2032
- Figure 102: Eastern Europe Mineral Supplements Market Revenue (US$ Mn) Market Share by Sales Channelin 2022
- Figure 103: Eastern Europe Mineral Supplements Market Attractiveness Analysis by Sales Channel, 2016-2032
- Figure 104: Eastern Europe Mineral Supplements Market Revenue (US$ Mn) Market Share by Country in 2022
- Figure 105: Eastern Europe Mineral Supplements Market Attractiveness Analysis by Country, 2016-2032
- Figure 106: Eastern Europe Mineral Supplements Market Revenue (US$ Mn) (2016-2032)
- Figure 107: Eastern Europe Mineral Supplements Market Revenue (US$ Mn) Comparison by Country (2016-2032)
- Figure 108: Eastern Europe Mineral Supplements Market Revenue (US$ Mn) Comparison by Product (2016-2032)
- Figure 109: Eastern Europe Mineral Supplements Market Revenue (US$ Mn) Comparison by Formulation (2016-2032)
- Figure 110: Eastern Europe Mineral Supplements Market Revenue (US$ Mn) Comparison by Application (2016-2032)
- Figure 111: Eastern Europe Mineral Supplements Market Revenue (US$ Mn) Comparison by End-User (2016-2032)
- Figure 112: Eastern Europe Mineral Supplements Market Revenue (US$ Mn) Comparison by Sales Channel (2016-2032)
- Figure 113: Eastern Europe Mineral Supplements Market Y-o-Y Growth Rate Comparison by Country (2016-2032)
- Figure 114: Eastern Europe Mineral Supplements Market Y-o-Y Growth Rate Comparison by Product (2016-2032)
- Figure 115: Eastern Europe Mineral Supplements Market Y-o-Y Growth Rate Comparison by Formulation (2016-2032)
- Figure 116: Eastern Europe Mineral Supplements Market Y-o-Y Growth Rate Comparison by Application (2016-2032)
- Figure 117: Eastern Europe Mineral Supplements Market Y-o-Y Growth Rate Comparison by End-User (2016-2032)
- Figure 118: Eastern Europe Mineral Supplements Market Y-o-Y Growth Rate Comparison by Sales Channel (2016-2032)
- Figure 119: Eastern Europe Mineral Supplements Market Share Comparison by Country (2016-2032)
- Figure 120: Eastern Europe Mineral Supplements Market Share Comparison by Product (2016-2032)
- Figure 121: Eastern Europe Mineral Supplements Market Share Comparison by Formulation (2016-2032)
- Figure 122: Eastern Europe Mineral Supplements Market Share Comparison by Application (2016-2032)
- Figure 123: Eastern Europe Mineral Supplements Market Share Comparison by End-User (2016-2032)
- Figure 124: Eastern Europe Mineral Supplements Market Share Comparison by Sales Channel (2016-2032)
- Figure 125: APAC Mineral Supplements Market Revenue (US$ Mn) Market Share by Productin 2022
- Figure 126: APAC Mineral Supplements Market Attractiveness Analysis by Product, 2016-2032
- Figure 127: APAC Mineral Supplements Market Revenue (US$ Mn) Market Share by Formulationin 2022
- Figure 128: APAC Mineral Supplements Market Attractiveness Analysis by Formulation, 2016-2032
- Figure 129: APAC Mineral Supplements Market Revenue (US$ Mn) Market Share by Applicationin 2022
- Figure 130: APAC Mineral Supplements Market Attractiveness Analysis by Application, 2016-2032
- Figure 131: APAC Mineral Supplements Market Revenue (US$ Mn) Market Share by End-Userin 2022
- Figure 132: APAC Mineral Supplements Market Attractiveness Analysis by End-User, 2016-2032
- Figure 133: APAC Mineral Supplements Market Revenue (US$ Mn) Market Share by Sales Channelin 2022
- Figure 134: APAC Mineral Supplements Market Attractiveness Analysis by Sales Channel, 2016-2032
- Figure 135: APAC Mineral Supplements Market Revenue (US$ Mn) Market Share by Country in 2022
- Figure 136: APAC Mineral Supplements Market Attractiveness Analysis by Country, 2016-2032
- Figure 137: APAC Mineral Supplements Market Revenue (US$ Mn) (2016-2032)
- Figure 138: APAC Mineral Supplements Market Revenue (US$ Mn) Comparison by Country (2016-2032)
- Figure 139: APAC Mineral Supplements Market Revenue (US$ Mn) Comparison by Product (2016-2032)
- Figure 140: APAC Mineral Supplements Market Revenue (US$ Mn) Comparison by Formulation (2016-2032)
- Figure 141: APAC Mineral Supplements Market Revenue (US$ Mn) Comparison by Application (2016-2032)
- Figure 142: APAC Mineral Supplements Market Revenue (US$ Mn) Comparison by End-User (2016-2032)
- Figure 143: APAC Mineral Supplements Market Revenue (US$ Mn) Comparison by Sales Channel (2016-2032)
- Figure 144: APAC Mineral Supplements Market Y-o-Y Growth Rate Comparison by Country (2016-2032)
- Figure 145: APAC Mineral Supplements Market Y-o-Y Growth Rate Comparison by Product (2016-2032)
- Figure 146: APAC Mineral Supplements Market Y-o-Y Growth Rate Comparison by Formulation (2016-2032)
- Figure 147: APAC Mineral Supplements Market Y-o-Y Growth Rate Comparison by Application (2016-2032)
- Figure 148: APAC Mineral Supplements Market Y-o-Y Growth Rate Comparison by End-User (2016-2032)
- Figure 149: APAC Mineral Supplements Market Y-o-Y Growth Rate Comparison by Sales Channel (2016-2032)
- Figure 150: APAC Mineral Supplements Market Share Comparison by Country (2016-2032)
- Figure 151: APAC Mineral Supplements Market Share Comparison by Product (2016-2032)
- Figure 152: APAC Mineral Supplements Market Share Comparison by Formulation (2016-2032)
- Figure 153: APAC Mineral Supplements Market Share Comparison by Application (2016-2032)
- Figure 154: APAC Mineral Supplements Market Share Comparison by End-User (2016-2032)
- Figure 155: APAC Mineral Supplements Market Share Comparison by Sales Channel (2016-2032)
- Figure 156: Latin America Mineral Supplements Market Revenue (US$ Mn) Market Share by Productin 2022
- Figure 157: Latin America Mineral Supplements Market Attractiveness Analysis by Product, 2016-2032
- Figure 158: Latin America Mineral Supplements Market Revenue (US$ Mn) Market Share by Formulationin 2022
- Figure 159: Latin America Mineral Supplements Market Attractiveness Analysis by Formulation, 2016-2032
- Figure 160: Latin America Mineral Supplements Market Revenue (US$ Mn) Market Share by Applicationin 2022
- Figure 161: Latin America Mineral Supplements Market Attractiveness Analysis by Application, 2016-2032
- Figure 162: Latin America Mineral Supplements Market Revenue (US$ Mn) Market Share by End-Userin 2022
- Figure 163: Latin America Mineral Supplements Market Attractiveness Analysis by End-User, 2016-2032
- Figure 164: Latin America Mineral Supplements Market Revenue (US$ Mn) Market Share by Sales Channelin 2022
- Figure 165: Latin America Mineral Supplements Market Attractiveness Analysis by Sales Channel, 2016-2032
- Figure 166: Latin America Mineral Supplements Market Revenue (US$ Mn) Market Share by Country in 2022
- Figure 167: Latin America Mineral Supplements Market Attractiveness Analysis by Country, 2016-2032
- Figure 168: Latin America Mineral Supplements Market Revenue (US$ Mn) (2016-2032)
- Figure 169: Latin America Mineral Supplements Market Revenue (US$ Mn) Comparison by Country (2016-2032)
- Figure 170: Latin America Mineral Supplements Market Revenue (US$ Mn) Comparison by Product (2016-2032)
- Figure 171: Latin America Mineral Supplements Market Revenue (US$ Mn) Comparison by Formulation (2016-2032)
- Figure 172: Latin America Mineral Supplements Market Revenue (US$ Mn) Comparison by Application (2016-2032)
- Figure 173: Latin America Mineral Supplements Market Revenue (US$ Mn) Comparison by End-User (2016-2032)
- Figure 174: Latin America Mineral Supplements Market Revenue (US$ Mn) Comparison by Sales Channel (2016-2032)
- Figure 175: Latin America Mineral Supplements Market Y-o-Y Growth Rate Comparison by Country (2016-2032)
- Figure 176: Latin America Mineral Supplements Market Y-o-Y Growth Rate Comparison by Product (2016-2032)
- Figure 177: Latin America Mineral Supplements Market Y-o-Y Growth Rate Comparison by Formulation (2016-2032)
- Figure 178: Latin America Mineral Supplements Market Y-o-Y Growth Rate Comparison by Application (2016-2032)
- Figure 179: Latin America Mineral Supplements Market Y-o-Y Growth Rate Comparison by End-User (2016-2032)
- Figure 180: Latin America Mineral Supplements Market Y-o-Y Growth Rate Comparison by Sales Channel (2016-2032)
- Figure 181: Latin America Mineral Supplements Market Share Comparison by Country (2016-2032)
- Figure 182: Latin America Mineral Supplements Market Share Comparison by Product (2016-2032)
- Figure 183: Latin America Mineral Supplements Market Share Comparison by Formulation (2016-2032)
- Figure 184: Latin America Mineral Supplements Market Share Comparison by Application (2016-2032)
- Figure 185: Latin America Mineral Supplements Market Share Comparison by End-User (2016-2032)
- Figure 186: Latin America Mineral Supplements Market Share Comparison by Sales Channel (2016-2032)
- Figure 187: Middle East & Africa Mineral Supplements Market Revenue (US$ Mn) Market Share by Productin 2022
- Figure 188: Middle East & Africa Mineral Supplements Market Attractiveness Analysis by Product, 2016-2032
- Figure 189: Middle East & Africa Mineral Supplements Market Revenue (US$ Mn) Market Share by Formulationin 2022
- Figure 190: Middle East & Africa Mineral Supplements Market Attractiveness Analysis by Formulation, 2016-2032
- Figure 191: Middle East & Africa Mineral Supplements Market Revenue (US$ Mn) Market Share by Applicationin 2022
- Figure 192: Middle East & Africa Mineral Supplements Market Attractiveness Analysis by Application, 2016-2032
- Figure 193: Middle East & Africa Mineral Supplements Market Revenue (US$ Mn) Market Share by End-Userin 2022
- Figure 194: Middle East & Africa Mineral Supplements Market Attractiveness Analysis by End-User, 2016-2032
- Figure 195: Middle East & Africa Mineral Supplements Market Revenue (US$ Mn) Market Share by Sales Channelin 2022
- Figure 196: Middle East & Africa Mineral Supplements Market Attractiveness Analysis by Sales Channel, 2016-2032
- Figure 197: Middle East & Africa Mineral Supplements Market Revenue (US$ Mn) Market Share by Country in 2022
- Figure 198: Middle East & Africa Mineral Supplements Market Attractiveness Analysis by Country, 2016-2032
- Figure 199: Middle East & Africa Mineral Supplements Market Revenue (US$ Mn) (2016-2032)
- Figure 200: Middle East & Africa Mineral Supplements Market Revenue (US$ Mn) Comparison by Country (2016-2032)
- Figure 201: Middle East & Africa Mineral Supplements Market Revenue (US$ Mn) Comparison by Product (2016-2032)
- Figure 202: Middle East & Africa Mineral Supplements Market Revenue (US$ Mn) Comparison by Formulation (2016-2032)
- Figure 203: Middle East & Africa Mineral Supplements Market Revenue (US$ Mn) Comparison by Application (2016-2032)
- Figure 204: Middle East & Africa Mineral Supplements Market Revenue (US$ Mn) Comparison by End-User (2016-2032)
- Figure 205: Middle East & Africa Mineral Supplements Market Revenue (US$ Mn) Comparison by Sales Channel (2016-2032)
- Figure 206: Middle East & Africa Mineral Supplements Market Y-o-Y Growth Rate Comparison by Country (2016-2032)
- Figure 207: Middle East & Africa Mineral Supplements Market Y-o-Y Growth Rate Comparison by Product (2016-2032)
- Figure 208: Middle East & Africa Mineral Supplements Market Y-o-Y Growth Rate Comparison by Formulation (2016-2032)
- Figure 209: Middle East & Africa Mineral Supplements Market Y-o-Y Growth Rate Comparison by Application (2016-2032)
- Figure 210: Middle East & Africa Mineral Supplements Market Y-o-Y Growth Rate Comparison by End-User (2016-2032)
- Figure 211: Middle East & Africa Mineral Supplements Market Y-o-Y Growth Rate Comparison by Sales Channel (2016-2032)
- Figure 212: Middle East & Africa Mineral Supplements Market Share Comparison by Country (2016-2032)
- Figure 213: Middle East & Africa Mineral Supplements Market Share Comparison by Product (2016-2032)
- Figure 214: Middle East & Africa Mineral Supplements Market Share Comparison by Formulation (2016-2032)
- Figure 215: Middle East & Africa Mineral Supplements Market Share Comparison by Application (2016-2032)
- Figure 216: Middle East & Africa Mineral Supplements Market Share Comparison by End-User (2016-2032)
- Figure 217: Middle East & Africa Mineral Supplements Market Share Comparison by Sales Channel (2016-2032)
- List of Tables
- Table 1: Global Mineral Supplements Market Comparison by Product (2016-2032)
- Table 2: Global Mineral Supplements Market Comparison by Formulation (2016-2032)
- Table 3: Global Mineral Supplements Market Comparison by Application (2016-2032)
- Table 4: Global Mineral Supplements Market Comparison by End-User (2016-2032)
- Table 5: Global Mineral Supplements Market Comparison by Sales Channel (2016-2032)
- Table 6: Global Mineral Supplements Market Revenue (US$ Mn) Comparison by Region (2016-2032)
- Table 7: Global Mineral Supplements Market Revenue (US$ Mn) (2016-2032)
- Table 8: Global Mineral Supplements Market Revenue (US$ Mn) Comparison by Region (2016-2032)
- Table 9: Global Mineral Supplements Market Revenue (US$ Mn) Comparison by Product (2016-2032)
- Table 10: Global Mineral Supplements Market Revenue (US$ Mn) Comparison by Formulation (2016-2032)
- Table 11: Global Mineral Supplements Market Revenue (US$ Mn) Comparison by Application (2016-2032)
- Table 12: Global Mineral Supplements Market Revenue (US$ Mn) Comparison by End-User (2016-2032)
- Table 13: Global Mineral Supplements Market Revenue (US$ Mn) Comparison by Sales Channel (2016-2032)
- Table 14: Global Mineral Supplements Market Y-o-Y Growth Rate Comparison by Region (2016-2032)
- Table 15: Global Mineral Supplements Market Y-o-Y Growth Rate Comparison by Product (2016-2032)
- Table 16: Global Mineral Supplements Market Y-o-Y Growth Rate Comparison by Formulation (2016-2032)
- Table 17: Global Mineral Supplements Market Y-o-Y Growth Rate Comparison by Application (2016-2032)
- Table 18: Global Mineral Supplements Market Y-o-Y Growth Rate Comparison by End-User (2016-2032)
- Table 19: Global Mineral Supplements Market Y-o-Y Growth Rate Comparison by Sales Channel (2016-2032)
- Table 20: Global Mineral Supplements Market Share Comparison by Region (2016-2032)
- Table 21: Global Mineral Supplements Market Share Comparison by Product (2016-2032)
- Table 22: Global Mineral Supplements Market Share Comparison by Formulation (2016-2032)
- Table 23: Global Mineral Supplements Market Share Comparison by Application (2016-2032)
- Table 24: Global Mineral Supplements Market Share Comparison by End-User (2016-2032)
- Table 25: Global Mineral Supplements Market Share Comparison by Sales Channel (2016-2032)
- Table 26: North America Mineral Supplements Market Comparison by Formulation (2016-2032)
- Table 27: North America Mineral Supplements Market Comparison by Application (2016-2032)
- Table 28: North America Mineral Supplements Market Comparison by End-User (2016-2032)
- Table 29: North America Mineral Supplements Market Comparison by Sales Channel (2016-2032)
- Table 30: North America Mineral Supplements Market Revenue (US$ Mn) Comparison by Country (2016-2032)
- Table 31: North America Mineral Supplements Market Revenue (US$ Mn) (2016-2032)
- Table 32: North America Mineral Supplements Market Revenue (US$ Mn) Comparison by Country (2016-2032)
- Table 33: North America Mineral Supplements Market Revenue (US$ Mn) Comparison by Product (2016-2032)
- Table 34: North America Mineral Supplements Market Revenue (US$ Mn) Comparison by Formulation (2016-2032)
- Table 35: North America Mineral Supplements Market Revenue (US$ Mn) Comparison by Application (2016-2032)
- Table 36: North America Mineral Supplements Market Revenue (US$ Mn) Comparison by End-User (2016-2032)
- Table 37: North America Mineral Supplements Market Revenue (US$ Mn) Comparison by Sales Channel (2016-2032)
- Table 38: North America Mineral Supplements Market Y-o-Y Growth Rate Comparison by Country (2016-2032)
- Table 39: North America Mineral Supplements Market Y-o-Y Growth Rate Comparison by Product (2016-2032)
- Table 40: North America Mineral Supplements Market Y-o-Y Growth Rate Comparison by Formulation (2016-2032)
- Table 41: North America Mineral Supplements Market Y-o-Y Growth Rate Comparison by Application (2016-2032)
- Table 42: North America Mineral Supplements Market Y-o-Y Growth Rate Comparison by End-User (2016-2032)
- Table 43: North America Mineral Supplements Market Y-o-Y Growth Rate Comparison by Sales Channel (2016-2032)
- Table 44: North America Mineral Supplements Market Share Comparison by Country (2016-2032)
- Table 45: North America Mineral Supplements Market Share Comparison by Product (2016-2032)
- Table 46: North America Mineral Supplements Market Share Comparison by Formulation (2016-2032)
- Table 47: North America Mineral Supplements Market Share Comparison by Application (2016-2032)
- Table 48: North America Mineral Supplements Market Share Comparison by End-User (2016-2032)
- Table 49: North America Mineral Supplements Market Share Comparison by Sales Channel (2016-2032)
- Table 50: Western Europe Mineral Supplements Market Comparison by Product (2016-2032)
- Table 51: Western Europe Mineral Supplements Market Comparison by Formulation (2016-2032)
- Table 52: Western Europe Mineral Supplements Market Comparison by Application (2016-2032)
- Table 53: Western Europe Mineral Supplements Market Comparison by End-User (2016-2032)
- Table 54: Western Europe Mineral Supplements Market Comparison by Sales Channel (2016-2032)
- Table 55: Western Europe Mineral Supplements Market Revenue (US$ Mn) Comparison by Country (2016-2032)
- Table 56: Western Europe Mineral Supplements Market Revenue (US$ Mn) (2016-2032)
- Table 57: Western Europe Mineral Supplements Market Revenue (US$ Mn) Comparison by Country (2016-2032)
- Table 58: Western Europe Mineral Supplements Market Revenue (US$ Mn) Comparison by Product (2016-2032)
- Table 59: Western Europe Mineral Supplements Market Revenue (US$ Mn) Comparison by Formulation (2016-2032)
- Table 60: Western Europe Mineral Supplements Market Revenue (US$ Mn) Comparison by Application (2016-2032)
- Table 61: Western Europe Mineral Supplements Market Revenue (US$ Mn) Comparison by End-User (2016-2032)
- Table 62: Western Europe Mineral Supplements Market Revenue (US$ Mn) Comparison by Sales Channel (2016-2032)
- Table 63: Western Europe Mineral Supplements Market Y-o-Y Growth Rate Comparison by Country (2016-2032)
- Table 64: Western Europe Mineral Supplements Market Y-o-Y Growth Rate Comparison by Product (2016-2032)
- Table 65: Western Europe Mineral Supplements Market Y-o-Y Growth Rate Comparison by Formulation (2016-2032)
- Table 66: Western Europe Mineral Supplements Market Y-o-Y Growth Rate Comparison by Application (2016-2032)
- Table 67: Western Europe Mineral Supplements Market Y-o-Y Growth Rate Comparison by End-User (2016-2032)
- Table 68: Western Europe Mineral Supplements Market Y-o-Y Growth Rate Comparison by Sales Channel (2016-2032)
- Table 69: Western Europe Mineral Supplements Market Share Comparison by Country (2016-2032)
- Table 70: Western Europe Mineral Supplements Market Share Comparison by Product (2016-2032)
- Table 71: Western Europe Mineral Supplements Market Share Comparison by Formulation (2016-2032)
- Table 72: Western Europe Mineral Supplements Market Share Comparison by Application (2016-2032)
- Table 73: Western Europe Mineral Supplements Market Share Comparison by End-User (2016-2032)
- Table 74: Western Europe Mineral Supplements Market Share Comparison by Sales Channel (2016-2032)
- Table 75: Eastern Europe Mineral Supplements Market Comparison by Product (2016-2032)
- Table 76: Eastern Europe Mineral Supplements Market Comparison by Formulation (2016-2032)
- Table 77: Eastern Europe Mineral Supplements Market Comparison by Application (2016-2032)
- Table 78: Eastern Europe Mineral Supplements Market Comparison by End-User (2016-2032)
- Table 79: Eastern Europe Mineral Supplements Market Comparison by Sales Channel (2016-2032)
- Table 80: Eastern Europe Mineral Supplements Market Revenue (US$ Mn) Comparison by Country (2016-2032)
- Table 81: Eastern Europe Mineral Supplements Market Revenue (US$ Mn) (2016-2032)
- Table 82: Eastern Europe Mineral Supplements Market Revenue (US$ Mn) Comparison by Country (2016-2032)
- Table 83: Eastern Europe Mineral Supplements Market Revenue (US$ Mn) Comparison by Product (2016-2032)
- Table 84: Eastern Europe Mineral Supplements Market Revenue (US$ Mn) Comparison by Formulation (2016-2032)
- Table 85: Eastern Europe Mineral Supplements Market Revenue (US$ Mn) Comparison by Application (2016-2032)
- Table 86: Eastern Europe Mineral Supplements Market Revenue (US$ Mn) Comparison by End-User (2016-2032)
- Table 87: Eastern Europe Mineral Supplements Market Revenue (US$ Mn) Comparison by Sales Channel (2016-2032)
- Table 88: Eastern Europe Mineral Supplements Market Y-o-Y Growth Rate Comparison by Country (2016-2032)
- Table 89: Eastern Europe Mineral Supplements Market Y-o-Y Growth Rate Comparison by Product (2016-2032)
- Table 90: Eastern Europe Mineral Supplements Market Y-o-Y Growth Rate Comparison by Formulation (2016-2032)
- Table 91: Eastern Europe Mineral Supplements Market Y-o-Y Growth Rate Comparison by Application (2016-2032)
- Table 92: Eastern Europe Mineral Supplements Market Y-o-Y Growth Rate Comparison by End-User (2016-2032)
- Table 93: Eastern Europe Mineral Supplements Market Y-o-Y Growth Rate Comparison by Sales Channel (2016-2032)
- Table 94: Eastern Europe Mineral Supplements Market Share Comparison by Country (2016-2032)
- Table 95: Eastern Europe Mineral Supplements Market Share Comparison by Product (2016-2032)
- Table 96: Eastern Europe Mineral Supplements Market Share Comparison by Formulation (2016-2032)
- Table 97: Eastern Europe Mineral Supplements Market Share Comparison by Application (2016-2032)
- Table 98: Eastern Europe Mineral Supplements Market Share Comparison by End-User (2016-2032)
- Table 99: Eastern Europe Mineral Supplements Market Share Comparison by Sales Channel (2016-2032)
- Table 100: APAC Mineral Supplements Market Comparison by Product (2016-2032)
- Table 101: APAC Mineral Supplements Market Comparison by Formulation (2016-2032)
- Table 102: APAC Mineral Supplements Market Comparison by Application (2016-2032)
- Table 103: APAC Mineral Supplements Market Comparison by End-User (2016-2032)
- Table 104: APAC Mineral Supplements Market Comparison by Sales Channel (2016-2032)
- Table 105: APAC Mineral Supplements Market Revenue (US$ Mn) Comparison by Country (2016-2032)
- Table 106: APAC Mineral Supplements Market Revenue (US$ Mn) (2016-2032)
- Table 107: APAC Mineral Supplements Market Revenue (US$ Mn) Comparison by Country (2016-2032)
- Table 108: APAC Mineral Supplements Market Revenue (US$ Mn) Comparison by Product (2016-2032)
- Table 109: APAC Mineral Supplements Market Revenue (US$ Mn) Comparison by Formulation (2016-2032)
- Table 110: APAC Mineral Supplements Market Revenue (US$ Mn) Comparison by Application (2016-2032)
- Table 111: APAC Mineral Supplements Market Revenue (US$ Mn) Comparison by End-User (2016-2032)
- Table 112: APAC Mineral Supplements Market Revenue (US$ Mn) Comparison by Sales Channel (2016-2032)
- Table 113: APAC Mineral Supplements Market Y-o-Y Growth Rate Comparison by Country (2016-2032)
- Table 114: APAC Mineral Supplements Market Y-o-Y Growth Rate Comparison by Product (2016-2032)
- Table 115: APAC Mineral Supplements Market Y-o-Y Growth Rate Comparison by Formulation (2016-2032)
- Table 116: APAC Mineral Supplements Market Y-o-Y Growth Rate Comparison by Application (2016-2032)
- Table 117: APAC Mineral Supplements Market Y-o-Y Growth Rate Comparison by End-User (2016-2032)
- Table 118: APAC Mineral Supplements Market Y-o-Y Growth Rate Comparison by Sales Channel (2016-2032)
- Table 119: APAC Mineral Supplements Market Share Comparison by Country (2016-2032)
- Table 120: APAC Mineral Supplements Market Share Comparison by Product (2016-2032)
- Table 121: APAC Mineral Supplements Market Share Comparison by Formulation (2016-2032)
- Table 122: APAC Mineral Supplements Market Share Comparison by Application (2016-2032)
- Table 123: APAC Mineral Supplements Market Share Comparison by End-User (2016-2032)
- Table 124: APAC Mineral Supplements Market Share Comparison by Sales Channel (2016-2032)
- Table 125: Latin America Mineral Supplements Market Comparison by Product (2016-2032)
- Table 126: Latin America Mineral Supplements Market Comparison by Formulation (2016-2032)
- Table 127: Latin America Mineral Supplements Market Comparison by Application (2016-2032)
- Table 128: Latin America Mineral Supplements Market Comparison by End-User (2016-2032)
- Table 129: Latin America Mineral Supplements Market Comparison by Sales Channel (2016-2032)
- Table 130: Latin America Mineral Supplements Market Revenue (US$ Mn) Comparison by Country (2016-2032)
- Table 131: Latin America Mineral Supplements Market Revenue (US$ Mn) (2016-2032)
- Table 132: Latin America Mineral Supplements Market Revenue (US$ Mn) Comparison by Country (2016-2032)
- Table 133: Latin America Mineral Supplements Market Revenue (US$ Mn) Comparison by Product (2016-2032)
- Table 134: Latin America Mineral Supplements Market Revenue (US$ Mn) Comparison by Formulation (2016-2032)
- Table 135: Latin America Mineral Supplements Market Revenue (US$ Mn) Comparison by Application (2016-2032)
- Table 136: Latin America Mineral Supplements Market Revenue (US$ Mn) Comparison by End-User (2016-2032)
- Table 137: Latin America Mineral Supplements Market Revenue (US$ Mn) Comparison by Sales Channel (2016-2032)
- Table 138: Latin America Mineral Supplements Market Y-o-Y Growth Rate Comparison by Country (2016-2032)
- Table 139: Latin America Mineral Supplements Market Y-o-Y Growth Rate Comparison by Product (2016-2032)
- Table 140: Latin America Mineral Supplements Market Y-o-Y Growth Rate Comparison by Formulation (2016-2032)
- Table 141: Latin America Mineral Supplements Market Y-o-Y Growth Rate Comparison by Application (2016-2032)
- Table 142: Latin America Mineral Supplements Market Y-o-Y Growth Rate Comparison by End-User (2016-2032)
- Table 143: Latin America Mineral Supplements Market Y-o-Y Growth Rate Comparison by Sales Channel (2016-2032)
- Table 144: Latin America Mineral Supplements Market Share Comparison by Country (2016-2032)
- Table 145: Latin America Mineral Supplements Market Share Comparison by Product (2016-2032)
- Table 146: Latin America Mineral Supplements Market Share Comparison by Formulation (2016-2032)
- Table 147: Latin America Mineral Supplements Market Share Comparison by Application (2016-2032)
- Table 148: Latin America Mineral Supplements Market Share Comparison by End-User (2016-2032)
- Table 149: Latin America Mineral Supplements Market Share Comparison by Sales Channel (2016-2032)
- Table 150: Middle East & Africa Mineral Supplements Market Comparison by Product (2016-2032)
- Table 151: Middle East & Africa Mineral Supplements Market Comparison by Formulation (2016-2032)
- Table 152: Middle East & Africa Mineral Supplements Market Comparison by Application (2016-2032)
- Table 153: Middle East & Africa Mineral Supplements Market Comparison by End-User (2016-2032)
- Table 154: Middle East & Africa Mineral Supplements Market Comparison by Sales Channel (2016-2032)
- Table 155: Middle East & Africa Mineral Supplements Market Revenue (US$ Mn) Comparison by Country (2016-2032)
- Table 156: Middle East & Africa Mineral Supplements Market Revenue (US$ Mn) (2016-2032)
- Table 157: Middle East & Africa Mineral Supplements Market Revenue (US$ Mn) Comparison by Country (2016-2032)
- Table 158: Middle East & Africa Mineral Supplements Market Revenue (US$ Mn) Comparison by Product (2016-2032)
- Table 159: Middle East & Africa Mineral Supplements Market Revenue (US$ Mn) Comparison by Formulation (2016-2032)
- Table 160: Middle East & Africa Mineral Supplements Market Revenue (US$ Mn) Comparison by Application (2016-2032)
- Table 161: Middle East & Africa Mineral Supplements Market Revenue (US$ Mn) Comparison by End-User (2016-2032)
- Table 162: Middle East & Africa Mineral Supplements Market Revenue (US$ Mn) Comparison by Sales Channel (2016-2032)
- Table 163: Middle East & Africa Mineral Supplements Market Y-o-Y Growth Rate Comparison by Country (2016-2032)
- Table 164: Middle East & Africa Mineral Supplements Market Y-o-Y Growth Rate Comparison by Product (2016-2032)
- Table 165: Middle East & Africa Mineral Supplements Market Y-o-Y Growth Rate Comparison by Formulation (2016-2032)
- Table 166: Middle East & Africa Mineral Supplements Market Y-o-Y Growth Rate Comparison by Application (2016-2032)
- Table 167: Middle East & Africa Mineral Supplements Market Y-o-Y Growth Rate Comparison by End-User (2016-2032)
- Table 168: Middle East & Africa Mineral Supplements Market Y-o-Y Growth Rate Comparison by Sales Channel (2016-2032)
- Table 169: Middle East & Africa Mineral Supplements Market Share Comparison by Country (2016-2032)
- Table 170: Middle East & Africa Mineral Supplements Market Share Comparison by Product (2016-2032)
- Table 171: Middle East & Africa Mineral Supplements Market Share Comparison by Formulation (2016-2032)
- Table 172: Middle East & Africa Mineral Supplements Market Share Comparison by Application (2016-2032)
- Table 173: Middle East & Africa Mineral Supplements Market Share Comparison by End-User (2016-2032)
- Table 174: Middle East & Africa Mineral Supplements Market Share Comparison by Sales Channel (2016-2032)
- 1. Executive Summary
-
- Amway India
- Nestlé Health Science
- Hainan Yangshengtang
- Abbott Laboratories
- Archer Daniels Midland Company
- Herbalife Nutrition Ltd.
- Webber Naturals
- Pharmavite LLC
- Glaxosmithkline PLC
- E. I. du Pont de Nemours
- Blackmores Limited
- Koninklijke DSM NV
Our Clients


View Our Licence Options
