
Microalgae DHA Market Report By Product Form (Oil, Powder, Capsules, Tablets), By Application (Dietary Supplements, Infant Formula, Food & Beverages (e.g., Functional Foods, Fortified Beverages), Animal Feed, Pharmaceuticals, Cosmetics, Others), By Sales Channel (Direct Sales, Distributor Sales, Online Retail), By Region and Companies - Industry Segment Outlook, Market Assessment, Competition Scenario, Trends and Forecast 2024-2033
-
45694
-
May 2024
-
291
-


-
This report was compiled by Trishita Deb Trishita Deb is an experienced market research and consulting professional with over 7 years of expertise across healthcare, consumer goods, and materials, contributing to over 400 healthcare-related reports. Correspondence Team Lead- Healthcare Linkedin | Detailed Market research Methodology Our methodology involves a mix of primary research, including interviews with leading mental health experts, and secondary research from reputable medical journals and databases. View Detailed Methodology Page
-
Quick Navigation
Report Overview
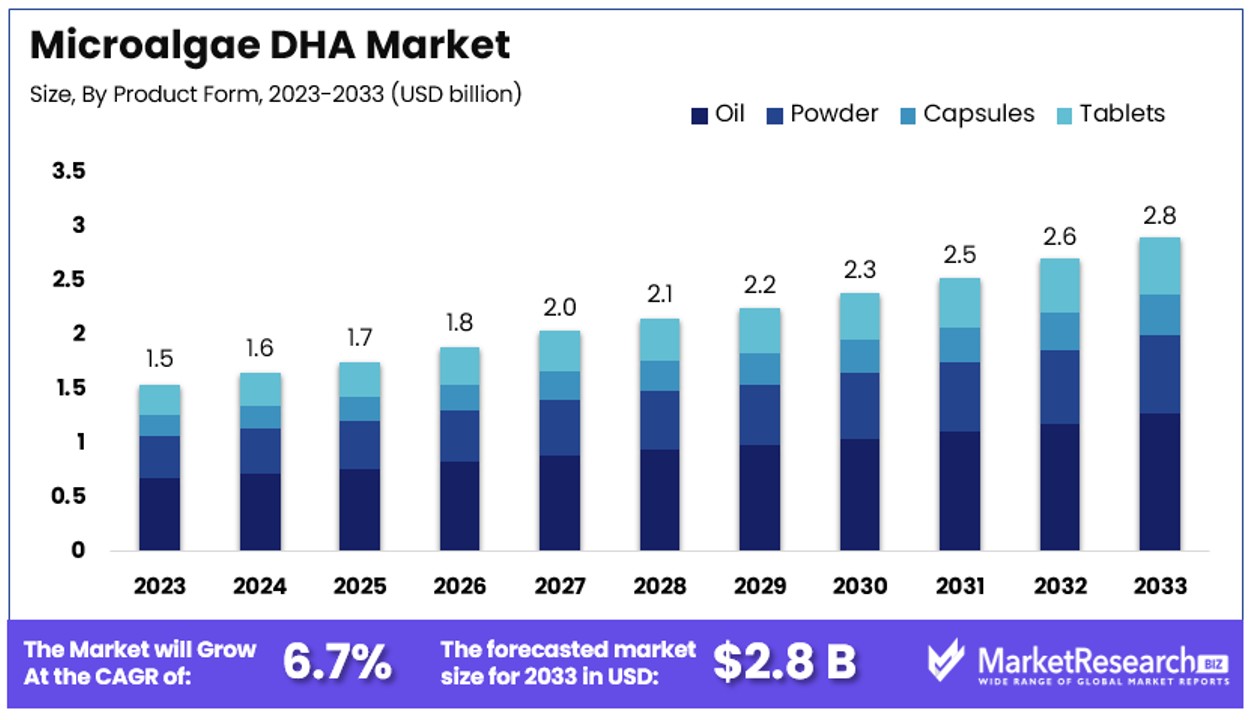
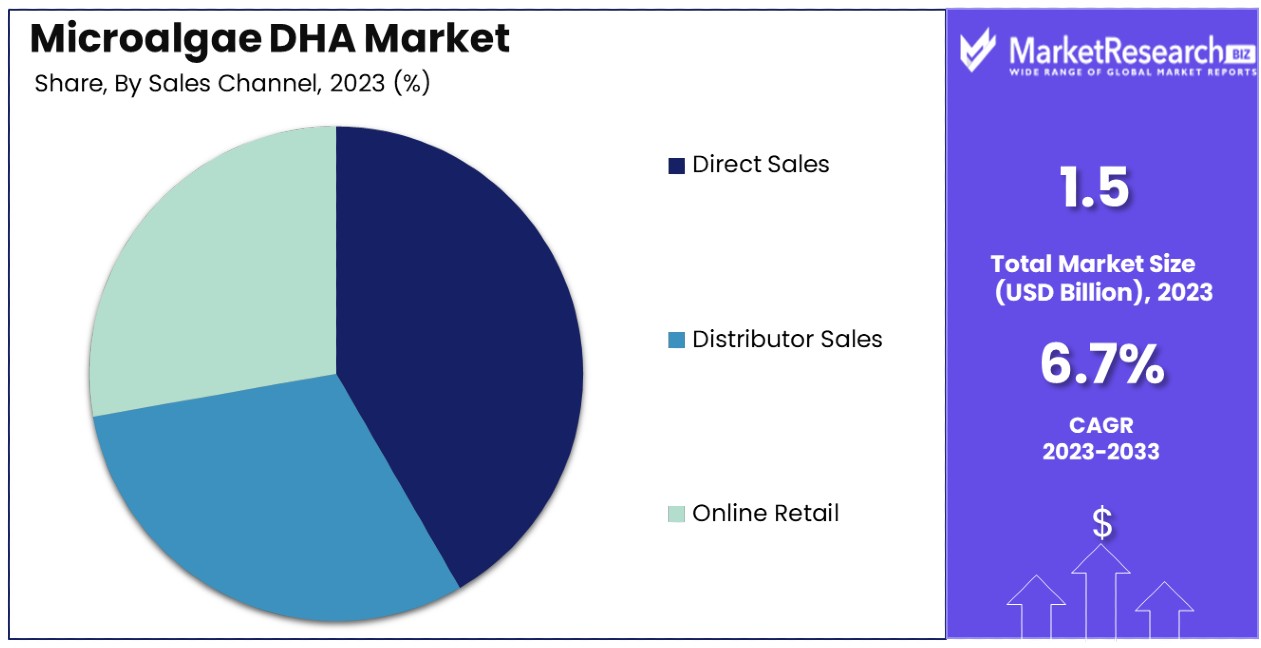
The Global Microalgae Dha Market size is expected to be worth around USD 2.8 Billion by 2033, from USD 1.5 Billion in 2023, growing at a CAGR of 6.7% during the forecast period from 2024 to 2033.
The Microalgae DHA Market involves the production and sale of docosahexaenoic acid (DHA) sourced from microalgae. This market is crucial for industries such as pharmaceuticals, dietary supplements, and infant nutrition.
Microalgae DHA is prized for its sustainability and high purity compared to fish oil-derived DHA. The growing demand for plant-based omega-3 sources and the rise in health-conscious consumers are key drivers of this market. Companies in this sector focus on innovative cultivation technologies to scale production and reduce costs, aiming to meet global nutritional needs.
The market is witnessing a significant shift towards sustainable and high-purity sources of omega-3, with microalgae DHA at the forefront due to its plant-based origin and eco-friendly production process.
Current consumption patterns in the United States reveal a notable gap in omega-3 intake among American adults. On average, American adults consume approximately 35 milligrams per day of EPA and 76 milligrams per day of DHA, which is significantly below the recommended levels set by esteemed health organizations such as the American Heart Association and the World Health Organization. This underconsumption highlights a substantial market opportunity for microalgae DHA products.
The demand for microalgae DHA is driven by its critical role in cognitive development and cardiovascular health, making it an essential ingredient in dietary supplements, infant nutrition, and pharmaceuticals. The market's potential is further bolstered by the rising consumer awareness of health and wellness, coupled with the increasing preference for sustainable and traceable ingredients.
From a strategic viewpoint, companies within this market are advised to focus on scaling production technologies and enhancing supply chain efficiencies to meet the growing demand. Furthermore, educational campaigns about the benefits of adequate omega-3 consumption could bridge the existing gap between current intake and recommended levels, thus expanding the customer base for microalgae-based DHA products. This market is poised for growth, contingent on industry's ability to navigate regulatory landscapes and consumer preferences effectively.
Key Takeaways
- Market Value: The Global Microalgae DHA Market is anticipated to reach USD 2.8 billion by 2033, marking growth from USD 1.5 billion in 2023, with a substantial CAGR of 6.7% during the forecast period from 2024 to 2033.
- Product Form Analysis: Oil leads with 45% market share due to its high bioavailability and versatility in integration into various products, followed by powder, capsules, and tablets, each catering to specific consumer preferences and application requirements.
- Application Analysis: Dietary Supplements dominate with 30% market share, driven by increasing consumer health awareness and preventative healthcare trends, followed by applications in Infant Formula, Food & Beverages, Animal Feed, Pharmaceuticals, Cosmetics, and others.
- Sales Channel Analysis: Direct Sales command a 40% share, benefiting from strong manufacturer-client relationships and customized product offerings, followed by Distributor Sales and Online Retail, which collectively enhance market penetration and accessibility.
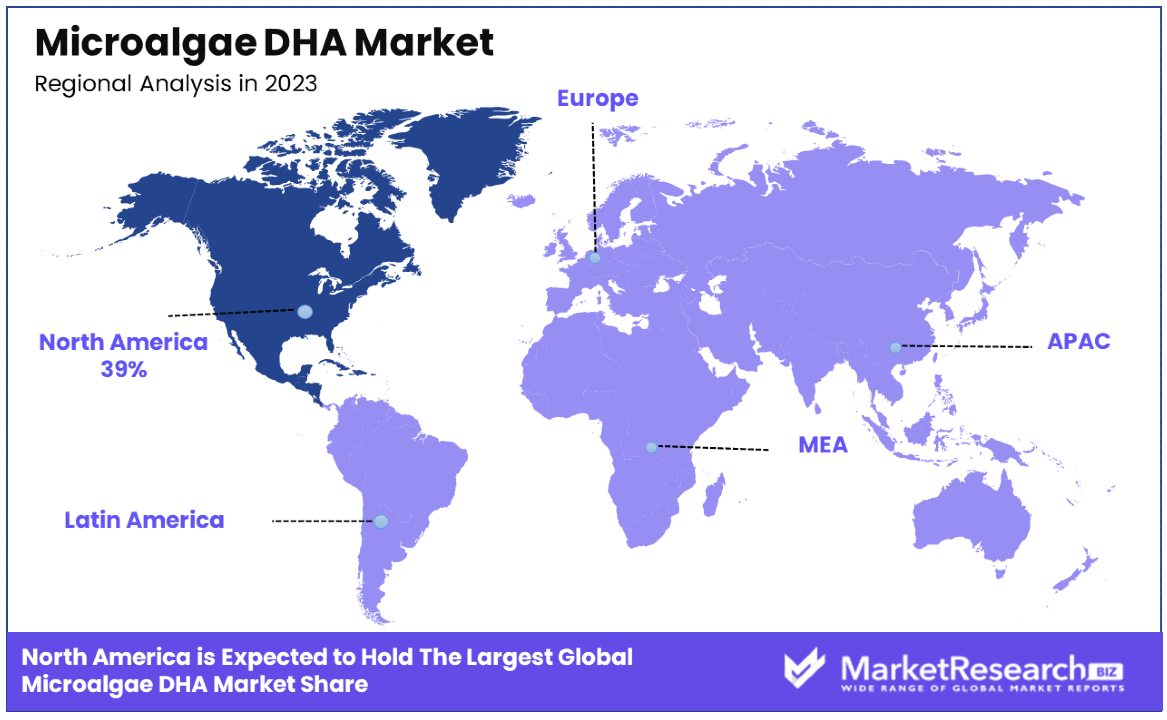
- North America: Dominates the market with a 39% market share, driven by robust consumer demand for health supplements and fortified foods, along with the presence of key manufacturers and distributors.
- Europe: Holds approximately 27% of the market share, supported by increasing adoption of microalgae-derived DHA in functional foods and pharmaceuticals, coupled with favorable regulatory frameworks.
- Analyst Viewpoint: Analysts foresee continued growth in the Microalgae DHA Market, driven by rising consumer awareness of health benefits, increasing demand for functional foods and dietary supplements, and advancements in microalgae cultivation and extraction technologies.
- Growth Opportunities: Growth opportunities lie in expanding product offerings tailored to specific consumer needs, exploring new applications and industries, enhancing distribution networks to reach untapped markets, and investing in research and development to improve product efficacy and sustainability.
Driving Factors
Increasing Demand for Omega-3 Fatty Acids Drives Market Growth
The increasing demand for Omega-3 fatty acids is a primary driver for the growth of the Microalgae DHA Market. Omega-3 fatty acids, particularly DHA, are essential for brain development, cognitive function, and cardiovascular health. As public awareness about these benefits grows, more consumers are seeking DHA-enriched products, which boosts demand for microalgae DHA. This trend is evident in the rising popularity of DHA-fortified foods and dietary supplements.
For instance, DHA-fortified infant formula has become increasingly sought after due to its benefits for infant brain development. This shift towards health-conscious consumption is significantly propelling the market forward, as evidenced by the gap in omega-3 intake among American adults compared to recommended levels by health authorities. The gap underscores the potential for market expansion as consumers aim to meet these nutritional guidelines.
Sustainable and Vegetarian Source Enhances Market Appeal
Microalgae as a sustainable and vegetarian source of DHA significantly contributes to the market's growth. In an era where sustainability and dietary preferences are shifting towards plant-based products, microalgae DHA offers an appealing alternative to traditional fish oil sources of omega-3. The environmental benefits of microalgae, coupled with the growing vegetarian and vegan populations, make it a preferred choice for consumers and manufacturers alike.
Major players like DSM and Corbion are capitalizing on this trend by enhancing their production capabilities in microalgae-derived DHA. This shift not only meets consumer demand but also aligns with global sustainability goals, making microalgae DHA a key player in the future of nutritional supplements and functional foods.
Technological Advancements in Cultivation and Extraction Propel Market Efficiency
Technological advancements in the cultivation and extraction of microalgae DHA are pivotal in enhancing market growth. Improved technologies in microalgae farming, such as closed photobioreactors and optimized growth conditions, have significantly increased the efficiency and yield of DHA production, making it more cost-effective.
For example, companies like Cellana utilize advanced systems like ALDUO to enable large-scale, economical cultivation of microalgae. These technological innovations not only reduce production costs but also improve the quality and scalability of microalgae DHA. As these technologies evolve, they continue to drive down costs and barriers to entry, fostering greater market growth and accessibility. This factor interacts with industry demand and sustainability trends to further enhance the market's expansion and consumer adoption.
Restraining Factors
Supply Chain Challenges Restrain Market Growth
The complexity of the microalgae DHA supply chain significantly restrains market growth. The entire process from cultivation and harvesting to extraction and distribution is intricate and requires precise management to ensure the consistency and quality of microalgae biomass. These challenges can lead to supply disruptions and fluctuations in pricing, which in turn can deter potential investors and customers.
Companies like TerraVia have experienced difficulties in scaling up production, which underscores the critical nature of these supply chain issues. If not addressed, such challenges can prevent the microalgae DHA market from reaching its full potential, as reliable supply chains are essential for maintaining product availability and stable market prices.
Competition from Alternative Sources Limits Market Adoption
Competition from established alternative sources of omega-3 fatty acids, such as fish oil and krill oil, poses significant constraints on the growth of the Microalgae DHA Market. These traditional sources often have lower production costs and are well-known to consumers, which can make them more attractive, especially in markets sensitive to price or in regions with low awareness of the benefits of microalgae-derived products.
Additionally, genetically modified plant sources of omega-3 are emerging as competitors, leveraging advancements in biotechnology to offer cost-effective alternatives. This competition can inhibit the adoption and expansion of the microalgae DHA market, as it struggles to distinguish its offerings and justify potentially higher prices to consumers and manufacturers.
Product Form Analysis
Oil dominates with 45% due to its high bioavailability and ease of integration into various products.
The Product Form segment of the Microalgae DHA Market is notably diverse, comprising oil, powder, capsules, and tablets. Among these, oil emerges as the dominant sub-segment, accounting for approximately 45% of the market share. This predominance is attributed to the oil's high bioavailability, which ensures effective absorption of DHA by the human body. Additionally, the fluid nature of oil allows for versatile applications, including easy integration into dietary supplements and fortified foods, enhancing its appeal to manufacturers.
Powder, capsules, and tablets also play critical roles in the market. Powdered forms are favored for their stability and ease of storage, making them suitable for use in dry dietary supplements and food fortification. Capsules and tablets are popular in consumer markets for their convenience, dosage accuracy, and portability. These forms are particularly prevalent in the dietary supplements and pharmaceuticals segments, where precision and ease of use are paramount. The diverse product forms cater to varying consumer preferences and application requirements, collectively driving the growth of the Microalgae DHA Market. Each form’s unique characteristics allow it to serve specific market niches, thereby supporting the overall expansion of the sector.
Application Analysis
Dietary Supplements lead with 30% due to increasing consumer health awareness and preventative health care trends.
In the Application segment of the Microalgae DHA Market, Dietary Supplements, Infant Formula, Food & Beverages, Animal Feed, Pharmaceuticals, Cosmetics, and Others contribute to its breadth. Dietary Supplements are the dominant sub-segment, holding about 30% of the market share. This leadership stems from the growing consumer awareness regarding health and wellness, coupled with the increasing trend towards preventative healthcare. DHA is highly valued in supplements for its cognitive and cardiovascular benefits, which align well with the health priorities of modern consumers.
The other applications, such as Infant Formula and Food & Beverages, also significantly impact market dynamics. Infant Formula benefits from the critical role DHA plays in brain development, making it a staple ingredient in baby nutrition products. In Food & Beverages, DHA is increasingly used in functional foods and fortified beverages to cater to health-conscious consumers. The Animal Feed sector exploits DHA to enhance the nutritional profile of livestock products, while Pharmaceuticals and Cosmetics leverage its health benefits for therapeutic and skincare products, respectively. Each of these segments contributes to the market's complexity and growth, underscoring the versatility and broad appeal of microalgae-derived DHA.
Sales Channel Analysis
Direct Sales command a 40% share due to strong manufacturer-client relationships and customized product offerings.
The Sales Channel segment in the Microalgae DHA Market is crucial, comprising Direct Sales, Distributor Sales, and Online Retail. Direct Sales are the predominant channel, accounting for 40% of the market. This segment’s strength is based on the direct interaction between manufacturers and end-users or large clients, such as bulk purchasers and industrial users. Direct sales benefit from the ability to build strong relationships and offer customized solutions tailored to specific client needs, which is especially important in industries where formulation and quality specifications are critical.
Distributor Sales and Online Retail are essential but secondary channels. Distributor Sales play a vital role in expanding market reach, especially in regions and sectors where direct sales are impractical. This channel is crucial for smaller retailers and local markets. Meanwhile, Online Retail is growing rapidly, driven by the convenience it offers and the expanding digital infrastructure. It is particularly effective for reaching end consumers directly and is expected to increase its market share as e-commerce platforms become more prevalent. These sales channels collectively enhance market penetration and accessibility, facilitating the overall growth of the Microalgae DHA Market by reaching different customer segments through varied distribution strategies.
Key Market Segments
By Product Form
- Oil
- Powder
- Capsules
- Tablets
By Application
- Dietary Supplements
- Infant Formula
- Food & Beverages
- Animal Feed
- Pharmaceuticals
- Cosmetics
- Others
By Sales Channel
- Direct Sales
- Distributor Sales
- Online Retail
Growth Opportunities
Development of Novel Delivery Forms Offers Growth Opportunity
The exploration of novel delivery forms presents a significant growth opportunity within the Microalgae DHA Market. Traditional supplements like capsules and tablets are well-established, yet there is a growing consumer demand for more varied and convenient options. The development of microalgae DHA-fortified beverages, gummies, or snack bars can cater to this demand, potentially appealing to younger demographics and those averse to traditional supplement formats.
For instance, companies like Corbion are innovating with microalgae DHA-infused milk and yogurt, demonstrating the market’s receptiveness to new product types. These novel delivery forms not only enhance consumer convenience but also broaden the market reach, attracting new customer segments and providing significant opportunities for market expansion.
Strategic Partnerships and Vertical Integration Offers Growth Opportunity
Strategic partnerships and vertical integration represent key growth opportunities in the Microalgae DHA Market. Collaborations between microalgae DHA producers and entities in the food and beverage and supplement industries can enhance product development capabilities and market penetration. By vertically integrating the supply chain, companies can achieve greater control over production quality and cost efficiency.
This integration helps in streamlining operations and maintaining consistent product quality, which is crucial for consumer trust and brand reliability. For example, DSM’s partnership with Roquette Frères enables the production of non-GMO microalgae-derived DHA for various applications, highlighting how such collaborations can lead to innovative products and strengthen market positions. These strategic initiatives facilitate the entry into new markets and the expansion of existing ones, driving overall market growth.
Trending Factors
Personalized Nutrition and Precision Formulations Are Trending Factors
The shift towards personalized nutrition and precision formulations is a significant trend within the Microalgae DHA Market. This trend is driven by consumers' increasing demand for health products that cater specifically to their individual needs and lifestyle choices. Microalgae DHA is well-positioned to capitalize on this trend due to its adaptability in various formulations, enabling manufacturers to create tailored products such as custom dosage supplements and functional foods designed for specific health outcomes.
This capability not only meets consumer expectations for personalization but also enhances the value proposition of microalgae DHA products, making them more appealing and relevant in today's market. The focus on personalized solutions is a key driver for innovation and differentiation, potentially leading to increased market penetration and growth.
Clean Label and Transparency Are Trending Factors
Clean label and transparency in product formulations are increasingly important to consumers, making them prominent trends in the Microalgae DHA Market. As consumers become more health-conscious and wary of synthetic additives and GMOs, the demand for natural and straightforward products grows. Microalgae DHA fits this trend perfectly as a natural, plant-based source of omega-3 fatty acids, offering a clean and sustainable alternative to fish oil.
By highlighting these attributes, companies can effectively communicate the purity and environmental benefits of their products. For instance, Portuguese microalgae company Allma emphasizes its non-GMO, vegan, and sustainably sourced microalgae DHA, aligning with consumer preferences for transparency and ethical production practices. This trend not only attracts health-conscious consumers but also fosters trust and loyalty, supporting market growth and brand differentiation.
Regional Analysis
North America Dominates with 39% Market Share
North America's commanding 39% share of the Microalgae DHA Market is primarily driven by high consumer awareness of health and wellness, coupled with substantial spending power. The region hosts a well-established dietary supplement industry and a robust infrastructure for biotechnology research and development, which facilitates innovation and new product development in microalgae DHA. Additionally, stringent regulatory standards in North America encourage the production and marketing of high-quality, sustainable products, further boosting the market for microalgae DHA.
The market dynamics in North America are influenced by an aging population increasingly focused on cognitive health and cardiovascular wellness, areas where DHA has proven benefits. The presence of key industry players and startups focusing on algae-based products also energizes the regional market. Furthermore, the trend towards plant-based and non-animal products aligns well with the increasing vegan and vegetarian populations in this region, augmenting the demand for microalgae DHA.
North America is expected to maintain its dominance in the Microalgae DHA Market due to ongoing innovations in biotech and an increasing consumer preference for sustainably sourced ingredients. Strategic partnerships and advancements in algae cultivation technology are likely to further enhance production capacities, making DHA more accessible and affordable. As awareness and demand continue to grow, North America’s market influence is poised to expand, setting trends globally in the nutraceutical sector.
Regional Market Shares:
- Europe: Holds approximately 27% of the market share. Europe's market is driven by rising health consciousness and favorable regulatory support for sustainable products.
- Asia Pacific: Accounts for about 21% of the market. This region's growth is fueled by increasing disposable incomes, expanding middle-class populations, and growing awareness of dietary supplements.
- Middle East & Africa: Represents around 7% of the market. The smaller share reflects emerging market conditions, but with increasing health awareness and economic development, growth potential is significant.
- Latin America: Captures about 6% of the market. While currently smaller in share, rising health awareness and improving economic conditions are likely to drive growth in the future.
Key Regions and Countries
- North America
- The US
- Canada
- Mexico
- Western Europe
- Germany
- France
- The UK
- Spain
- Italy
- Portugal
- Ireland
- Austria
- Switzerland
- Benelux
- Nordic
- Rest of Western Europe
- Eastern Europe
- Russia
- Poland
- The Czech Republic
- Greece
- Rest of Eastern Europe
- APAC
- China
- Japan
- South Korea
- India
- Australia & New Zealand
- Indonesia
- Malaysia
- Philippines
- Singapore
- Thailand
- Vietnam
- Rest of APAC
- Latin America
- Brazil
- Colombia
- Chile
- Argentina
- Costa Rica
- Rest of Latin America
- Middle East & Africa
- Algeria
- Egypt
- Israel
- Kuwait
- Nigeria
- Saudi Arabia
- South Africa
- Turkey
- United Arab Emirates
- Rest of MEA
Key Players Analysis
The Microalgae DHA Market is characterized by a diverse range of key players vying for market dominance and strategic positioning. Among these players are Source Omega LLC, Goerlich Pharma GmbH, Deva Nutrition LLC, InovoBiologic Inc., Xiamen Huison Biotech Co., Ltd, Cellana Inc., Nordic Naturals, Inc., Shandong Yuexiang Biotechnology Co., Ltd., Hubei Ruiren Biotechnology Co., Ltd., Archer Daniels Midland Company, KD Pharma Group, Wuhan Bioco Sci. & Tech, KD Nutra's, and Kangcare Bioindustry Co., Ltd.
Each of these companies brings unique strengths and strategies to the Microalgae DHA Market. Source Omega LLC, for instance, is known for its commitment to quality and innovation, positioning itself as a leader in sustainable microalgae-based products. Goerlich Pharma GmbH leverages its extensive research and development capabilities to create cutting-edge DHA formulations tailored to specific market segments.
Deva Nutrition LLC stands out for its focus on organic and vegan-friendly offerings, appealing to health-conscious consumers seeking clean-label products. InovoBiologic Inc. distinguishes itself through strategic partnerships and collaborations, expanding its market reach and technological capabilities.
Xiamen Huison Biotech Co., Ltd and Shandong Yuexiang Biotechnology Co., Ltd. are prominent players in the Asian market, capitalizing on regional demand and manufacturing expertise. Nordic Naturals, Inc., on the other hand, emphasizes its reputation for purity and potency, attracting a loyal customer base in the dietary supplements sector.
Cellana Inc. and Hubei Ruiren Biotechnology Co., Ltd. are at the forefront of research and development, continuously pushing the boundaries of microalgae technology to drive product innovation and differentiation. Archer Daniels Midland Company and KD Pharma Group boast extensive distribution networks and global presence, enabling them to capitalize on emerging market trends and opportunities.
Wuhan Bioco Sci. & Tech, KD Nutra's, and Kangcare Bioindustry Co., Ltd. focus on scalability and cost-effectiveness, positioning themselves as reliable suppliers catering to both industrial and consumer markets.
Overall, the Microalgae DHA Market is characterized by intense competition and dynamic innovation, with each key player contributing to the industry's growth and evolution through their distinct strategies and market influence.
Market Key Players
- Source Omega LLC
- Goerlich Pharma GmbH
- Deva Nutrition LLC
- InovoBiologic Inc.
- Xiamen Huison Biotech Co., Ltd
- Cellana Inc.
- Nordic Naturals, Inc.
- Shandong Yuexiang Biotechnology Co., Ltd.
- Hubei Ruiren Biotechnology Co., Ltd.
- Archer Daniels Midland Company
- KD Pharma Group
- Wuhan Bioco Sci. & Tech
- KD Nutra's
- Kangcare Bioindustry Co., Ltd.
Recent Developments
- On April 2024, Mara Renewables partnered with Checkerspot to ferment microalgae-based omega-3s. This collaboration aims to develop specific triglyceride oils at scale, aligning with Mara Renewables' commitment to sustainable innovation. The partnership leverages Checkerspot's expertise in microalgae and fermentation techniques to deliver superior omega-3 oils with a unique fatty acid composition for improved performance.
- On April 2024, Ana Morão, a corporate sustainability scientist at Corbion, discussed the importance of sustainable omega-3s from microalgae fermentation. With the global population projected to reach 9 billion by 2050, aquaculture plays a crucial role in ensuring global food security. Corbion, a leading company, uses industrial-scale fermentation to transform sugarcane waste into algae omega-3s, offering sustainable alternatives to fish oil-based feed and contributing to the growth of aquaculture.
- On April 2024, there was a discussion on the need to shift to sustainable omega-3 sources for human consumption. The focus was on the changing tide in the omega-3 industry, emphasizing the importance of transitioning to sustainable sources like life’s™OMEGA EPA and DHA from microalgae. This shift is driven by factors such as supply shortages and increased consumer preference for non-marine algal-sourced omega-3s due to concerns about marine contamination.
Report Scope
Report Features Description Market Value (2023) USD 1.5 Billion Forecast Revenue (2033) USD 2.8 Billion CAGR (2024-2033) 6.70% Base Year for Estimation 2023 Historic Period 2018-2023 Forecast Period 2024-2033 Report Coverage Revenue Forecast, Market Dynamics, Competitive Landscape, Recent Developments Segments Covered By Product Form (Oil, Powder, Capsules, Tablets), By Application (Dietary Supplements, Infant Formula, Food & Beverages (e.g., Functional Foods, Fortified Beverages), Animal Feed, Pharmaceuticals, Cosmetics, Others), By Sales Channel (Direct Sales, Distributor Sales, Online Retail) Regional Analysis North America - The US, Canada, & Mexico; Western Europe - Germany, France, The UK, Spain, Italy, Portugal, Ireland, Austria, Switzerland, Benelux, Nordic, & Rest of Western Europe; Eastern Europe - Russia, Poland, The Czech Republic, Greece, & Rest of Eastern Europe; APAC - China, Japan, South Korea, India, Australia & New Zealand, Indonesia, Malaysia, Philippines, Singapore, Thailand, Vietnam, & Rest of APAC; Latin America - Brazil, Colombia, Chile, Argentina, Costa Rica, & Rest of Latin America; Middle East & Africa - Algeria, Egypt, Israel, Kuwait, Nigeria, Saudi Arabia, South Africa, Turkey, United Arab Emirates, & Rest of MEA Competitive Landscape Source Omega LLC, Goerlich Pharma GmbH, Deva Nutrition LLC, InovoBiologic Inc., Xiamen Huison Biotech Co., Ltd, Cellana Inc., Nordic Naturals, Inc., Shandong Yuexiang Biotechnology Co., Ltd., Hubei Ruiren Biotechnology Co., Ltd., Archer Daniels Midland Company, KD Pharma Group, Wuhan Bioco Sci. & Tech, KD Nutra's, Kangcare Bioindustry Co., Ltd. Customization Scope Customization for segments, region/country-level will be provided. Moreover, additional customization can be done based on the requirements. Purchase Options We have three licenses to opt for: Single User License, Multi-User License (Up to 5 Users), Corporate Use License (Unlimited User and Printable PDF) -
- 1. Executive Summary
- 1.1. Definition
- 1.2. Taxonomy
- 1.3. Research Scope
- 1.4. Key Analysis
- 1.5. Key Findings by Major Segments
- 1.6. Top strategies by Major Players
- 2. Global Microalgae DHA Market Overview
- 2.1. Microalgae DHA Market Dynamics
- 2.1.1. Drivers
- 2.1.2. Opportunities
- 2.1.3. Restraints
- 2.1.4. Challenges
- 2.2. Macro-economic Factors
- 2.3. Regulatory Framework
- 2.4. Market Investment Feasibility Index
- 2.5. PEST Analysis
- 2.6. PORTER’S Five Force Analysis
- 2.7. Drivers & Restraints Impact Analysis
- 2.8. Industry Chain Analysis
- 2.9. Cost Structure Analysis
- 2.10. Marketing Strategy
- 2.11. Russia-Ukraine War Impact Analysis
- 2.12. Opportunity Map Analysis
- 2.13. Market Competition Scenario Analysis
- 2.14. Product Life Cycle Analysis
- 2.15. Opportunity Orbits
- 2.16. Manufacturer Intensity Map
- 2.17. Major Companies sales by Value & Volume
- 2.1. Microalgae DHA Market Dynamics
- 3. Global Microalgae DHA Market Analysis, Opportunity and Forecast, 2016-2032
- 3.1. Global Microalgae DHA Market Analysis, 2016-2021
- 3.2. Global Microalgae DHA Market Opportunity and Forecast, 2023-2032
- 3.3. Global Microalgae DHA Market Analysis, Opportunity and Forecast, By Product Form, 2016-2032
- 3.3.1. Global Microalgae DHA Market Analysis by Product Form: Introduction
- 3.3.2. Market Size Absolute $ Opportunity Analysis and Forecast, By Product Form, 2016-2032
- 3.3.3. Oil
- 3.3.4. Powder
- 3.3.5. Capsules
- 3.3.6. Tablets
- 3.4. Global Microalgae DHA Market Analysis, Opportunity and Forecast, By Application, 2016-2032
- 3.4.1. Global Microalgae DHA Market Analysis by Application: Introduction
- 3.4.2. Market Size Absolute $ Opportunity Analysis and Forecast, By Application, 2016-2032
- 3.4.3. Dietary Supplements
- 3.4.4. Infant Formula
- 3.4.5. Food & Beverages
- 3.4.6. Animal Feed
- 3.4.7. Pharmaceuticals
- 3.4.8. Cosmetics
- 3.4.9. Others
- 3.5. Global Microalgae DHA Market Analysis, Opportunity and Forecast, By Sales Channel, 2016-2032
- 3.5.1. Global Microalgae DHA Market Analysis by Sales Channel: Introduction
- 3.5.2. Market Size Absolute $ Opportunity Analysis and Forecast, By Sales Channel, 2016-2032
- 3.5.3. Direct Sales
- 3.5.4. Distributor Sales
- 3.5.5. Online Retail
- 4. North America Microalgae DHA Market Analysis, Opportunity and Forecast, 2016-2032
- 4.1. North America Microalgae DHA Market Analysis, 2016-2021
- 4.2. North America Microalgae DHA Market Opportunity and Forecast, 2023-2032
- 4.3. North America Microalgae DHA Market Analysis, Opportunity and Forecast, By Product Form, 2016-2032
- 4.3.1. North America Microalgae DHA Market Analysis by Product Form: Introduction
- 4.3.2. Market Size Absolute $ Opportunity Analysis and Forecast, By Product Form, 2016-2032
- 4.3.3. Oil
- 4.3.4. Powder
- 4.3.5. Capsules
- 4.3.6. Tablets
- 4.4. North America Microalgae DHA Market Analysis, Opportunity and Forecast, By Application, 2016-2032
- 4.4.1. North America Microalgae DHA Market Analysis by Application: Introduction
- 4.4.2. Market Size Absolute $ Opportunity Analysis and Forecast, By Application, 2016-2032
- 4.4.3. Dietary Supplements
- 4.4.4. Infant Formula
- 4.4.5. Food & Beverages
- 4.4.6. Animal Feed
- 4.4.7. Pharmaceuticals
- 4.4.8. Cosmetics
- 4.4.9. Others
- 4.5. North America Microalgae DHA Market Analysis, Opportunity and Forecast, By Sales Channel, 2016-2032
- 4.5.1. North America Microalgae DHA Market Analysis by Sales Channel: Introduction
- 4.5.2. Market Size Absolute $ Opportunity Analysis and Forecast, By Sales Channel, 2016-2032
- 4.5.3. Direct Sales
- 4.5.4. Distributor Sales
- 4.5.5. Online Retail
- 4.6. North America Microalgae DHA Market Analysis, Opportunity and Forecast, By Country , 2016-2032
- 4.6.1. North America Microalgae DHA Market Analysis by Country : Introduction
- 4.6.2. Market Size Absolute $ Opportunity Analysis and Forecast, Country , 2016-2032
- 4.6.2.1. The US
- 4.6.2.2. Canada
- 4.6.2.3. Mexico
- 5. Western Europe Microalgae DHA Market Analysis, Opportunity and Forecast, 2016-2032
- 5.1. Western Europe Microalgae DHA Market Analysis, 2016-2021
- 5.2. Western Europe Microalgae DHA Market Opportunity and Forecast, 2023-2032
- 5.3. Western Europe Microalgae DHA Market Analysis, Opportunity and Forecast, By Product Form, 2016-2032
- 5.3.1. Western Europe Microalgae DHA Market Analysis by Product Form: Introduction
- 5.3.2. Market Size Absolute $ Opportunity Analysis and Forecast, By Product Form, 2016-2032
- 5.3.3. Oil
- 5.3.4. Powder
- 5.3.5. Capsules
- 5.3.6. Tablets
- 5.4. Western Europe Microalgae DHA Market Analysis, Opportunity and Forecast, By Application, 2016-2032
- 5.4.1. Western Europe Microalgae DHA Market Analysis by Application: Introduction
- 5.4.2. Market Size Absolute $ Opportunity Analysis and Forecast, By Application, 2016-2032
- 5.4.3. Dietary Supplements
- 5.4.4. Infant Formula
- 5.4.5. Food & Beverages
- 5.4.6. Animal Feed
- 5.4.7. Pharmaceuticals
- 5.4.8. Cosmetics
- 5.4.9. Others
- 5.5. Western Europe Microalgae DHA Market Analysis, Opportunity and Forecast, By Sales Channel, 2016-2032
- 5.5.1. Western Europe Microalgae DHA Market Analysis by Sales Channel: Introduction
- 5.5.2. Market Size Absolute $ Opportunity Analysis and Forecast, By Sales Channel, 2016-2032
- 5.5.3. Direct Sales
- 5.5.4. Distributor Sales
- 5.5.5. Online Retail
- 5.6. Western Europe Microalgae DHA Market Analysis, Opportunity and Forecast, By Country , 2016-2032
- 5.6.1. Western Europe Microalgae DHA Market Analysis by Country : Introduction
- 5.6.2. Market Size Absolute $ Opportunity Analysis and Forecast, Country , 2016-2032
- 5.6.2.1. Germany
- 5.6.2.2. France
- 5.6.2.3. The UK
- 5.6.2.4. Spain
- 5.6.2.5. Italy
- 5.6.2.6. Portugal
- 5.6.2.7. Ireland
- 5.6.2.8. Austria
- 5.6.2.9. Switzerland
- 5.6.2.10. Benelux
- 5.6.2.11. Nordic
- 5.6.2.12. Rest of Western Europe
- 6. Eastern Europe Microalgae DHA Market Analysis, Opportunity and Forecast, 2016-2032
- 6.1. Eastern Europe Microalgae DHA Market Analysis, 2016-2021
- 6.2. Eastern Europe Microalgae DHA Market Opportunity and Forecast, 2023-2032
- 6.3. Eastern Europe Microalgae DHA Market Analysis, Opportunity and Forecast, By Product Form, 2016-2032
- 6.3.1. Eastern Europe Microalgae DHA Market Analysis by Product Form: Introduction
- 6.3.2. Market Size Absolute $ Opportunity Analysis and Forecast, By Product Form, 2016-2032
- 6.3.3. Oil
- 6.3.4. Powder
- 6.3.5. Capsules
- 6.3.6. Tablets
- 6.4. Eastern Europe Microalgae DHA Market Analysis, Opportunity and Forecast, By Application, 2016-2032
- 6.4.1. Eastern Europe Microalgae DHA Market Analysis by Application: Introduction
- 6.4.2. Market Size Absolute $ Opportunity Analysis and Forecast, By Application, 2016-2032
- 6.4.3. Dietary Supplements
- 6.4.4. Infant Formula
- 6.4.5. Food & Beverages
- 6.4.6. Animal Feed
- 6.4.7. Pharmaceuticals
- 6.4.8. Cosmetics
- 6.4.9. Others
- 6.5. Eastern Europe Microalgae DHA Market Analysis, Opportunity and Forecast, By Sales Channel, 2016-2032
- 6.5.1. Eastern Europe Microalgae DHA Market Analysis by Sales Channel: Introduction
- 6.5.2. Market Size Absolute $ Opportunity Analysis and Forecast, By Sales Channel, 2016-2032
- 6.5.3. Direct Sales
- 6.5.4. Distributor Sales
- 6.5.5. Online Retail
- 6.6. Eastern Europe Microalgae DHA Market Analysis, Opportunity and Forecast, By Country , 2016-2032
- 6.6.1. Eastern Europe Microalgae DHA Market Analysis by Country : Introduction
- 6.6.2. Market Size Absolute $ Opportunity Analysis and Forecast, Country , 2016-2032
- 6.6.2.1. Russia
- 6.6.2.2. Poland
- 6.6.2.3. The Czech Republic
- 6.6.2.4. Greece
- 6.6.2.5. Rest of Eastern Europe
- 7. APAC Microalgae DHA Market Analysis, Opportunity and Forecast, 2016-2032
- 7.1. APAC Microalgae DHA Market Analysis, 2016-2021
- 7.2. APAC Microalgae DHA Market Opportunity and Forecast, 2023-2032
- 7.3. APAC Microalgae DHA Market Analysis, Opportunity and Forecast, By Product Form, 2016-2032
- 7.3.1. APAC Microalgae DHA Market Analysis by Product Form: Introduction
- 7.3.2. Market Size Absolute $ Opportunity Analysis and Forecast, By Product Form, 2016-2032
- 7.3.3. Oil
- 7.3.4. Powder
- 7.3.5. Capsules
- 7.3.6. Tablets
- 7.4. APAC Microalgae DHA Market Analysis, Opportunity and Forecast, By Application, 2016-2032
- 7.4.1. APAC Microalgae DHA Market Analysis by Application: Introduction
- 7.4.2. Market Size Absolute $ Opportunity Analysis and Forecast, By Application, 2016-2032
- 7.4.3. Dietary Supplements
- 7.4.4. Infant Formula
- 7.4.5. Food & Beverages
- 7.4.6. Animal Feed
- 7.4.7. Pharmaceuticals
- 7.4.8. Cosmetics
- 7.4.9. Others
- 7.5. APAC Microalgae DHA Market Analysis, Opportunity and Forecast, By Sales Channel, 2016-2032
- 7.5.1. APAC Microalgae DHA Market Analysis by Sales Channel: Introduction
- 7.5.2. Market Size Absolute $ Opportunity Analysis and Forecast, By Sales Channel, 2016-2032
- 7.5.3. Direct Sales
- 7.5.4. Distributor Sales
- 7.5.5. Online Retail
- 7.6. APAC Microalgae DHA Market Analysis, Opportunity and Forecast, By Country , 2016-2032
- 7.6.1. APAC Microalgae DHA Market Analysis by Country : Introduction
- 7.6.2. Market Size Absolute $ Opportunity Analysis and Forecast, Country , 2016-2032
- 7.6.2.1. China
- 7.6.2.2. Japan
- 7.6.2.3. South Korea
- 7.6.2.4. India
- 7.6.2.5. Australia & New Zeland
- 7.6.2.6. Indonesia
- 7.6.2.7. Malaysia
- 7.6.2.8. Philippines
- 7.6.2.9. Singapore
- 7.6.2.10. Thailand
- 7.6.2.11. Vietnam
- 7.6.2.12. Rest of APAC
- 8. Latin America Microalgae DHA Market Analysis, Opportunity and Forecast, 2016-2032
- 8.1. Latin America Microalgae DHA Market Analysis, 2016-2021
- 8.2. Latin America Microalgae DHA Market Opportunity and Forecast, 2023-2032
- 8.3. Latin America Microalgae DHA Market Analysis, Opportunity and Forecast, By Product Form, 2016-2032
- 8.3.1. Latin America Microalgae DHA Market Analysis by Product Form: Introduction
- 8.3.2. Market Size Absolute $ Opportunity Analysis and Forecast, By Product Form, 2016-2032
- 8.3.3. Oil
- 8.3.4. Powder
- 8.3.5. Capsules
- 8.3.6. Tablets
- 8.4. Latin America Microalgae DHA Market Analysis, Opportunity and Forecast, By Application, 2016-2032
- 8.4.1. Latin America Microalgae DHA Market Analysis by Application: Introduction
- 8.4.2. Market Size Absolute $ Opportunity Analysis and Forecast, By Application, 2016-2032
- 8.4.3. Dietary Supplements
- 8.4.4. Infant Formula
- 8.4.5. Food & Beverages
- 8.4.6. Animal Feed
- 8.4.7. Pharmaceuticals
- 8.4.8. Cosmetics
- 8.4.9. Others
- 8.5. Latin America Microalgae DHA Market Analysis, Opportunity and Forecast, By Sales Channel, 2016-2032
- 8.5.1. Latin America Microalgae DHA Market Analysis by Sales Channel: Introduction
- 8.5.2. Market Size Absolute $ Opportunity Analysis and Forecast, By Sales Channel, 2016-2032
- 8.5.3. Direct Sales
- 8.5.4. Distributor Sales
- 8.5.5. Online Retail
- 8.6. Latin America Microalgae DHA Market Analysis, Opportunity and Forecast, By Country , 2016-2032
- 8.6.1. Latin America Microalgae DHA Market Analysis by Country : Introduction
- 8.6.2. Market Size Absolute $ Opportunity Analysis and Forecast, Country , 2016-2032
- 8.6.2.1. Brazil
- 8.6.2.2. Colombia
- 8.6.2.3. Chile
- 8.6.2.4. Argentina
- 8.6.2.5. Costa Rica
- 8.6.2.6. Rest of Latin America
- 9. Middle East & Africa Microalgae DHA Market Analysis, Opportunity and Forecast, 2016-2032
- 9.1. Middle East & Africa Microalgae DHA Market Analysis, 2016-2021
- 9.2. Middle East & Africa Microalgae DHA Market Opportunity and Forecast, 2023-2032
- 9.3. Middle East & Africa Microalgae DHA Market Analysis, Opportunity and Forecast, By Product Form, 2016-2032
- 9.3.1. Middle East & Africa Microalgae DHA Market Analysis by Product Form: Introduction
- 9.3.2. Market Size Absolute $ Opportunity Analysis and Forecast, By Product Form, 2016-2032
- 9.3.3. Oil
- 9.3.4. Powder
- 9.3.5. Capsules
- 9.3.6. Tablets
- 9.4. Middle East & Africa Microalgae DHA Market Analysis, Opportunity and Forecast, By Application, 2016-2032
- 9.4.1. Middle East & Africa Microalgae DHA Market Analysis by Application: Introduction
- 9.4.2. Market Size Absolute $ Opportunity Analysis and Forecast, By Application, 2016-2032
- 9.4.3. Dietary Supplements
- 9.4.4. Infant Formula
- 9.4.5. Food & Beverages
- 9.4.6. Animal Feed
- 9.4.7. Pharmaceuticals
- 9.4.8. Cosmetics
- 9.4.9. Others
- 9.5. Middle East & Africa Microalgae DHA Market Analysis, Opportunity and Forecast, By Sales Channel, 2016-2032
- 9.5.1. Middle East & Africa Microalgae DHA Market Analysis by Sales Channel: Introduction
- 9.5.2. Market Size Absolute $ Opportunity Analysis and Forecast, By Sales Channel, 2016-2032
- 9.5.3. Direct Sales
- 9.5.4. Distributor Sales
- 9.5.5. Online Retail
- 9.6. Middle East & Africa Microalgae DHA Market Analysis, Opportunity and Forecast, By Country , 2016-2032
- 9.6.1. Middle East & Africa Microalgae DHA Market Analysis by Country : Introduction
- 9.6.2. Market Size Absolute $ Opportunity Analysis and Forecast, Country , 2016-2032
- 9.6.2.1. Algeria
- 9.6.2.2. Egypt
- 9.6.2.3. Israel
- 9.6.2.4. Kuwait
- 9.6.2.5. Nigeria
- 9.6.2.6. Saudi Arabia
- 9.6.2.7. South Africa
- 9.6.2.8. Turkey
- 9.6.2.9. The UAE
- 9.6.2.10. Rest of MEA
- 10. Global Microalgae DHA Market Analysis, Opportunity and Forecast, By Region , 2016-2032
- 10.1. Global Microalgae DHA Market Analysis by Region : Introduction
- 10.2. Market Size Absolute $ Opportunity Analysis and Forecast, By Region , 2016-2032
- 10.2.1. North America
- 10.2.2. Western Europe
- 10.2.3. Eastern Europe
- 10.2.4. APAC
- 10.2.5. Latin America
- 10.2.6. Middle East & Africa
- 11. Global Microalgae DHA Market Competitive Landscape, Market Share Analysis, and Company Profiles
- 11.1. Market Share Analysis
- 11.2. Company Profiles
- 11.3. Source Omega LLC
- 11.3.1. Company Overview
- 11.3.2. Financial Highlights
- 11.3.3. Product Portfolio
- 11.3.4. SWOT Analysis
- 11.3.5. Key Strategies and Developments
- 11.4. Goerlich Pharma GmbH
- 11.4.1. Company Overview
- 11.4.2. Financial Highlights
- 11.4.3. Product Portfolio
- 11.4.4. SWOT Analysis
- 11.4.5. Key Strategies and Developments
- 11.5. Deva Nutrition LLC
- 11.5.1. Company Overview
- 11.5.2. Financial Highlights
- 11.5.3. Product Portfolio
- 11.5.4. SWOT Analysis
- 11.5.5. Key Strategies and Developments
- 11.6. InovoBiologic Inc.
- 11.6.1. Company Overview
- 11.6.2. Financial Highlights
- 11.6.3. Product Portfolio
- 11.6.4. SWOT Analysis
- 11.6.5. Key Strategies and Developments
- 11.7. Xiamen Huison Biotech Co., Ltd
- 11.7.1. Company Overview
- 11.7.2. Financial Highlights
- 11.7.3. Product Portfolio
- 11.7.4. SWOT Analysis
- 11.7.5. Key Strategies and Developments
- 11.8. Cellana Inc.
- 11.8.1. Company Overview
- 11.8.2. Financial Highlights
- 11.8.3. Product Portfolio
- 11.8.4. SWOT Analysis
- 11.8.5. Key Strategies and Developments
- 11.9. Nordic Naturals, Inc.
- 11.9.1. Company Overview
- 11.9.2. Financial Highlights
- 11.9.3. Product Portfolio
- 11.9.4. SWOT Analysis
- 11.9.5. Key Strategies and Developments
- 11.10. Shandong Yuexiang Biotechnology Co., Ltd.
- 11.10.1. Company Overview
- 11.10.2. Financial Highlights
- 11.10.3. Product Portfolio
- 11.10.4. SWOT Analysis
- 11.10.5. Key Strategies and Developments
- 11.11. Hubei Ruiren Biotechnology Co., Ltd.
- 11.11.1. Company Overview
- 11.11.2. Financial Highlights
- 11.11.3. Product Portfolio
- 11.11.4. SWOT Analysis
- 11.11.5. Key Strategies and Developments
- 11.12. Archer Daniels Midland Company
- 11.12.1. Company Overview
- 11.12.2. Financial Highlights
- 11.12.3. Product Portfolio
- 11.12.4. SWOT Analysis
- 11.12.5. Key Strategies and Developments
- 11.13.1. Company Overview
- 11.13.2. Financial Highlights
- 11.13.3. Product Portfolio
- 11.13.4. SWOT Analysis
- 11.13.5. Key Strategies and Developments
- 11.14. KD Pharma Group
- 11.14.1. Company Overview
- 11.14.2. Financial Highlights
- 11.14.3. Product Portfolio
- 11.14.4. SWOT Analysis
- 11.14.5. Key Strategies and Developments
- 11.15. KD Nutra's
- 11.15.1. Company Overview
- 11.15.2. Financial Highlights
- 11.15.3. Product Portfolio
- 11.15.4. SWOT Analysis
- 11.15.5. Key Strategies and Developments
- 11.16. Kangcare Bioindustry Co., Ltd.
- 11.16.1. Company Overview
- 11.16.2. Financial Highlights
- 11.16.3. Product Portfolio
- 11.16.4. SWOT Analysis
- 11.16.5. Key Strategies and Developments
- 12. Assumptions and Acronyms
- 13. Research Methodology
- 14. Contact
- List of Figures
- Figure 1: Global Microalgae DHA Market Revenue (US$ Mn) Market Share by Product Form in 2022
- Figure 2: Global Microalgae DHA Market Attractiveness Analysis by Product Form, 2016-2032
- Figure 3: Global Microalgae DHA Market Revenue (US$ Mn) Market Share by Applicationin 2022
- Figure 4: Global Microalgae DHA Market Attractiveness Analysis by Application, 2016-2032
- Figure 5: Global Microalgae DHA Market Revenue (US$ Mn) Market Share by Sales Channelin 2022
- Figure 6: Global Microalgae DHA Market Attractiveness Analysis by Sales Channel, 2016-2032
- Figure 7: Global Microalgae DHA Market Revenue (US$ Mn) Market Share by Region in 2022
- Figure 8: Global Microalgae DHA Market Attractiveness Analysis by Region, 2016-2032
- Figure 9: Global Microalgae DHA Market Revenue (US$ Mn) (2016-2032)
- Figure 10: Global Microalgae DHA Market Revenue (US$ Mn) Comparison by Region (2016-2032)
- Figure 11: Global Microalgae DHA Market Revenue (US$ Mn) Comparison by Product Form (2016-2032)
- Figure 12: Global Microalgae DHA Market Revenue (US$ Mn) Comparison by Application (2016-2032)
- Figure 13: Global Microalgae DHA Market Revenue (US$ Mn) Comparison by Sales Channel (2016-2032)
- Figure 14: Global Microalgae DHA Market Y-o-Y Growth Rate Comparison by Region (2016-2032)
- Figure 15: Global Microalgae DHA Market Y-o-Y Growth Rate Comparison by Product Form (2016-2032)
- Figure 16: Global Microalgae DHA Market Y-o-Y Growth Rate Comparison by Application (2016-2032)
- Figure 17: Global Microalgae DHA Market Y-o-Y Growth Rate Comparison by Sales Channel (2016-2032)
- Figure 18: Global Microalgae DHA Market Share Comparison by Region (2016-2032)
- Figure 19: Global Microalgae DHA Market Share Comparison by Product Form (2016-2032)
- Figure 20: Global Microalgae DHA Market Share Comparison by Application (2016-2032)
- Figure 21: Global Microalgae DHA Market Share Comparison by Sales Channel (2016-2032)
- Figure 22: North America Microalgae DHA Market Revenue (US$ Mn) Market Share by Product Formin 2022
- Figure 23: North America Microalgae DHA Market Attractiveness Analysis by Product Form, 2016-2032
- Figure 24: North America Microalgae DHA Market Revenue (US$ Mn) Market Share by Applicationin 2022
- Figure 25: North America Microalgae DHA Market Attractiveness Analysis by Application, 2016-2032
- Figure 26: North America Microalgae DHA Market Revenue (US$ Mn) Market Share by Sales Channelin 2022
- Figure 27: North America Microalgae DHA Market Attractiveness Analysis by Sales Channel, 2016-2032
- Figure 28: North America Microalgae DHA Market Revenue (US$ Mn) Market Share by Country in 2022
- Figure 29: North America Microalgae DHA Market Attractiveness Analysis by Country, 2016-2032
- Figure 30: North America Microalgae DHA Market Revenue (US$ Mn) (2016-2032)
- Figure 31: North America Microalgae DHA Market Revenue (US$ Mn) Comparison by Country (2016-2032)
- Figure 32: North America Microalgae DHA Market Revenue (US$ Mn) Comparison by Product Form (2016-2032)
- Figure 33: North America Microalgae DHA Market Revenue (US$ Mn) Comparison by Application (2016-2032)
- Figure 34: North America Microalgae DHA Market Revenue (US$ Mn) Comparison by Sales Channel (2016-2032)
- Figure 35: North America Microalgae DHA Market Y-o-Y Growth Rate Comparison by Country (2016-2032)
- Figure 36: North America Microalgae DHA Market Y-o-Y Growth Rate Comparison by Product Form (2016-2032)
- Figure 37: North America Microalgae DHA Market Y-o-Y Growth Rate Comparison by Application (2016-2032)
- Figure 38: North America Microalgae DHA Market Y-o-Y Growth Rate Comparison by Sales Channel (2016-2032)
- Figure 39: North America Microalgae DHA Market Share Comparison by Country (2016-2032)
- Figure 40: North America Microalgae DHA Market Share Comparison by Product Form (2016-2032)
- Figure 41: North America Microalgae DHA Market Share Comparison by Application (2016-2032)
- Figure 42: North America Microalgae DHA Market Share Comparison by Sales Channel (2016-2032)
- Figure 43: Western Europe Microalgae DHA Market Revenue (US$ Mn) Market Share by Product Formin 2022
- Figure 44: Western Europe Microalgae DHA Market Attractiveness Analysis by Product Form, 2016-2032
- Figure 45: Western Europe Microalgae DHA Market Revenue (US$ Mn) Market Share by Applicationin 2022
- Figure 46: Western Europe Microalgae DHA Market Attractiveness Analysis by Application, 2016-2032
- Figure 47: Western Europe Microalgae DHA Market Revenue (US$ Mn) Market Share by Sales Channelin 2022
- Figure 48: Western Europe Microalgae DHA Market Attractiveness Analysis by Sales Channel, 2016-2032
- Figure 49: Western Europe Microalgae DHA Market Revenue (US$ Mn) Market Share by Country in 2022
- Figure 50: Western Europe Microalgae DHA Market Attractiveness Analysis by Country, 2016-2032
- Figure 51: Western Europe Microalgae DHA Market Revenue (US$ Mn) (2016-2032)
- Figure 52: Western Europe Microalgae DHA Market Revenue (US$ Mn) Comparison by Country (2016-2032)
- Figure 53: Western Europe Microalgae DHA Market Revenue (US$ Mn) Comparison by Product Form (2016-2032)
- Figure 54: Western Europe Microalgae DHA Market Revenue (US$ Mn) Comparison by Application (2016-2032)
- Figure 55: Western Europe Microalgae DHA Market Revenue (US$ Mn) Comparison by Sales Channel (2016-2032)
- Figure 56: Western Europe Microalgae DHA Market Y-o-Y Growth Rate Comparison by Country (2016-2032)
- Figure 57: Western Europe Microalgae DHA Market Y-o-Y Growth Rate Comparison by Product Form (2016-2032)
- Figure 58: Western Europe Microalgae DHA Market Y-o-Y Growth Rate Comparison by Application (2016-2032)
- Figure 59: Western Europe Microalgae DHA Market Y-o-Y Growth Rate Comparison by Sales Channel (2016-2032)
- Figure 60: Western Europe Microalgae DHA Market Share Comparison by Country (2016-2032)
- Figure 61: Western Europe Microalgae DHA Market Share Comparison by Product Form (2016-2032)
- Figure 62: Western Europe Microalgae DHA Market Share Comparison by Application (2016-2032)
- Figure 63: Western Europe Microalgae DHA Market Share Comparison by Sales Channel (2016-2032)
- Figure 64: Eastern Europe Microalgae DHA Market Revenue (US$ Mn) Market Share by Product Formin 2022
- Figure 65: Eastern Europe Microalgae DHA Market Attractiveness Analysis by Product Form, 2016-2032
- Figure 66: Eastern Europe Microalgae DHA Market Revenue (US$ Mn) Market Share by Applicationin 2022
- Figure 67: Eastern Europe Microalgae DHA Market Attractiveness Analysis by Application, 2016-2032
- Figure 68: Eastern Europe Microalgae DHA Market Revenue (US$ Mn) Market Share by Sales Channelin 2022
- Figure 69: Eastern Europe Microalgae DHA Market Attractiveness Analysis by Sales Channel, 2016-2032
- Figure 70: Eastern Europe Microalgae DHA Market Revenue (US$ Mn) Market Share by Country in 2022
- Figure 71: Eastern Europe Microalgae DHA Market Attractiveness Analysis by Country, 2016-2032
- Figure 72: Eastern Europe Microalgae DHA Market Revenue (US$ Mn) (2016-2032)
- Figure 73: Eastern Europe Microalgae DHA Market Revenue (US$ Mn) Comparison by Country (2016-2032)
- Figure 74: Eastern Europe Microalgae DHA Market Revenue (US$ Mn) Comparison by Product Form (2016-2032)
- Figure 75: Eastern Europe Microalgae DHA Market Revenue (US$ Mn) Comparison by Application (2016-2032)
- Figure 76: Eastern Europe Microalgae DHA Market Revenue (US$ Mn) Comparison by Sales Channel (2016-2032)
- Figure 77: Eastern Europe Microalgae DHA Market Y-o-Y Growth Rate Comparison by Country (2016-2032)
- Figure 78: Eastern Europe Microalgae DHA Market Y-o-Y Growth Rate Comparison by Product Form (2016-2032)
- Figure 79: Eastern Europe Microalgae DHA Market Y-o-Y Growth Rate Comparison by Application (2016-2032)
- Figure 80: Eastern Europe Microalgae DHA Market Y-o-Y Growth Rate Comparison by Sales Channel (2016-2032)
- Figure 81: Eastern Europe Microalgae DHA Market Share Comparison by Country (2016-2032)
- Figure 82: Eastern Europe Microalgae DHA Market Share Comparison by Product Form (2016-2032)
- Figure 83: Eastern Europe Microalgae DHA Market Share Comparison by Application (2016-2032)
- Figure 84: Eastern Europe Microalgae DHA Market Share Comparison by Sales Channel (2016-2032)
- Figure 85: APAC Microalgae DHA Market Revenue (US$ Mn) Market Share by Product Formin 2022
- Figure 86: APAC Microalgae DHA Market Attractiveness Analysis by Product Form, 2016-2032
- Figure 87: APAC Microalgae DHA Market Revenue (US$ Mn) Market Share by Applicationin 2022
- Figure 88: APAC Microalgae DHA Market Attractiveness Analysis by Application, 2016-2032
- Figure 89: APAC Microalgae DHA Market Revenue (US$ Mn) Market Share by Sales Channelin 2022
- Figure 90: APAC Microalgae DHA Market Attractiveness Analysis by Sales Channel, 2016-2032
- Figure 91: APAC Microalgae DHA Market Revenue (US$ Mn) Market Share by Country in 2022
- Figure 92: APAC Microalgae DHA Market Attractiveness Analysis by Country, 2016-2032
- Figure 93: APAC Microalgae DHA Market Revenue (US$ Mn) (2016-2032)
- Figure 94: APAC Microalgae DHA Market Revenue (US$ Mn) Comparison by Country (2016-2032)
- Figure 95: APAC Microalgae DHA Market Revenue (US$ Mn) Comparison by Product Form (2016-2032)
- Figure 96: APAC Microalgae DHA Market Revenue (US$ Mn) Comparison by Application (2016-2032)
- Figure 97: APAC Microalgae DHA Market Revenue (US$ Mn) Comparison by Sales Channel (2016-2032)
- Figure 98: APAC Microalgae DHA Market Y-o-Y Growth Rate Comparison by Country (2016-2032)
- Figure 99: APAC Microalgae DHA Market Y-o-Y Growth Rate Comparison by Product Form (2016-2032)
- Figure 100: APAC Microalgae DHA Market Y-o-Y Growth Rate Comparison by Application (2016-2032)
- Figure 101: APAC Microalgae DHA Market Y-o-Y Growth Rate Comparison by Sales Channel (2016-2032)
- Figure 102: APAC Microalgae DHA Market Share Comparison by Country (2016-2032)
- Figure 103: APAC Microalgae DHA Market Share Comparison by Product Form (2016-2032)
- Figure 104: APAC Microalgae DHA Market Share Comparison by Application (2016-2032)
- Figure 105: APAC Microalgae DHA Market Share Comparison by Sales Channel (2016-2032)
- Figure 106: Latin America Microalgae DHA Market Revenue (US$ Mn) Market Share by Product Formin 2022
- Figure 107: Latin America Microalgae DHA Market Attractiveness Analysis by Product Form, 2016-2032
- Figure 108: Latin America Microalgae DHA Market Revenue (US$ Mn) Market Share by Applicationin 2022
- Figure 109: Latin America Microalgae DHA Market Attractiveness Analysis by Application, 2016-2032
- Figure 110: Latin America Microalgae DHA Market Revenue (US$ Mn) Market Share by Sales Channelin 2022
- Figure 111: Latin America Microalgae DHA Market Attractiveness Analysis by Sales Channel, 2016-2032
- Figure 112: Latin America Microalgae DHA Market Revenue (US$ Mn) Market Share by Country in 2022
- Figure 113: Latin America Microalgae DHA Market Attractiveness Analysis by Country, 2016-2032
- Figure 114: Latin America Microalgae DHA Market Revenue (US$ Mn) (2016-2032)
- Figure 115: Latin America Microalgae DHA Market Revenue (US$ Mn) Comparison by Country (2016-2032)
- Figure 116: Latin America Microalgae DHA Market Revenue (US$ Mn) Comparison by Product Form (2016-2032)
- Figure 117: Latin America Microalgae DHA Market Revenue (US$ Mn) Comparison by Application (2016-2032)
- Figure 118: Latin America Microalgae DHA Market Revenue (US$ Mn) Comparison by Sales Channel (2016-2032)
- Figure 119: Latin America Microalgae DHA Market Y-o-Y Growth Rate Comparison by Country (2016-2032)
- Figure 120: Latin America Microalgae DHA Market Y-o-Y Growth Rate Comparison by Product Form (2016-2032)
- Figure 121: Latin America Microalgae DHA Market Y-o-Y Growth Rate Comparison by Application (2016-2032)
- Figure 122: Latin America Microalgae DHA Market Y-o-Y Growth Rate Comparison by Sales Channel (2016-2032)
- Figure 123: Latin America Microalgae DHA Market Share Comparison by Country (2016-2032)
- Figure 124: Latin America Microalgae DHA Market Share Comparison by Product Form (2016-2032)
- Figure 125: Latin America Microalgae DHA Market Share Comparison by Application (2016-2032)
- Figure 126: Latin America Microalgae DHA Market Share Comparison by Sales Channel (2016-2032)
- Figure 127: Middle East & Africa Microalgae DHA Market Revenue (US$ Mn) Market Share by Product Formin 2022
- Figure 128: Middle East & Africa Microalgae DHA Market Attractiveness Analysis by Product Form, 2016-2032
- Figure 129: Middle East & Africa Microalgae DHA Market Revenue (US$ Mn) Market Share by Applicationin 2022
- Figure 130: Middle East & Africa Microalgae DHA Market Attractiveness Analysis by Application, 2016-2032
- Figure 131: Middle East & Africa Microalgae DHA Market Revenue (US$ Mn) Market Share by Sales Channelin 2022
- Figure 132: Middle East & Africa Microalgae DHA Market Attractiveness Analysis by Sales Channel, 2016-2032
- Figure 133: Middle East & Africa Microalgae DHA Market Revenue (US$ Mn) Market Share by Country in 2022
- Figure 134: Middle East & Africa Microalgae DHA Market Attractiveness Analysis by Country, 2016-2032
- Figure 135: Middle East & Africa Microalgae DHA Market Revenue (US$ Mn) (2016-2032)
- Figure 136: Middle East & Africa Microalgae DHA Market Revenue (US$ Mn) Comparison by Country (2016-2032)
- Figure 137: Middle East & Africa Microalgae DHA Market Revenue (US$ Mn) Comparison by Product Form (2016-2032)
- Figure 138: Middle East & Africa Microalgae DHA Market Revenue (US$ Mn) Comparison by Application (2016-2032)
- Figure 139: Middle East & Africa Microalgae DHA Market Revenue (US$ Mn) Comparison by Sales Channel (2016-2032)
- Figure 140: Middle East & Africa Microalgae DHA Market Y-o-Y Growth Rate Comparison by Country (2016-2032)
- Figure 141: Middle East & Africa Microalgae DHA Market Y-o-Y Growth Rate Comparison by Product Form (2016-2032)
- Figure 142: Middle East & Africa Microalgae DHA Market Y-o-Y Growth Rate Comparison by Application (2016-2032)
- Figure 143: Middle East & Africa Microalgae DHA Market Y-o-Y Growth Rate Comparison by Sales Channel (2016-2032)
- Figure 144: Middle East & Africa Microalgae DHA Market Share Comparison by Country (2016-2032)
- Figure 145: Middle East & Africa Microalgae DHA Market Share Comparison by Product Form (2016-2032)
- Figure 146: Middle East & Africa Microalgae DHA Market Share Comparison by Application (2016-2032)
- Figure 147: Middle East & Africa Microalgae DHA Market Share Comparison by Sales Channel (2016-2032)
- List of Tables
- Table 1: Global Microalgae DHA Market Comparison by Product Form (2016-2032)
- Table 2: Global Microalgae DHA Market Comparison by Application (2016-2032)
- Table 3: Global Microalgae DHA Market Comparison by Sales Channel (2016-2032)
- Table 4: Global Microalgae DHA Market Revenue (US$ Mn) Comparison by Region (2016-2032)
- Table 5: Global Microalgae DHA Market Revenue (US$ Mn) (2016-2032)
- Table 6: Global Microalgae DHA Market Revenue (US$ Mn) Comparison by Region (2016-2032)
- Table 7: Global Microalgae DHA Market Revenue (US$ Mn) Comparison by Product Form (2016-2032)
- Table 8: Global Microalgae DHA Market Revenue (US$ Mn) Comparison by Application (2016-2032)
- Table 9: Global Microalgae DHA Market Revenue (US$ Mn) Comparison by Sales Channel (2016-2032)
- Table 10: Global Microalgae DHA Market Y-o-Y Growth Rate Comparison by Region (2016-2032)
- Table 11: Global Microalgae DHA Market Y-o-Y Growth Rate Comparison by Product Form (2016-2032)
- Table 12: Global Microalgae DHA Market Y-o-Y Growth Rate Comparison by Application (2016-2032)
- Table 13: Global Microalgae DHA Market Y-o-Y Growth Rate Comparison by Sales Channel (2016-2032)
- Table 14: Global Microalgae DHA Market Share Comparison by Region (2016-2032)
- Table 15: Global Microalgae DHA Market Share Comparison by Product Form (2016-2032)
- Table 16: Global Microalgae DHA Market Share Comparison by Application (2016-2032)
- Table 17: Global Microalgae DHA Market Share Comparison by Sales Channel (2016-2032)
- Table 18: North America Microalgae DHA Market Comparison by Application (2016-2032)
- Table 19: North America Microalgae DHA Market Comparison by Sales Channel (2016-2032)
- Table 20: North America Microalgae DHA Market Revenue (US$ Mn) Comparison by Country (2016-2032)
- Table 21: North America Microalgae DHA Market Revenue (US$ Mn) (2016-2032)
- Table 22: North America Microalgae DHA Market Revenue (US$ Mn) Comparison by Country (2016-2032)
- Table 23: North America Microalgae DHA Market Revenue (US$ Mn) Comparison by Product Form (2016-2032)
- Table 24: North America Microalgae DHA Market Revenue (US$ Mn) Comparison by Application (2016-2032)
- Table 25: North America Microalgae DHA Market Revenue (US$ Mn) Comparison by Sales Channel (2016-2032)
- Table 26: North America Microalgae DHA Market Y-o-Y Growth Rate Comparison by Country (2016-2032)
- Table 27: North America Microalgae DHA Market Y-o-Y Growth Rate Comparison by Product Form (2016-2032)
- Table 28: North America Microalgae DHA Market Y-o-Y Growth Rate Comparison by Application (2016-2032)
- Table 29: North America Microalgae DHA Market Y-o-Y Growth Rate Comparison by Sales Channel (2016-2032)
- Table 30: North America Microalgae DHA Market Share Comparison by Country (2016-2032)
- Table 31: North America Microalgae DHA Market Share Comparison by Product Form (2016-2032)
- Table 32: North America Microalgae DHA Market Share Comparison by Application (2016-2032)
- Table 33: North America Microalgae DHA Market Share Comparison by Sales Channel (2016-2032)
- Table 34: Western Europe Microalgae DHA Market Comparison by Product Form (2016-2032)
- Table 35: Western Europe Microalgae DHA Market Comparison by Application (2016-2032)
- Table 36: Western Europe Microalgae DHA Market Comparison by Sales Channel (2016-2032)
- Table 37: Western Europe Microalgae DHA Market Revenue (US$ Mn) Comparison by Country (2016-2032)
- Table 38: Western Europe Microalgae DHA Market Revenue (US$ Mn) (2016-2032)
- Table 39: Western Europe Microalgae DHA Market Revenue (US$ Mn) Comparison by Country (2016-2032)
- Table 40: Western Europe Microalgae DHA Market Revenue (US$ Mn) Comparison by Product Form (2016-2032)
- Table 41: Western Europe Microalgae DHA Market Revenue (US$ Mn) Comparison by Application (2016-2032)
- Table 42: Western Europe Microalgae DHA Market Revenue (US$ Mn) Comparison by Sales Channel (2016-2032)
- Table 43: Western Europe Microalgae DHA Market Y-o-Y Growth Rate Comparison by Country (2016-2032)
- Table 44: Western Europe Microalgae DHA Market Y-o-Y Growth Rate Comparison by Product Form (2016-2032)
- Table 45: Western Europe Microalgae DHA Market Y-o-Y Growth Rate Comparison by Application (2016-2032)
- Table 46: Western Europe Microalgae DHA Market Y-o-Y Growth Rate Comparison by Sales Channel (2016-2032)
- Table 47: Western Europe Microalgae DHA Market Share Comparison by Country (2016-2032)
- Table 48: Western Europe Microalgae DHA Market Share Comparison by Product Form (2016-2032)
- Table 49: Western Europe Microalgae DHA Market Share Comparison by Application (2016-2032)
- Table 50: Western Europe Microalgae DHA Market Share Comparison by Sales Channel (2016-2032)
- Table 51: Eastern Europe Microalgae DHA Market Comparison by Product Form (2016-2032)
- Table 52: Eastern Europe Microalgae DHA Market Comparison by Application (2016-2032)
- Table 53: Eastern Europe Microalgae DHA Market Comparison by Sales Channel (2016-2032)
- Table 54: Eastern Europe Microalgae DHA Market Revenue (US$ Mn) Comparison by Country (2016-2032)
- Table 55: Eastern Europe Microalgae DHA Market Revenue (US$ Mn) (2016-2032)
- Table 56: Eastern Europe Microalgae DHA Market Revenue (US$ Mn) Comparison by Country (2016-2032)
- Table 57: Eastern Europe Microalgae DHA Market Revenue (US$ Mn) Comparison by Product Form (2016-2032)
- Table 58: Eastern Europe Microalgae DHA Market Revenue (US$ Mn) Comparison by Application (2016-2032)
- Table 59: Eastern Europe Microalgae DHA Market Revenue (US$ Mn) Comparison by Sales Channel (2016-2032)
- Table 60: Eastern Europe Microalgae DHA Market Y-o-Y Growth Rate Comparison by Country (2016-2032)
- Table 61: Eastern Europe Microalgae DHA Market Y-o-Y Growth Rate Comparison by Product Form (2016-2032)
- Table 62: Eastern Europe Microalgae DHA Market Y-o-Y Growth Rate Comparison by Application (2016-2032)
- Table 63: Eastern Europe Microalgae DHA Market Y-o-Y Growth Rate Comparison by Sales Channel (2016-2032)
- Table 64: Eastern Europe Microalgae DHA Market Share Comparison by Country (2016-2032)
- Table 65: Eastern Europe Microalgae DHA Market Share Comparison by Product Form (2016-2032)
- Table 66: Eastern Europe Microalgae DHA Market Share Comparison by Application (2016-2032)
- Table 67: Eastern Europe Microalgae DHA Market Share Comparison by Sales Channel (2016-2032)
- Table 68: APAC Microalgae DHA Market Comparison by Product Form (2016-2032)
- Table 69: APAC Microalgae DHA Market Comparison by Application (2016-2032)
- Table 70: APAC Microalgae DHA Market Comparison by Sales Channel (2016-2032)
- Table 71: APAC Microalgae DHA Market Revenue (US$ Mn) Comparison by Country (2016-2032)
- Table 72: APAC Microalgae DHA Market Revenue (US$ Mn) (2016-2032)
- Table 73: APAC Microalgae DHA Market Revenue (US$ Mn) Comparison by Country (2016-2032)
- Table 74: APAC Microalgae DHA Market Revenue (US$ Mn) Comparison by Product Form (2016-2032)
- Table 75: APAC Microalgae DHA Market Revenue (US$ Mn) Comparison by Application (2016-2032)
- Table 76: APAC Microalgae DHA Market Revenue (US$ Mn) Comparison by Sales Channel (2016-2032)
- Table 77: APAC Microalgae DHA Market Y-o-Y Growth Rate Comparison by Country (2016-2032)
- Table 78: APAC Microalgae DHA Market Y-o-Y Growth Rate Comparison by Product Form (2016-2032)
- Table 79: APAC Microalgae DHA Market Y-o-Y Growth Rate Comparison by Application (2016-2032)
- Table 80: APAC Microalgae DHA Market Y-o-Y Growth Rate Comparison by Sales Channel (2016-2032)
- Table 81: APAC Microalgae DHA Market Share Comparison by Country (2016-2032)
- Table 82: APAC Microalgae DHA Market Share Comparison by Product Form (2016-2032)
- Table 83: APAC Microalgae DHA Market Share Comparison by Application (2016-2032)
- Table 84: APAC Microalgae DHA Market Share Comparison by Sales Channel (2016-2032)
- Table 85: Latin America Microalgae DHA Market Comparison by Product Form (2016-2032)
- Table 86: Latin America Microalgae DHA Market Comparison by Application (2016-2032)
- Table 87: Latin America Microalgae DHA Market Comparison by Sales Channel (2016-2032)
- Table 88: Latin America Microalgae DHA Market Revenue (US$ Mn) Comparison by Country (2016-2032)
- Table 89: Latin America Microalgae DHA Market Revenue (US$ Mn) (2016-2032)
- Table 90: Latin America Microalgae DHA Market Revenue (US$ Mn) Comparison by Country (2016-2032)
- Table 91: Latin America Microalgae DHA Market Revenue (US$ Mn) Comparison by Product Form (2016-2032)
- Table 92: Latin America Microalgae DHA Market Revenue (US$ Mn) Comparison by Application (2016-2032)
- Table 93: Latin America Microalgae DHA Market Revenue (US$ Mn) Comparison by Sales Channel (2016-2032)
- Table 94: Latin America Microalgae DHA Market Y-o-Y Growth Rate Comparison by Country (2016-2032)
- Table 95: Latin America Microalgae DHA Market Y-o-Y Growth Rate Comparison by Product Form (2016-2032)
- Table 96: Latin America Microalgae DHA Market Y-o-Y Growth Rate Comparison by Application (2016-2032)
- Table 97: Latin America Microalgae DHA Market Y-o-Y Growth Rate Comparison by Sales Channel (2016-2032)
- Table 98: Latin America Microalgae DHA Market Share Comparison by Country (2016-2032)
- Table 99: Latin America Microalgae DHA Market Share Comparison by Product Form (2016-2032)
- Table 100: Latin America Microalgae DHA Market Share Comparison by Application (2016-2032)
- Table 101: Latin America Microalgae DHA Market Share Comparison by Sales Channel (2016-2032)
- Table 102: Middle East & Africa Microalgae DHA Market Comparison by Product Form (2016-2032)
- Table 103: Middle East & Africa Microalgae DHA Market Comparison by Application (2016-2032)
- Table 104: Middle East & Africa Microalgae DHA Market Comparison by Sales Channel (2016-2032)
- Table 105: Middle East & Africa Microalgae DHA Market Revenue (US$ Mn) Comparison by Country (2016-2032)
- Table 106: Middle East & Africa Microalgae DHA Market Revenue (US$ Mn) (2016-2032)
- Table 107: Middle East & Africa Microalgae DHA Market Revenue (US$ Mn) Comparison by Country (2016-2032)
- Table 108: Middle East & Africa Microalgae DHA Market Revenue (US$ Mn) Comparison by Product Form (2016-2032)
- Table 109: Middle East & Africa Microalgae DHA Market Revenue (US$ Mn) Comparison by Application (2016-2032)
- Table 110: Middle East & Africa Microalgae DHA Market Revenue (US$ Mn) Comparison by Sales Channel (2016-2032)
- Table 111: Middle East & Africa Microalgae DHA Market Y-o-Y Growth Rate Comparison by Country (2016-2032)
- Table 112: Middle East & Africa Microalgae DHA Market Y-o-Y Growth Rate Comparison by Product Form (2016-2032)
- Table 113: Middle East & Africa Microalgae DHA Market Y-o-Y Growth Rate Comparison by Application (2016-2032)
- Table 114: Middle East & Africa Microalgae DHA Market Y-o-Y Growth Rate Comparison by Sales Channel (2016-2032)
- Table 115: Middle East & Africa Microalgae DHA Market Share Comparison by Country (2016-2032)
- Table 116: Middle East & Africa Microalgae DHA Market Share Comparison by Product Form (2016-2032)
- Table 117: Middle East & Africa Microalgae DHA Market Share Comparison by Application (2016-2032)
- Table 118: Middle East & Africa Microalgae DHA Market Share Comparison by Sales Channel (2016-2032)
- 1. Executive Summary
-
- Source Omega LLC
- Goerlich Pharma GmbH
- Deva Nutrition LLC
- InovoBiologic Inc.
- Xiamen Huison Biotech Co., Ltd
- Cellana Inc.
- Nordic Naturals, Inc.
- Shandong Yuexiang Biotechnology Co., Ltd.
- Hubei Ruiren Biotechnology Co., Ltd.
- Archer Daniels Midland Company
- KD Pharma Group
- Wuhan Bioco Sci. & Tech
- KD Nutra's
- Kangcare Bioindustry Co., Ltd.
Our Clients


View Our Licence Options
